


Características


¿Tienes alguna pregunta?
Recomendar


6 diapositivas
Innovation Process Infographic
The innovation process refers to the systematic and structured approach that organizations follow to generate, develop, and implement new ideas, products, services, or processes to create value and drive growth. This infographic template visually illustrates the steps involved in the innovation process, from idea generation to implementation. The infographic includes several stages, each with its own set of activities and objectives. The template visuals to simplify complex concepts and guide viewers through the journey of innovation. This is compatible with Powerpoint, Keynote, and Google Slides.


4 diapositivas
Remote Team Management Slides Presentation
Bring virtual teamwork into focus with a clean, collaborative design that makes managing distributed teams feel effortless. This presentation breaks down communication, coordination, and workflow strategies to help leaders guide remote groups with clarity and structure. Fully customizable and compatible with PowerPoint, Keynote, and Google Slides.


4 diapositivas
Funding and Investment Project Proposal Presentation
Unlock the potential of your next big venture with this vibrant and organized infographic presentation template! Perfect for outlining key stages from research to returns, this template makes complex investment strategies accessible and engaging. Tailor each segment to fit your project's unique needs. Compatible with PowerPoint, Keynote, and Google Slides, it's ideal for professionals looking to impress stakeholders and secure funding.


26 diapositivas
Creative Cryptocurrency Investment Presentation
The growth of Cryptocurrency has been significant over the past few years. It is very important to do your own research, understand the risks involved, and only invest what you can afford to lose. This template is designed with a focus on cryptocurrencies and includes customizable photo layouts, charts, a gold coin pattern and unique cryptocurrency-themed icons and illustrations. You can use this template for any topic related to Cryptocurrency or Blockchain. Create your own presentation within minutes using Powerpoint, Keynote, or Google slides, it is fully editable to suit your needs.


23 diapositivas
Bracken Small Business Pitch Deck Presentation
This clean and professional presentation template is perfect for showcasing your business ideas, market opportunities, and growth strategies. It includes essential sections such as company background, SWOT analysis, financial performance, marketing plan, and revenue models. Key highlights like competitive advantages, investment opportunities, and milestones ensure a comprehensive and organized pitch to captivate investors and stakeholders. Fully customizable and compatible with PowerPoint, Keynote, and Google Slides.


6 diapositivas
Funnel Stages Infographic
In marketing and sales, the term "funnel stages" refers to the different stages or steps that a potential customer goes through in their journey from initial awareness of a product or service to making a purchase decision. These infographics visualize and help you understand the customer's progression through these stages. They aim to help businesses and professionals understand the customer journey and optimize their strategies for each stage of the funnel. Whether used in sales presentations, marketing workshops, or educational materials, this template helps businesses build successful sale funnels and maximize their revenue potential.


5 diapositivas
Digital Marketing Plan Presentation
Build momentum for your online strategy with a clean, structured layout that turns complex ideas into clear, stackable steps. This presentation helps outline goals, channels, and campaign actions in a visual flow that’s easy to follow and adapt. Fully customizable for PowerPoint, Keynote, and Google Slides.


5 diapositivas
Types of Photography Infographics
There are various types of photography that cater to different subjects, styles, and purposes. These vertical infographics are designed to serve as a comprehensive guide for individuals interested in exploring different genres and styles of photography. These will allow you to provide an overview of different genres and types of photography. They aim to inform viewers about the diverse fields of photography, allowing them to explore various styles and find their areas of interest. Whether used in photography workshops, educational materials, or creative presentations, this template provides valuable insights and inspiration for individuals passionate about the art of photography.


5 diapositivas
Editable RACI Chart Presentation
Streamline your team’s responsibilities with this clean and easy-to-use RACI chart template! Perfect for project managers, this presentation helps define who is Responsible, Accountable, Consulted, and Informed for each task. Simplify workflows, boost collaboration, and keep everyone aligned. Fully editable and compatible with PowerPoint, Keynote, and Google Slides for seamless customization.


5 diapositivas
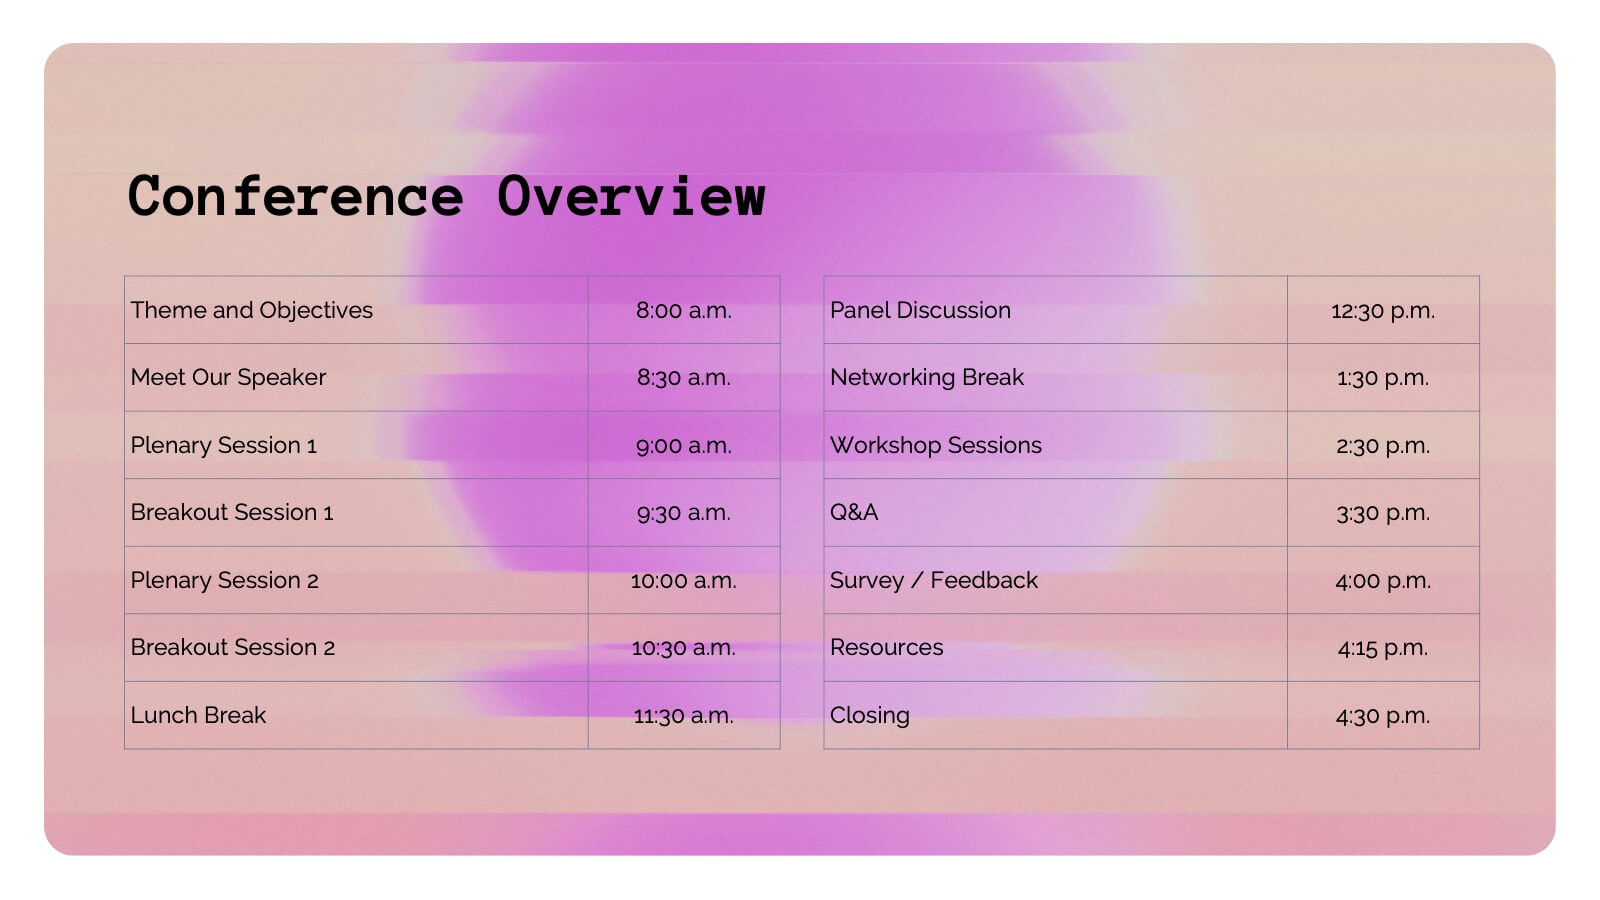
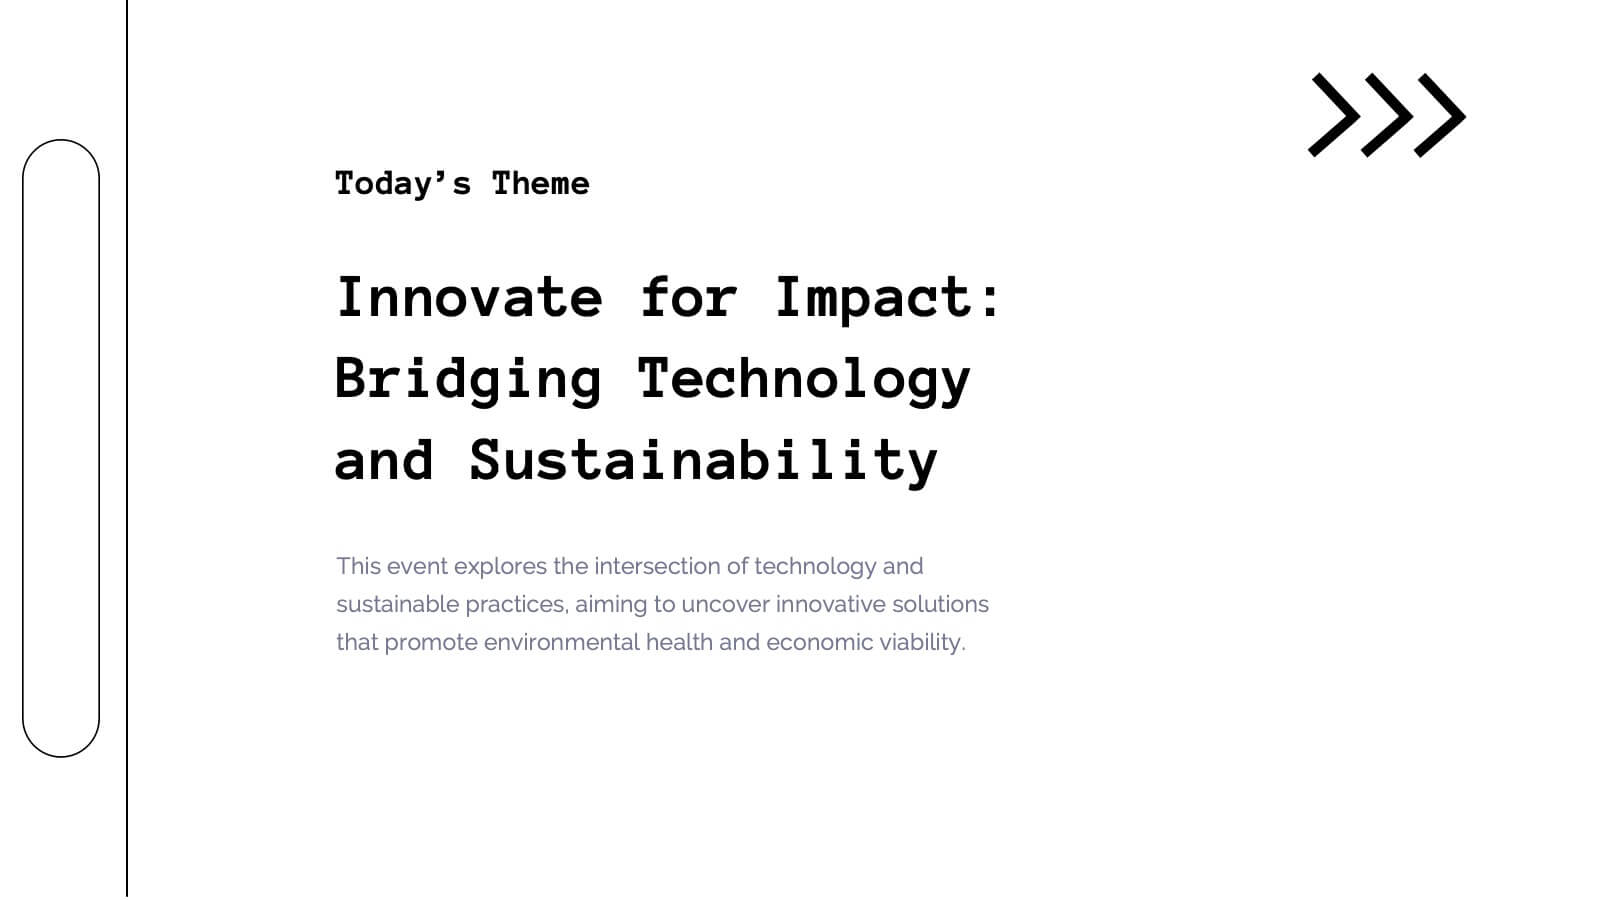
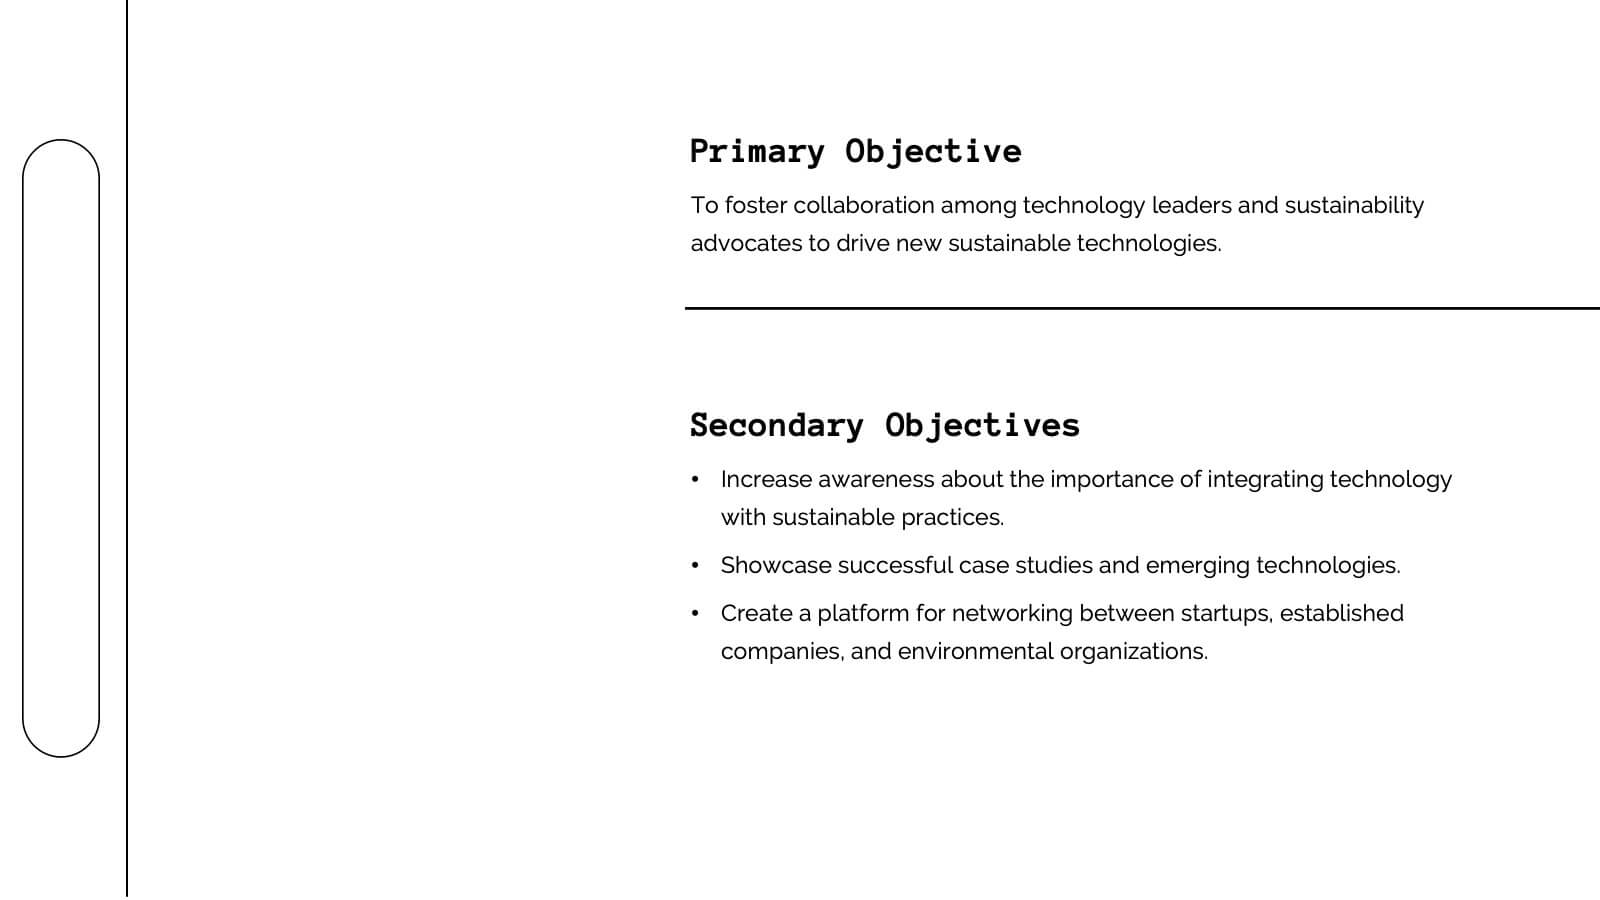
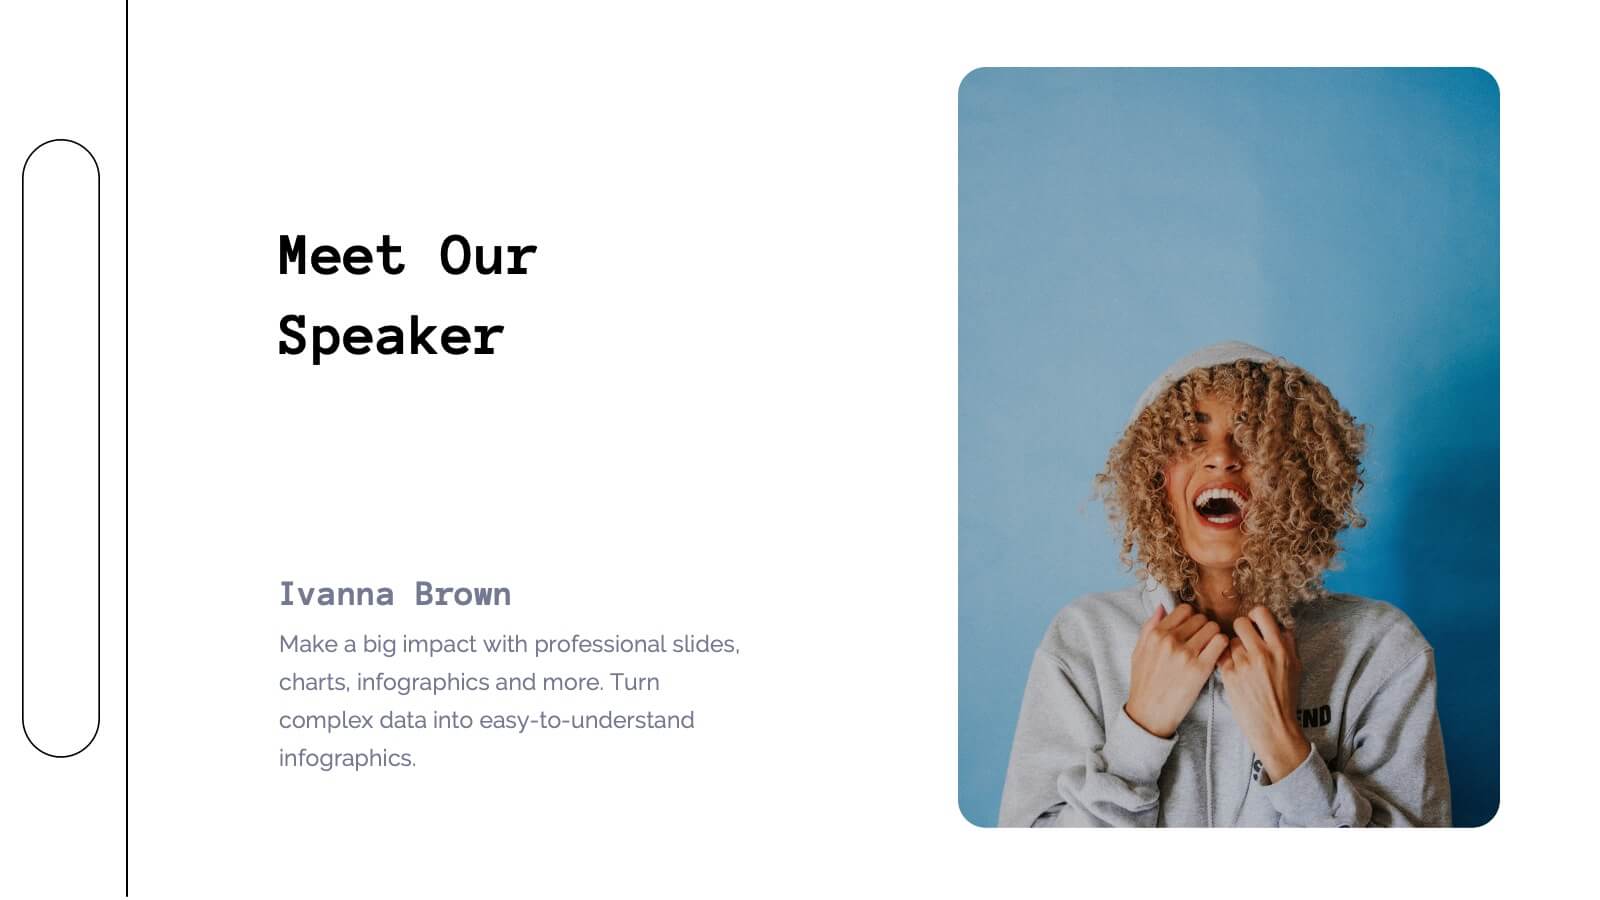
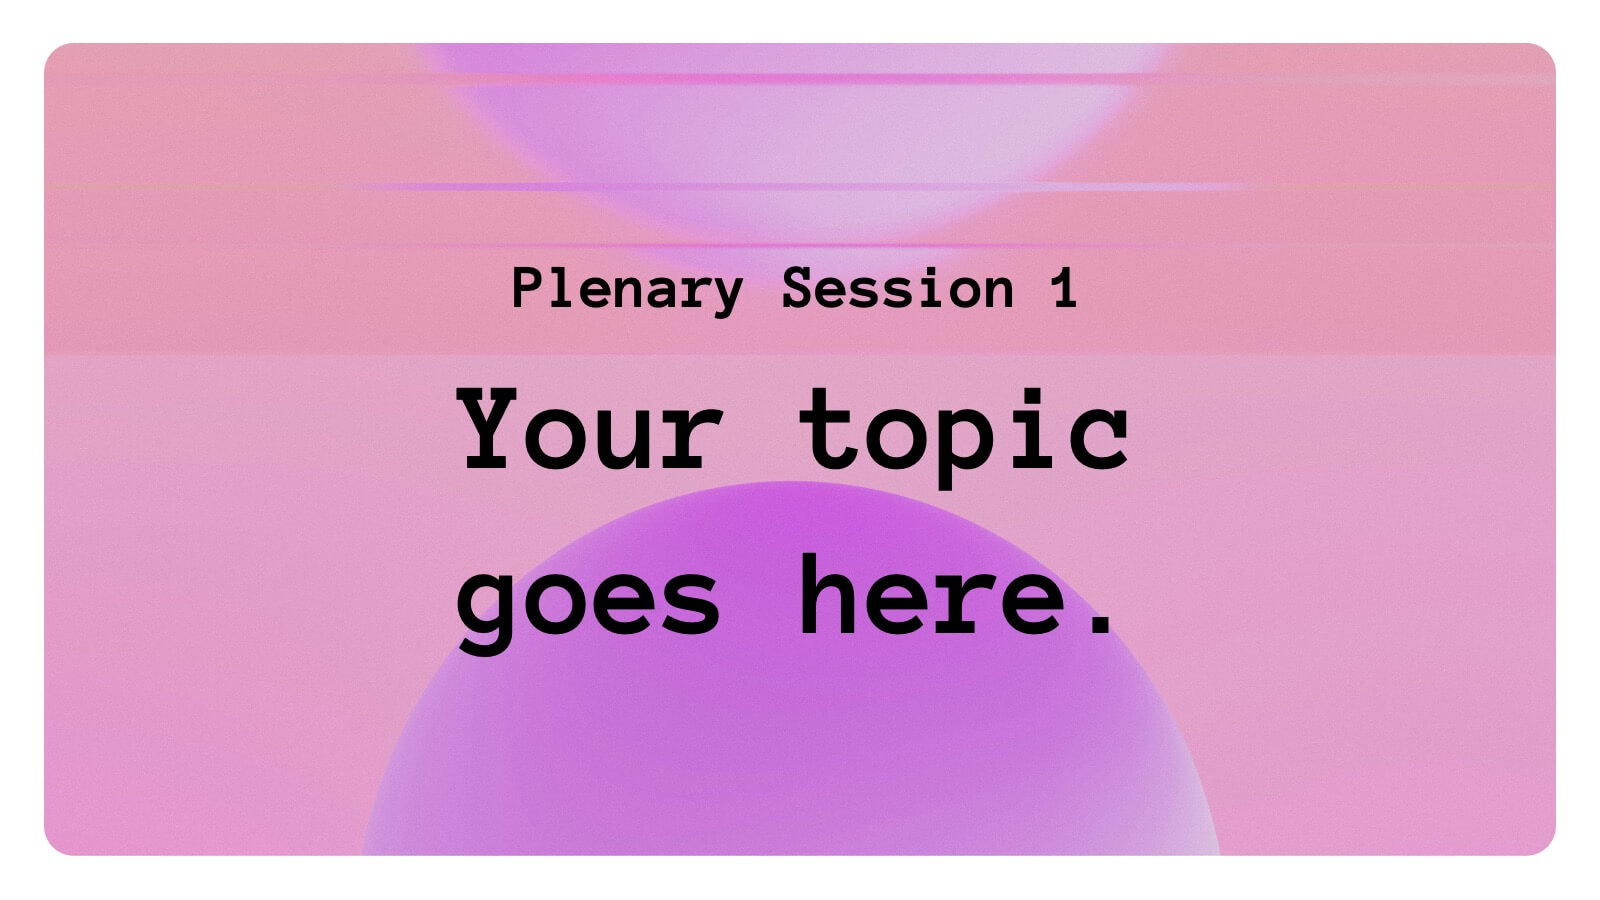
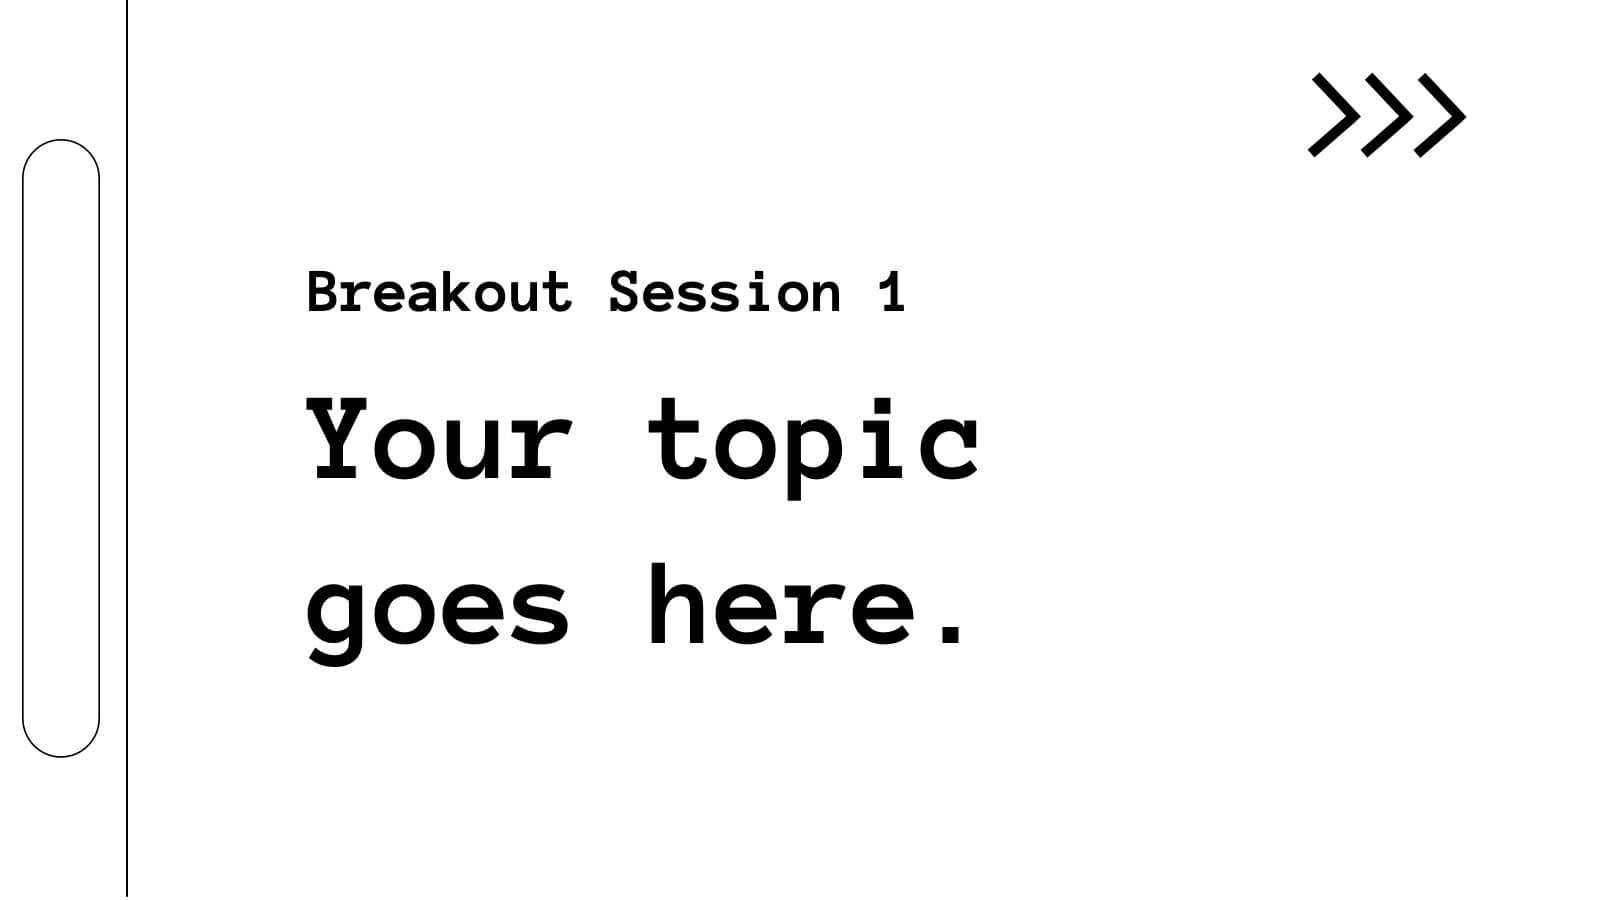
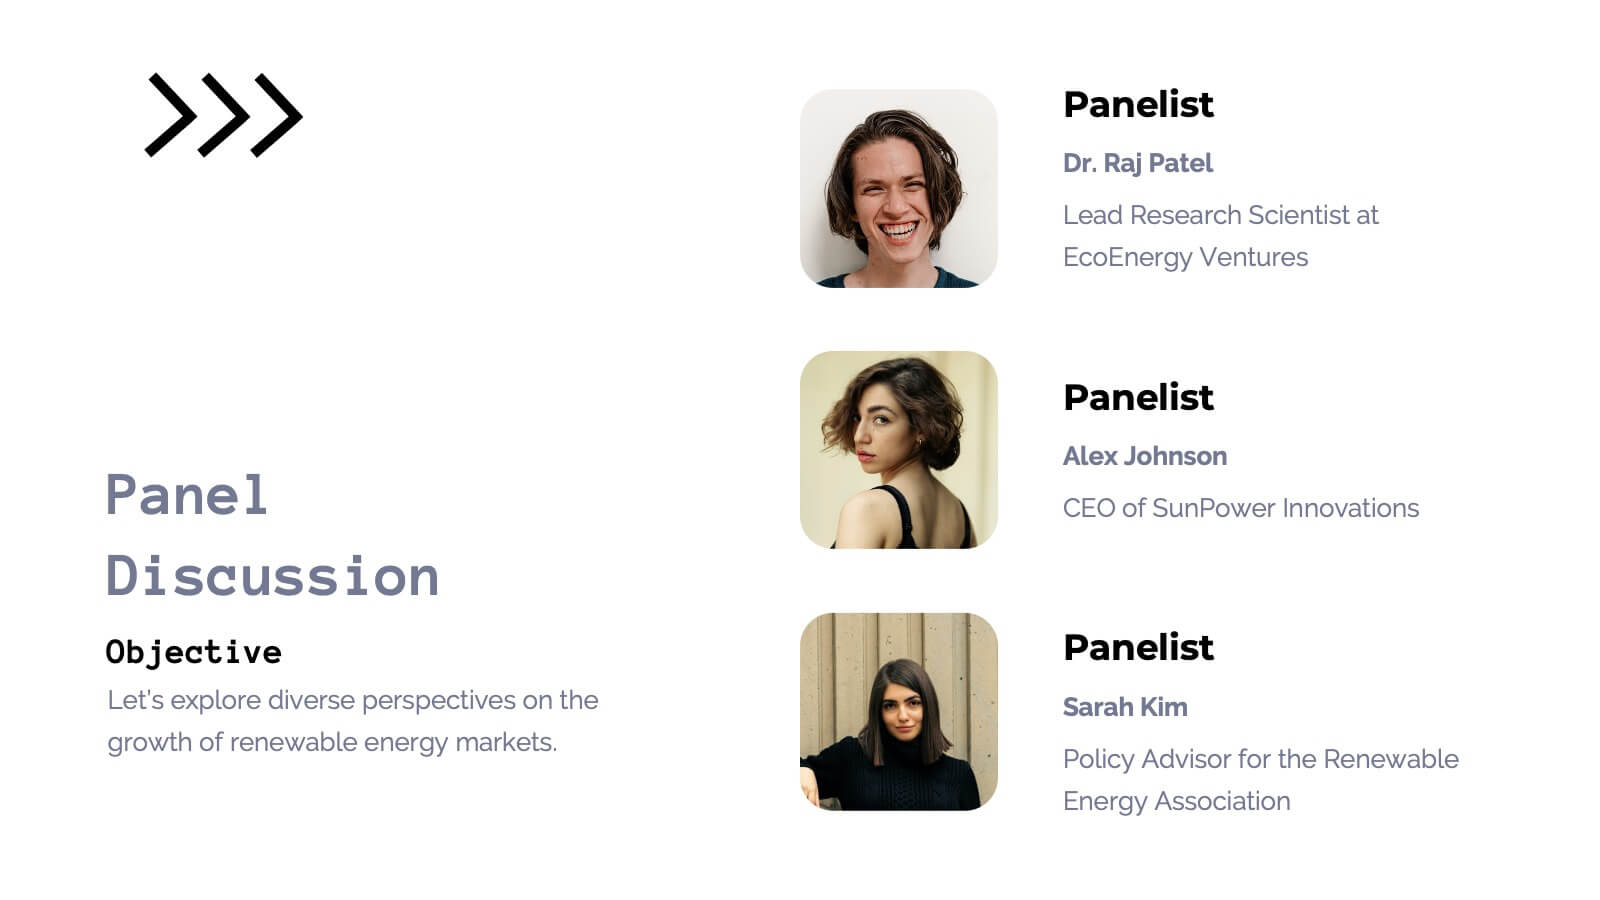
Conference Agenda Slide Presentation
Keep your sessions structured and engaging with the Conference Agenda Slide Presentation. Designed with a visual screen-style format, it showcases a 4-part schedule using color-coded blocks for clarity. Perfect for corporate events, speaker lineups, or workshops. Fully editable in PowerPoint, Keynote, and Google Slides.


7 diapositivas
Thank You Infographic
Express your gratitude in style with this beautifully designed template, perfect for adding a touch of elegance and personalization to your messages of appreciation. Featuring a range of versatile layouts—from minimalist designs to vibrant color schemes and eye-catching typography—each slide offers a unique way to say thank you, whether it’s to clients, team members, or partners. Customize the visuals to align with your brand or personal style by integrating your own photos, logos, and text, making each expression of gratitude uniquely yours. Ideal for corporate settings, personal use, or charitable events, this template helps you create memorable, heartfelt thanks that resonate deeply with recipients, and is perfect for use in presentations, emails, or as special tokens of appreciation to leave a lasting impression.


23 diapositivas
Pomona Business Plan Presentation
This vibrant and adaptable event agenda template is perfect for organizing your business conference or corporate event. It includes customizable sections for session details, speaker information, and key activities like networking breaks, workshops, and panel discussions. Compatible with PowerPoint, Keynote, and Google Slides, it ensures a smooth and engaging event presentation experience!


6 diapositivas
Organized Table of Content Layout Presentation
Introduce your presentation with structure and flow using this Organized Table of Content Layout. With six clearly numbered sections, connected through a dynamic flowchart design, this slide helps guide your audience through your key topics. Each section includes a title and space for a short description. This layout is ideal for reports, proposals, workshops, or strategy decks. Fully editable in PowerPoint, Keynote, and Google Slides.


4 diapositivas
Operating Expenses and Cost Allocation Presentation
Clearly outline key financial movements with the Operating Expenses and Cost Allocation Presentation. This slide uses a step-arrow layout to show the relationship between spending and allocation, making it ideal for budgeting updates, operational analysis, or finance planning. Fully editable in PowerPoint, Keynote, Google Slides, and Canva for seamless customization.


5 diapositivas
Technology Innovation Infographics
Technology innovation refers to the process of creating and introducing new or improved technologies that have the potential to bring about significant advancements in various industries and sectors. These vertical infographics explores the world of technology innovation and its impact on various industries. These templates are designed to showcase the latest advancements, emerging trends, and transformative technologies that are shaping our digital landscape. These enable you to showcase the transformative power of technology and inspire your audience to embrace the opportunities it presents.


6 diapositivas
DMAIC Six Sigma Framework Presentation
Dive into process perfection with our DMAIC Six Sigma Framework template! This visually appealing guide breaks down each phase—Define, Measure, Analyze, Improve, and Control—making it easier to streamline operations and enhance quality. Fully compatible with PowerPoint, Keynote, and Google Slides, it's designed for professionals dedicated to operational excellence and continuous improvement.


21 diapositivas
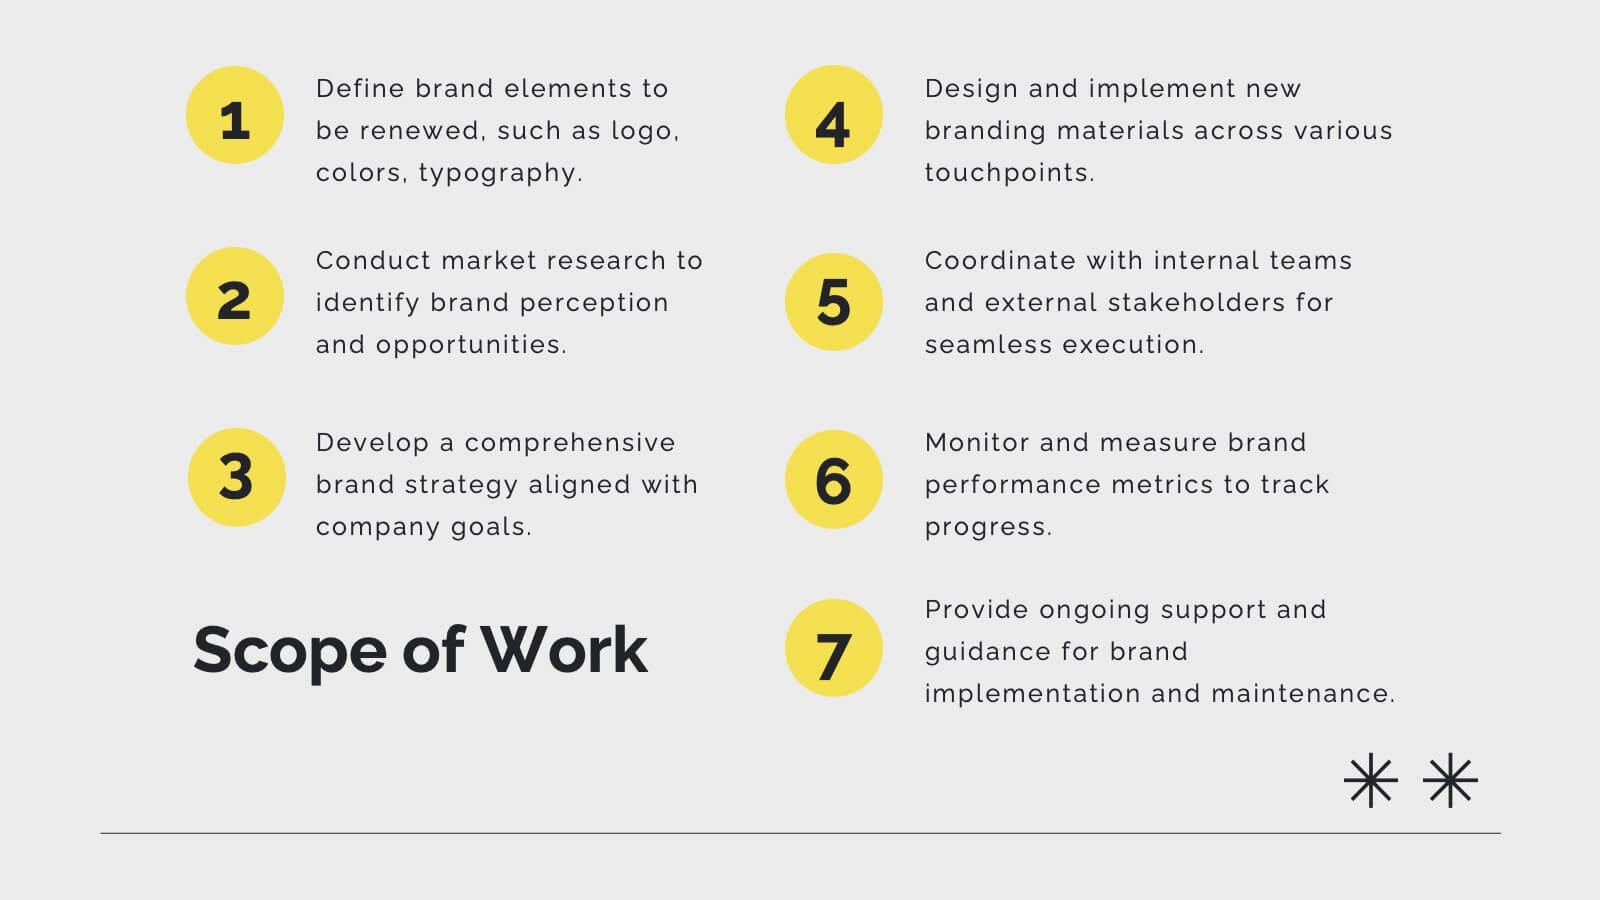
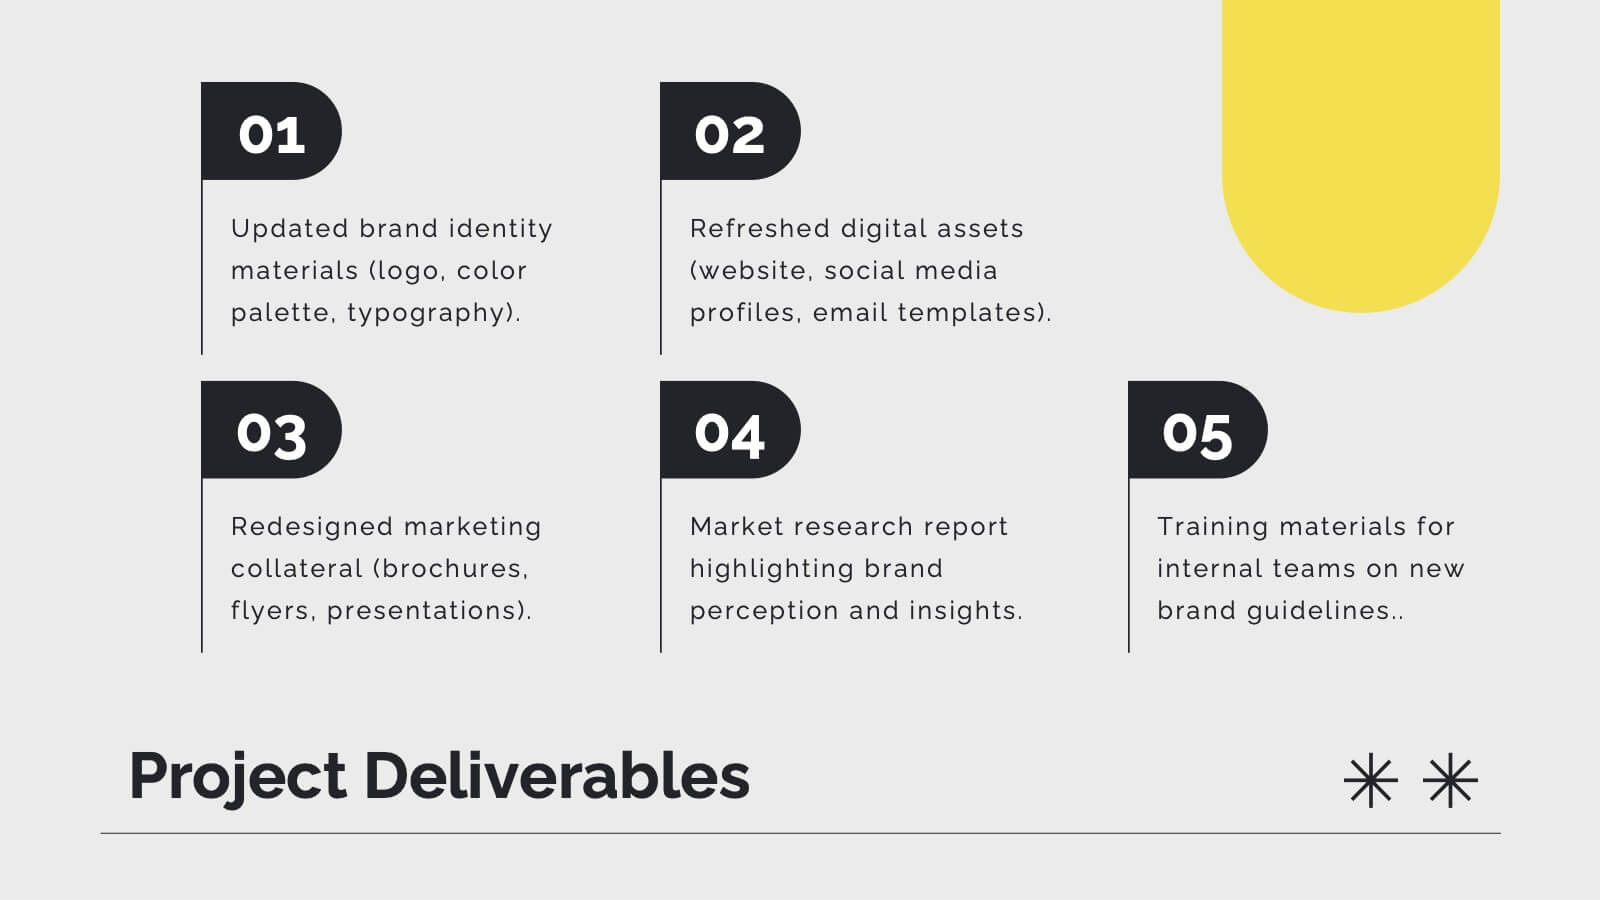
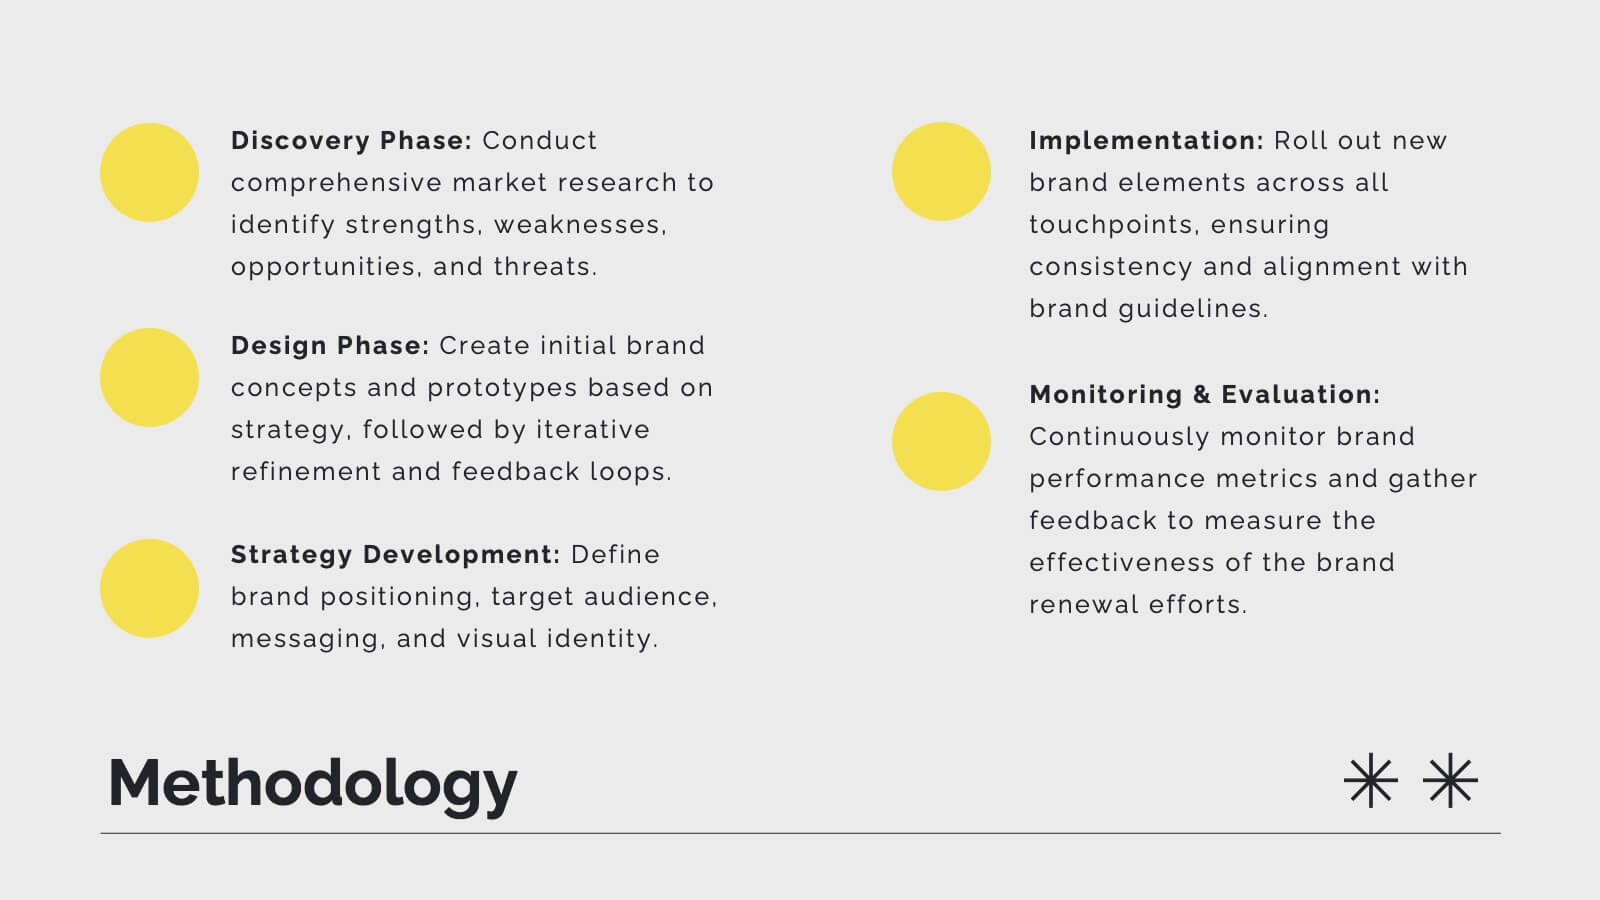
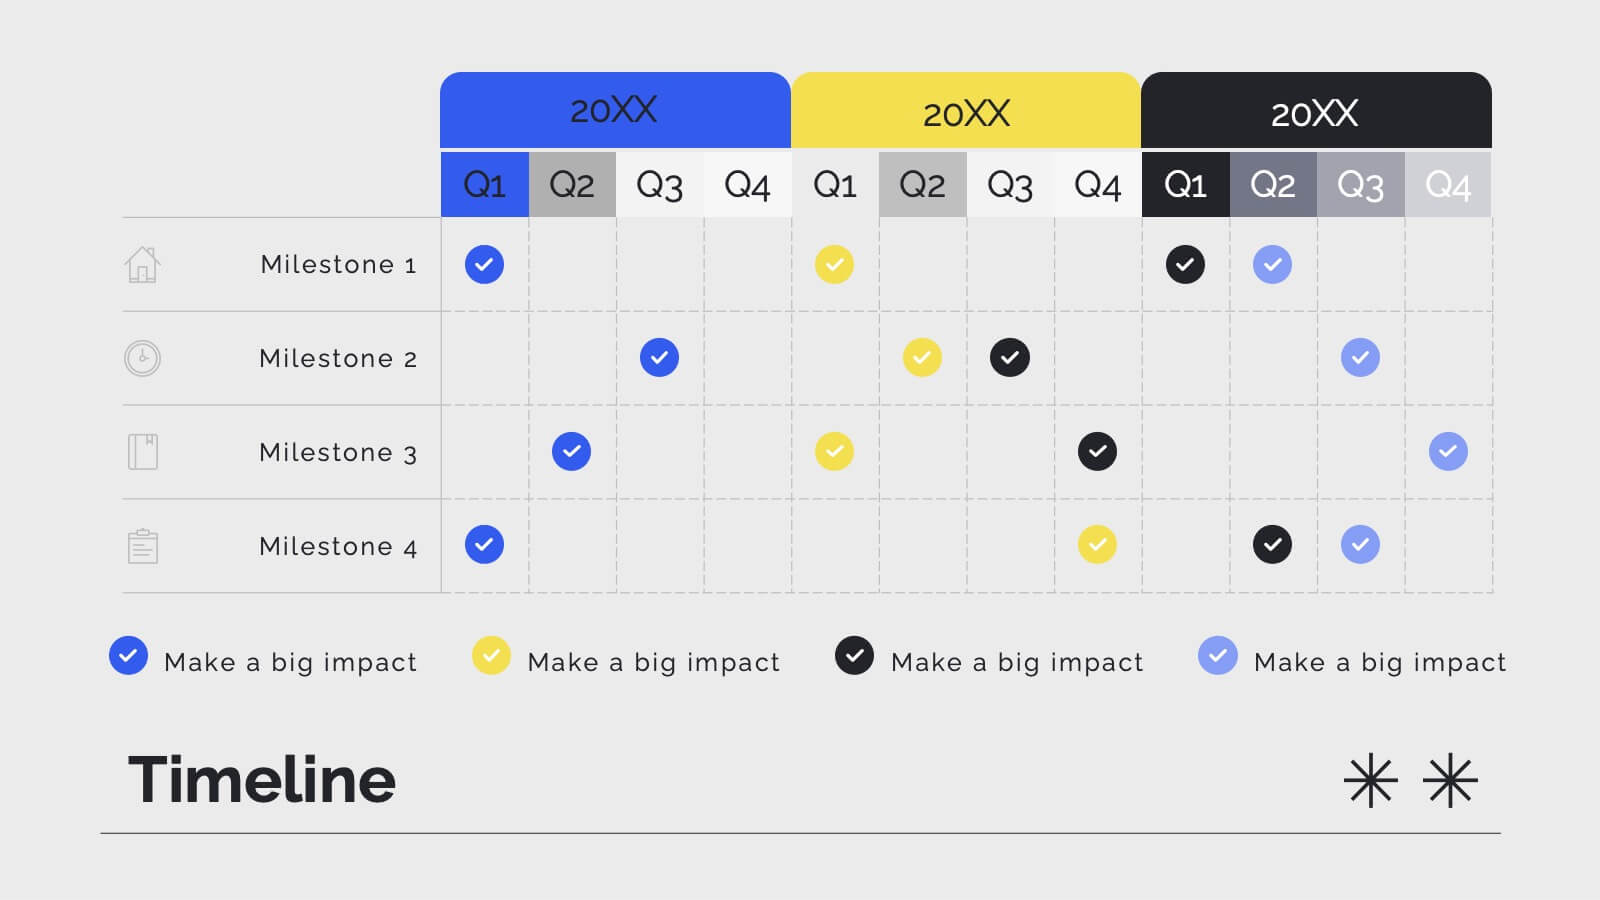
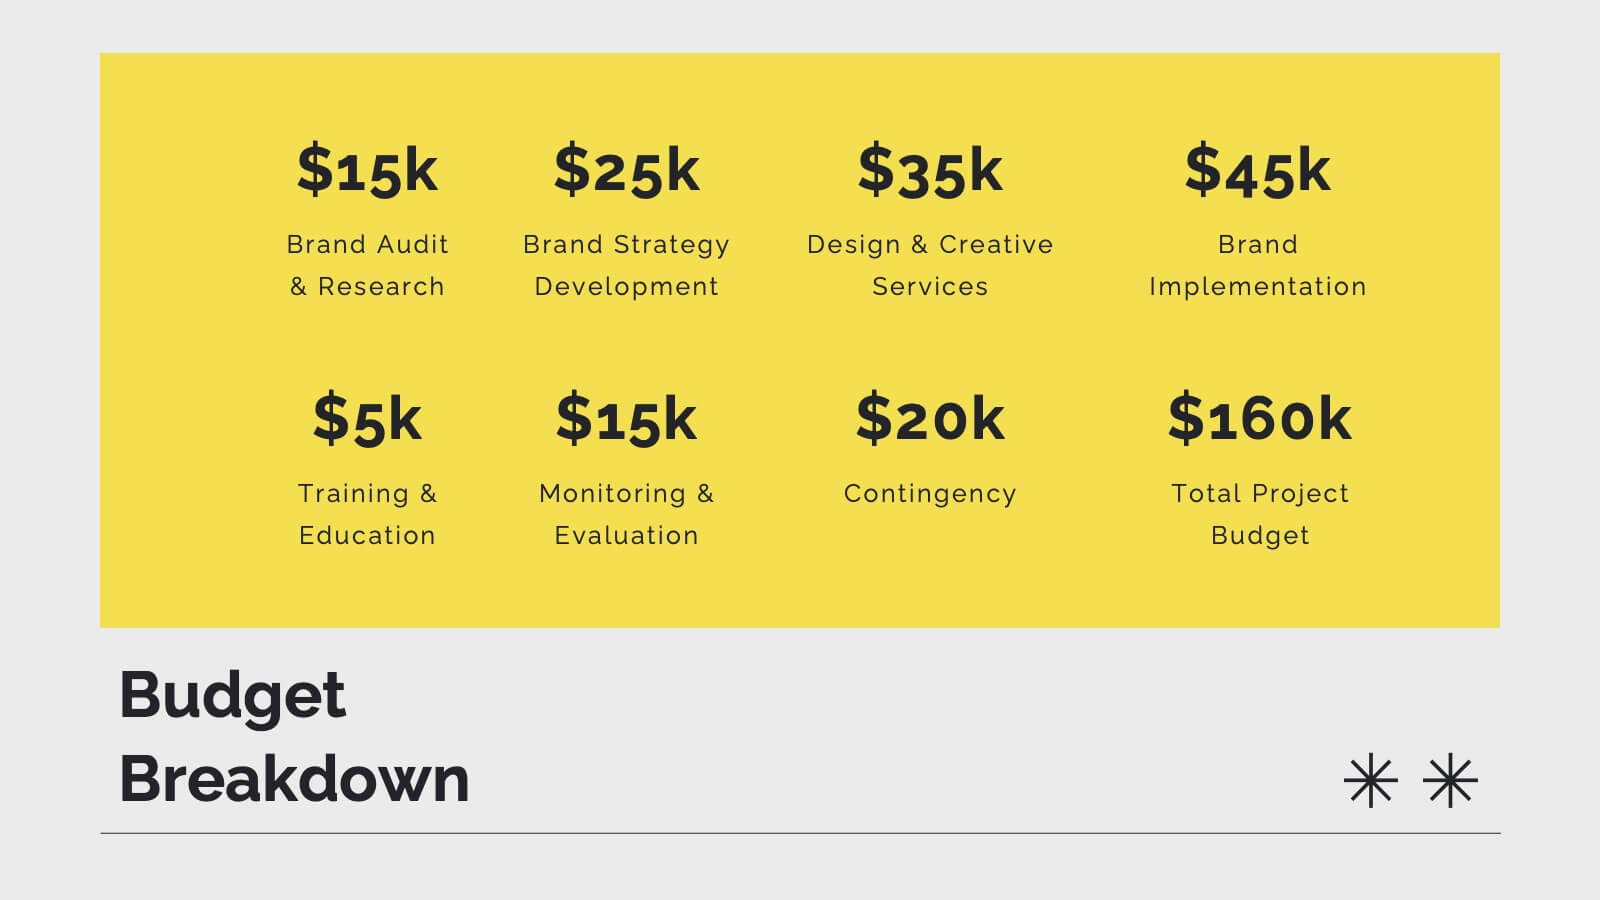
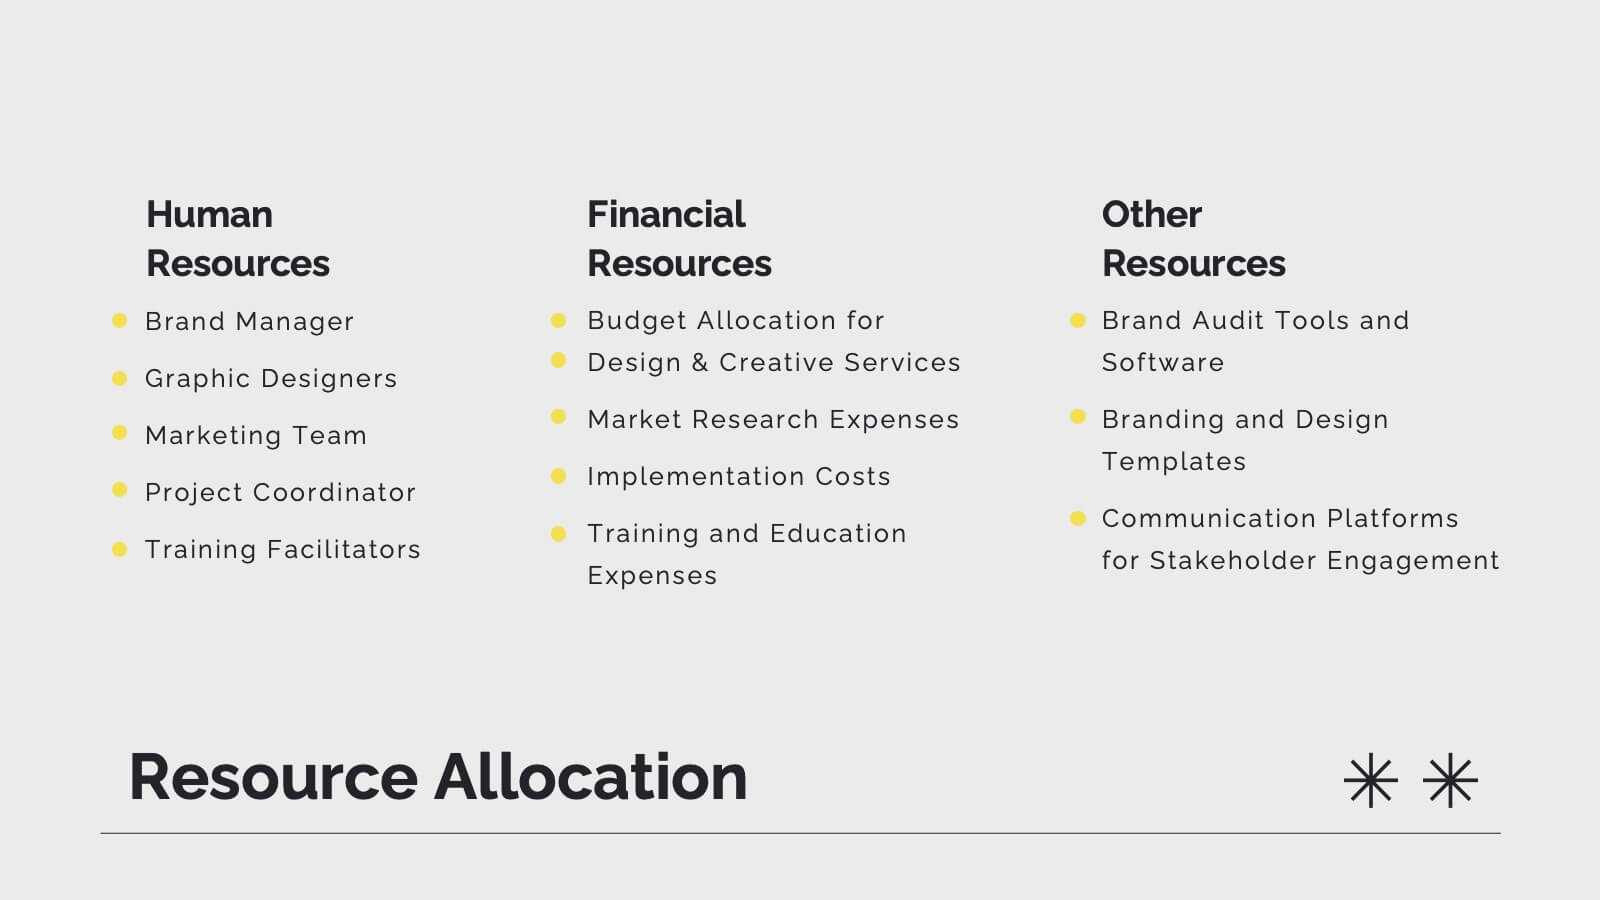
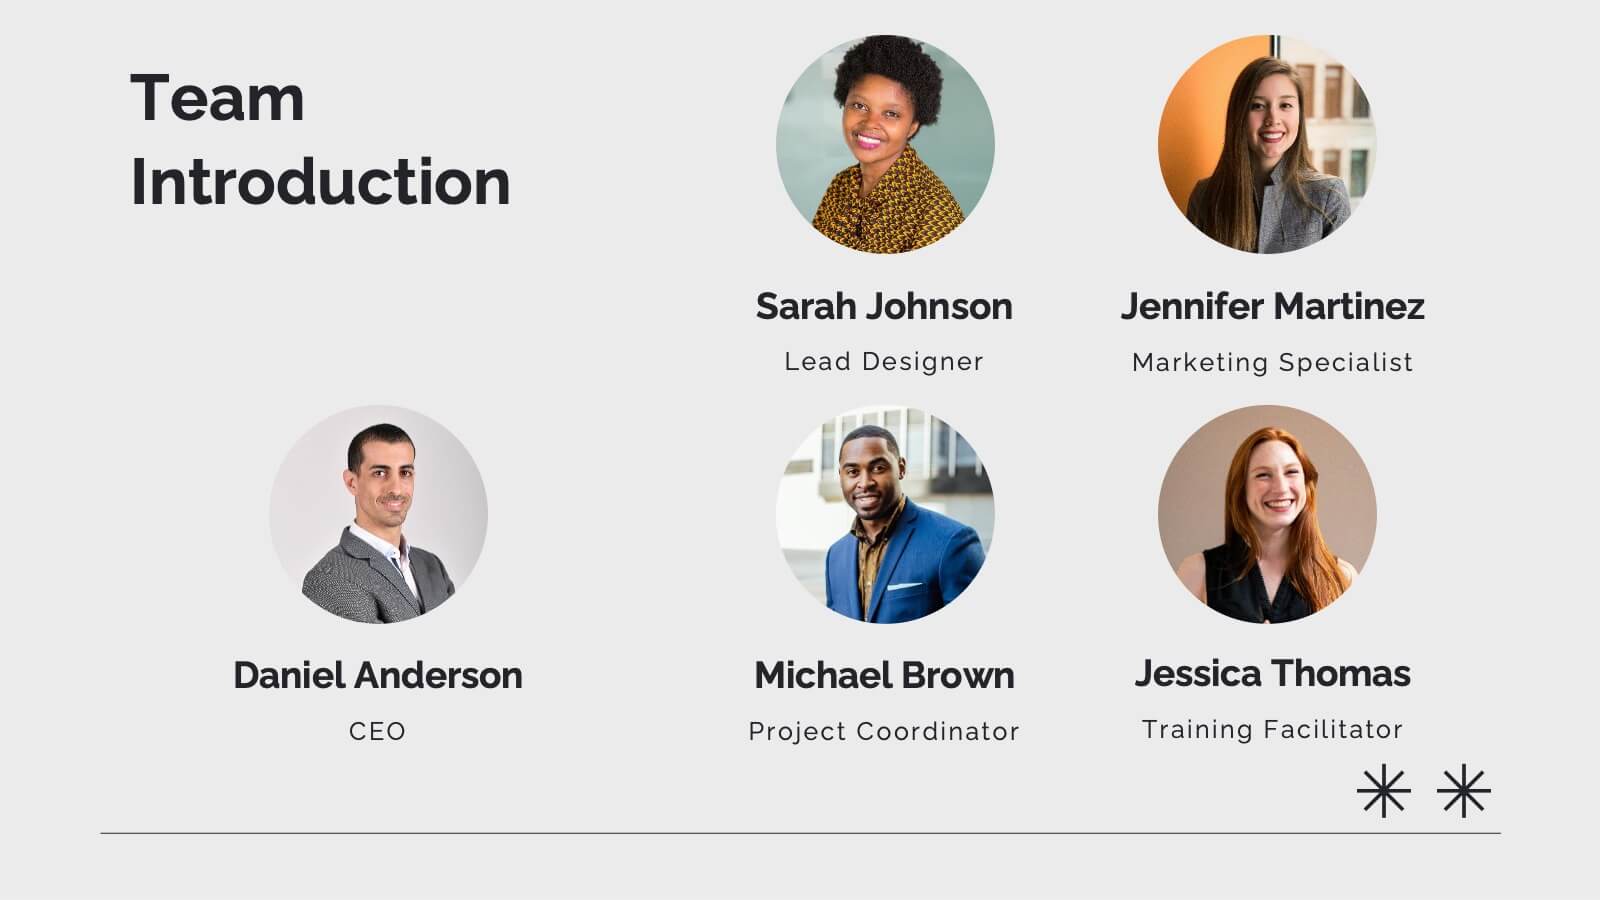
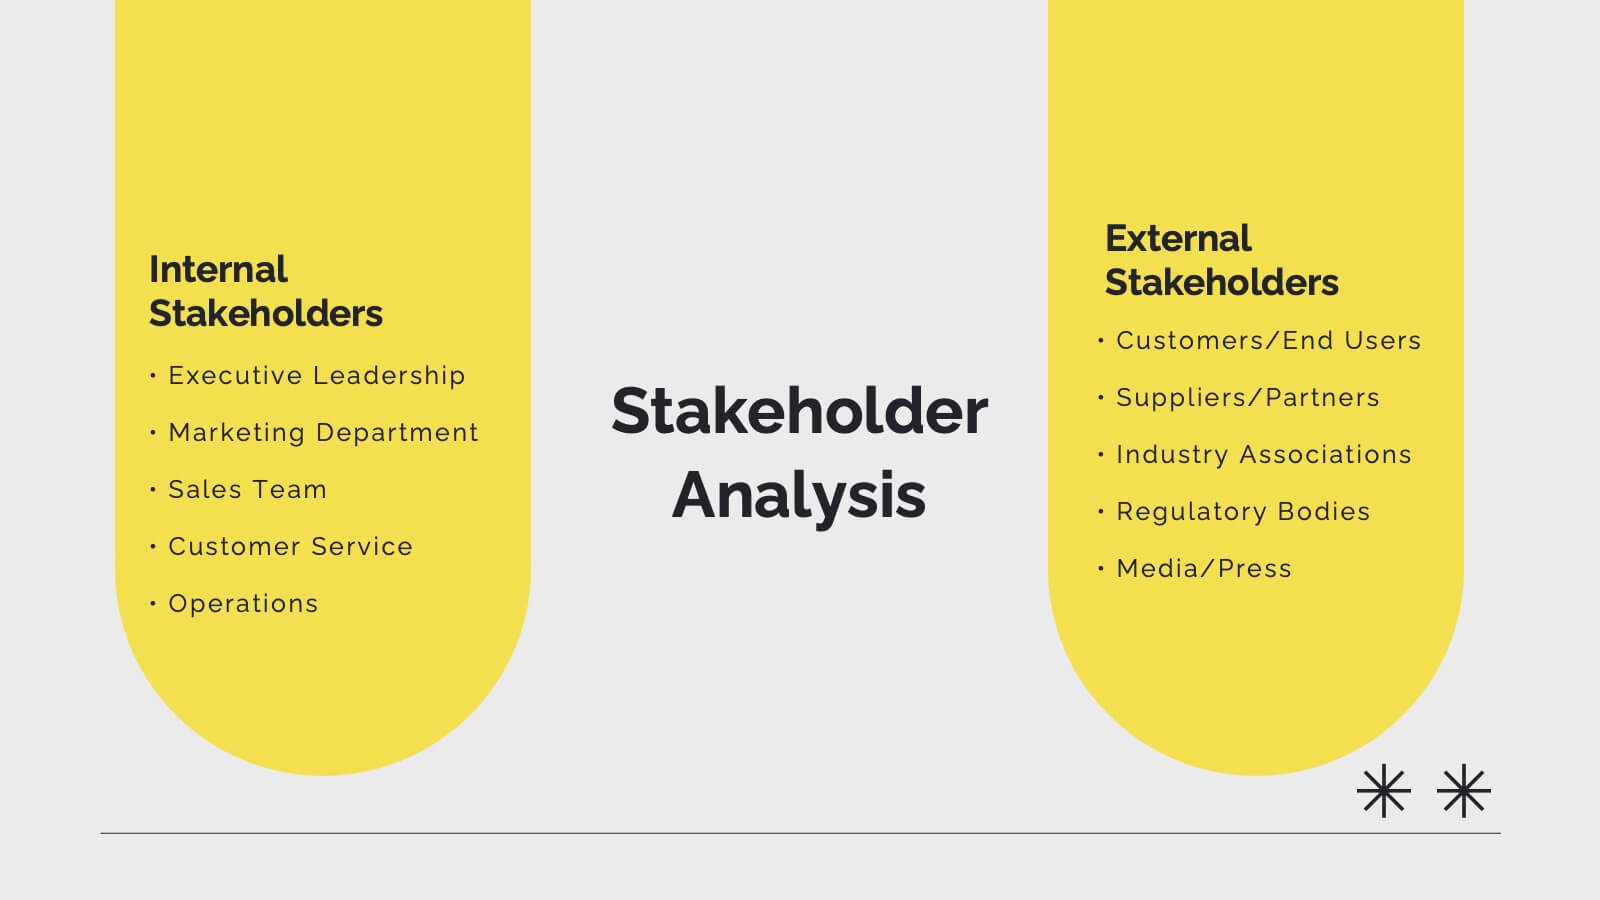
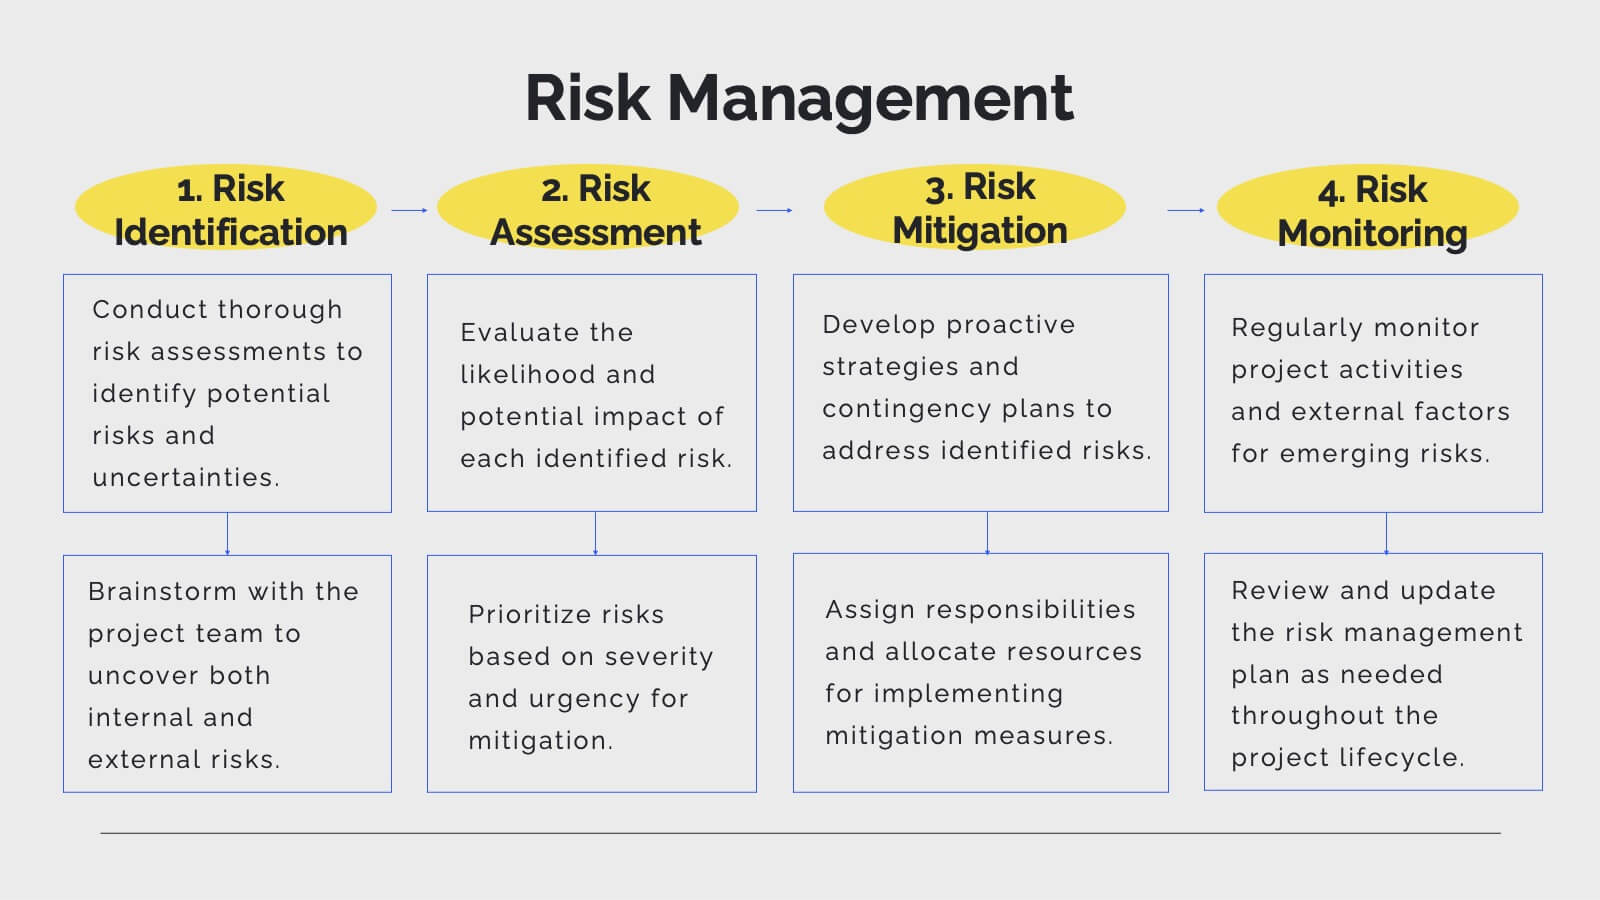
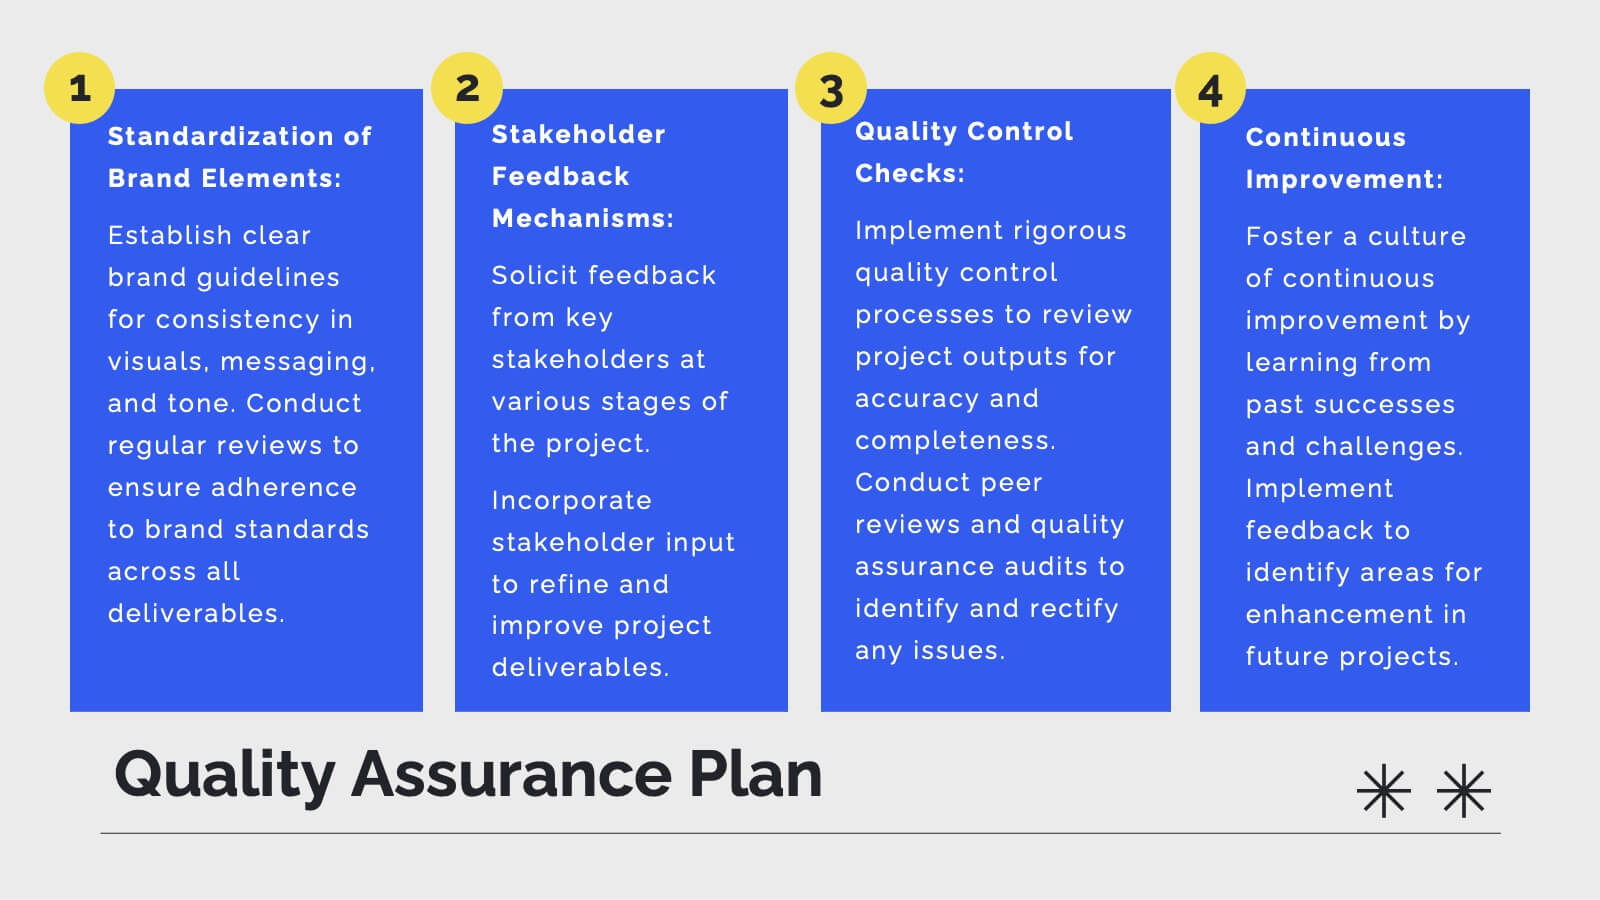
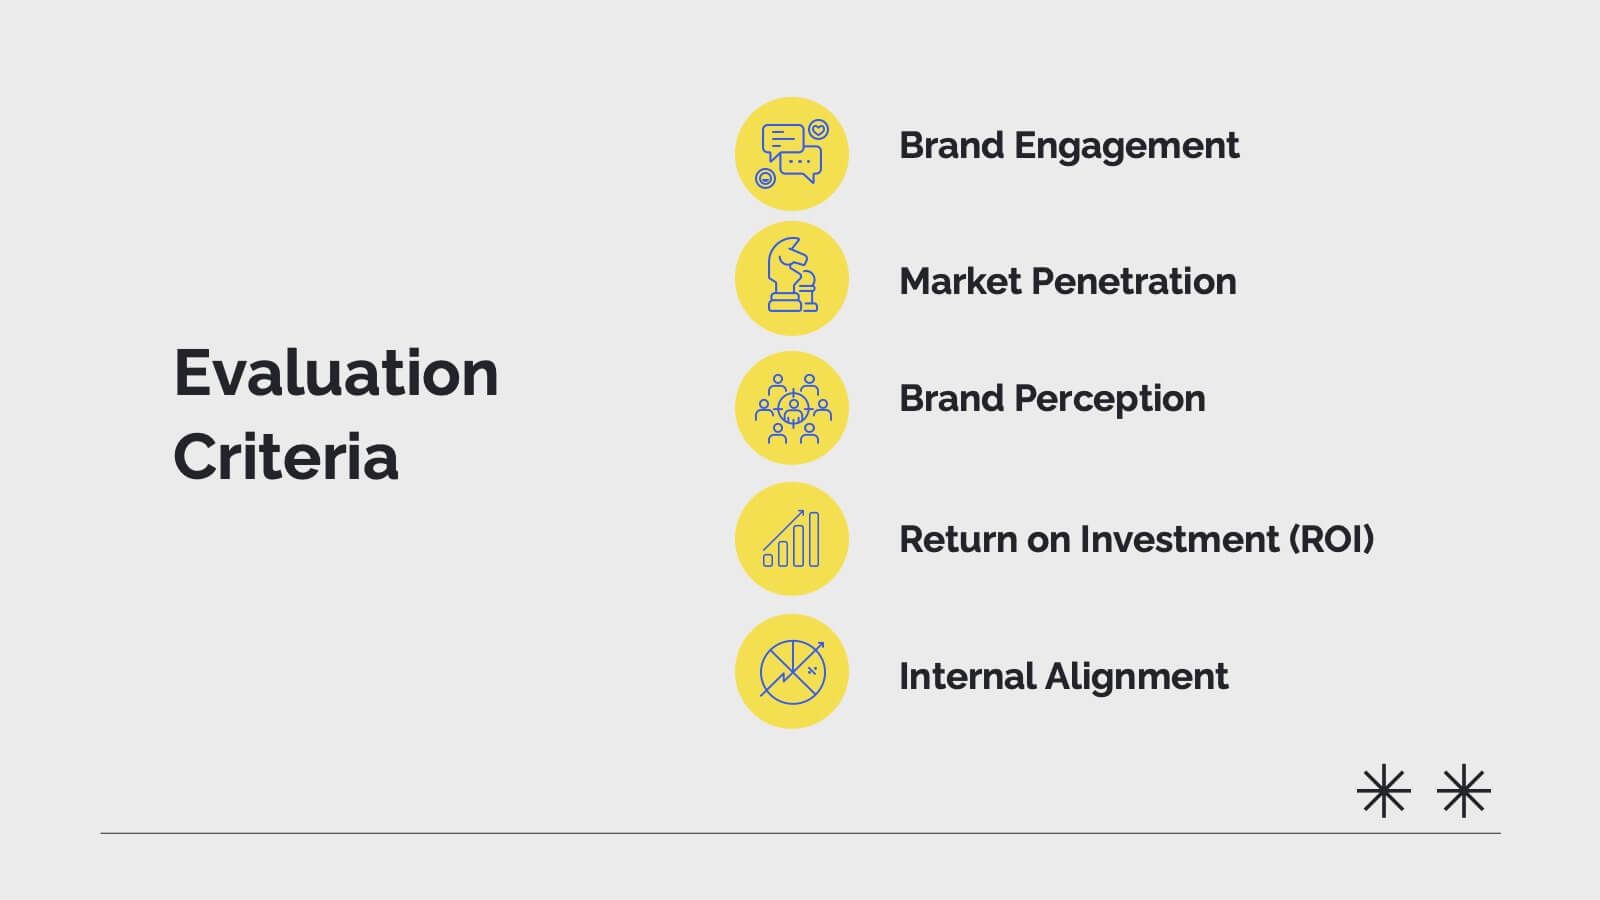
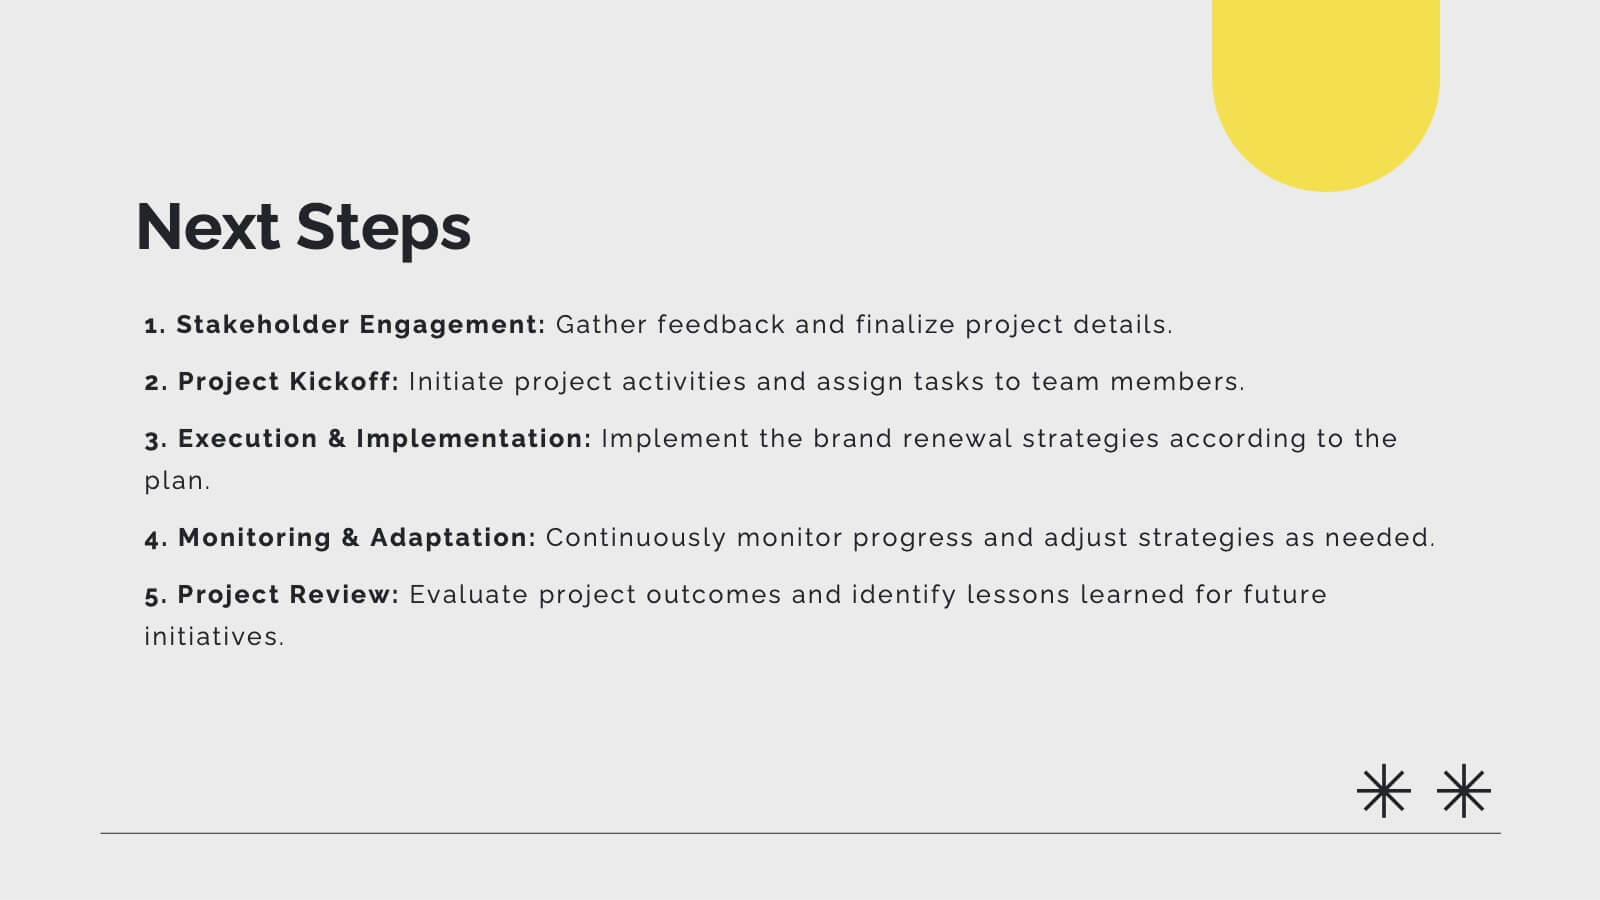
Pulse Project Management Plan Presentation
Streamline your project management with this vibrant template. It covers project overview, objectives, deliverables, methodology, timeline, budget, and risk management. Perfect for clear and engaging presentations. Compatible with PowerPoint, Keynote, and Google Slides for seamless customization.