


Características


¿Tienes alguna pregunta?
Recomendar


6 diapositivas
Core Mission Vision Goals Presentation
Spark clarity and momentum with a clean, modern slide designed to showcase your organization’s purpose and future direction. This presentation highlights your core mission and vision in a visually engaging layout that keeps teams aligned and focused. Fully compatible with PowerPoint, Keynote, and Google Slides.


5 diapositivas
Natural Sources of Energy Infographics
The importance of Natural Energy lies in its ability to reduce environmental impact, promote energy security, and create economic benefits. This vertical infographic template showcases the various types of renewable energy sources. It has a modern and clean design that highlights the importance of using sustainable energy sources. The template features customizable photo layouts and charts, along with icons and illustrations related to the energy sector. With this template, you can easily create an infographic that educates your audience about the importance of renewable energy sources and encourages them to adopt sustainable practices.


7 diapositivas
Editable List Slide Presentation
Organize your ideas with style and simplicity using this clean, structured layout designed for clarity and impact. Ideal for summarizing key points, checklists, or action plans, it keeps your content professional and easy to follow. Fully customizable and compatible with PowerPoint, Keynote, and Google Slides for seamless presentation design.


22 diapositivas
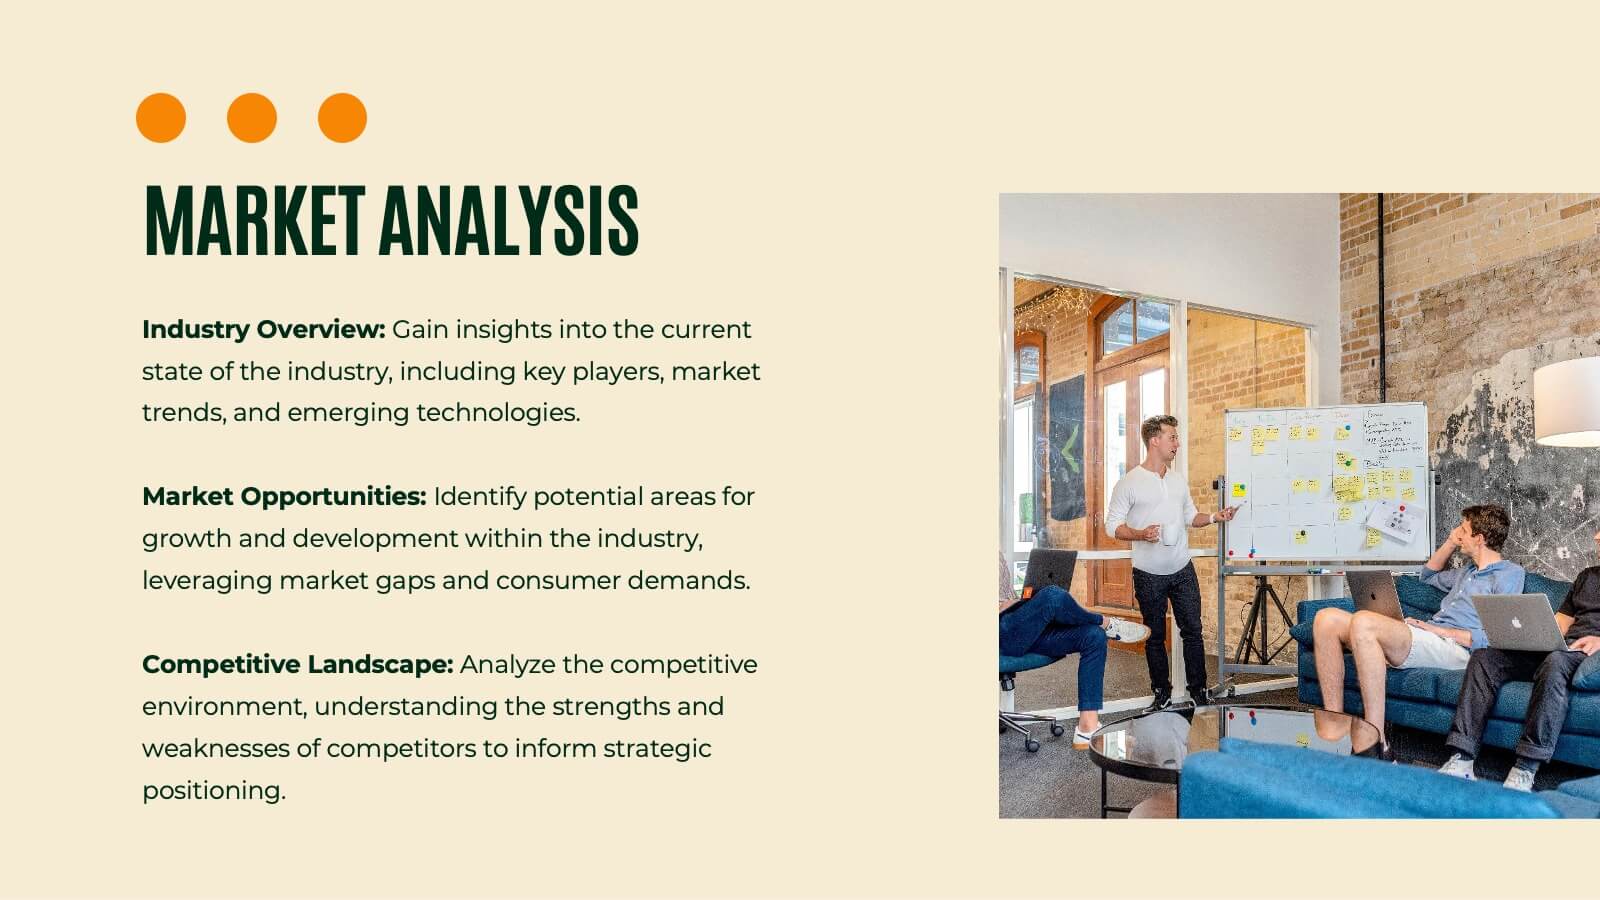
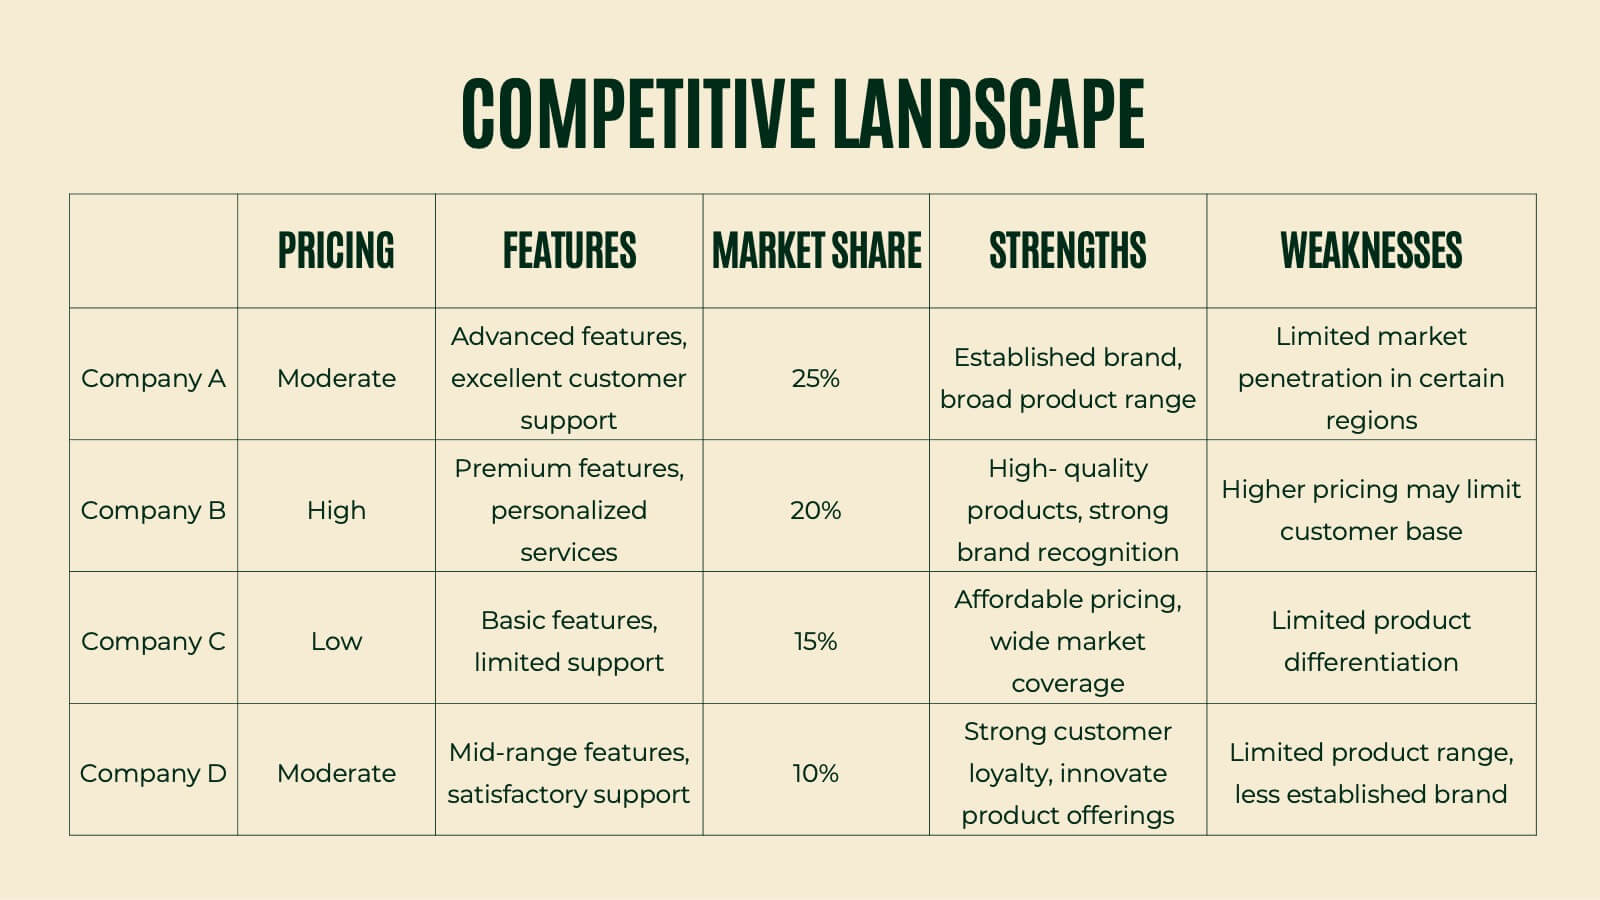
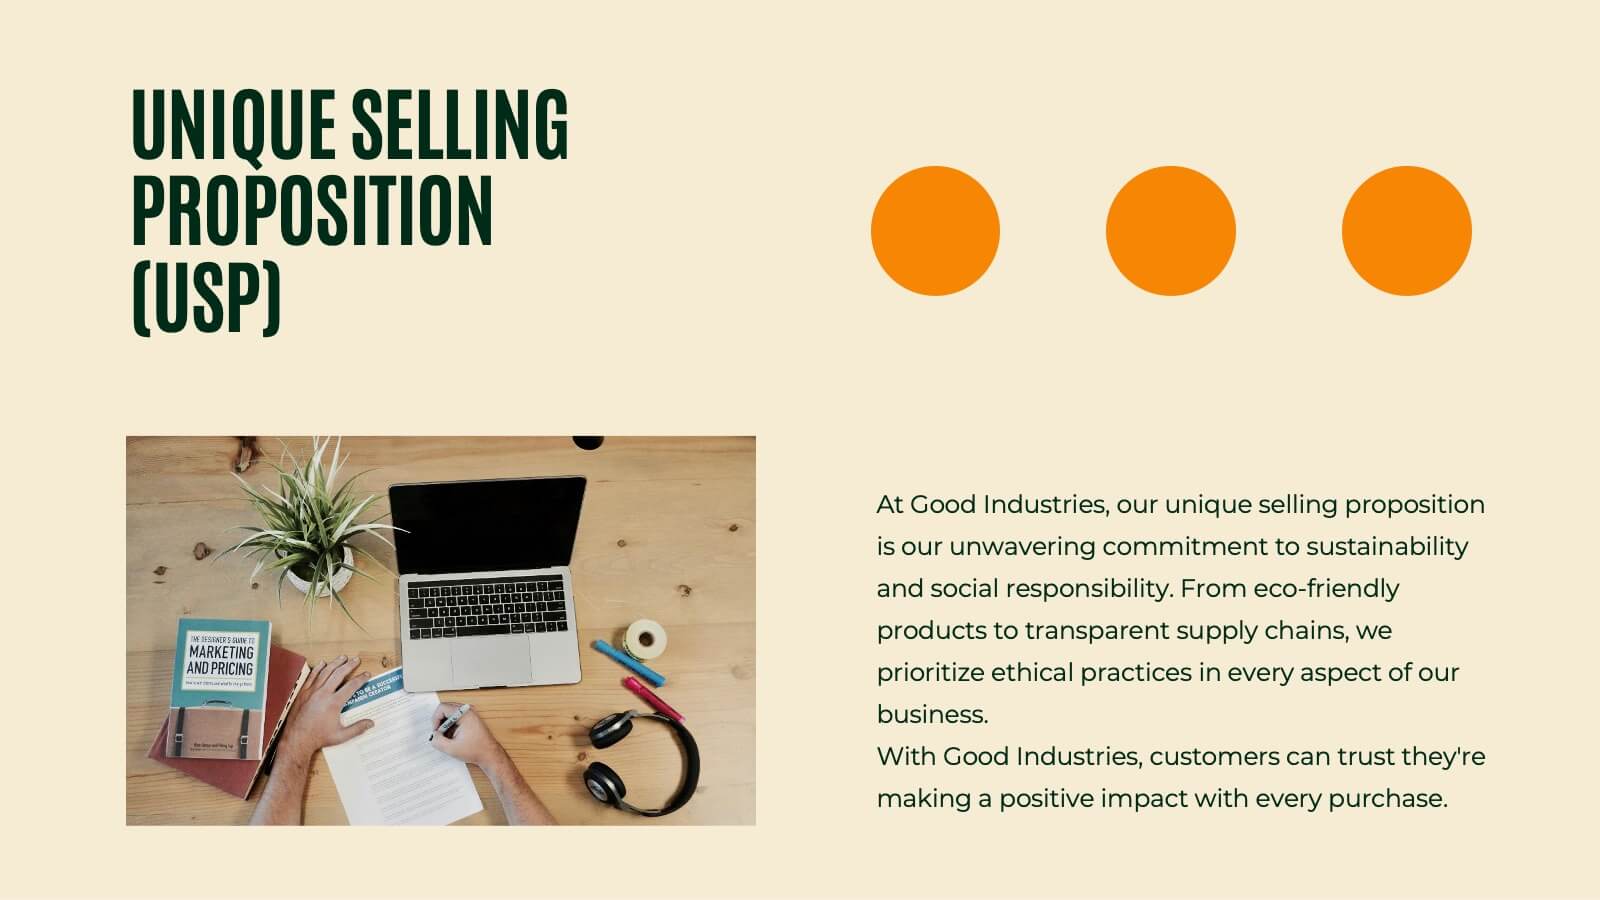
Tempest Product Strategy Report Presentation
Accelerate your product strategy with this bold presentation template! Ideal for outlining your product's market opportunity, unique selling proposition, and revenue model, it includes slides for competitive analysis, marketing strategy, and financials. Impress stakeholders with dynamic visuals and clear, structured content. Compatible with PowerPoint, Keynote, and Google Slides for seamless presentations on any platform.


6 diapositivas
Project Rollout Milestone Timeline Presentation
Visually map out your project phases with the Project Rollout Milestone Timeline Presentation. Featuring a modern cylinder path layout, this slide is perfect for showcasing five key milestones in sequential or strategic order. Ideal for project managers and teams, and fully editable in Canva, PowerPoint, Keynote, and Google Slides.


4 diapositivas
Task Management Checklist Presentation
Stay organized and boost productivity with the Task Management Checklist template. This structured design helps you categorize tasks into Do’s and Don’ts, ensuring a clear workflow for efficient task execution. Fully editable and compatible with PowerPoint, Keynote, and Google Slides, making it perfect for teams and professionals alike.


5 diapositivas
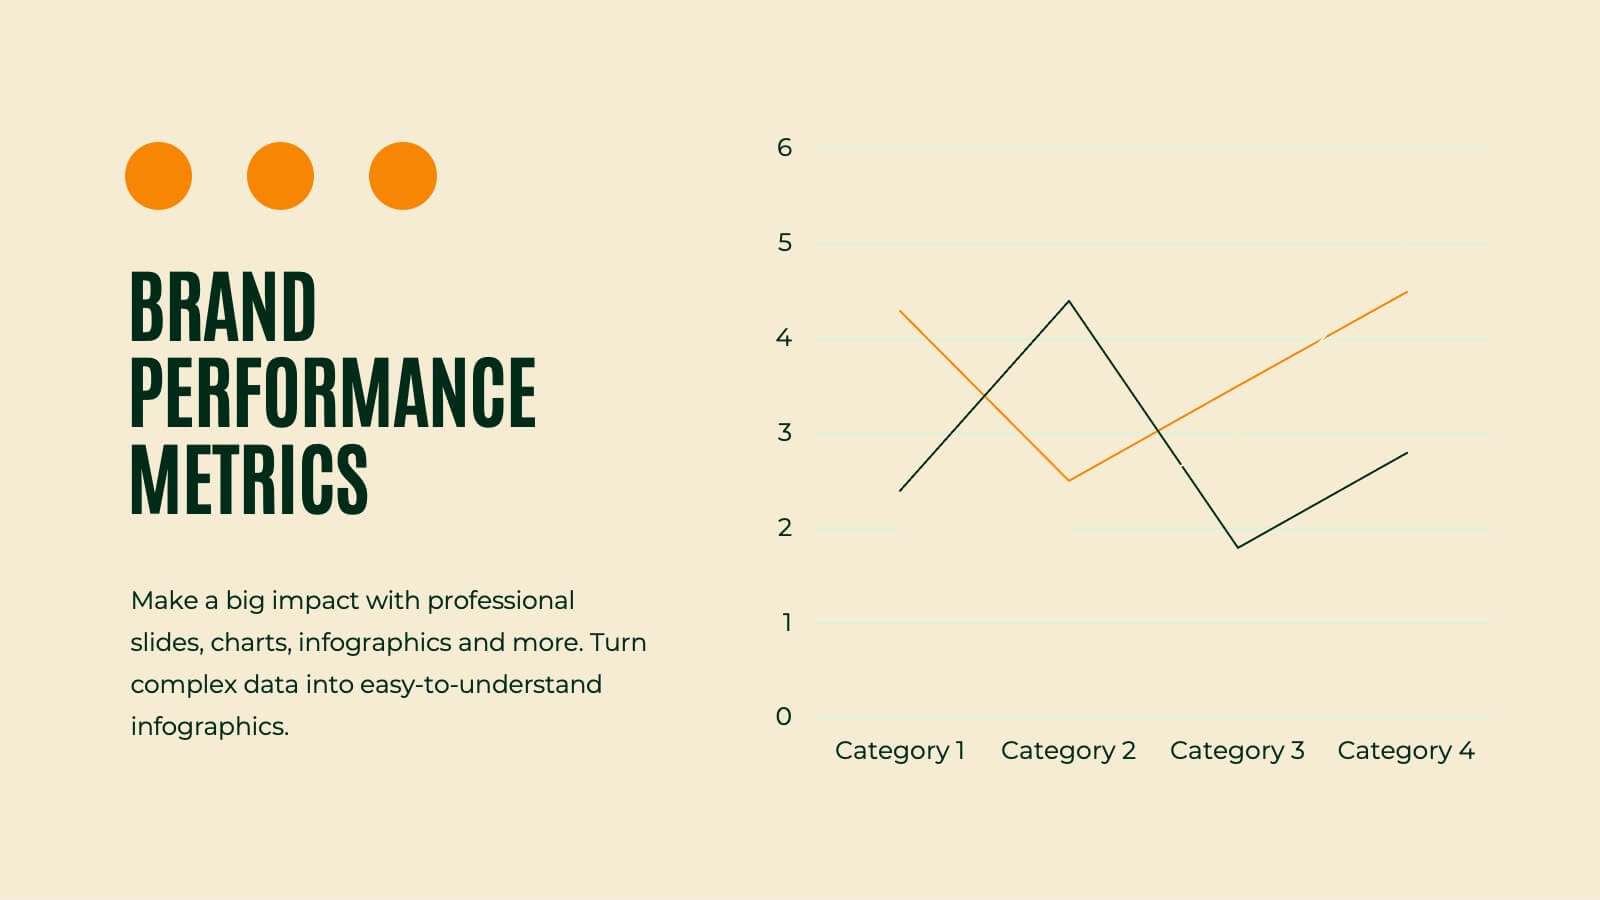
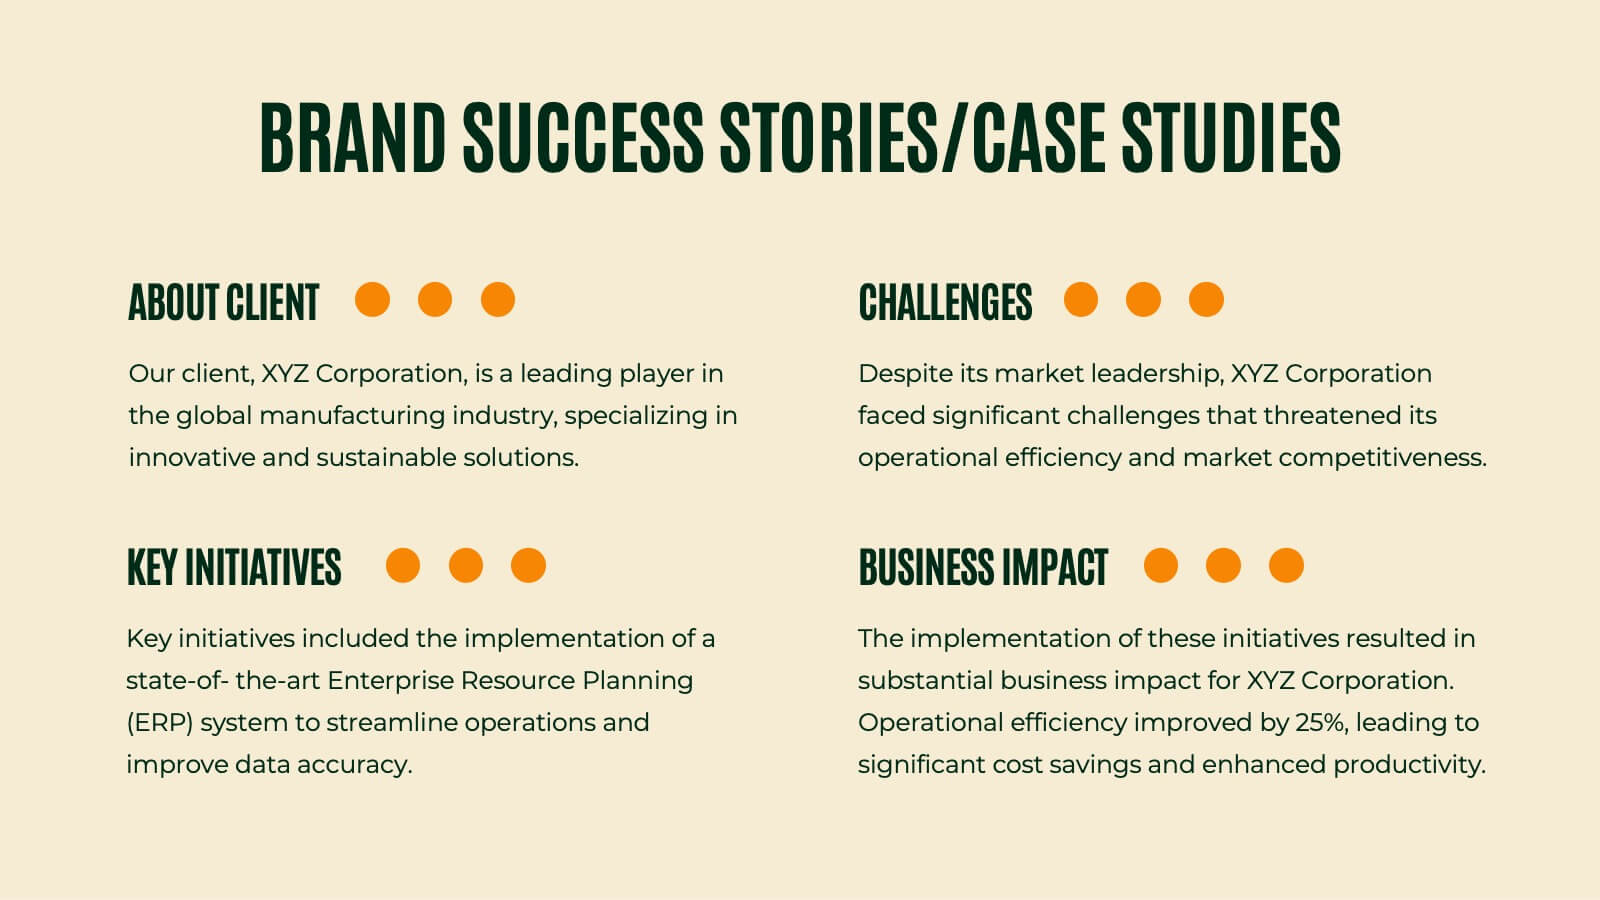
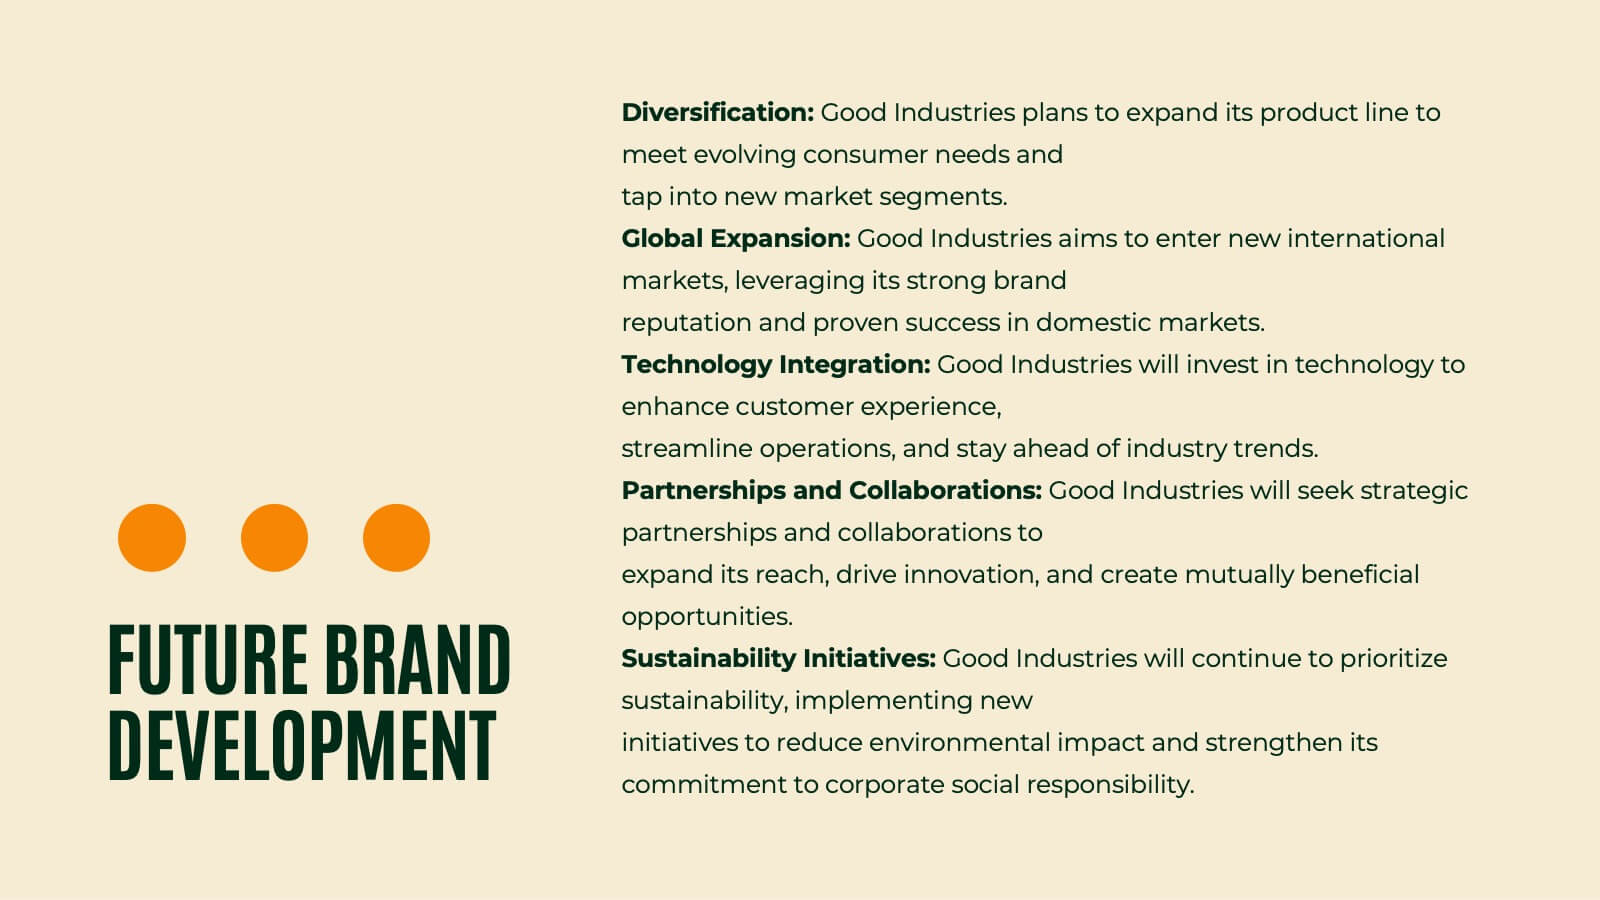
Business Success Case Study Presentation
Showcase impactful results with the Business Success Case Study Presentation template. This structured layout highlights key milestones, challenges, and solutions in a visually engaging format, making it perfect for demonstrating business achievements and growth strategies. Fully editable and compatible with PowerPoint, Keynote, and Google Slides, it’s ideal for case studies, reports, and business reviews.


6 diapositivas
Business Sustainability Performance Report Presentation
Showcase your company’s sustainability efforts with this modern infinity-loop infographic. Perfect for environmental reports, CSR metrics, or circular economy overviews. Highlight key percentages and goals across three impact areas. Fully editable and compatible with PowerPoint, Keynote, and Google Slides—ideal for presenting performance results in a clear, engaging, and professional format.


5 diapositivas
African Continent Map Slide Presentation
Visualize your data across Africa with a modern, easy-to-read map design that highlights regional trends and insights. Perfect for showcasing demographics, market distribution, or project reach, this template combines clarity and impact. Fully compatible with PowerPoint, Keynote, and Google Slides for smooth customization and presentation flexibility.


29 diapositivas
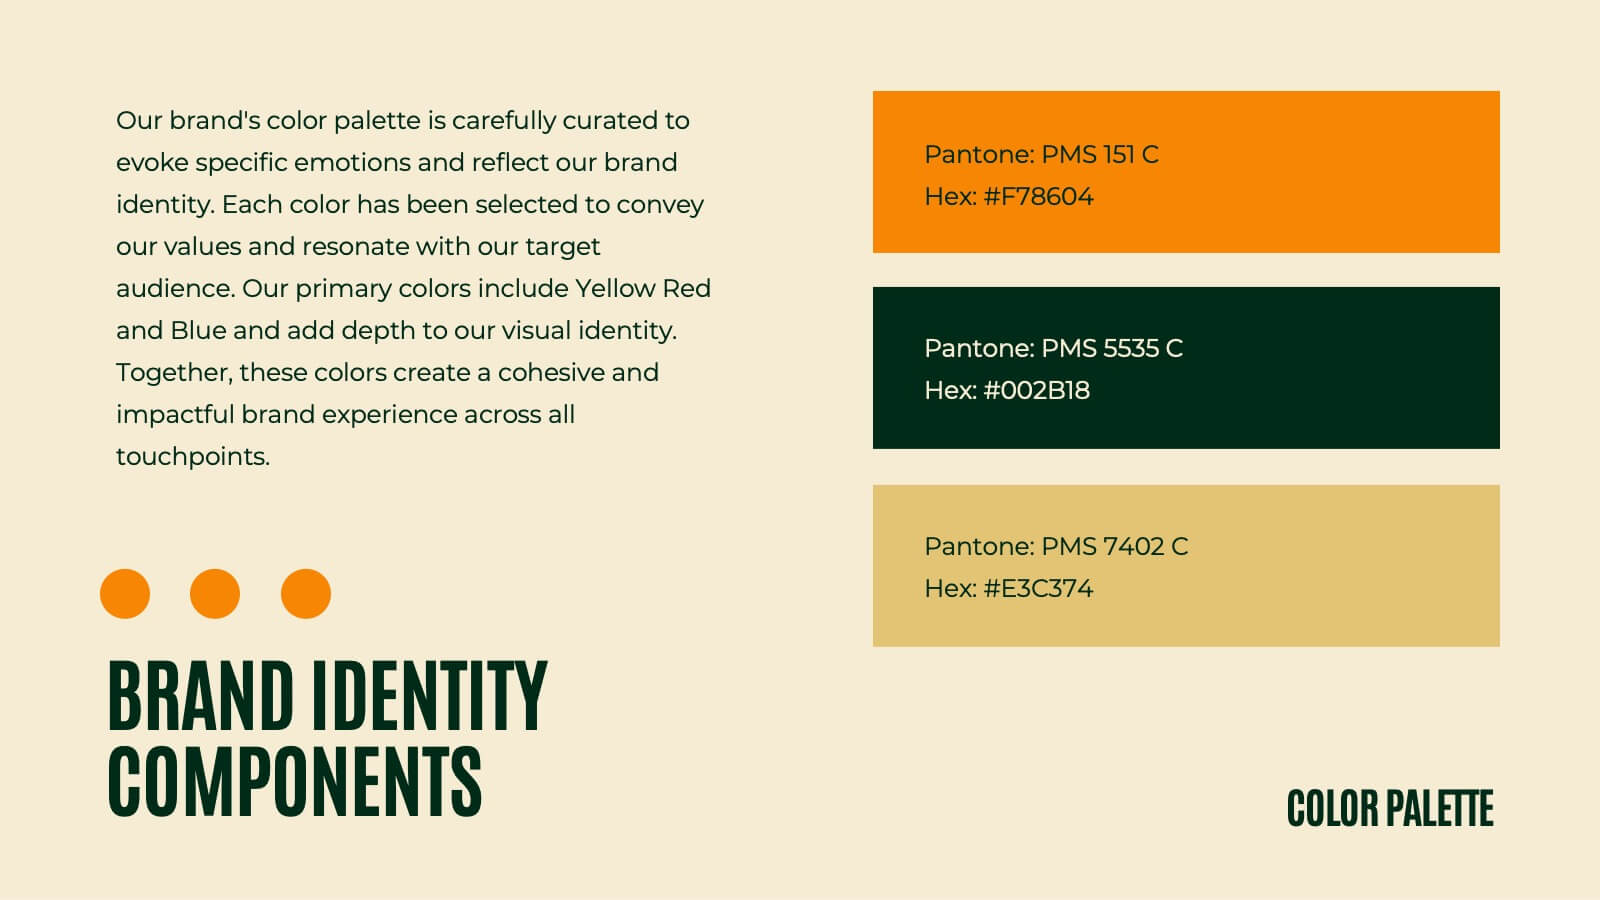
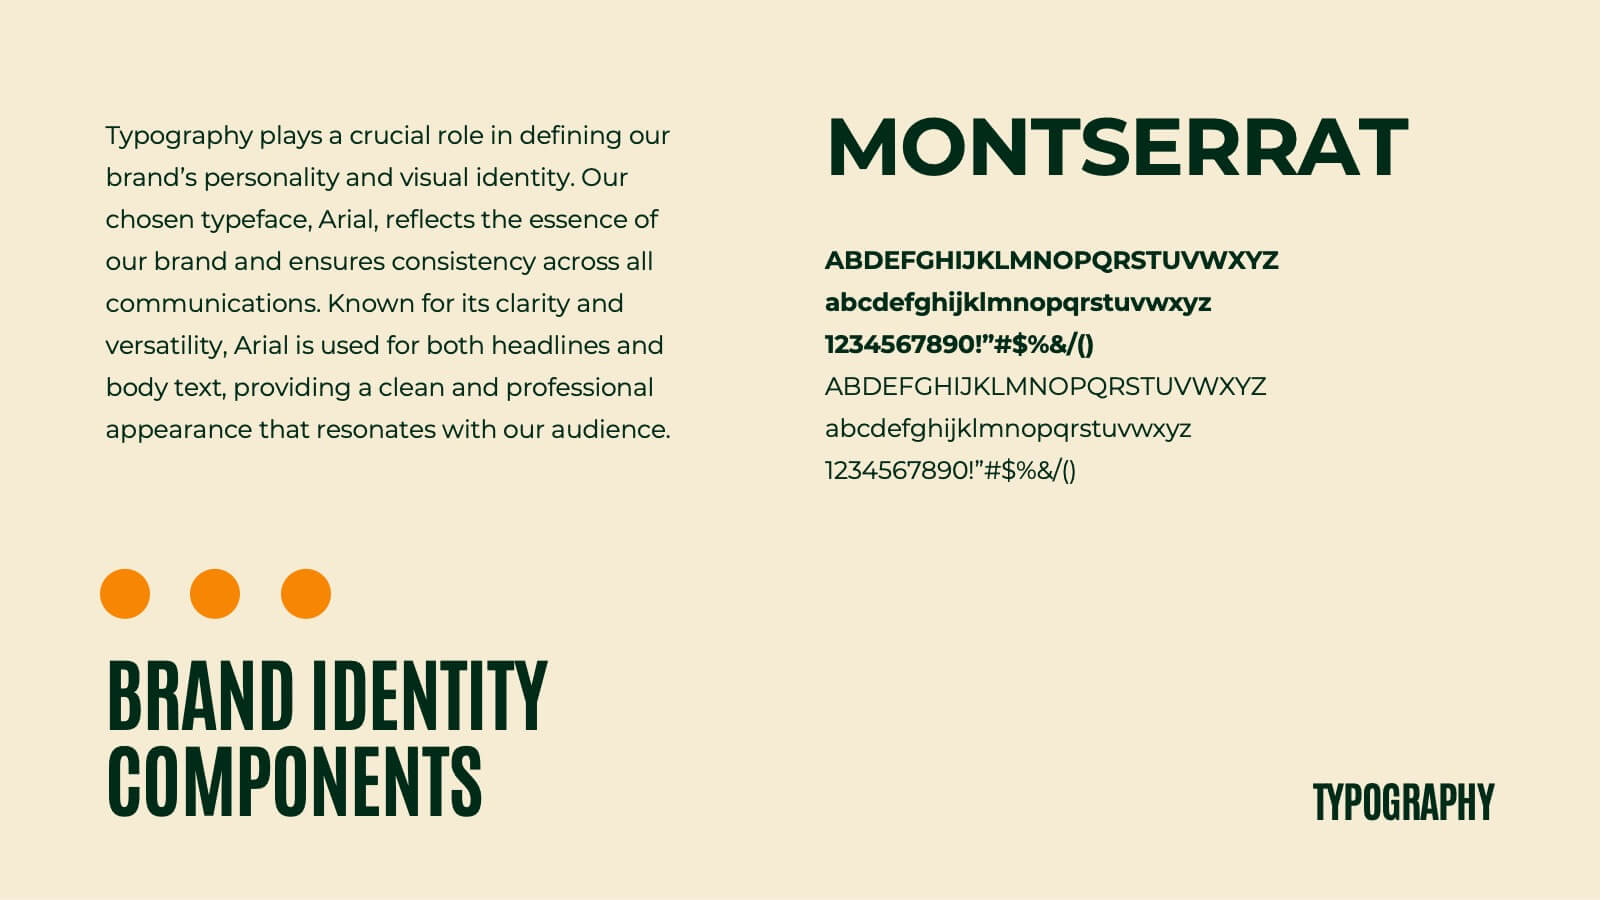
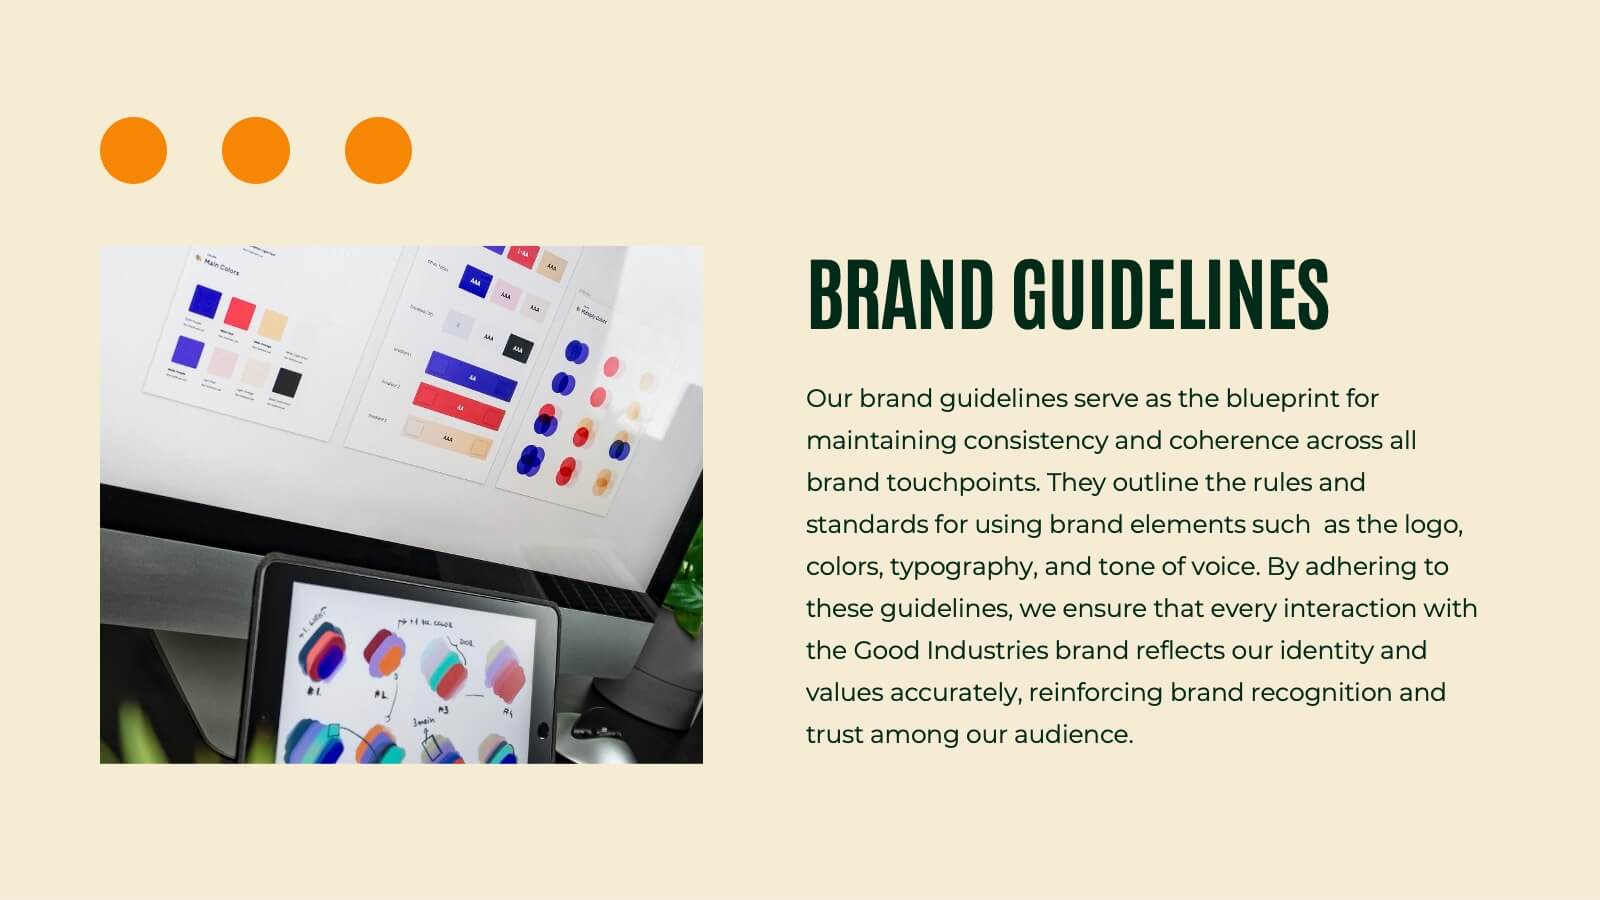
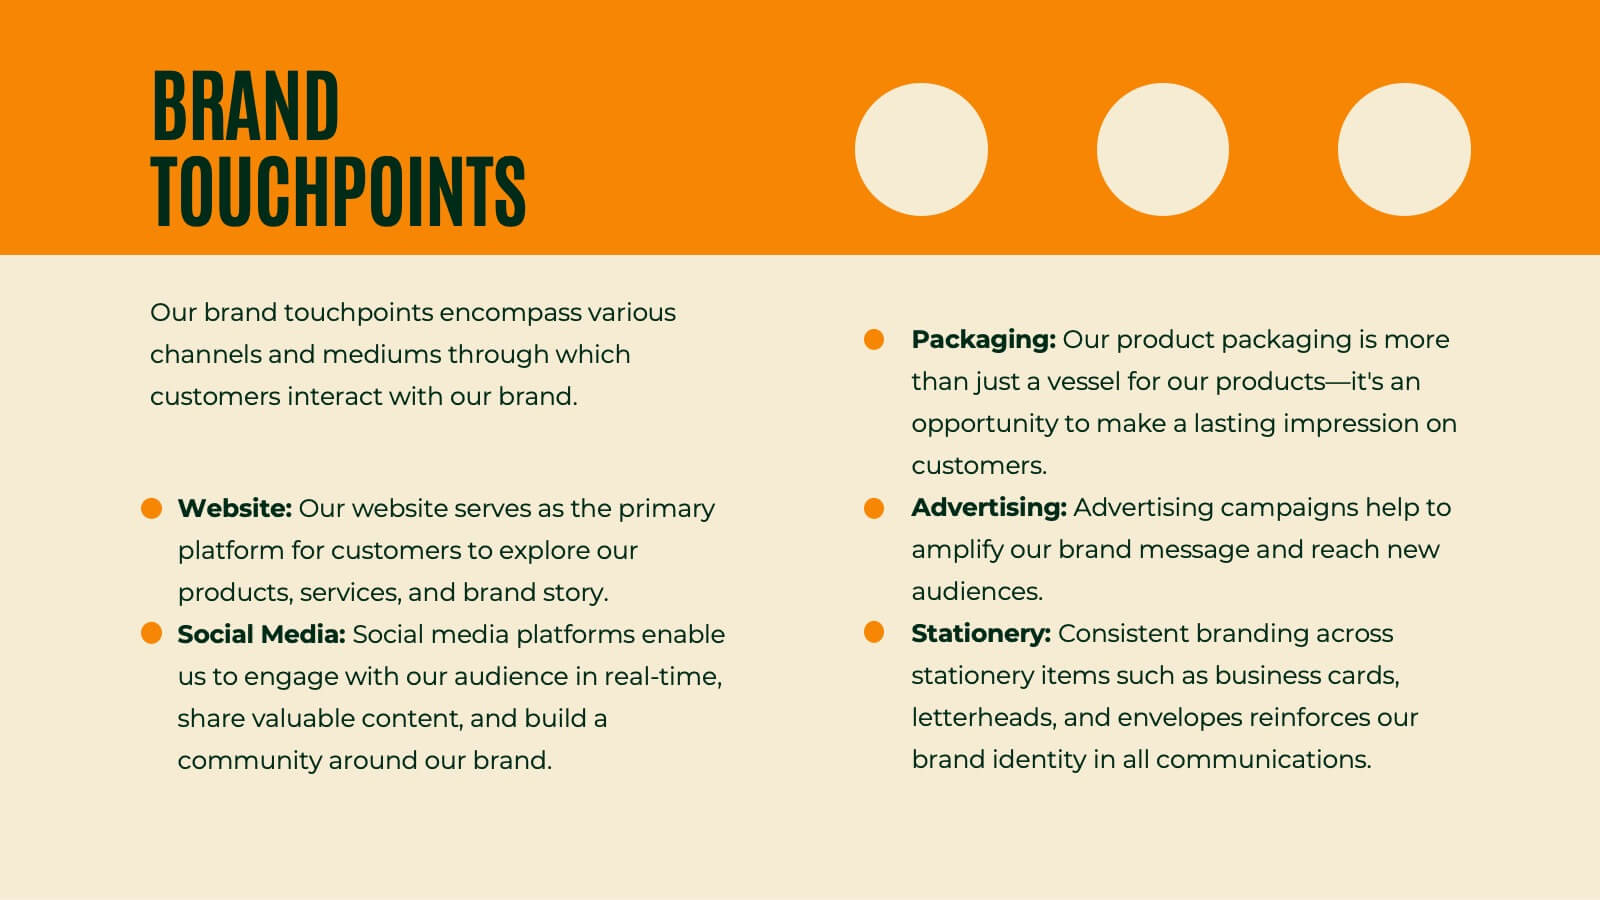
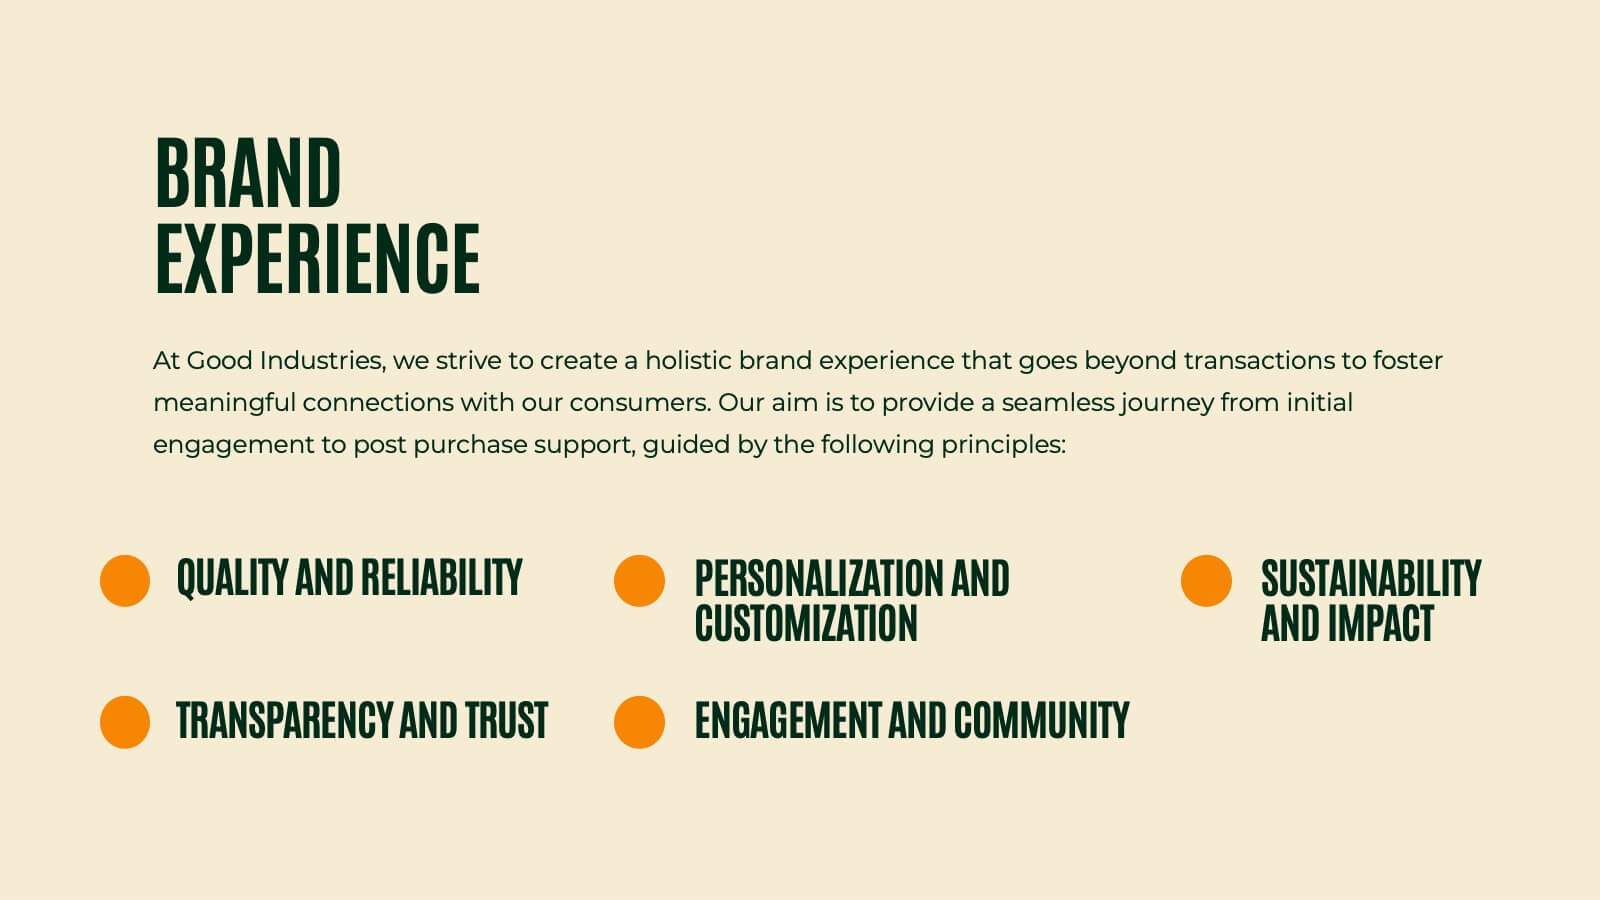
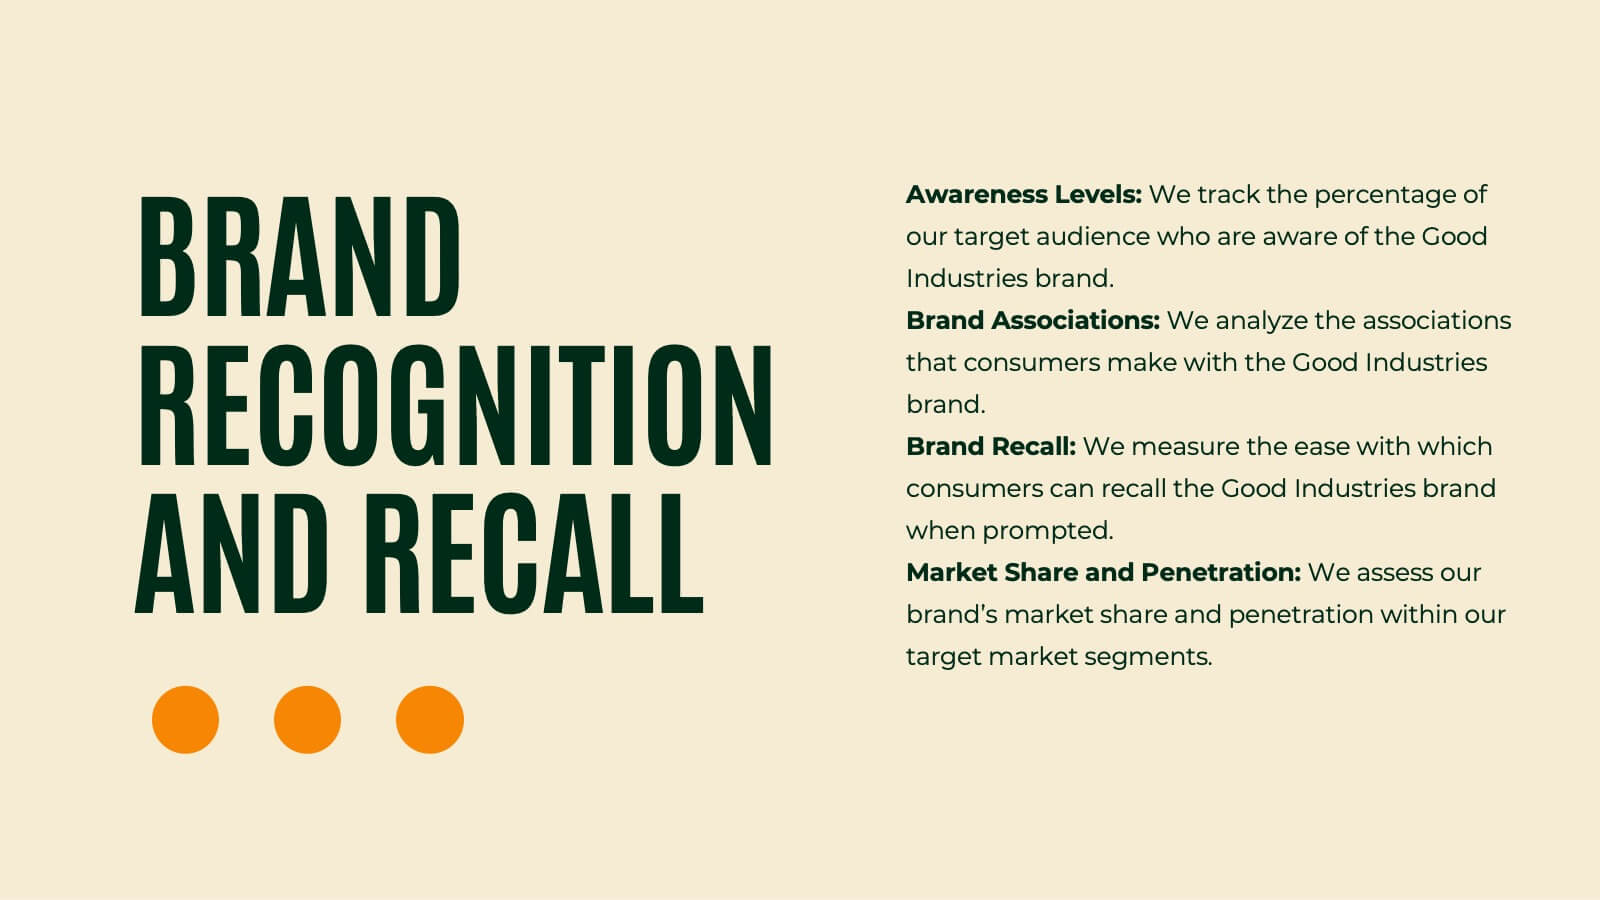
Shadowglow Brand Guidelines Proposal Presentation
Present a cohesive brand vision with this professional template, designed for crafting detailed and visually compelling brand guidelines. Highlight essential components like brand vision and mission, brand values, and identity elements, including color palettes, typography, and imagery. This template seamlessly incorporates customer personas, tone and voice guidelines, and brand touchpoints to define the essence of your brand's communication. Utilize slides for website, social media, and packaging strategies to establish consistency across all platforms. Customizable and compatible with PowerPoint, Google Slides, and Keynote, this design ensures clarity and professionalism, making it ideal for agencies or teams presenting comprehensive brand proposals.


4 diapositivas
Employee Performance Feedback
Showcase progress clearly with this Employee Performance Feedback presentation. Featuring skill-based metrics, productivity scores, and analysis ratings, this layout uses visual data bars to evaluate team performance at a glance. Perfect for HR reviews, team assessments, or quarterly check-ins. Fully editable in PowerPoint, Keynote, and Google Slides.


7 diapositivas
IT Architecture Solution Infographic
Enhance your presentations with our IT Architecture Solution infographic, tailored for optimal clarity in Powerpoint, Keynote, and Google Slides. This infographic offers a comprehensive visual tool to simplify complex IT structures, ideal for professionals aiming to articulate intricate systems with ease. Its design facilitates a clear understanding of hierarchical IT frameworks, making it perfect for educational environments, business meetings, and tech conferences. Our IT Architecture Solution infographic is crafted to aid in the seamless conveyance of IT strategies and structures. The intuitive layout provides a straightforward narrative to IT infrastructure, ensuring your audience grasps technical details without feeling overwhelmed. This infographic is a must-have for anyone presenting IT concepts, delivering a balanced combination of simplicity and detail that caters to both novice and expert levels. With compatibility across various presentation platforms, this infographic integrates smoothly into your existing slides, enhancing your ability to communicate effectively in the digital age. Elevate your IT presentations with this essential visual aid.


4 diapositivas
Preventative Healthcare Strategies Presentation
Present medical insights with clarity using this syringe-themed slide layout designed for preventative healthcare strategies. Ideal for showcasing public health plans, vaccination drives, or early intervention tactics. Fully editable in PowerPoint, Keynote, and Google Slides, this modern visual aids healthcare professionals in delivering data-driven, concise messages with professional impact.


4 diapositivas
Financial Cost Management Strategies Presentation
Effectively plan and monitor financial performance with the Financial Cost Management Strategies Presentation template. This slide provides a clear roadmap for cost optimization, budget allocation, and financial efficiency improvements. Ideal for finance teams, business strategists, and executives aiming for streamlined cost control. Fully editable in PowerPoint, Keynote, and Google Slides for easy customization.


21 diapositivas
Polaris Startup Strategy Presentation
Set your startup on a path to success with this bold and dynamic strategy presentation template. Featuring key sections like mission and vision, market analysis, business model, and growth plans, it’s perfect for entrepreneurs and teams. Fully compatible with PowerPoint, Keynote, and Google Slides for a seamless presentation experience.


26 diapositivas
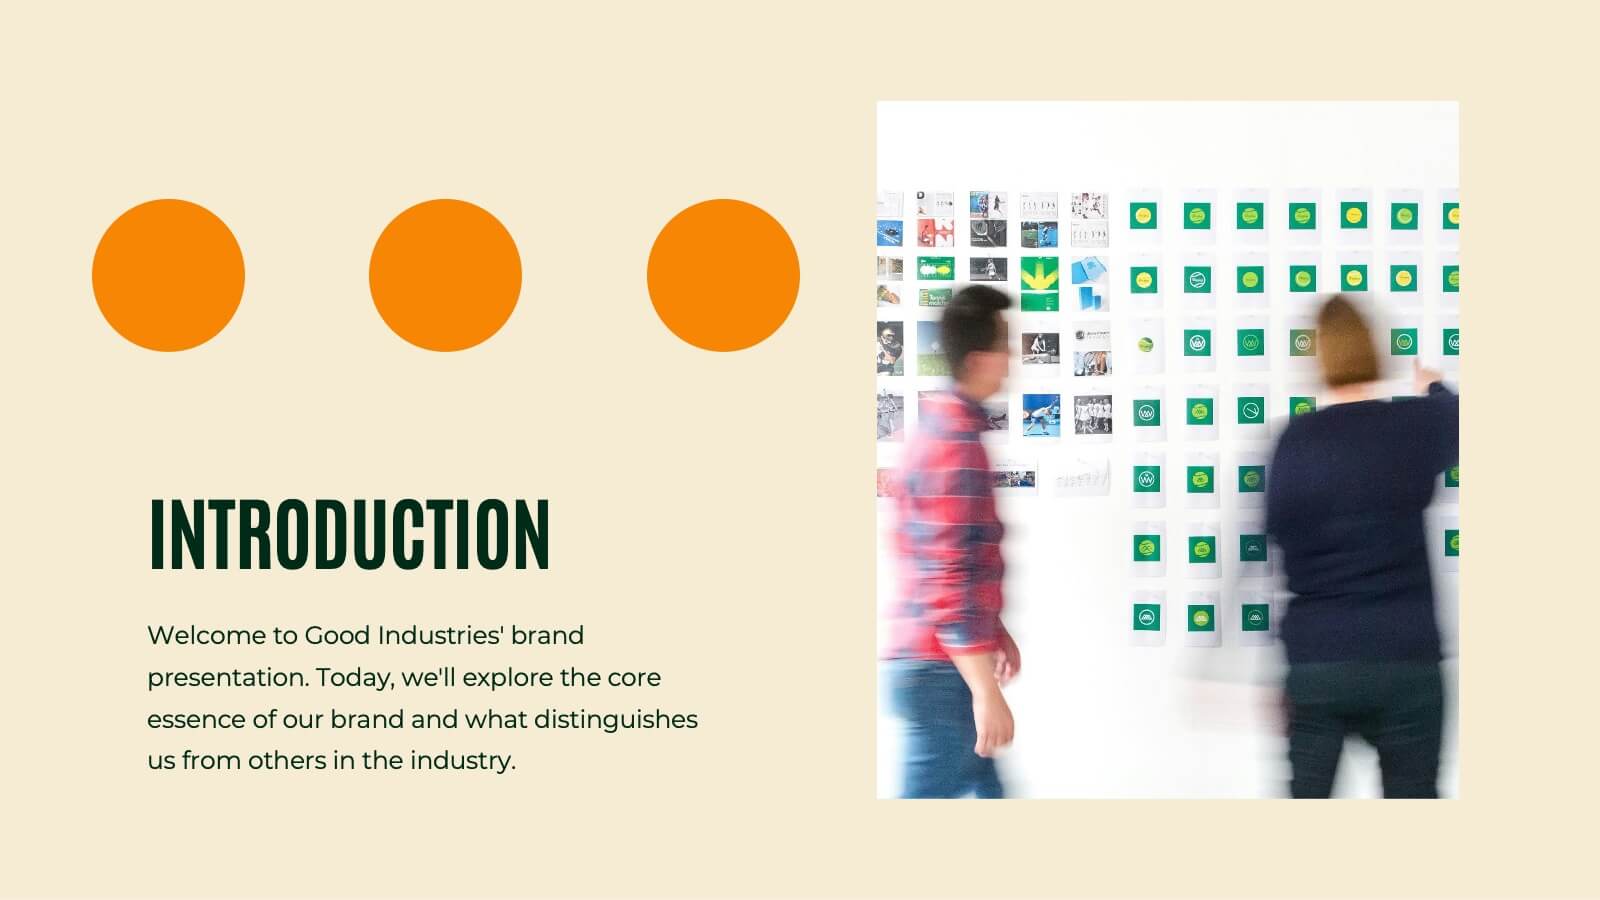
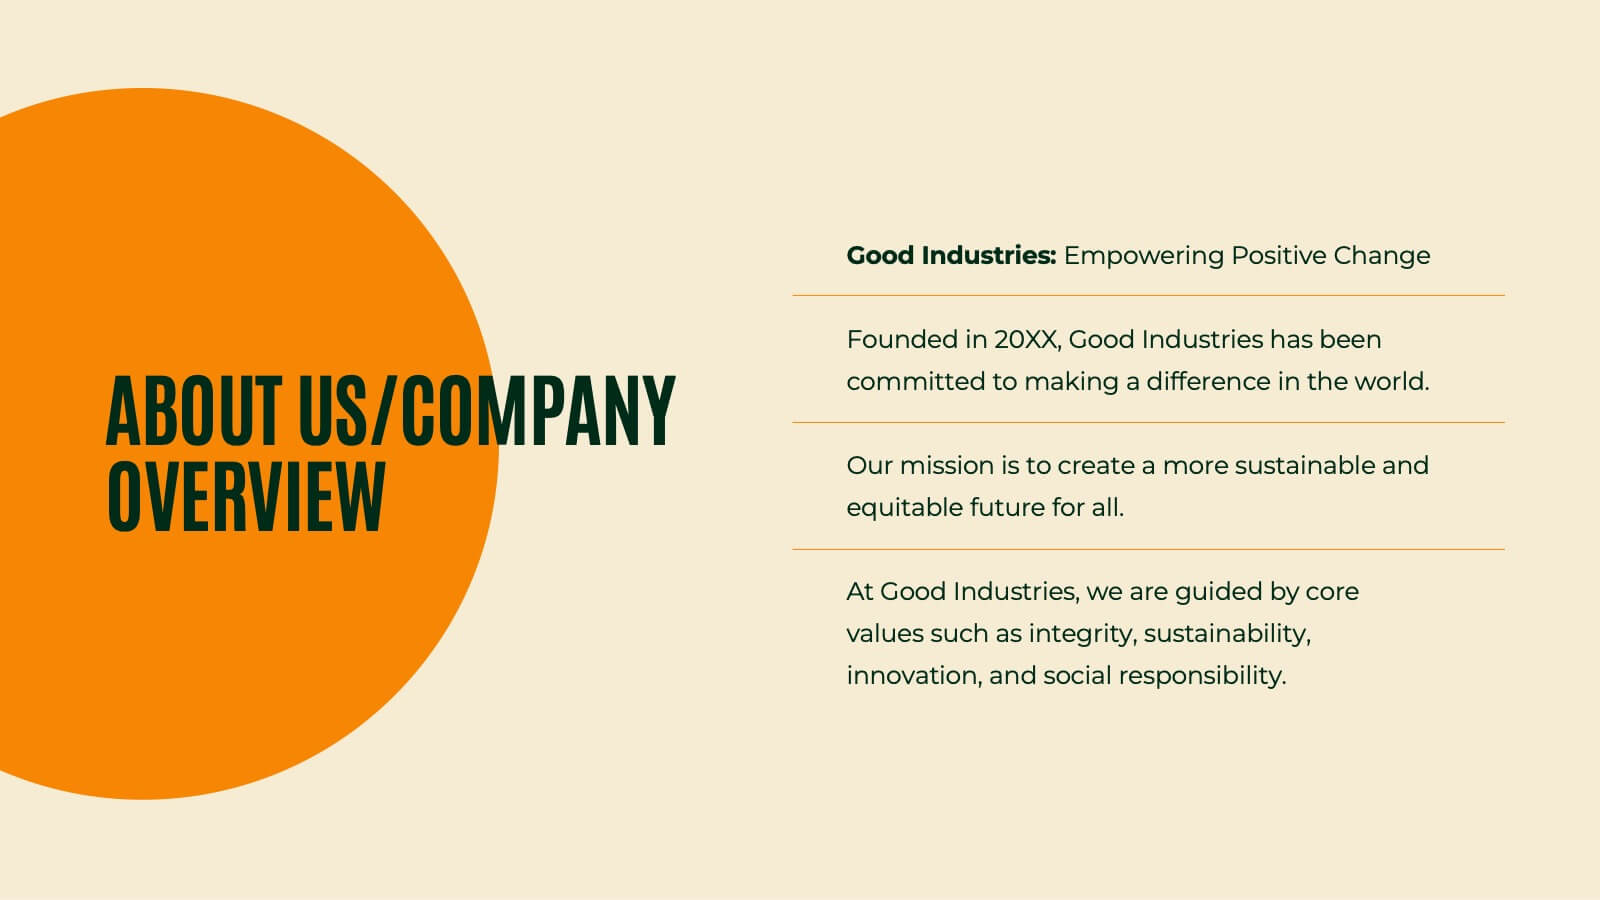
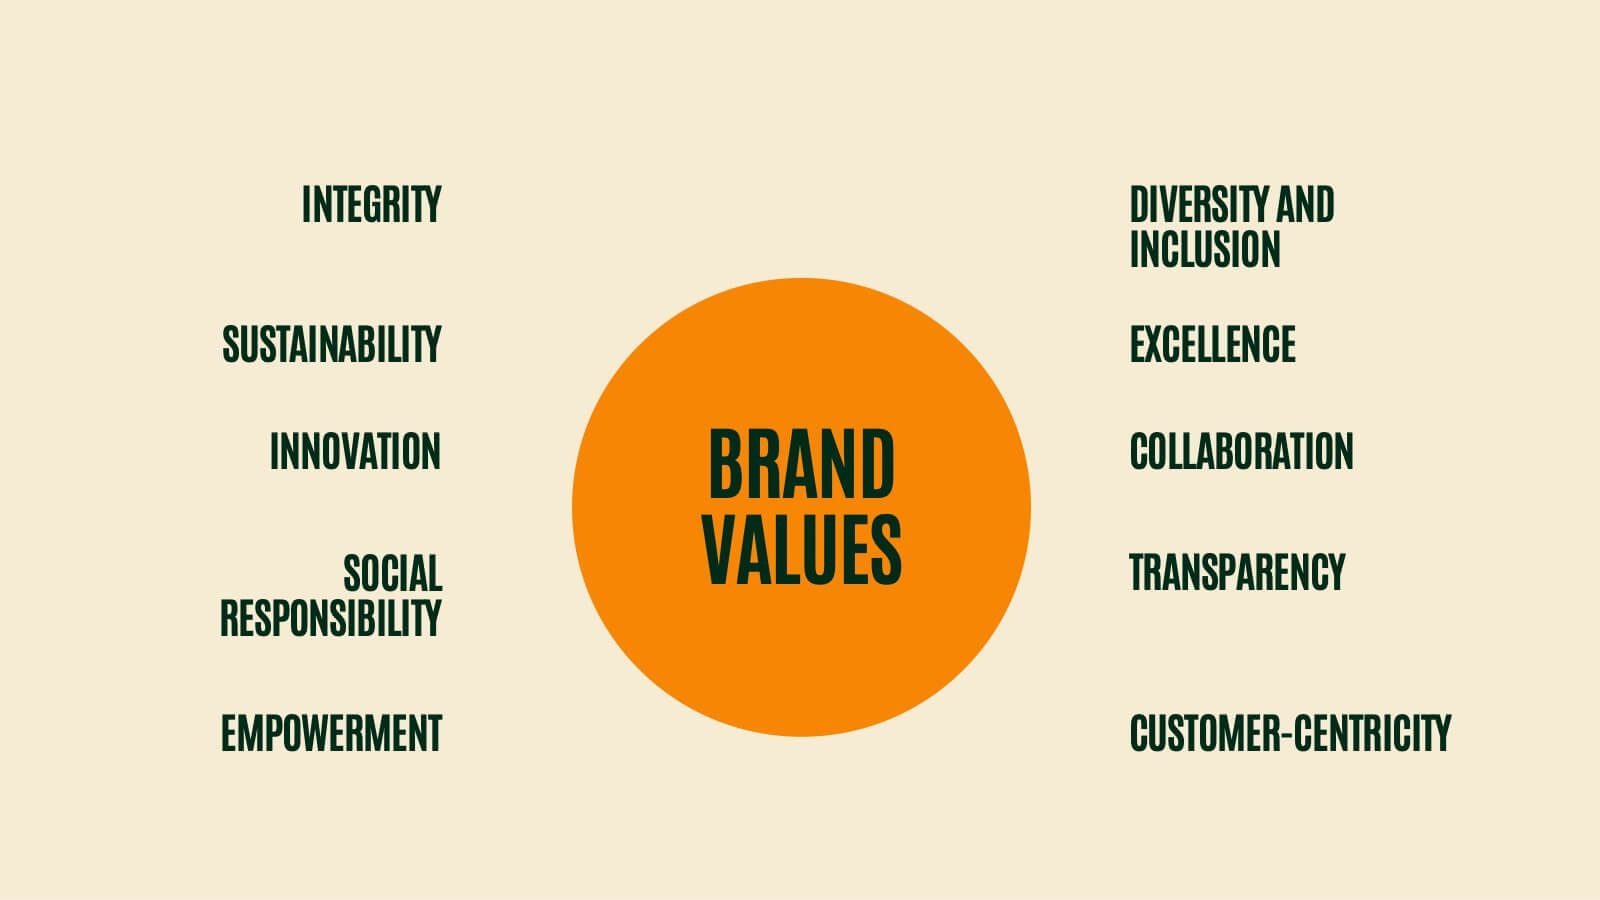
Griffin Rebranding Project Plan Presentation
Unleash the power of branding with this vibrant presentation template! This tool guides you through essential brand elements like identity, voice, and strategy. Perfect for marketers and brand managers aiming to make a memorable impact. Compatible with PowerPoint, Keynote, and Google Slides, it's a must-have for any branding project.


5 diapositivas
Creative Brainstorming Presentation
Enhance your brainstorming sessions with this Creative Brainstorming template. Designed with a modern head outline and idea mapping structure, it visually organizes key insights for innovative discussions. Fully customizable with editable text, colors, and icons to fit your needs. Compatible with PowerPoint, Keynote, and Google Slides for seamless integration.