


Características


¿Tienes alguna pregunta?
Recomendar


7 diapositivas
Geometric Sequence Infographic Presentation
Geometric infographics typically involve the use of various shapes to convey different pieces of information. This Geometric Template is a professional way to show your great designworks and ideas. This template can be used in a variety of contexts, from business and marketing to education and journalism. This clean design includes many categories, dividers and icons which will help you show your data in the best way. Start creating your own customized presentation by adding your text, images and other content from your slides, just download in PowerPoint, Keynote or Google Slides.

22 diapositivas
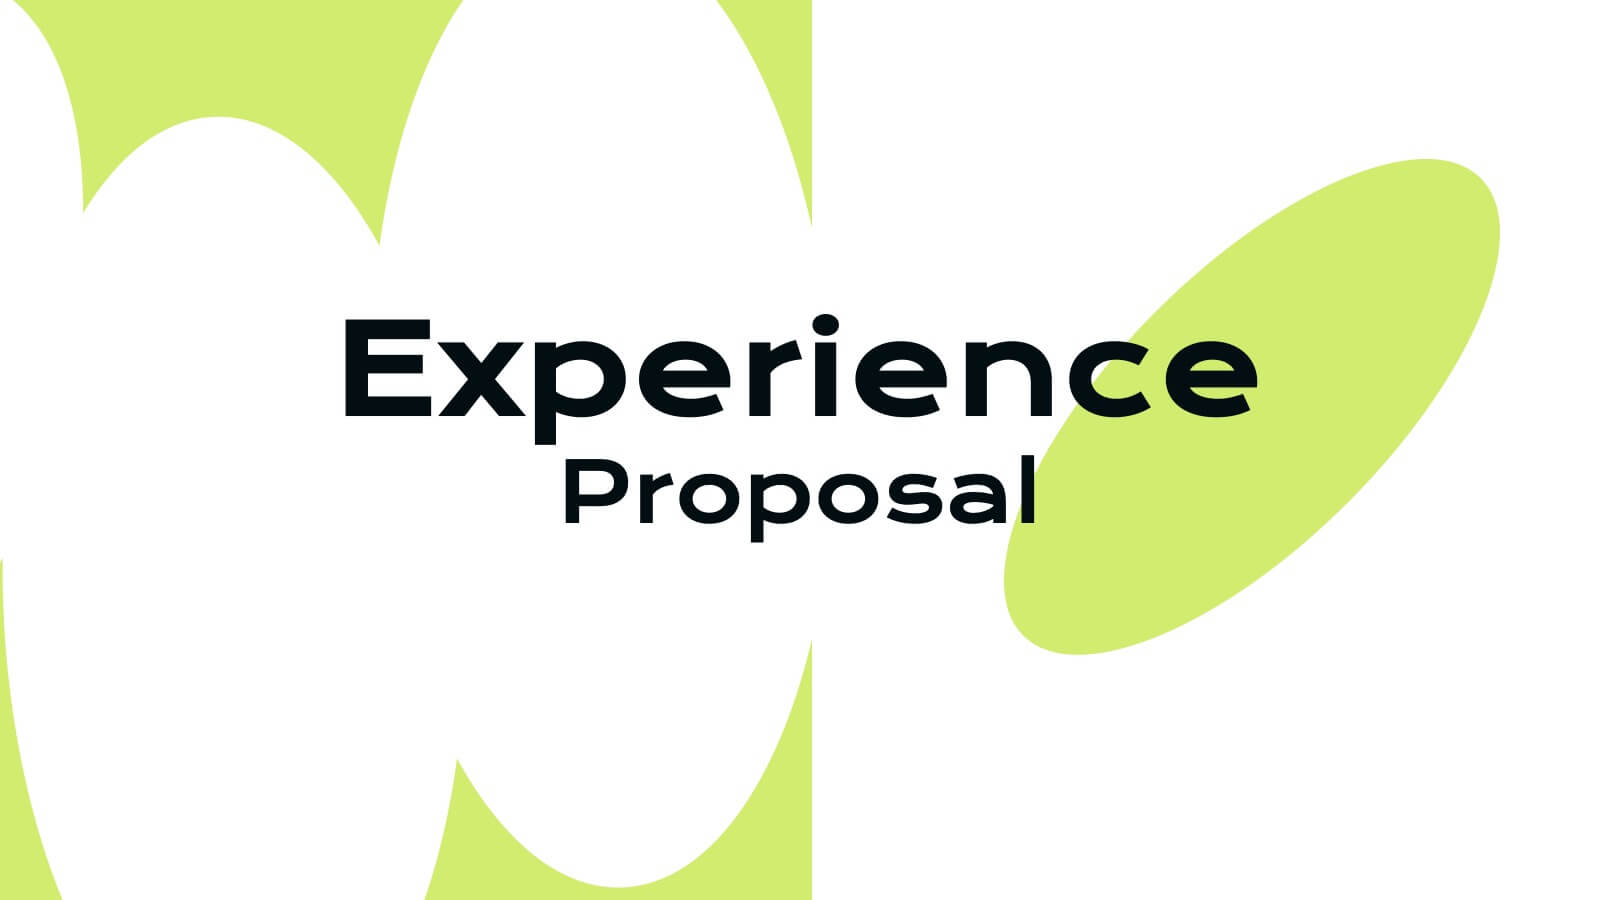
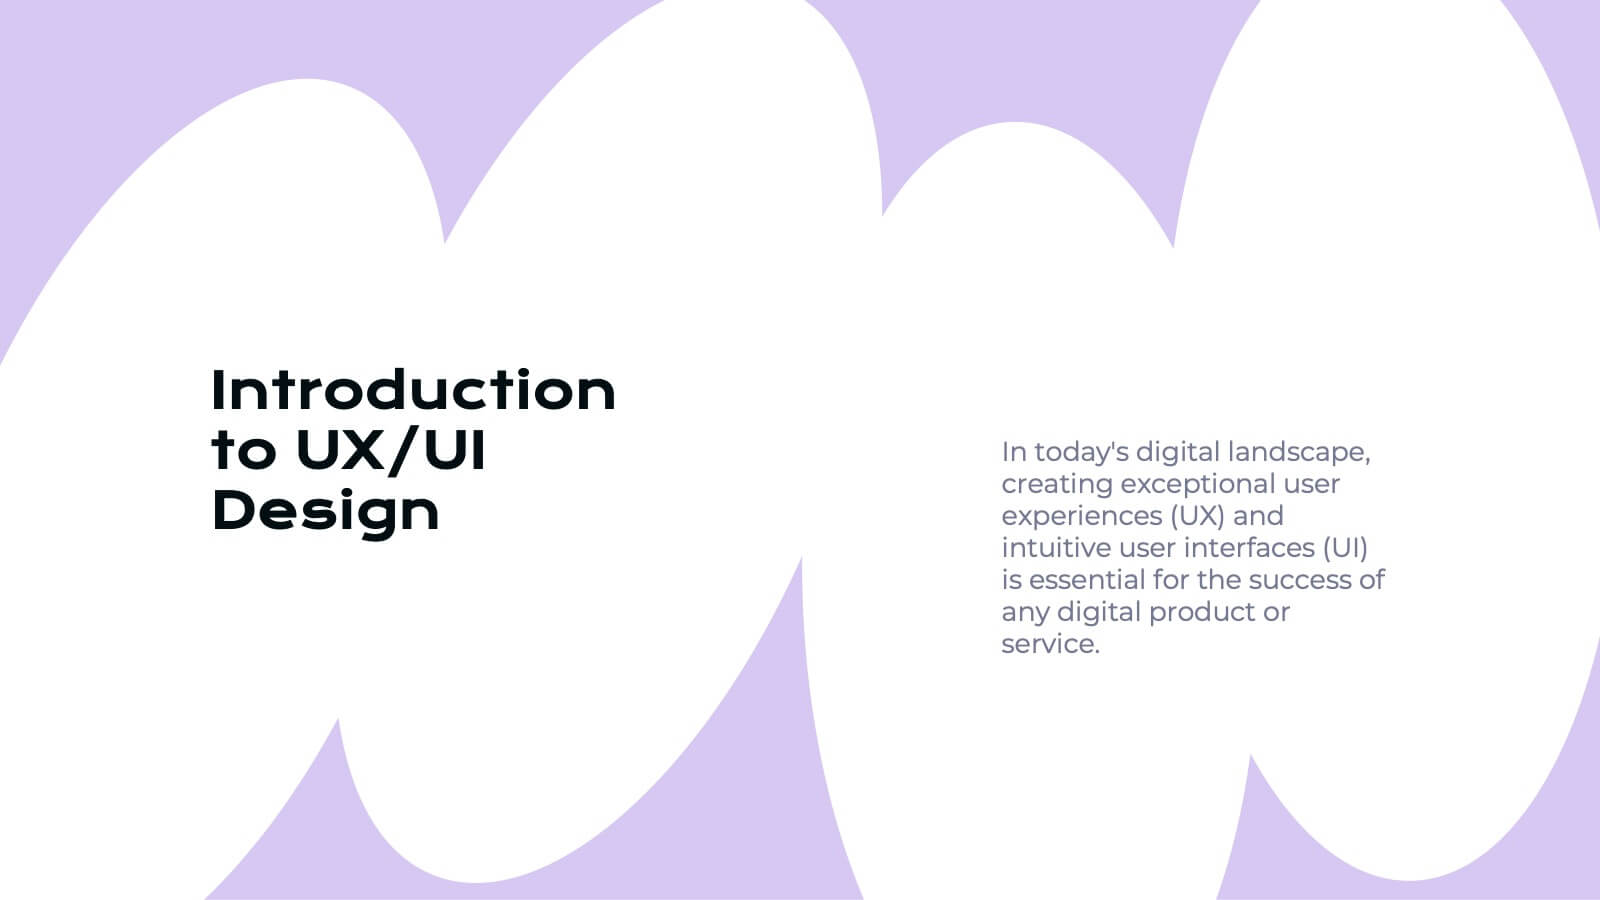
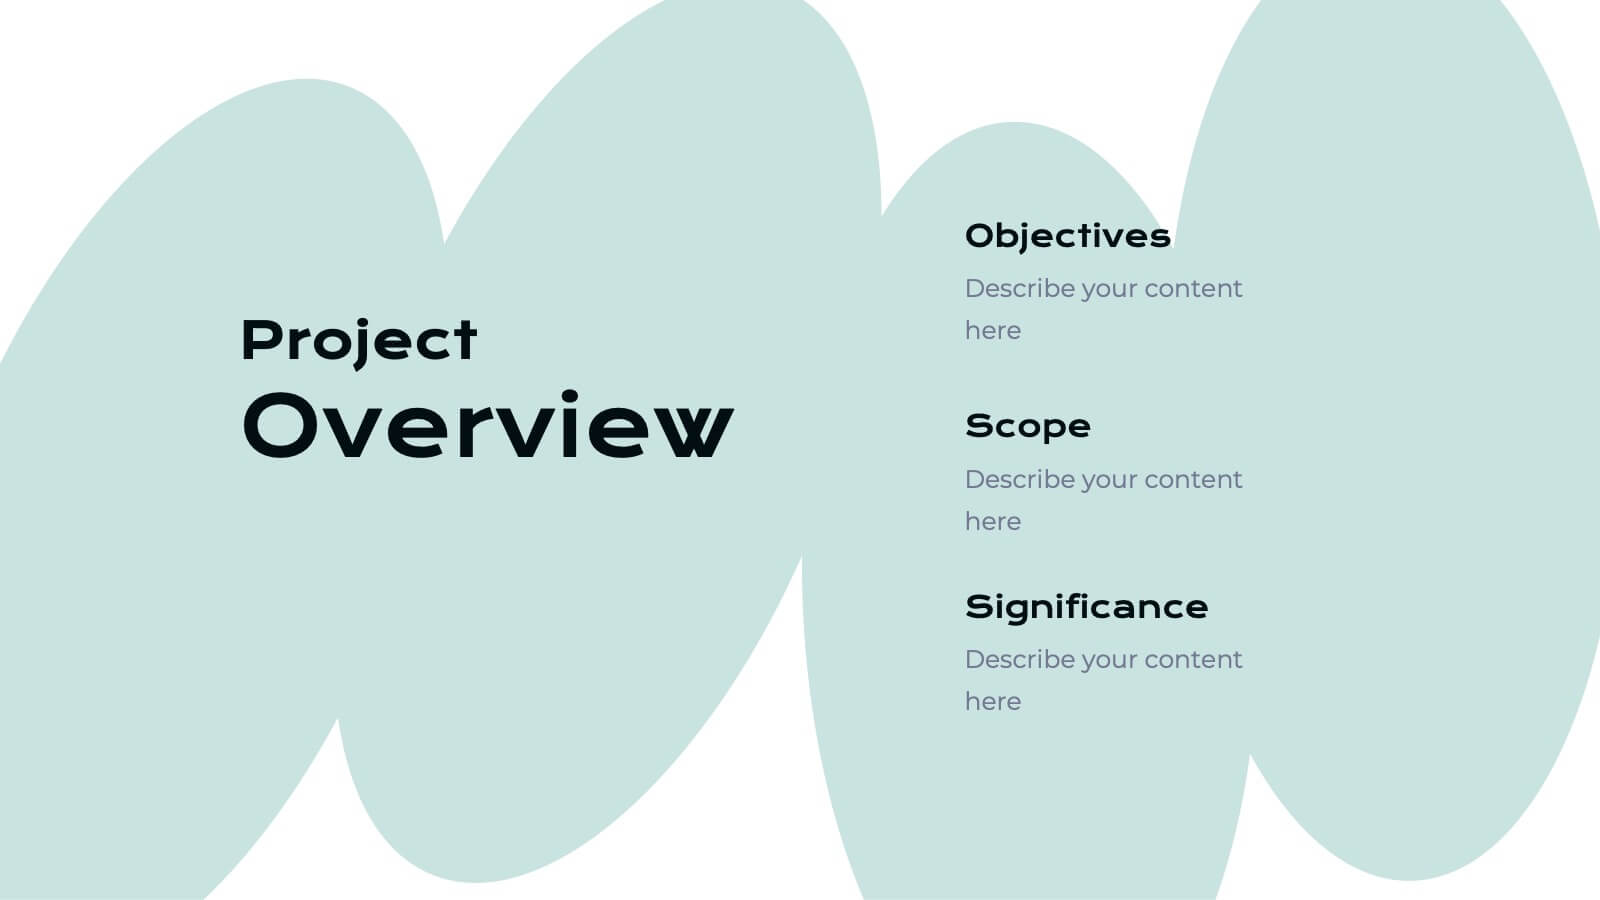
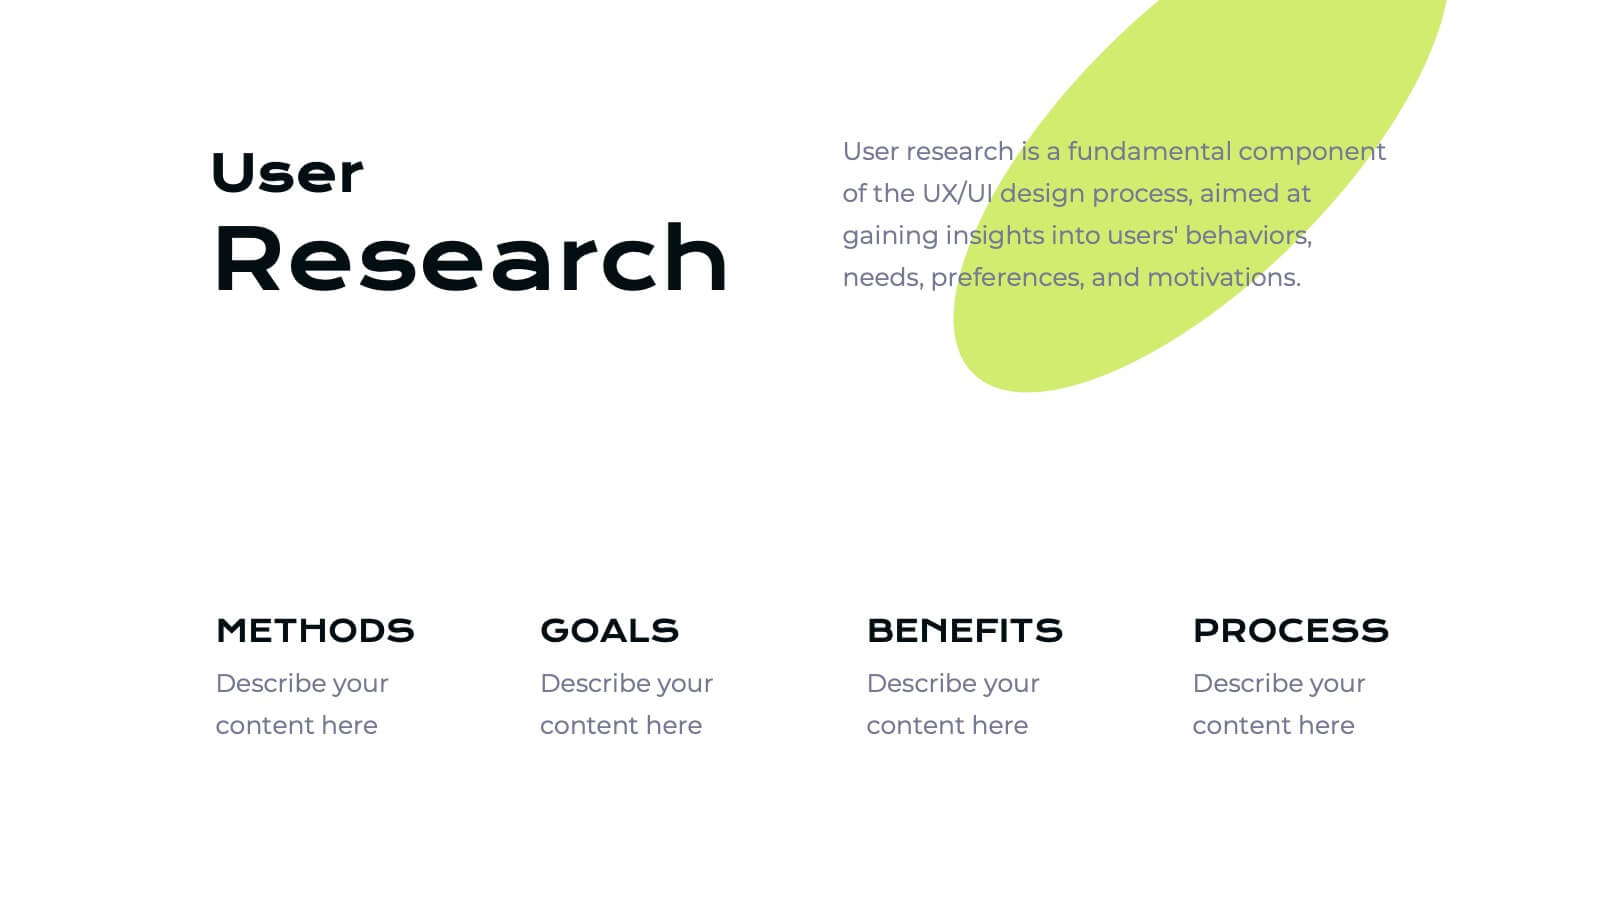
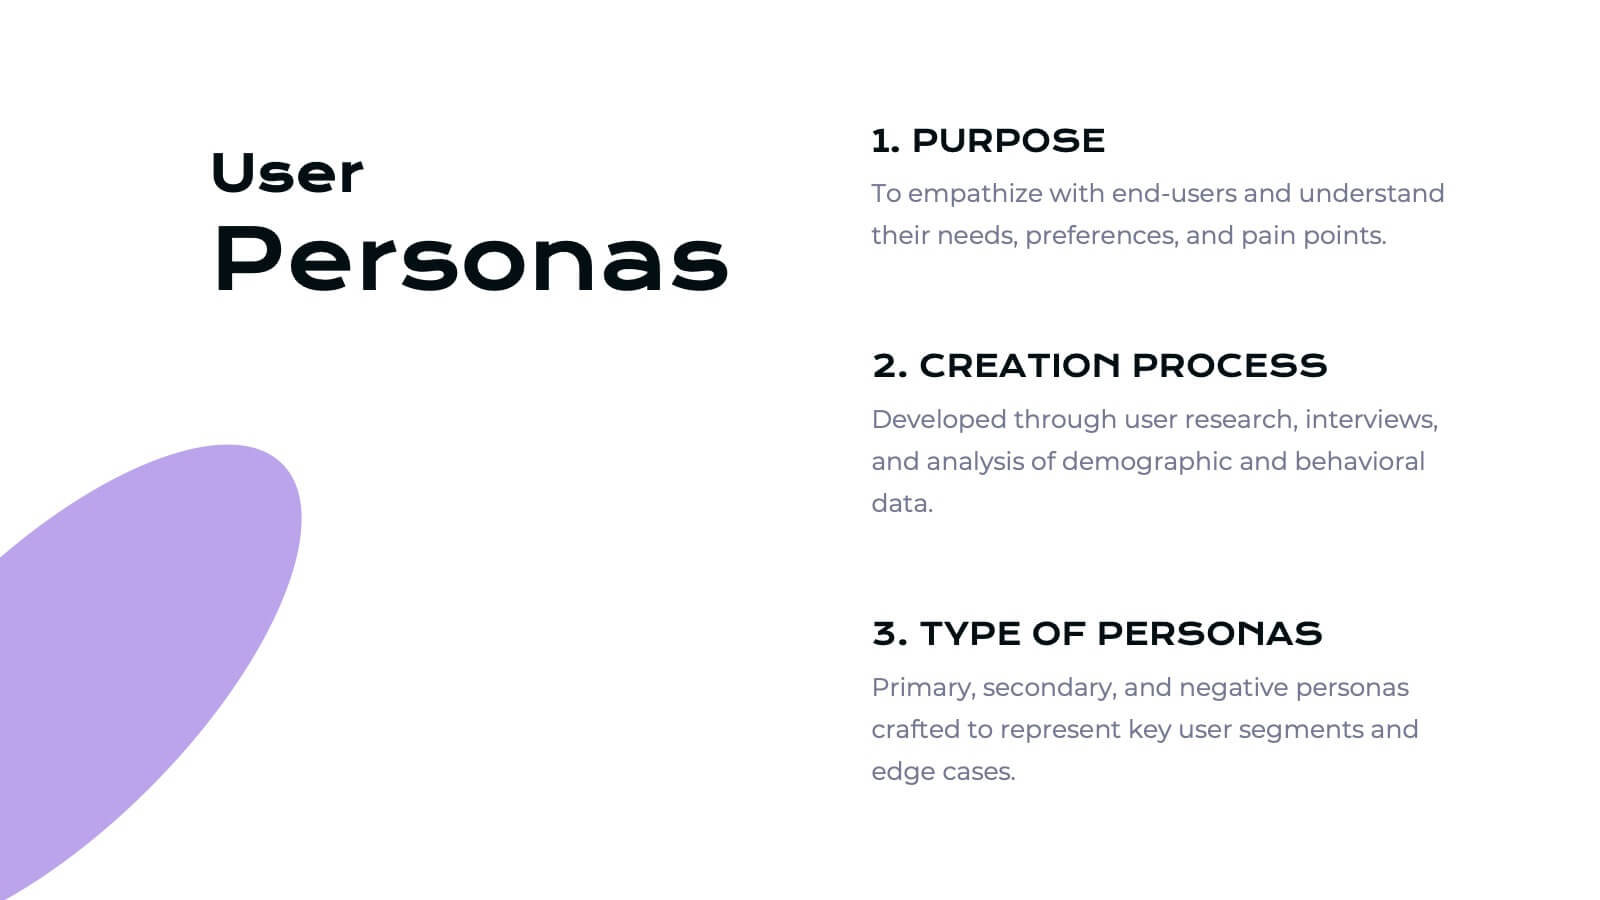
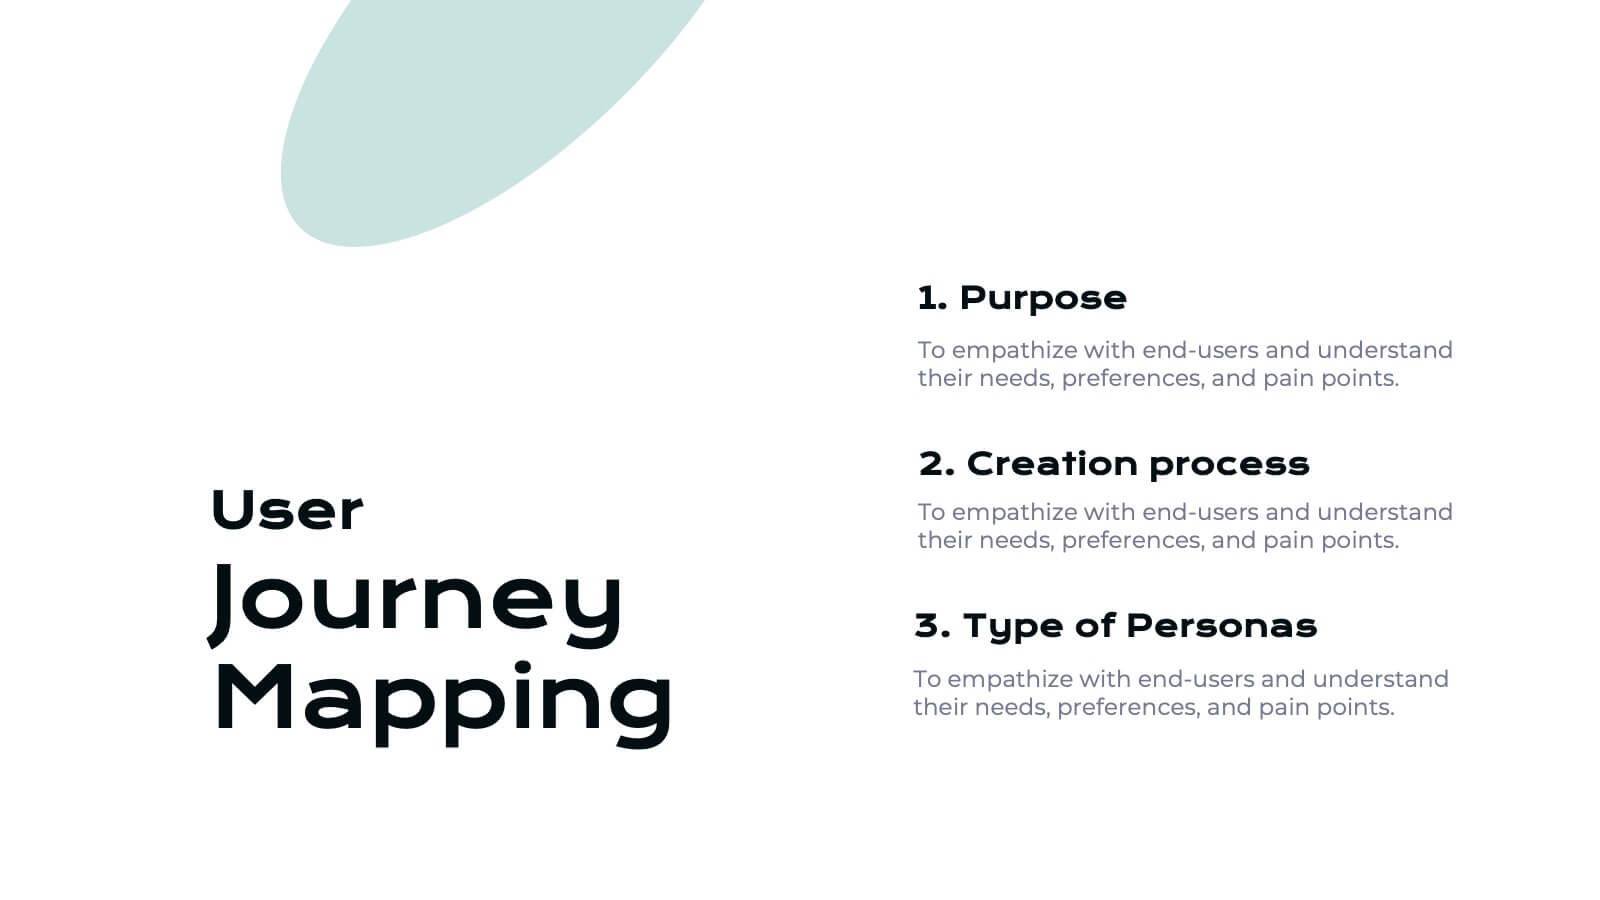
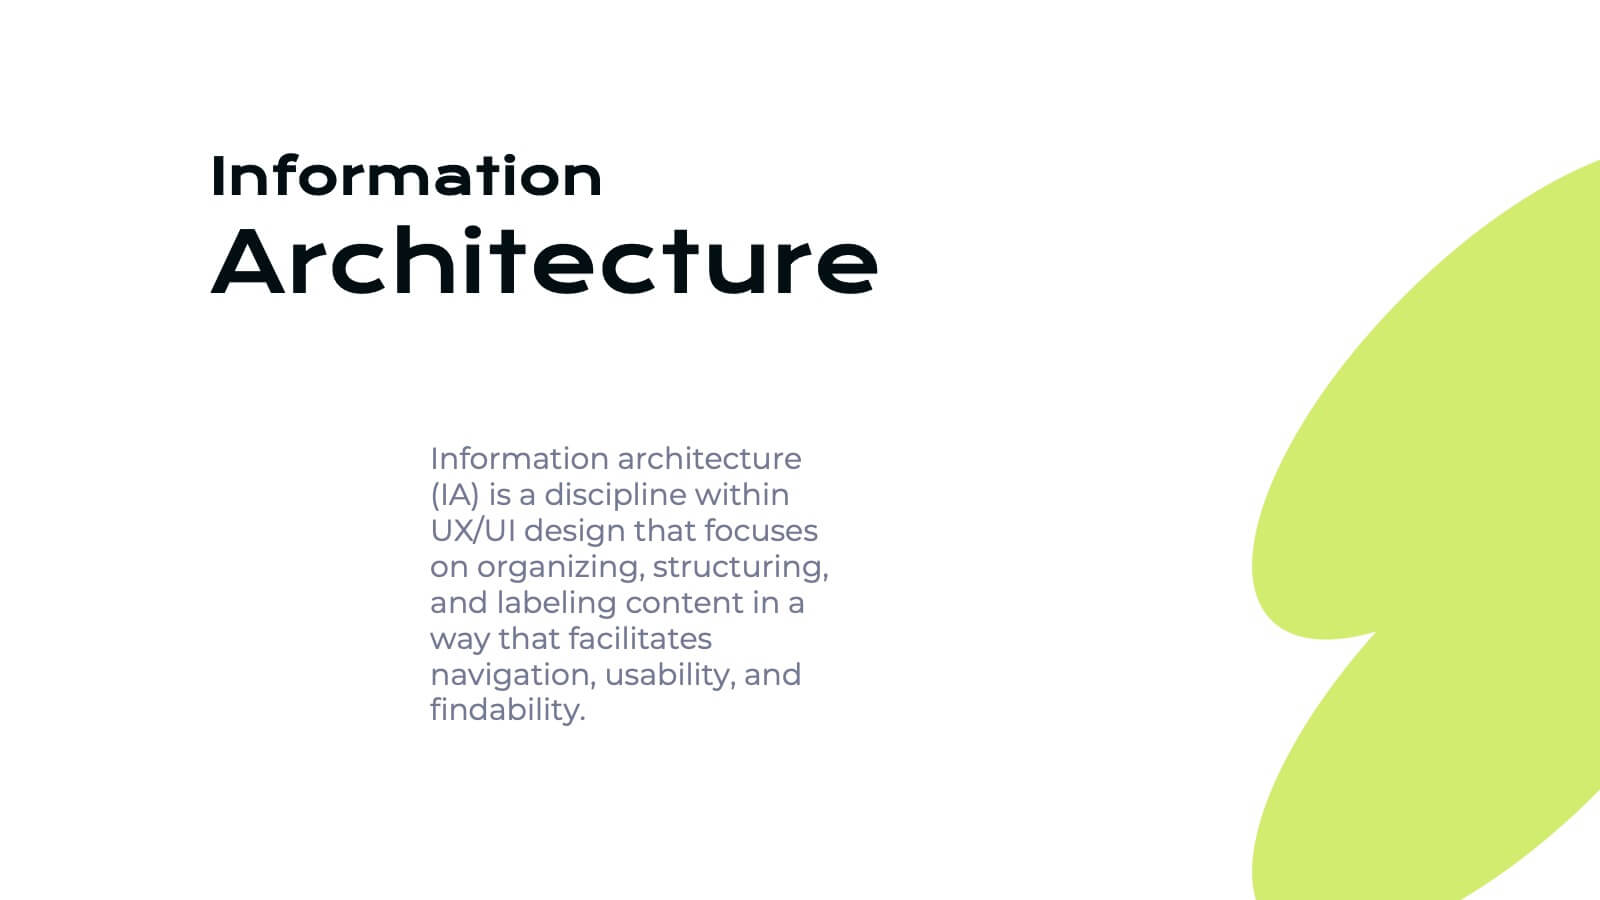
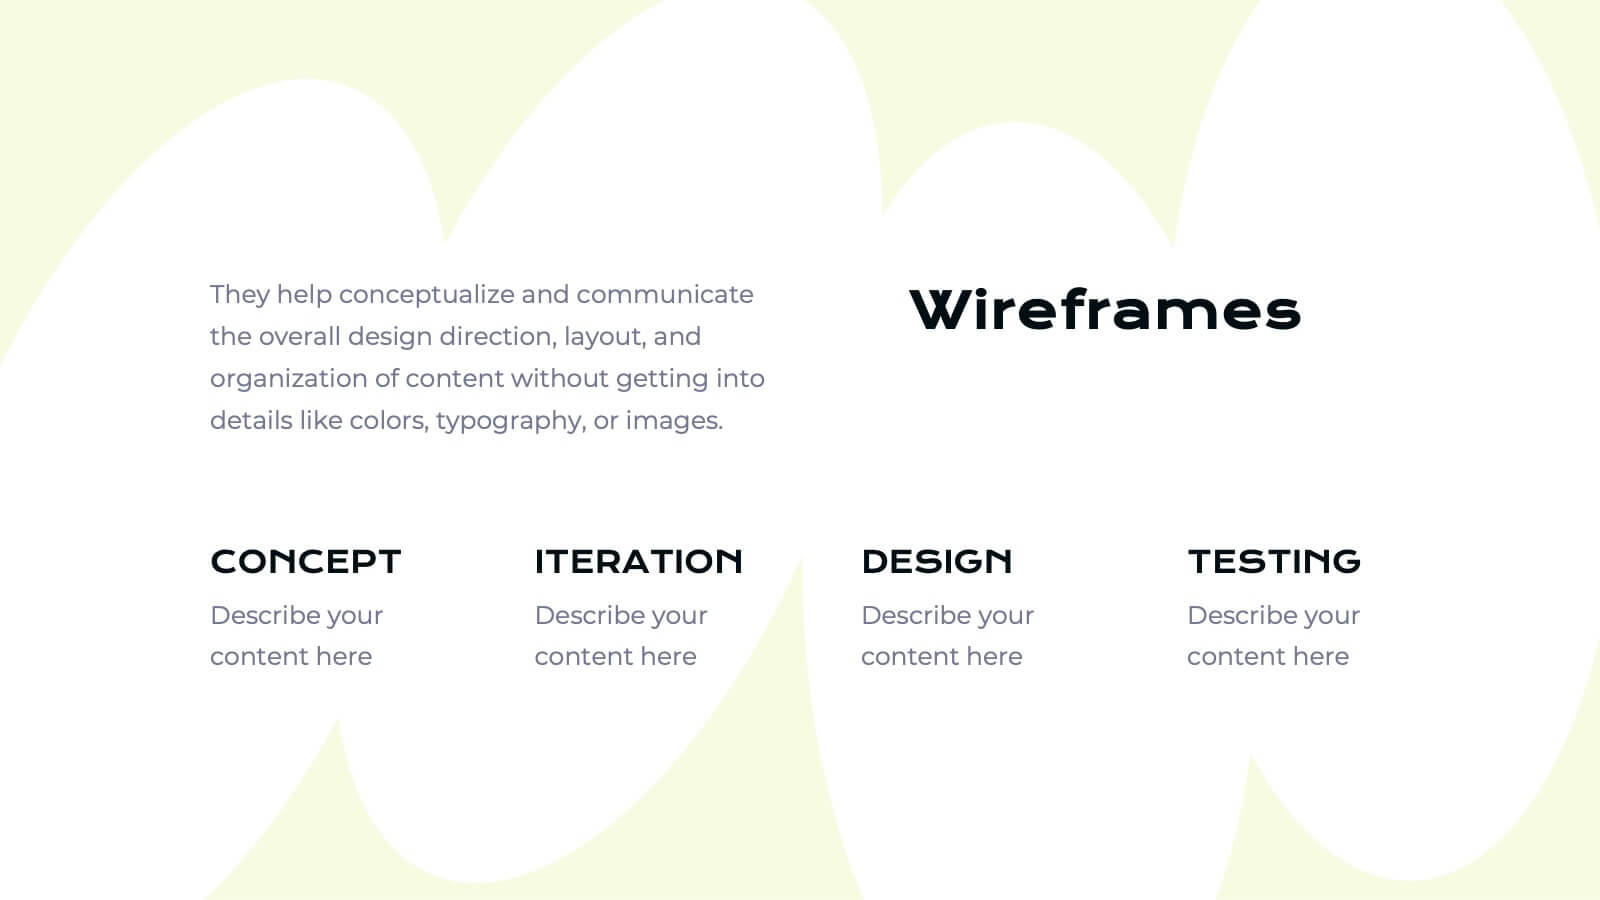
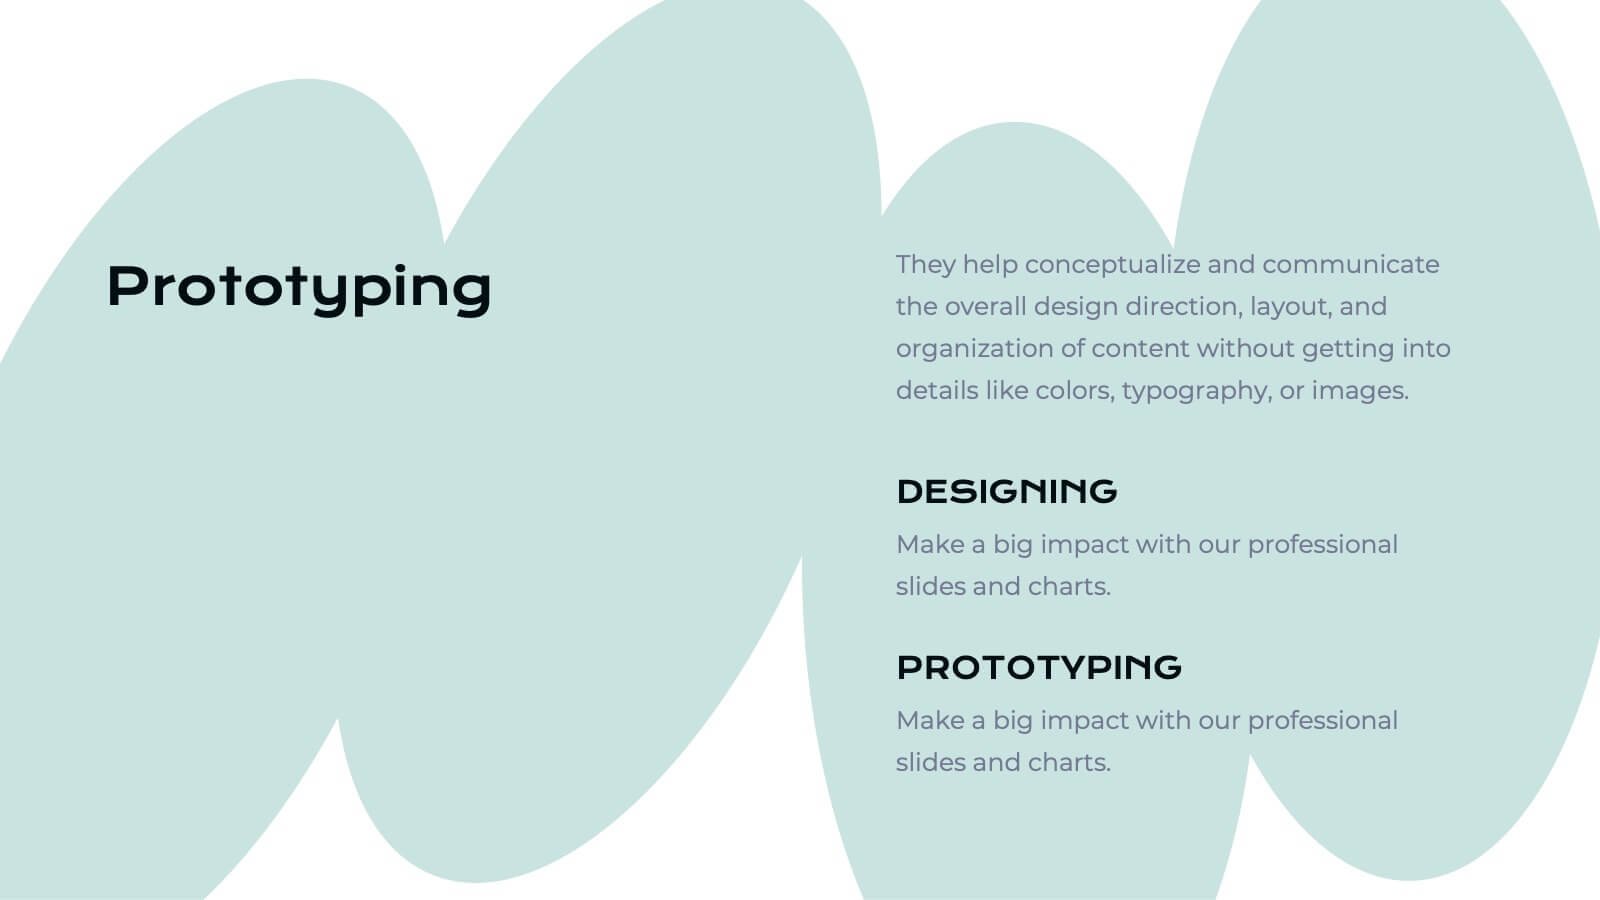
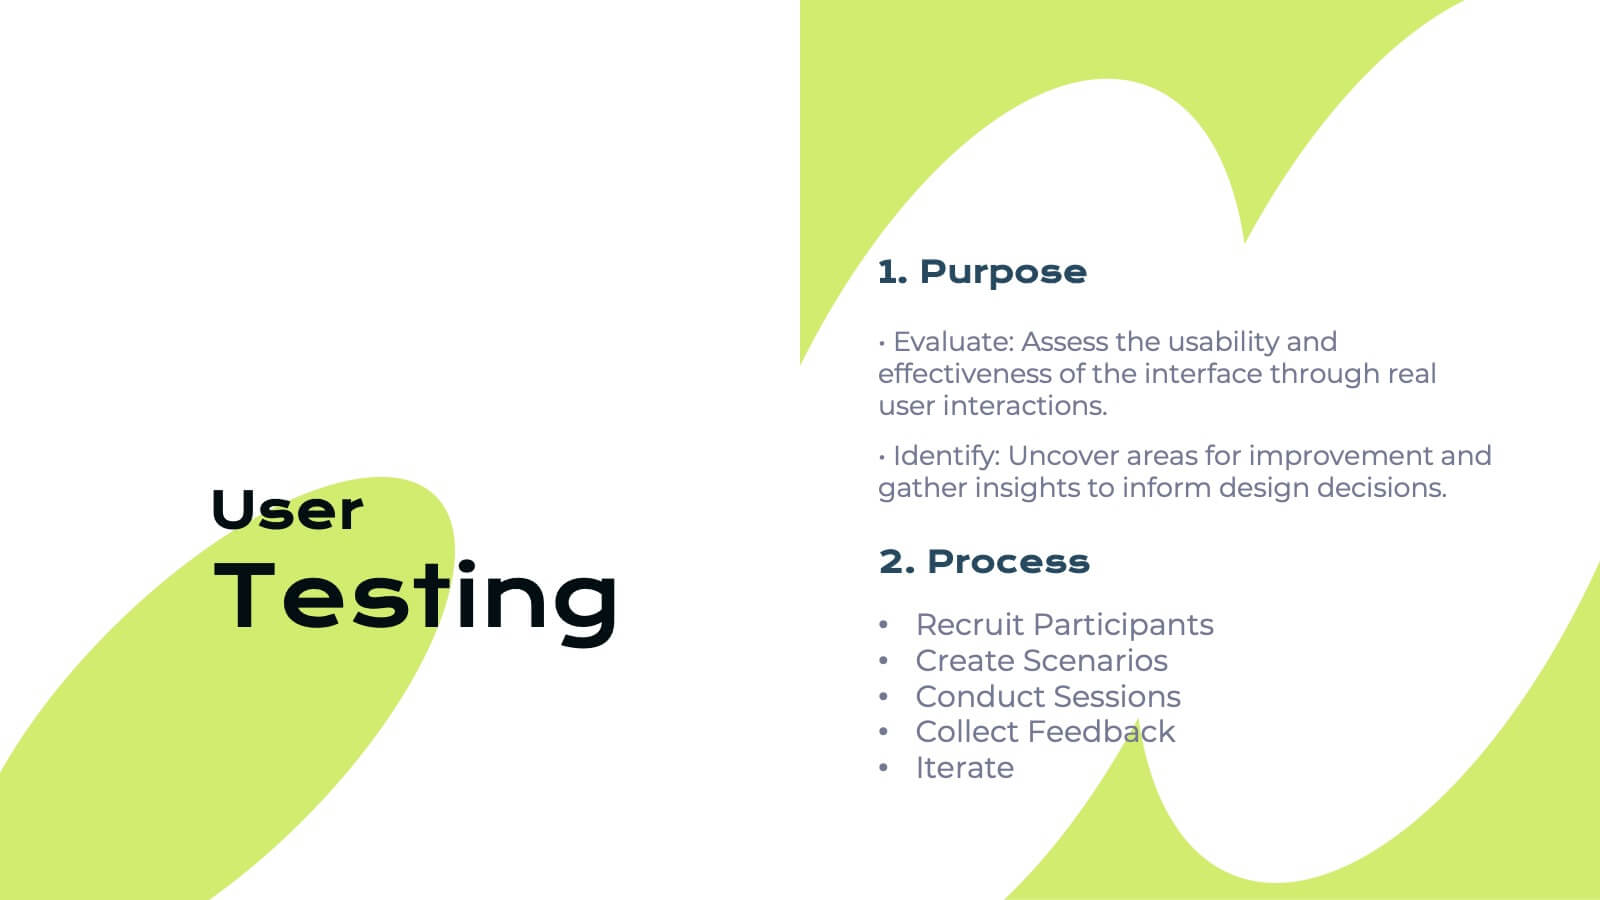
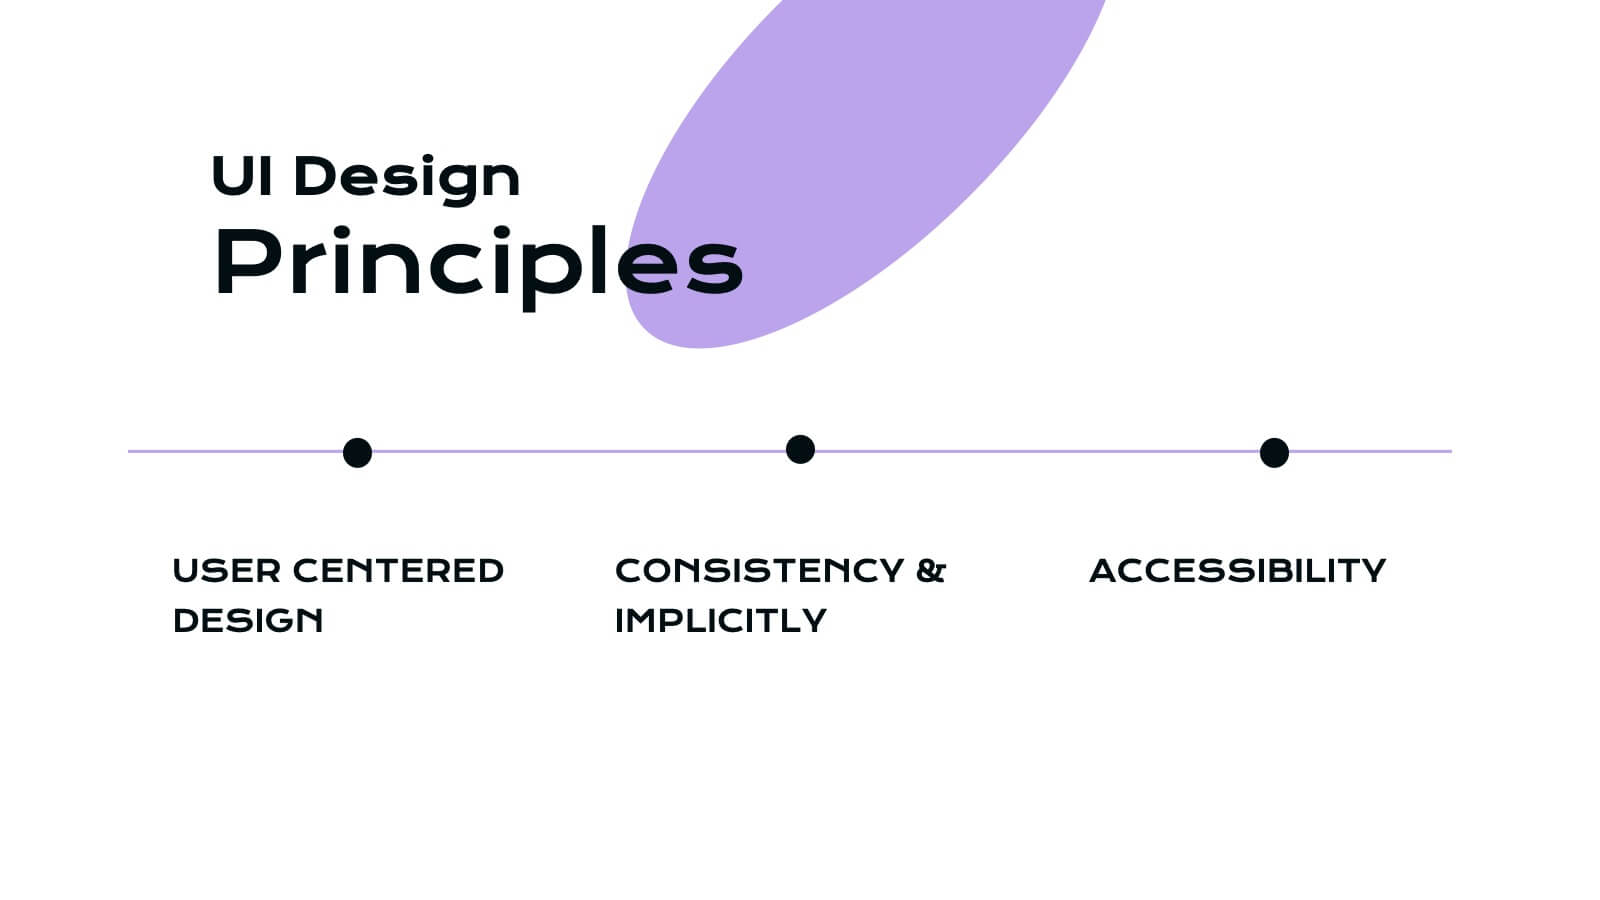
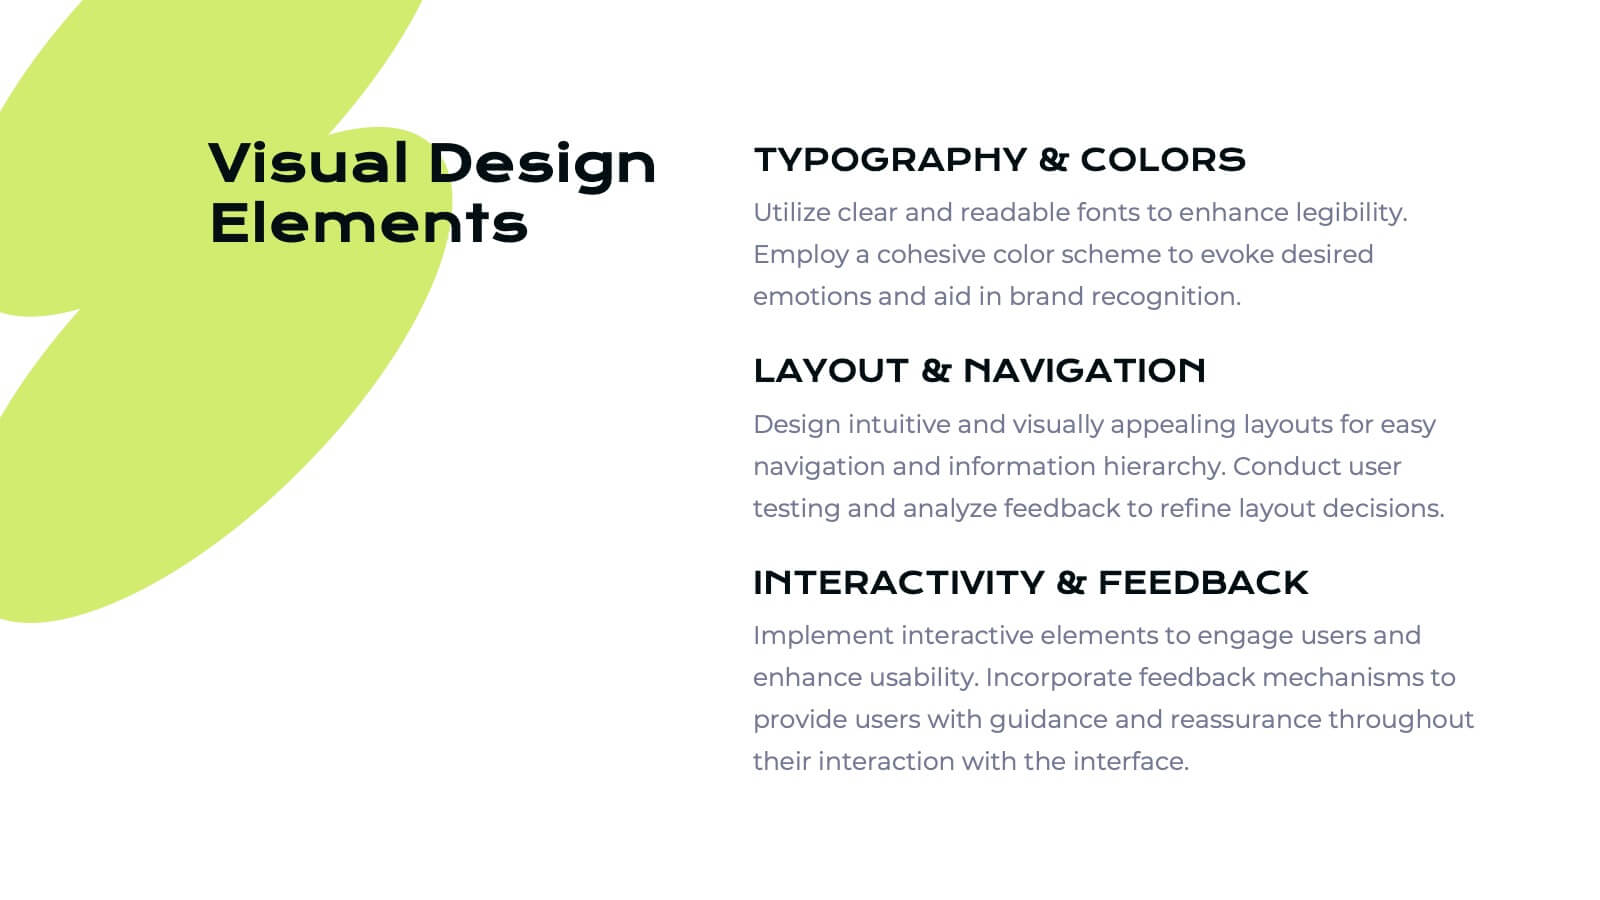
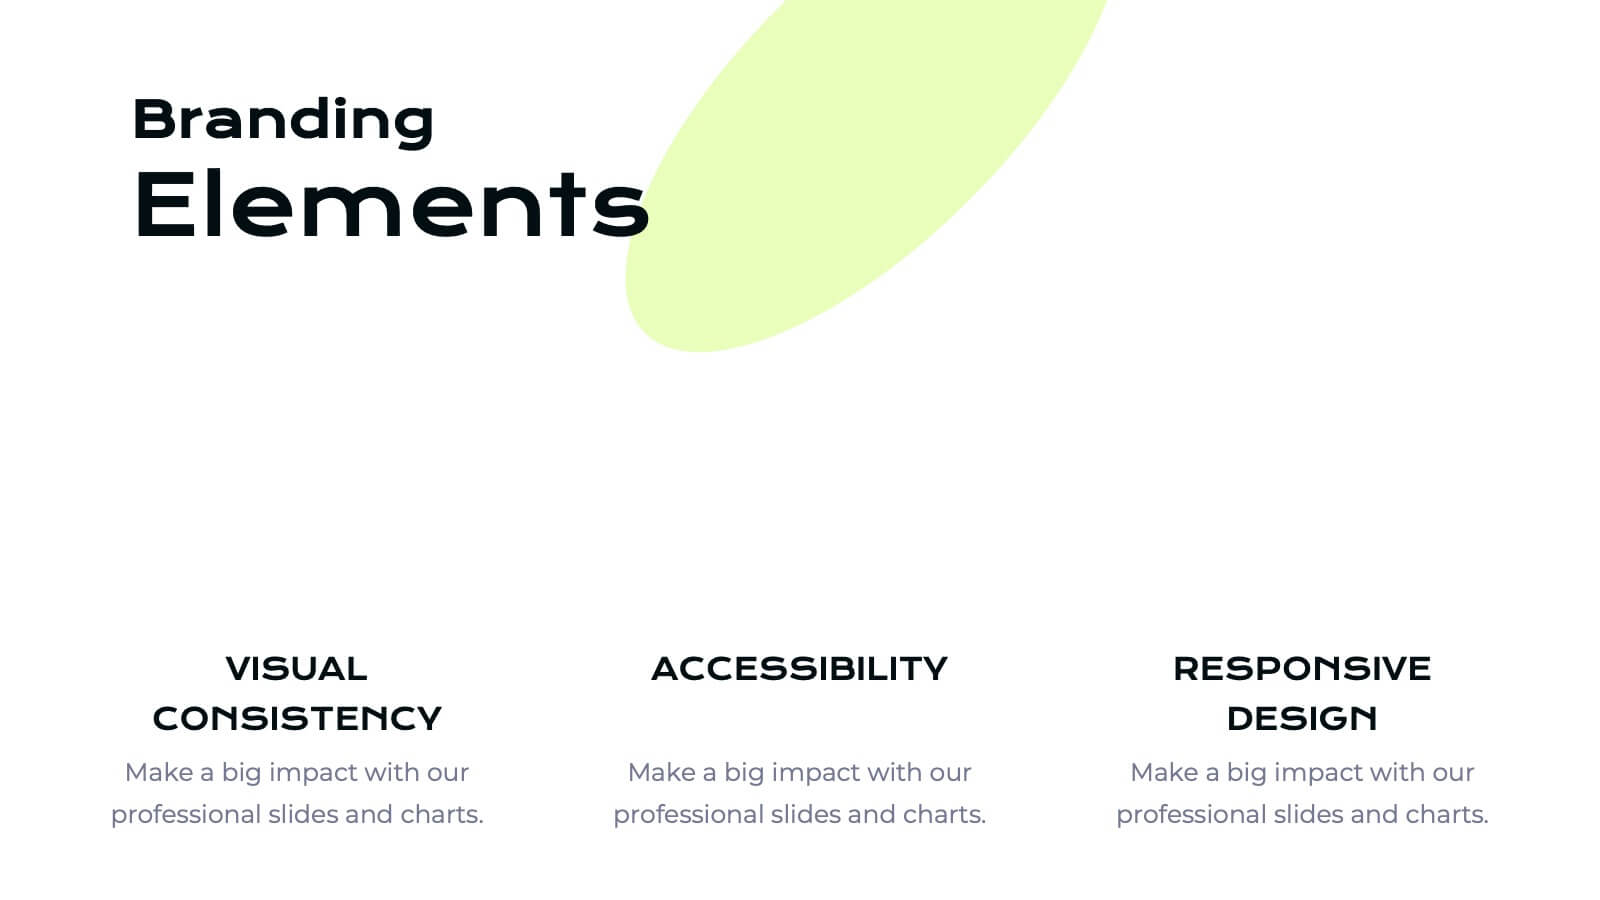
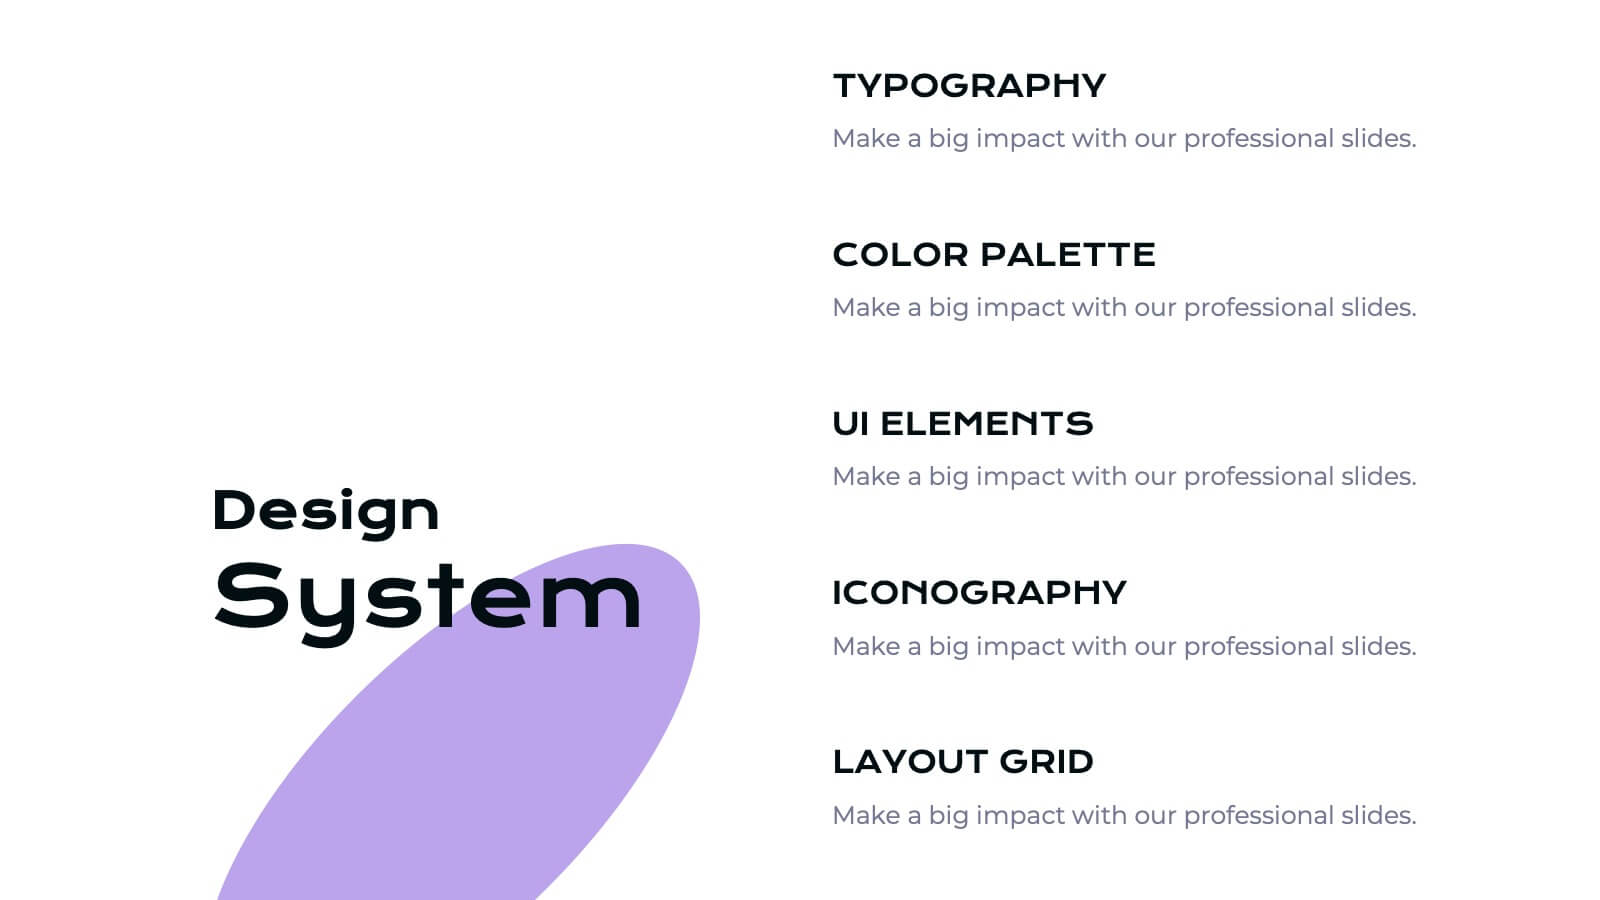
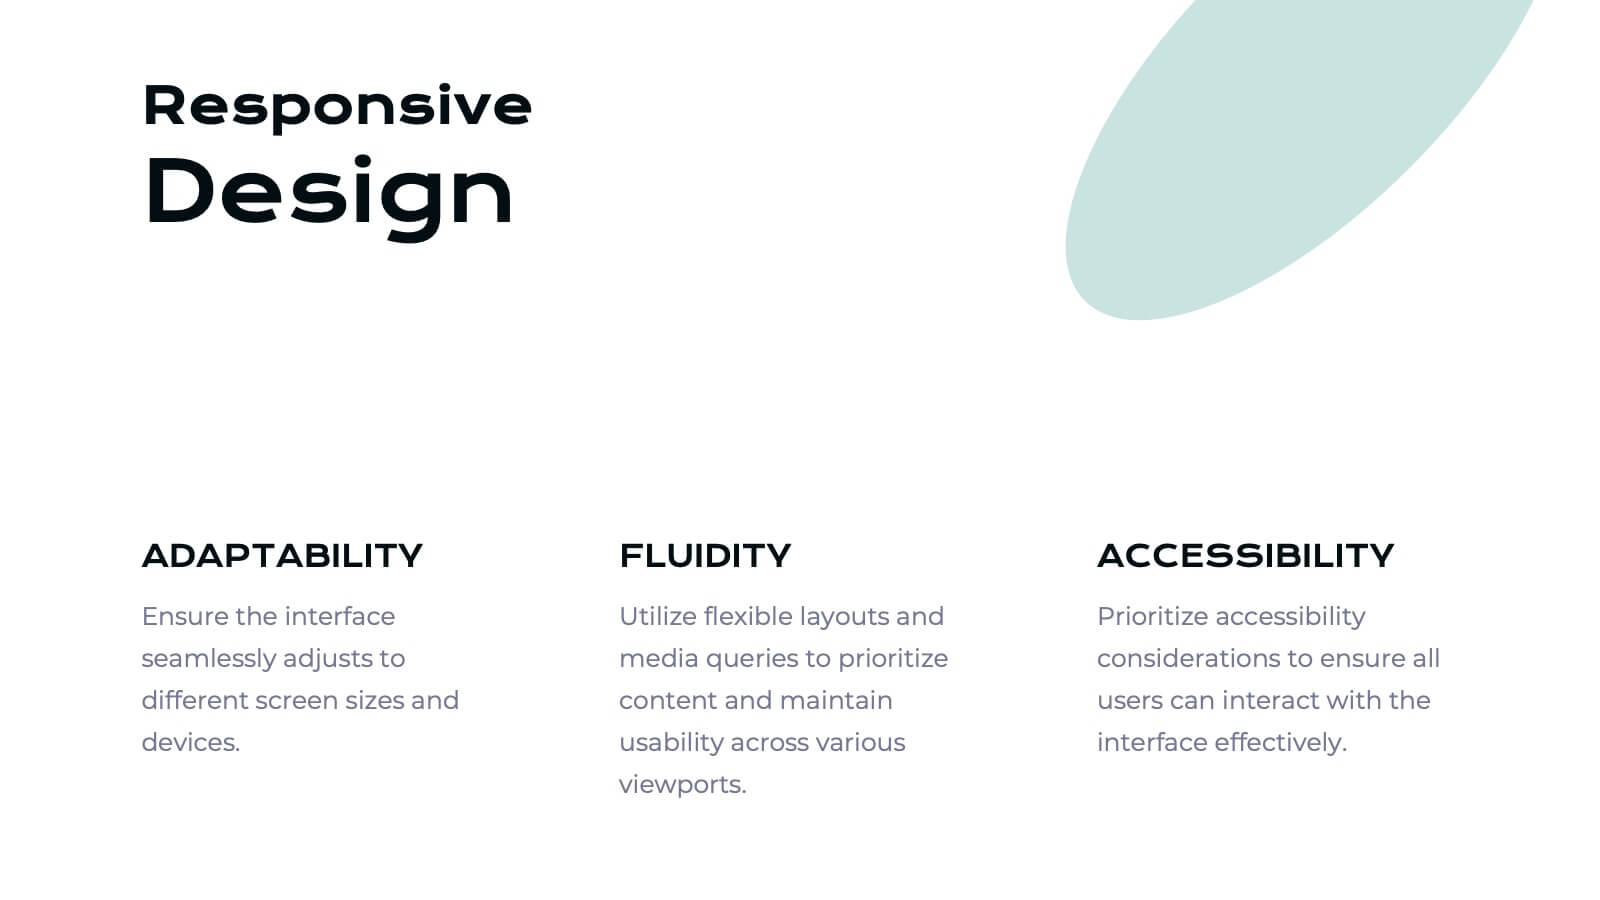
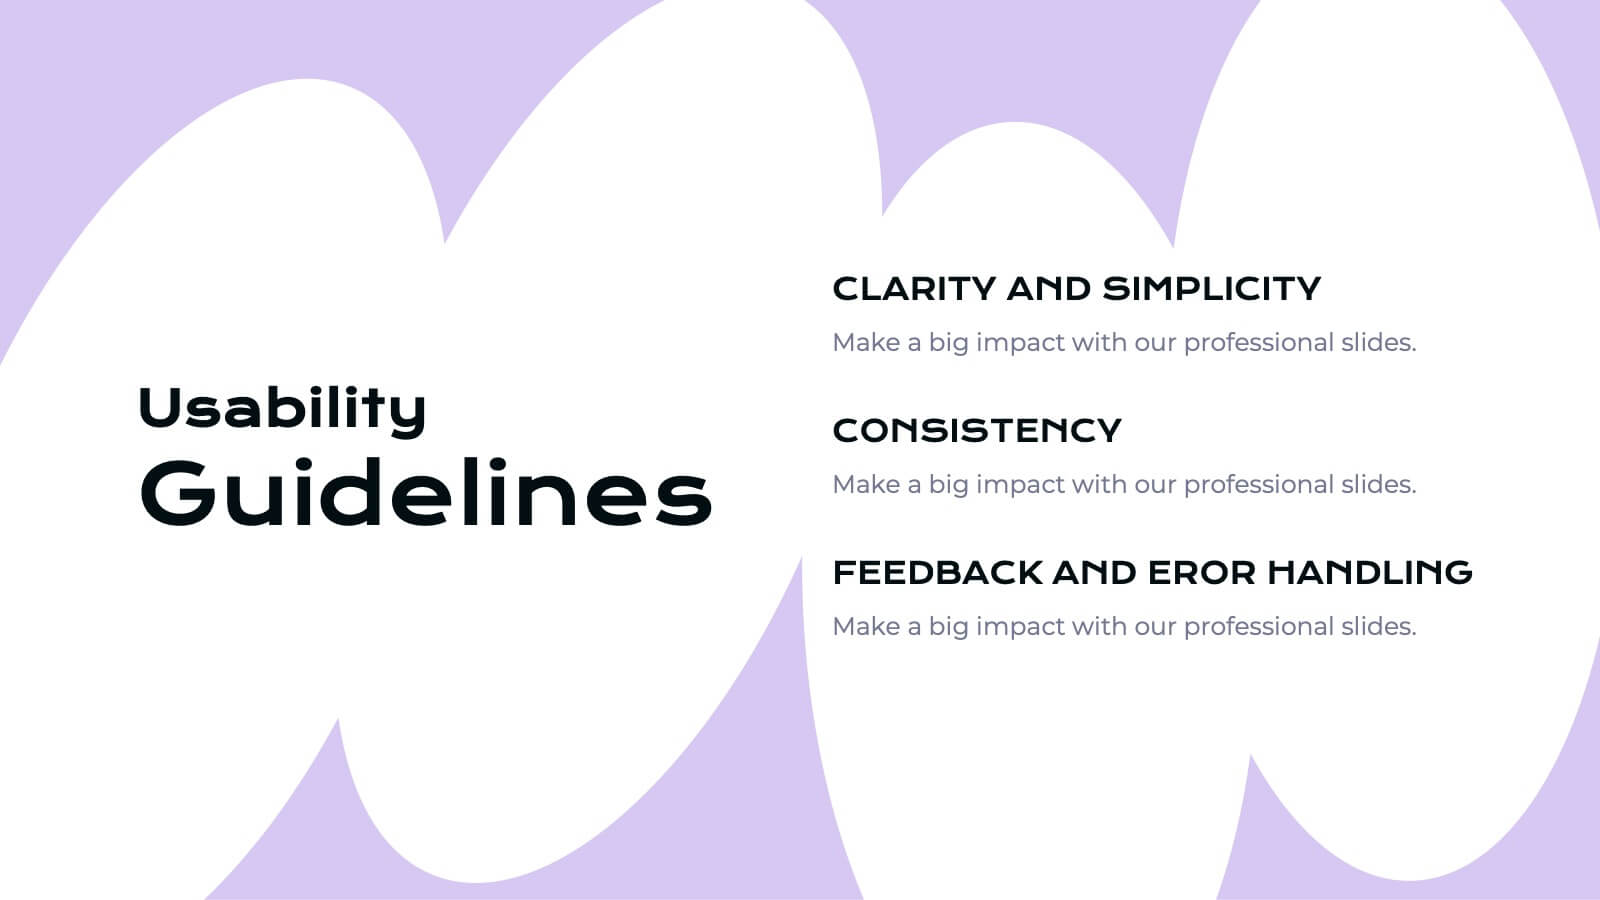
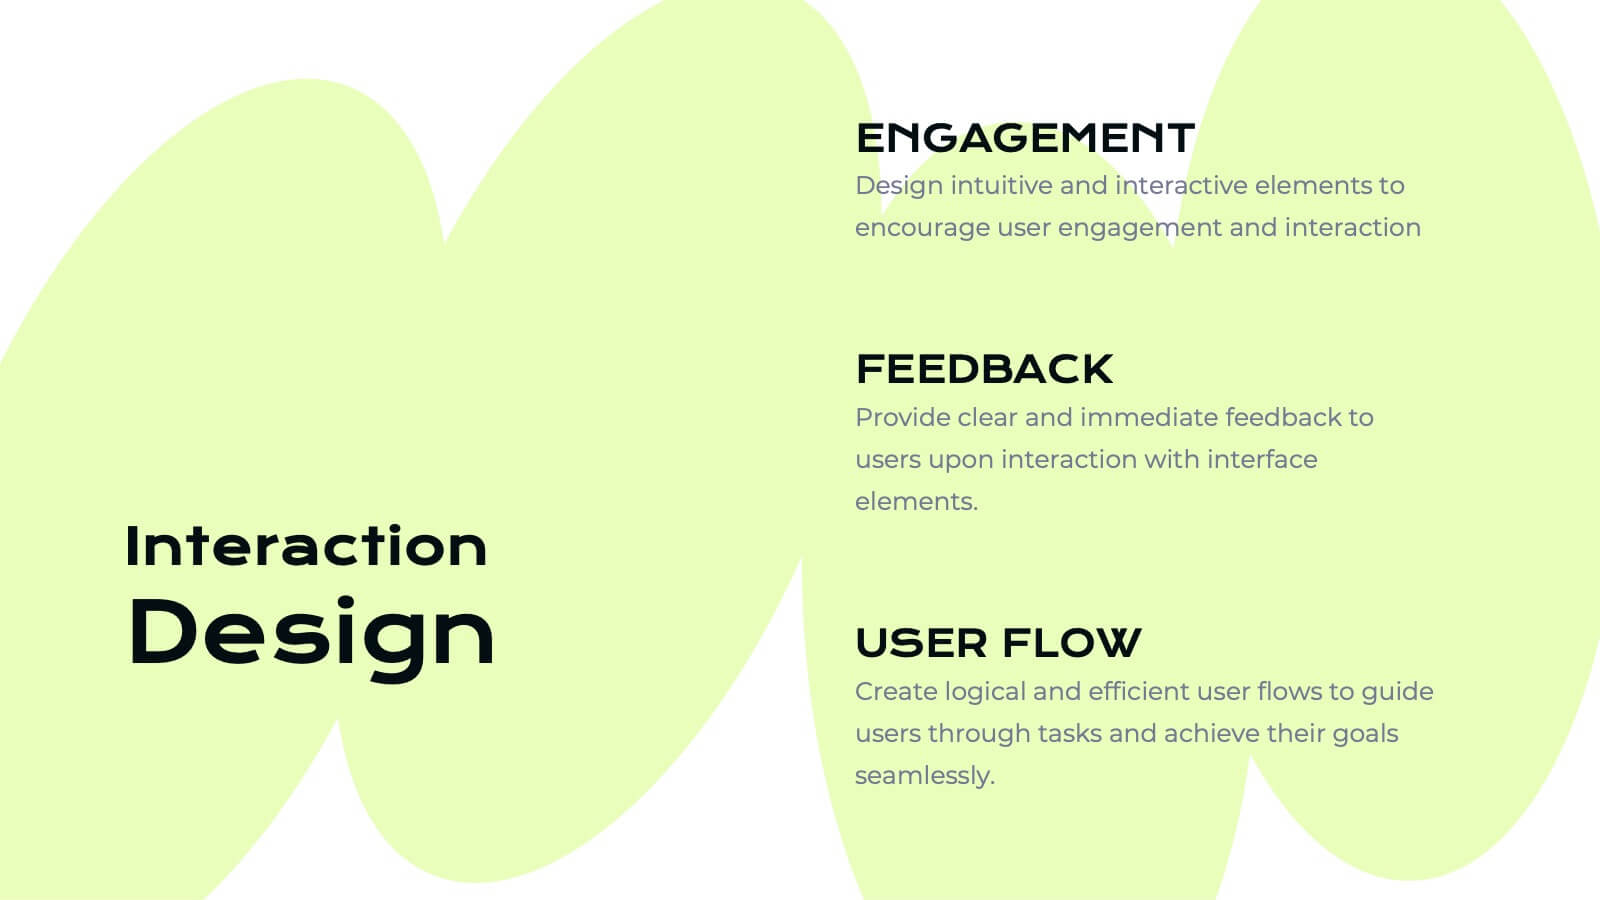
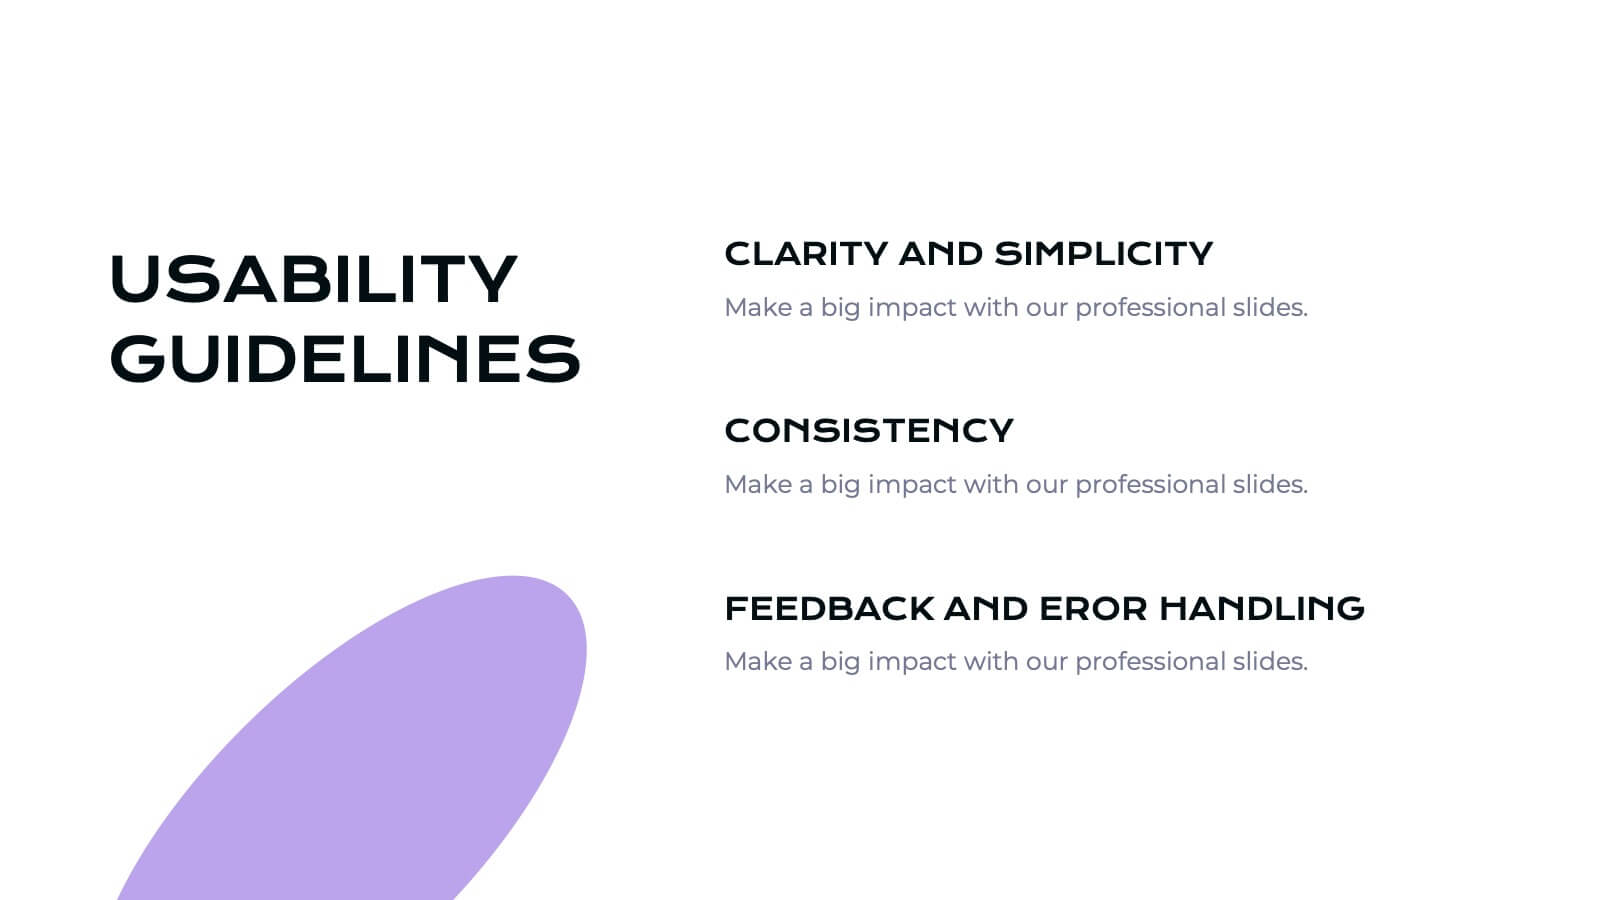
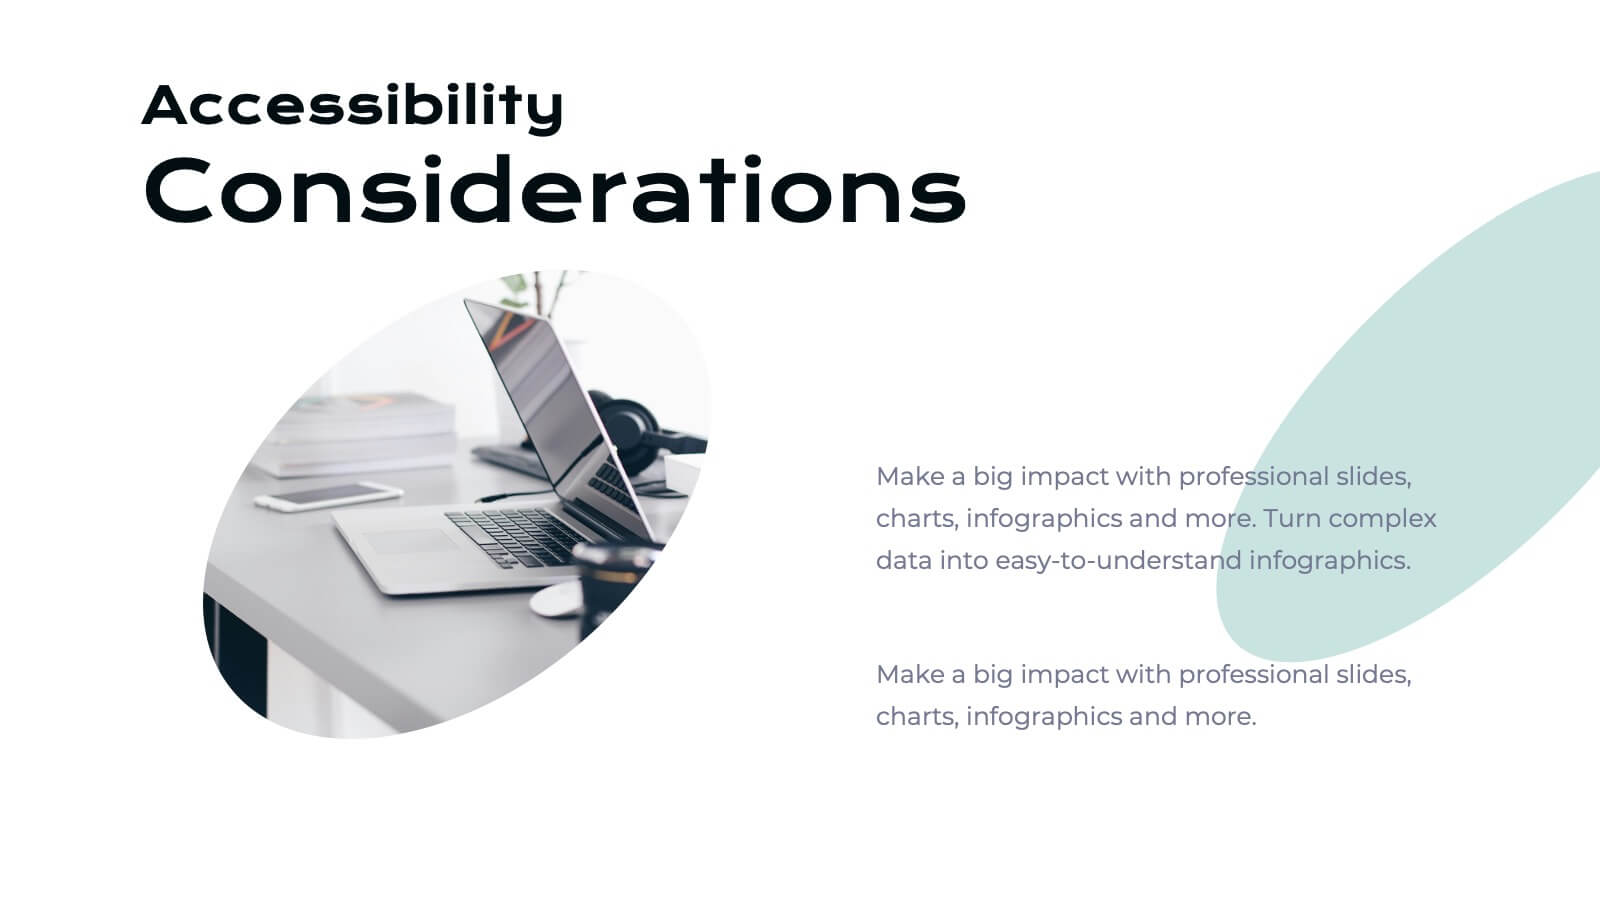
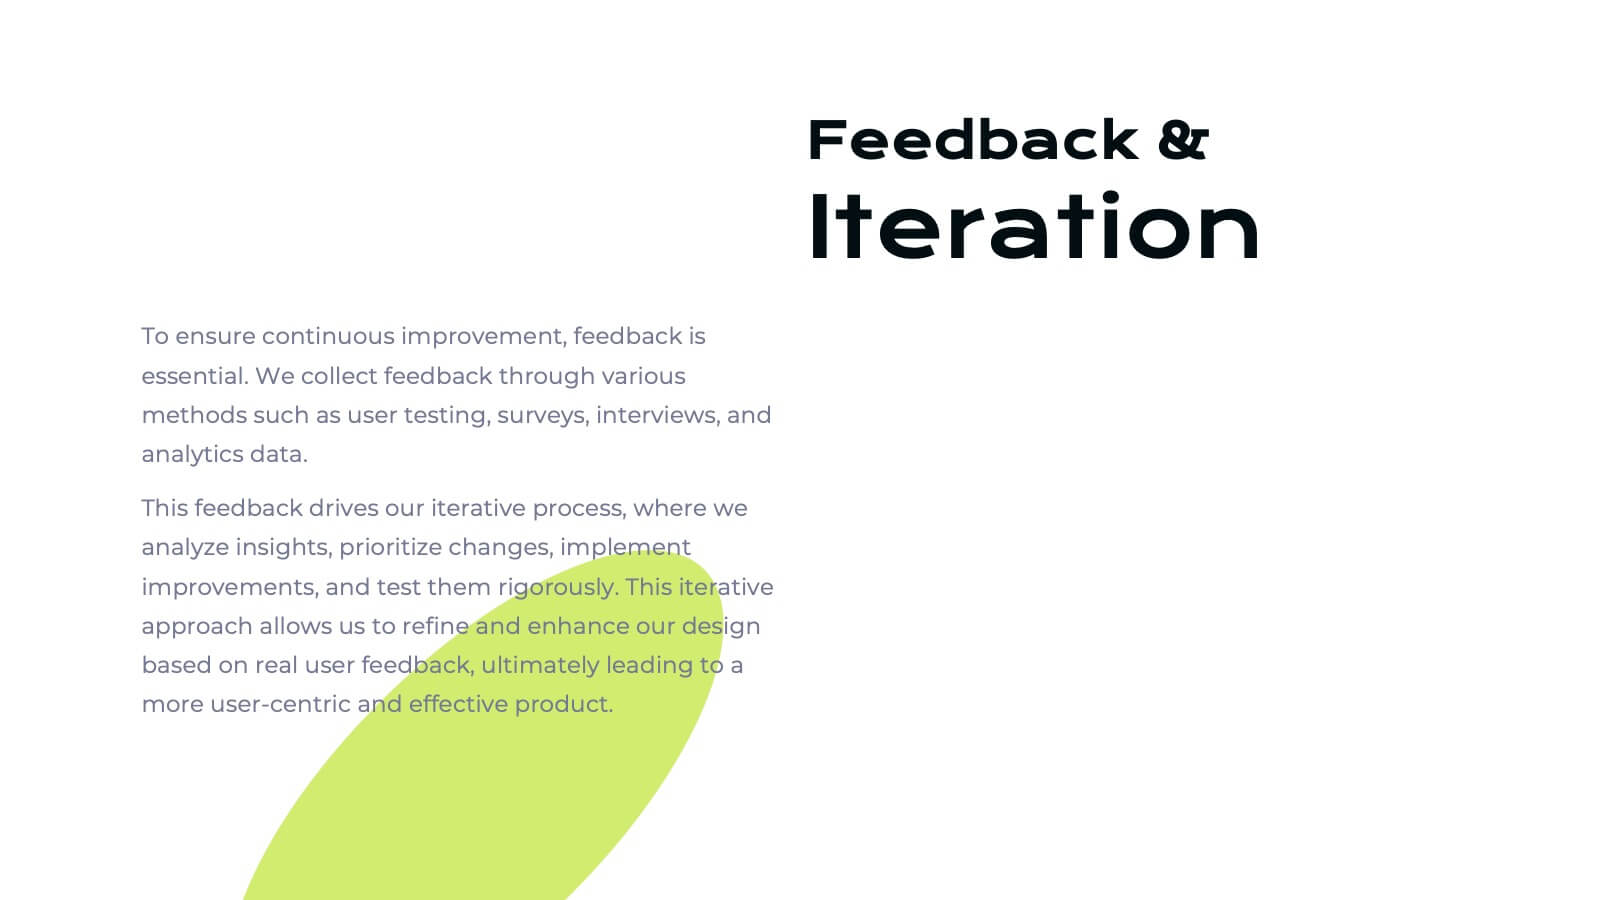
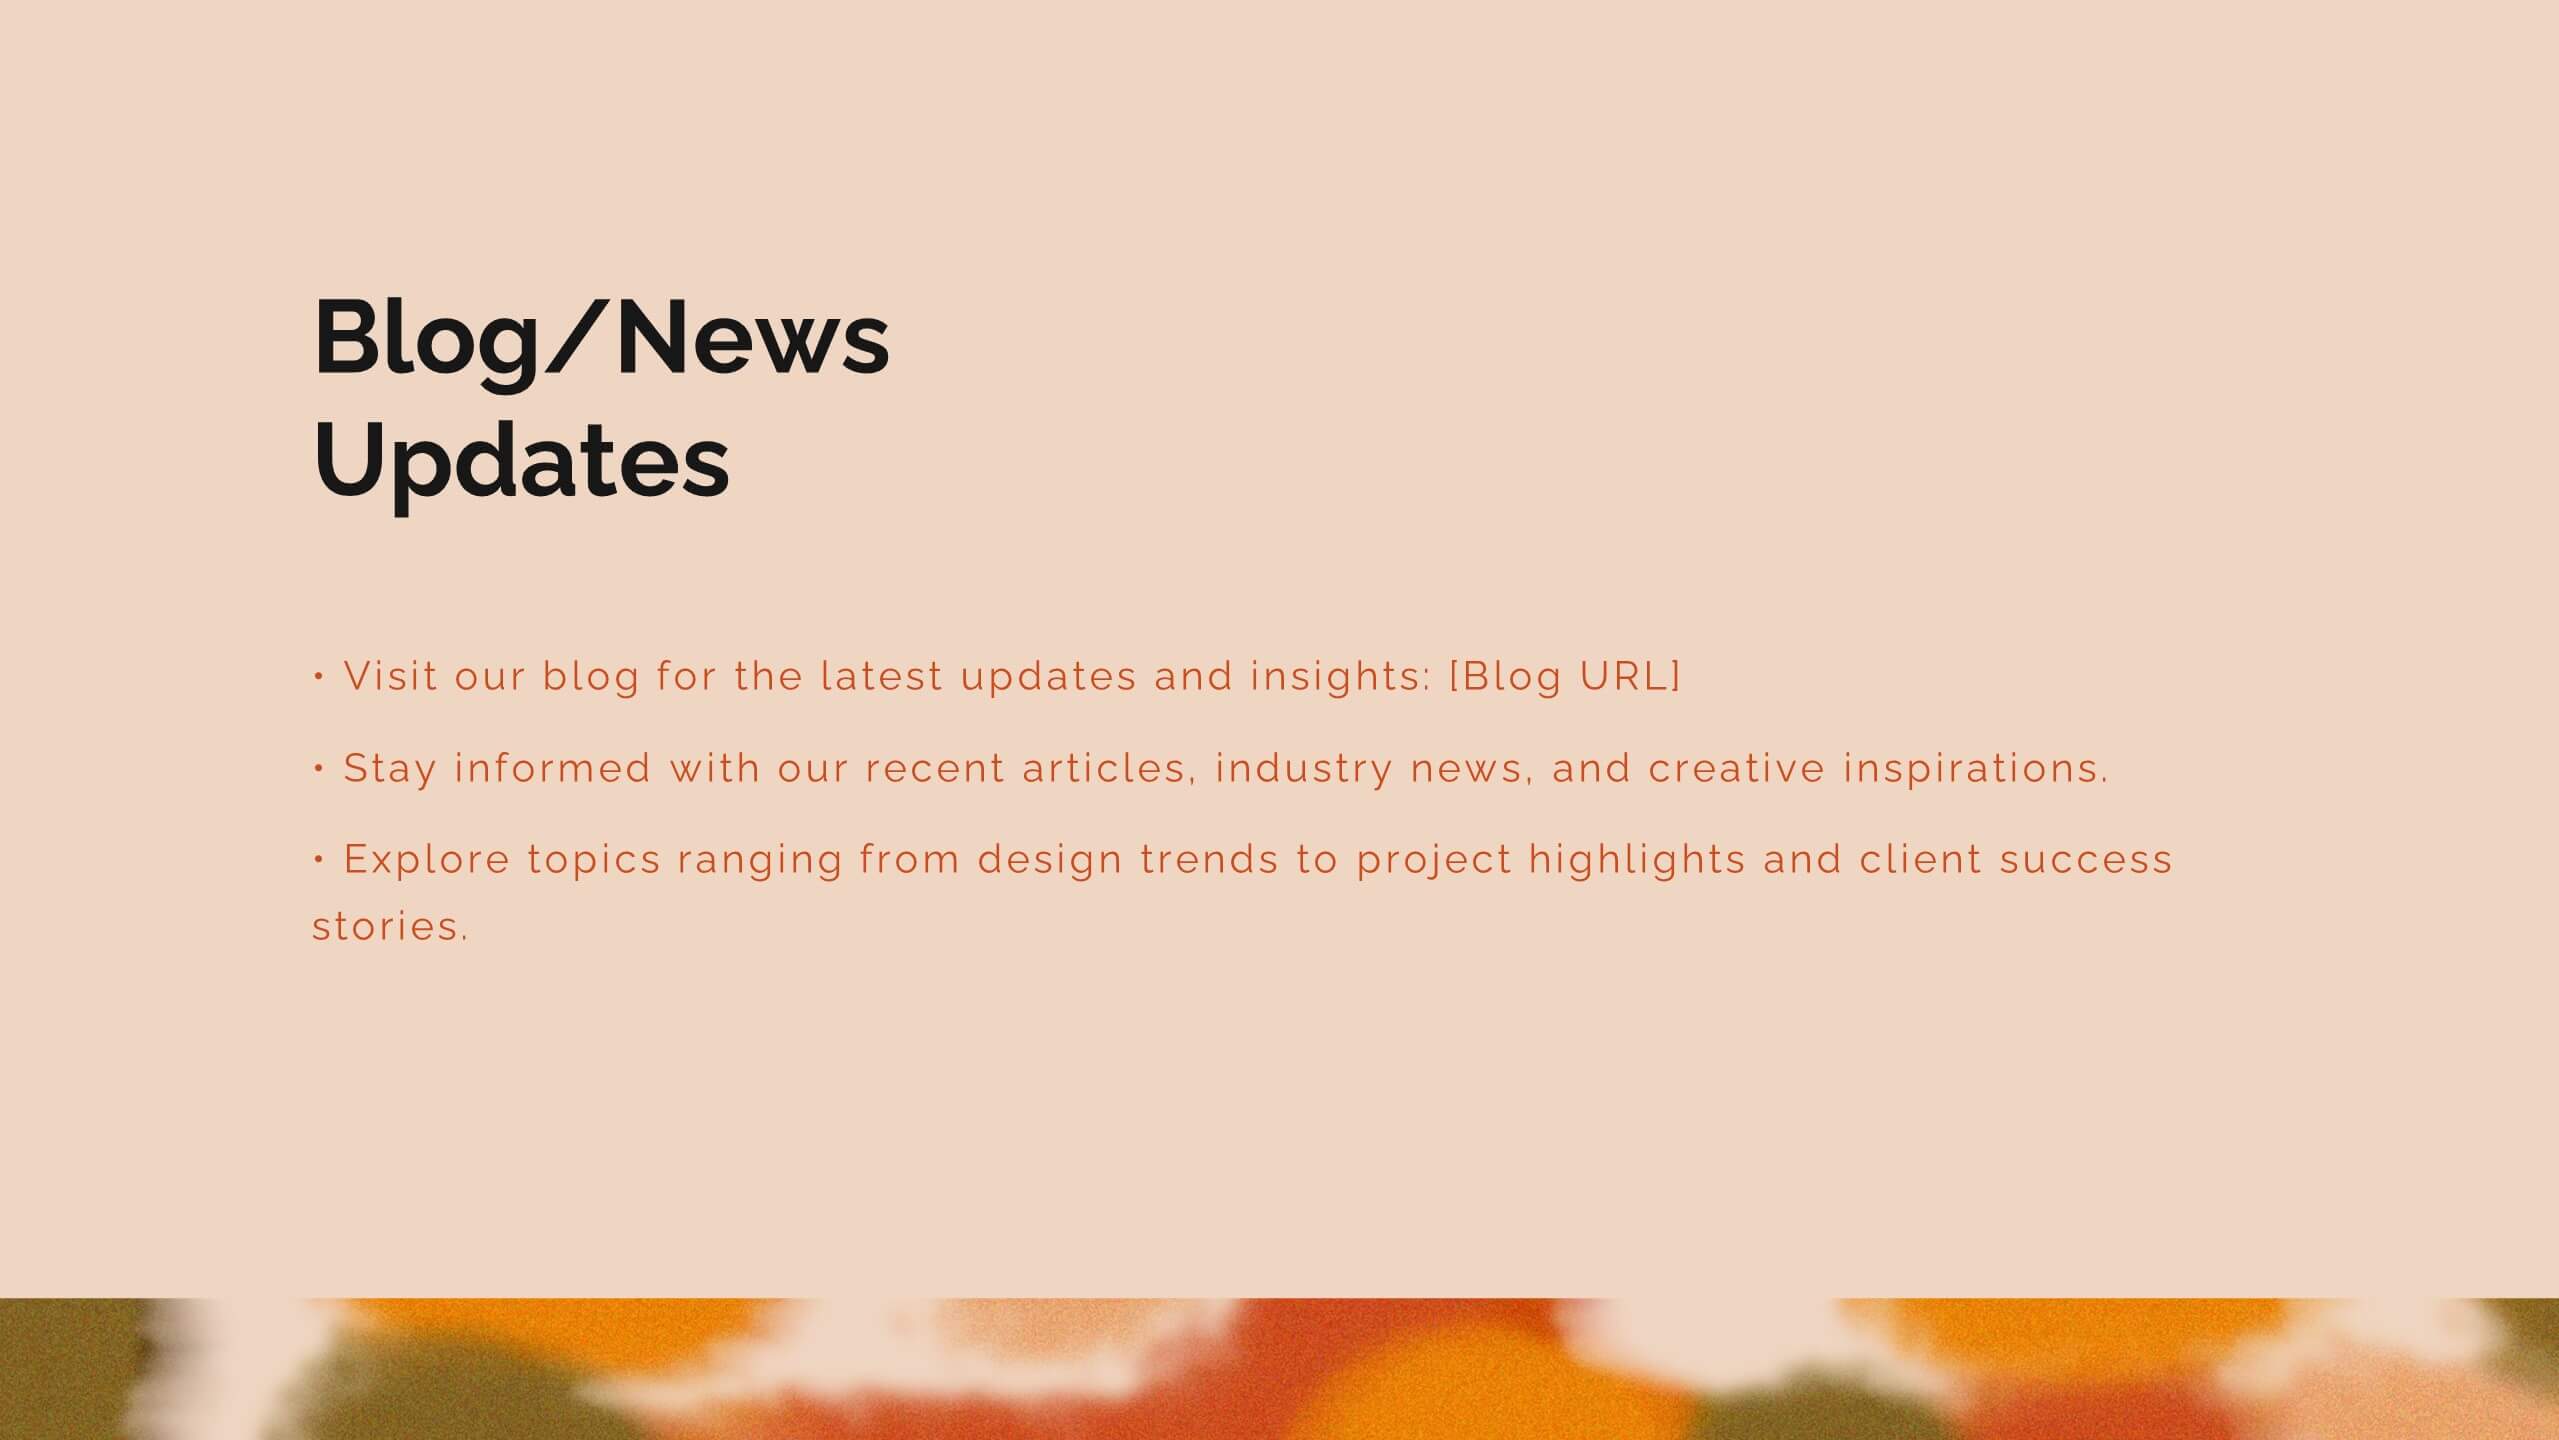
Ifrit User Experience Proposal Presentation
Unleash the power of great design with this fiery Ifrit-inspired presentation, perfect for delivering your user experience proposal! This template lets you showcase your UX strategies, research, and design process in a visually striking and well-organized format. Impress stakeholders with every slide. Compatible with PowerPoint, Keynote, and Google Slides.
4 diapositivas
Objectives and Results Strategy Tracking Presentation
Track progress with clarity using the Objectives and Results Strategy Tracking Presentation. This sleek, minimalist layout helps visualize how each objective connects to measurable outcomes along a strategic path. Ideal for OKR reviews, quarterly goal updates, and performance check-ins. Fully customizable in PowerPoint, Canva, Keynote, and Google Slides.


6 diapositivas
Business Framework Strategy Presentation
Dive into strategic planning with our Business Framework Strategy presentation template. This design brilliantly visualizes the essentials of business frameworks, guiding users through critical insights with a visually appealing, color-coded process. Ideal for strategists and planners, it offers a streamlined way to present complex information effectively. Compatible with PowerPoint, Keynote, and Google Slides, this template is a versatile tool for delivering impactful business strategies.


26 diapositivas
Mazen Presentation Template
Mazen is a multi-purpose template that’s perfect for any business. The colors and layout are clean and chic, and it’s suitable for all types of businesses, from small business accounts to large corporate companies. It also has a hip aesthetic with nude warm tones, while pictures and charts are easy to edit and easy to read so users can easily understand the information in them. Easy to use, high quality and many features make this template suitable for all kinds of businesses. Pictures and charts are also made for easy editing as well as easy readability without too much confusion on reading.


7 diapositivas
Technology Infographic Presentation Template
A technology infographic is a visual representation of information or data related to technology. The purpose of this template is to present your complex information in a simple, easy-to-understand manner. This template contains pre-designed layouts and images that can be used to structure your content in a variety of ways. This template is perfect to use to help explain technology-related topics such as software, hardware, cybersecurity, and more. Infographics are commonly used in the technology industry to help educate people about the latest trends, products, and services.


6 diapositivas
Risk Prevention and Security Measures Presentation
Enhance your safety strategy with this professional infographic slide. Designed to highlight five key risk and security areas, it features a clean, diamond layout with icon-based callouts. Ideal for business continuity plans, risk assessments, or compliance reports. Fully editable in PowerPoint, Keynote, and Google Slides.


21 diapositivas
Thunderbird Small Business Pitch Deck Presentation
Take flight with this dynamic Thunderbird-inspired presentation, perfect for pitching your small business! Designed to highlight your business model, market potential, and financial projections, this template ensures your pitch is clear, compelling, and professional. Its bold visuals will help you soar. Compatible with PowerPoint, Keynote, and Google Slides.


7 diapositivas
Sports Infographic Presentation Template
A sports infographic is a visual representation of information or knowledge related to a sport or sporting event. This template allows you to include statistics, performance metrics, records, and other relevant data that helps to explain and showcase the sport. Our sports infographic also include images, illustrations, and other graphic elements that can help to tell a story. They can be used in a variety of settings. The goal of this sports infographic is to present your information in a clear and engaging way, and to help your audience understand and appreciate the sport more deeply.


5 diapositivas
Music & Arts Infographics
Music and Arts enrich our lives, stimulate our senses, and foster personal growth this plays a significant role in our lives and society. These infographic templates are perfect for promoting understanding and appreciation for music and arts. These can be used in educational settings, cultural organizations, or for personal enrichment, this template effectively conveys the significance of music and arts in our lives and inspires the audience to explore and engage with these creative expressions. These infographics include text boxes, icons, and color schemes that can be customized to fit your brand.


7 diapositivas
Creative Tables Of Content Infographic
A creative table of contents is a visually appealing and innovative way of presenting the structure and contents of a document, report, book, or any written work. Our infographic template is an aesthetically pleasing and insightful map to your content landscape. This infographic is not just a guide; it's a visually engaging journey through your ideas and topics, promising a delightful and organized user experience. Fully customizable and compatible with Powerpoint, Keynote, and Google Slides. This creative table of contents uses design elements, colors, typography, and graphics to make it engaging and eye-catching.


24 diapositivas
Copper Small Business Pitch Deck Presentation
Elevate your business presentations with this clean and professional pitch deck template! Ideal for team meetings, business updates, or investor pitches, it includes sections for collaboration opportunities, performance metrics, and process improvements. The layout ensures clarity and focus, making it perfect for effective communication. It’s fully customizable and works seamlessly with PowerPoint, Keynote, and Google Slides for hassle-free integration.


4 diapositivas
USA, Canada & Mexico Business Reach Presentation
Showcase your regional presence with the USA, Canada & Mexico Business Reach Presentation. This slide helps you pinpoint key business activities or initiatives across North America using colorful map markers and customizable icons. Ideal for market updates or growth plans. Fully editable in Canva, PowerPoint, and Google Slides.


10 diapositivas
Organizational Hierarchy Infographic Presentation
Clearly define your Organizational Hierarchy with this structured infographic template. Designed for business presentations, HR teams, and corporate strategy, this visual layout simplifies reporting structures, leadership roles, and team organization. Fully customizable and easy to edit in PowerPoint, Keynote, and Google Slides, making it perfect for internal communications and management reports.


20 diapositivas
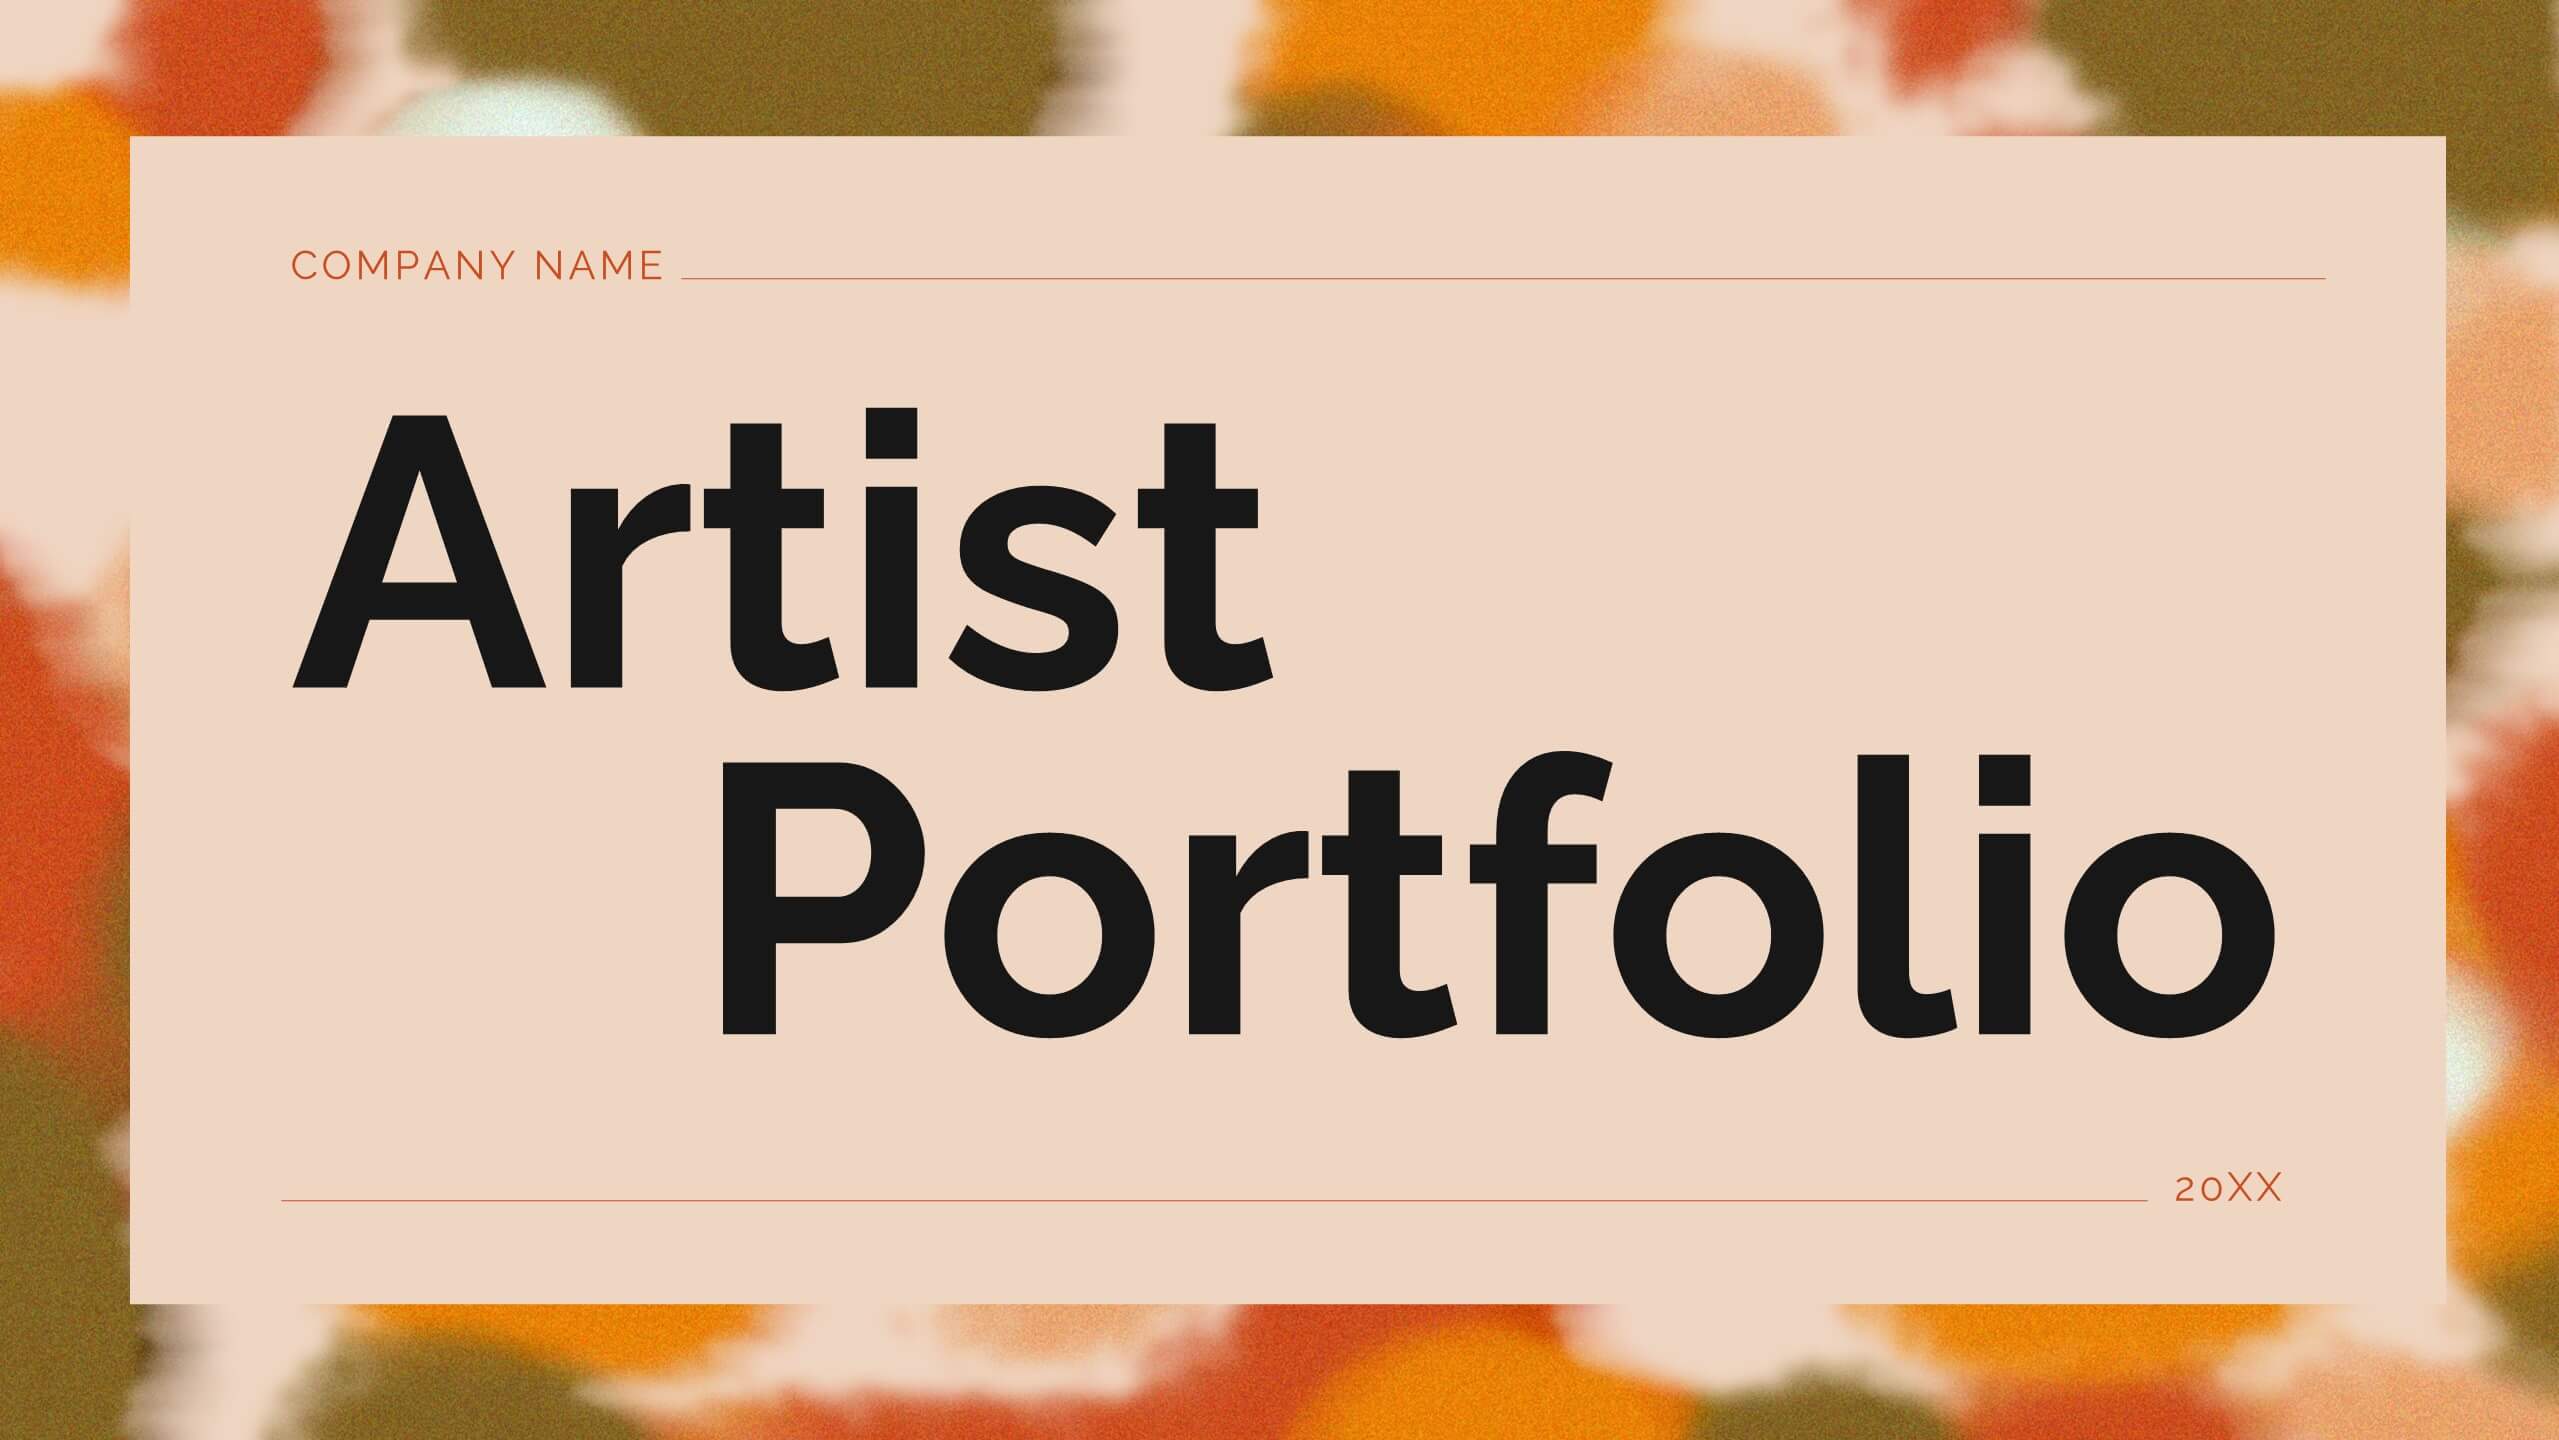
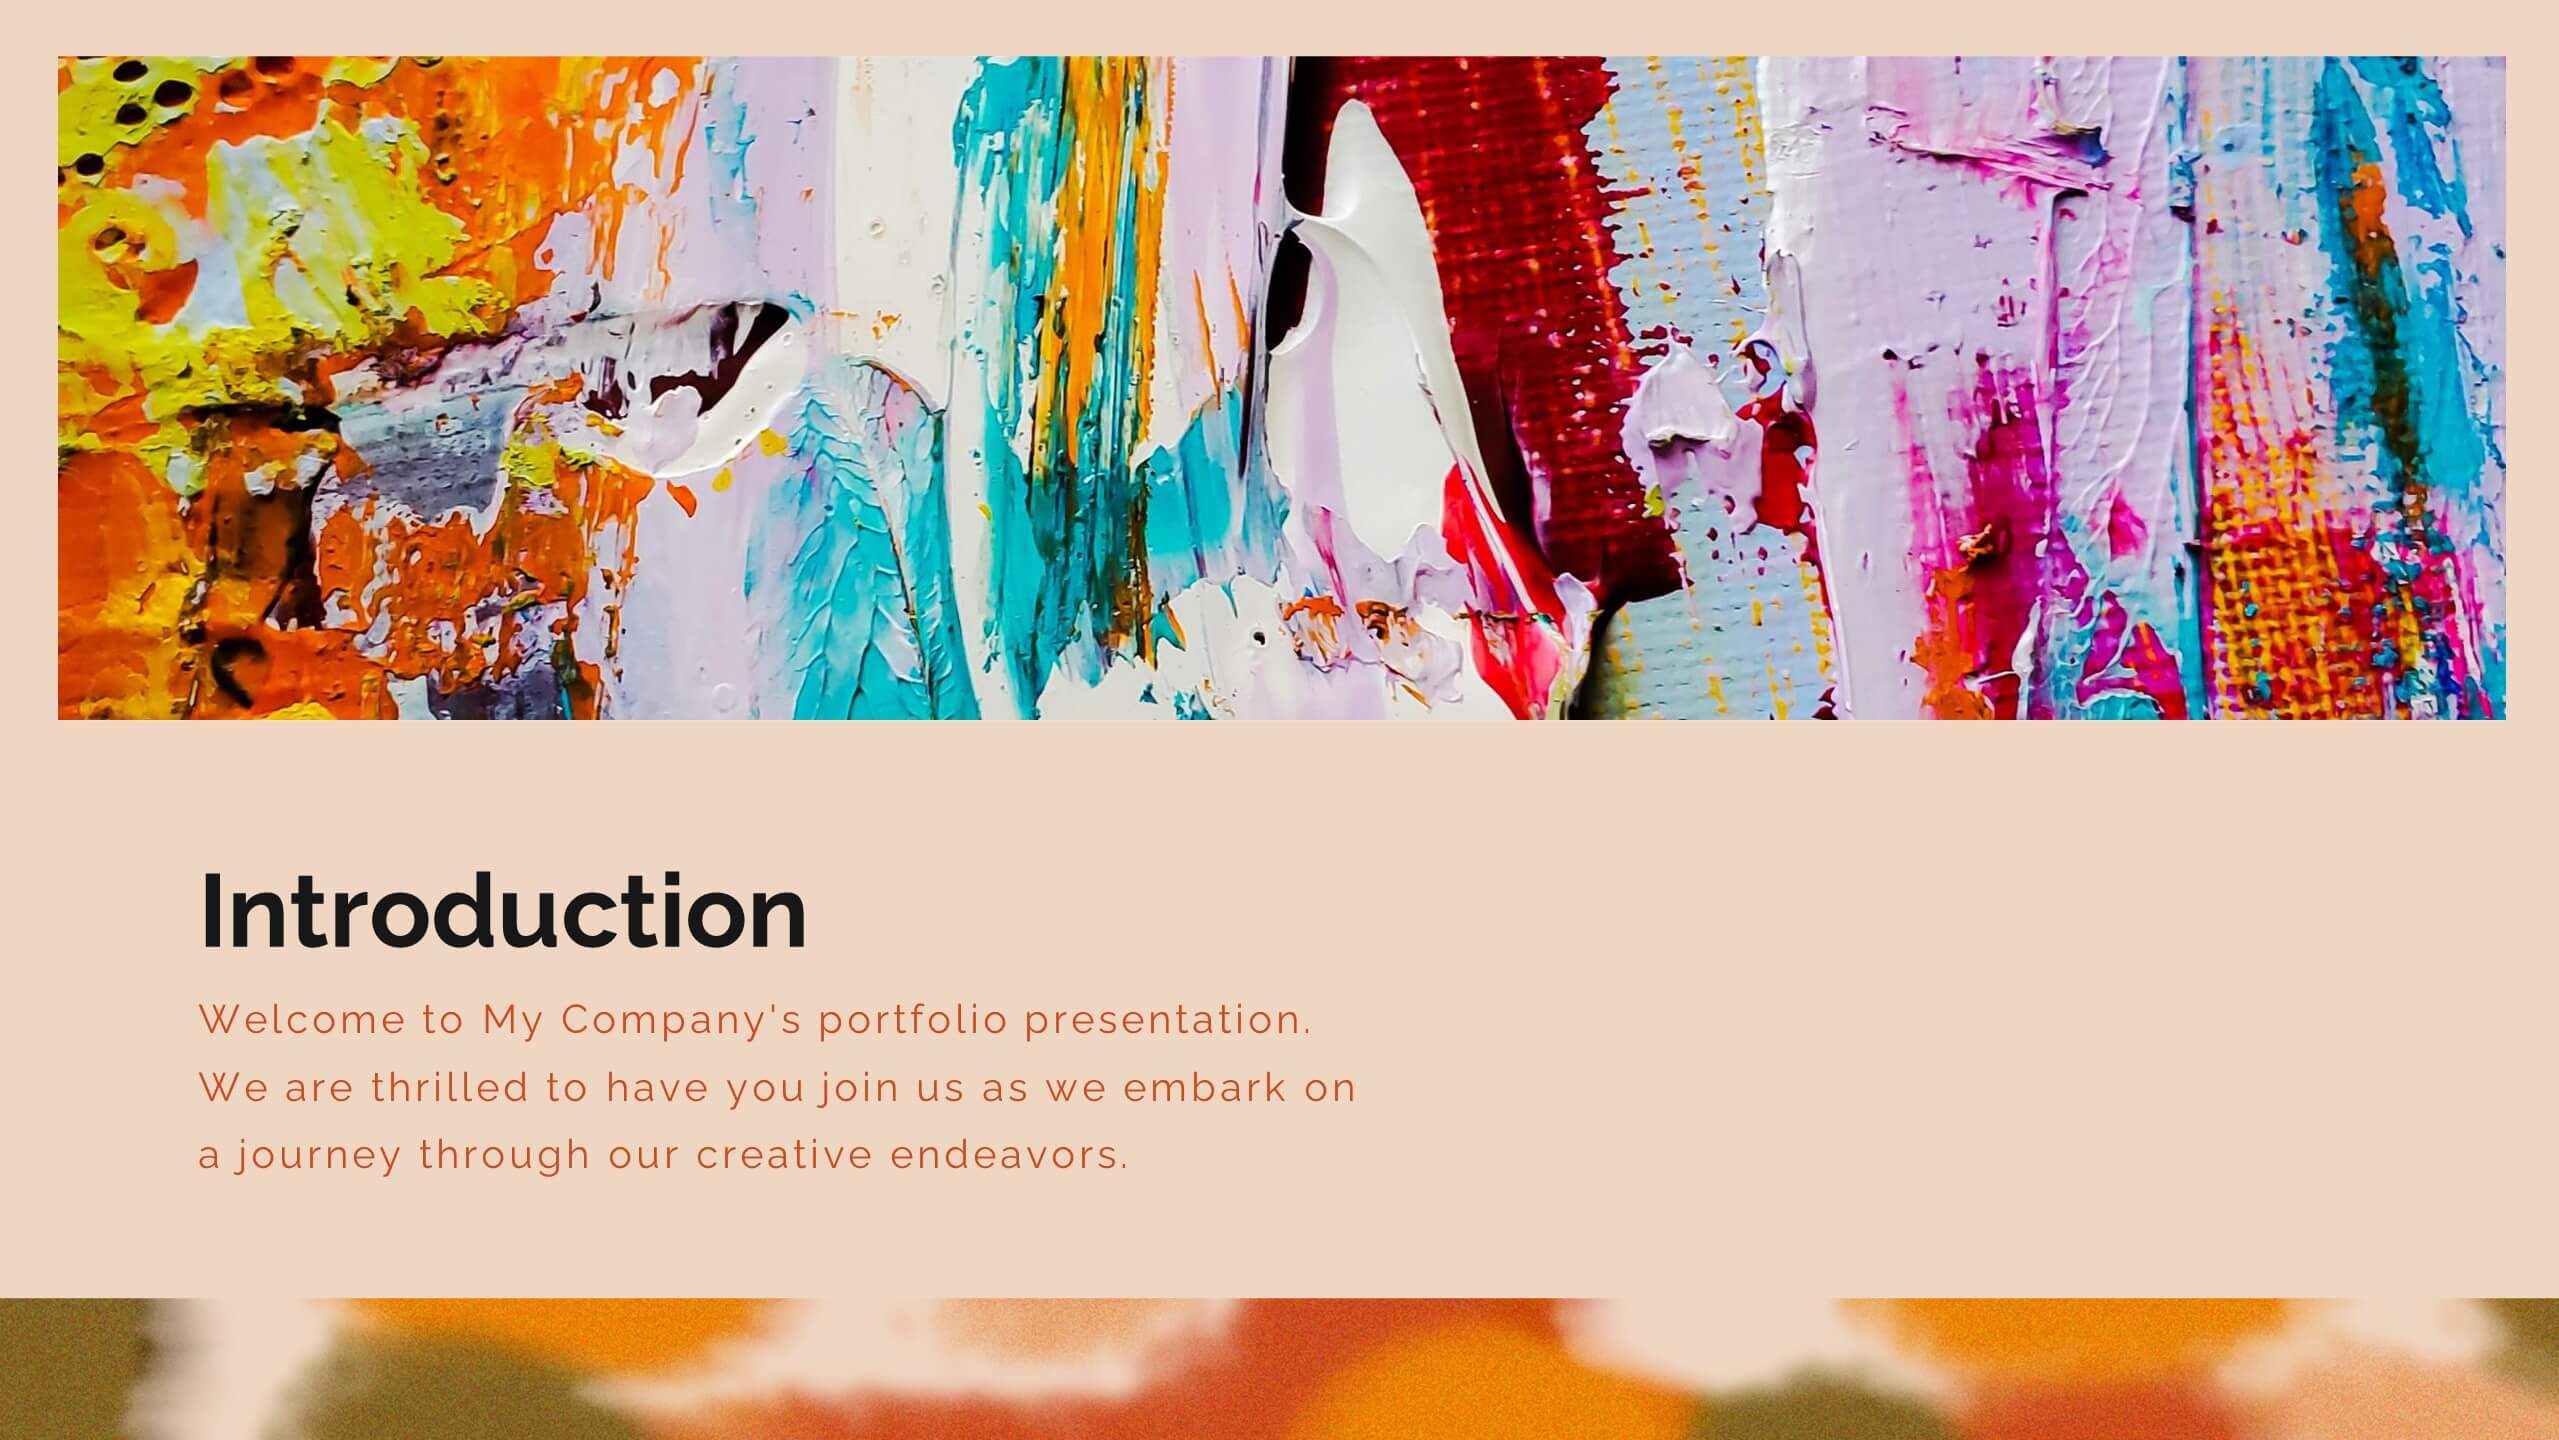
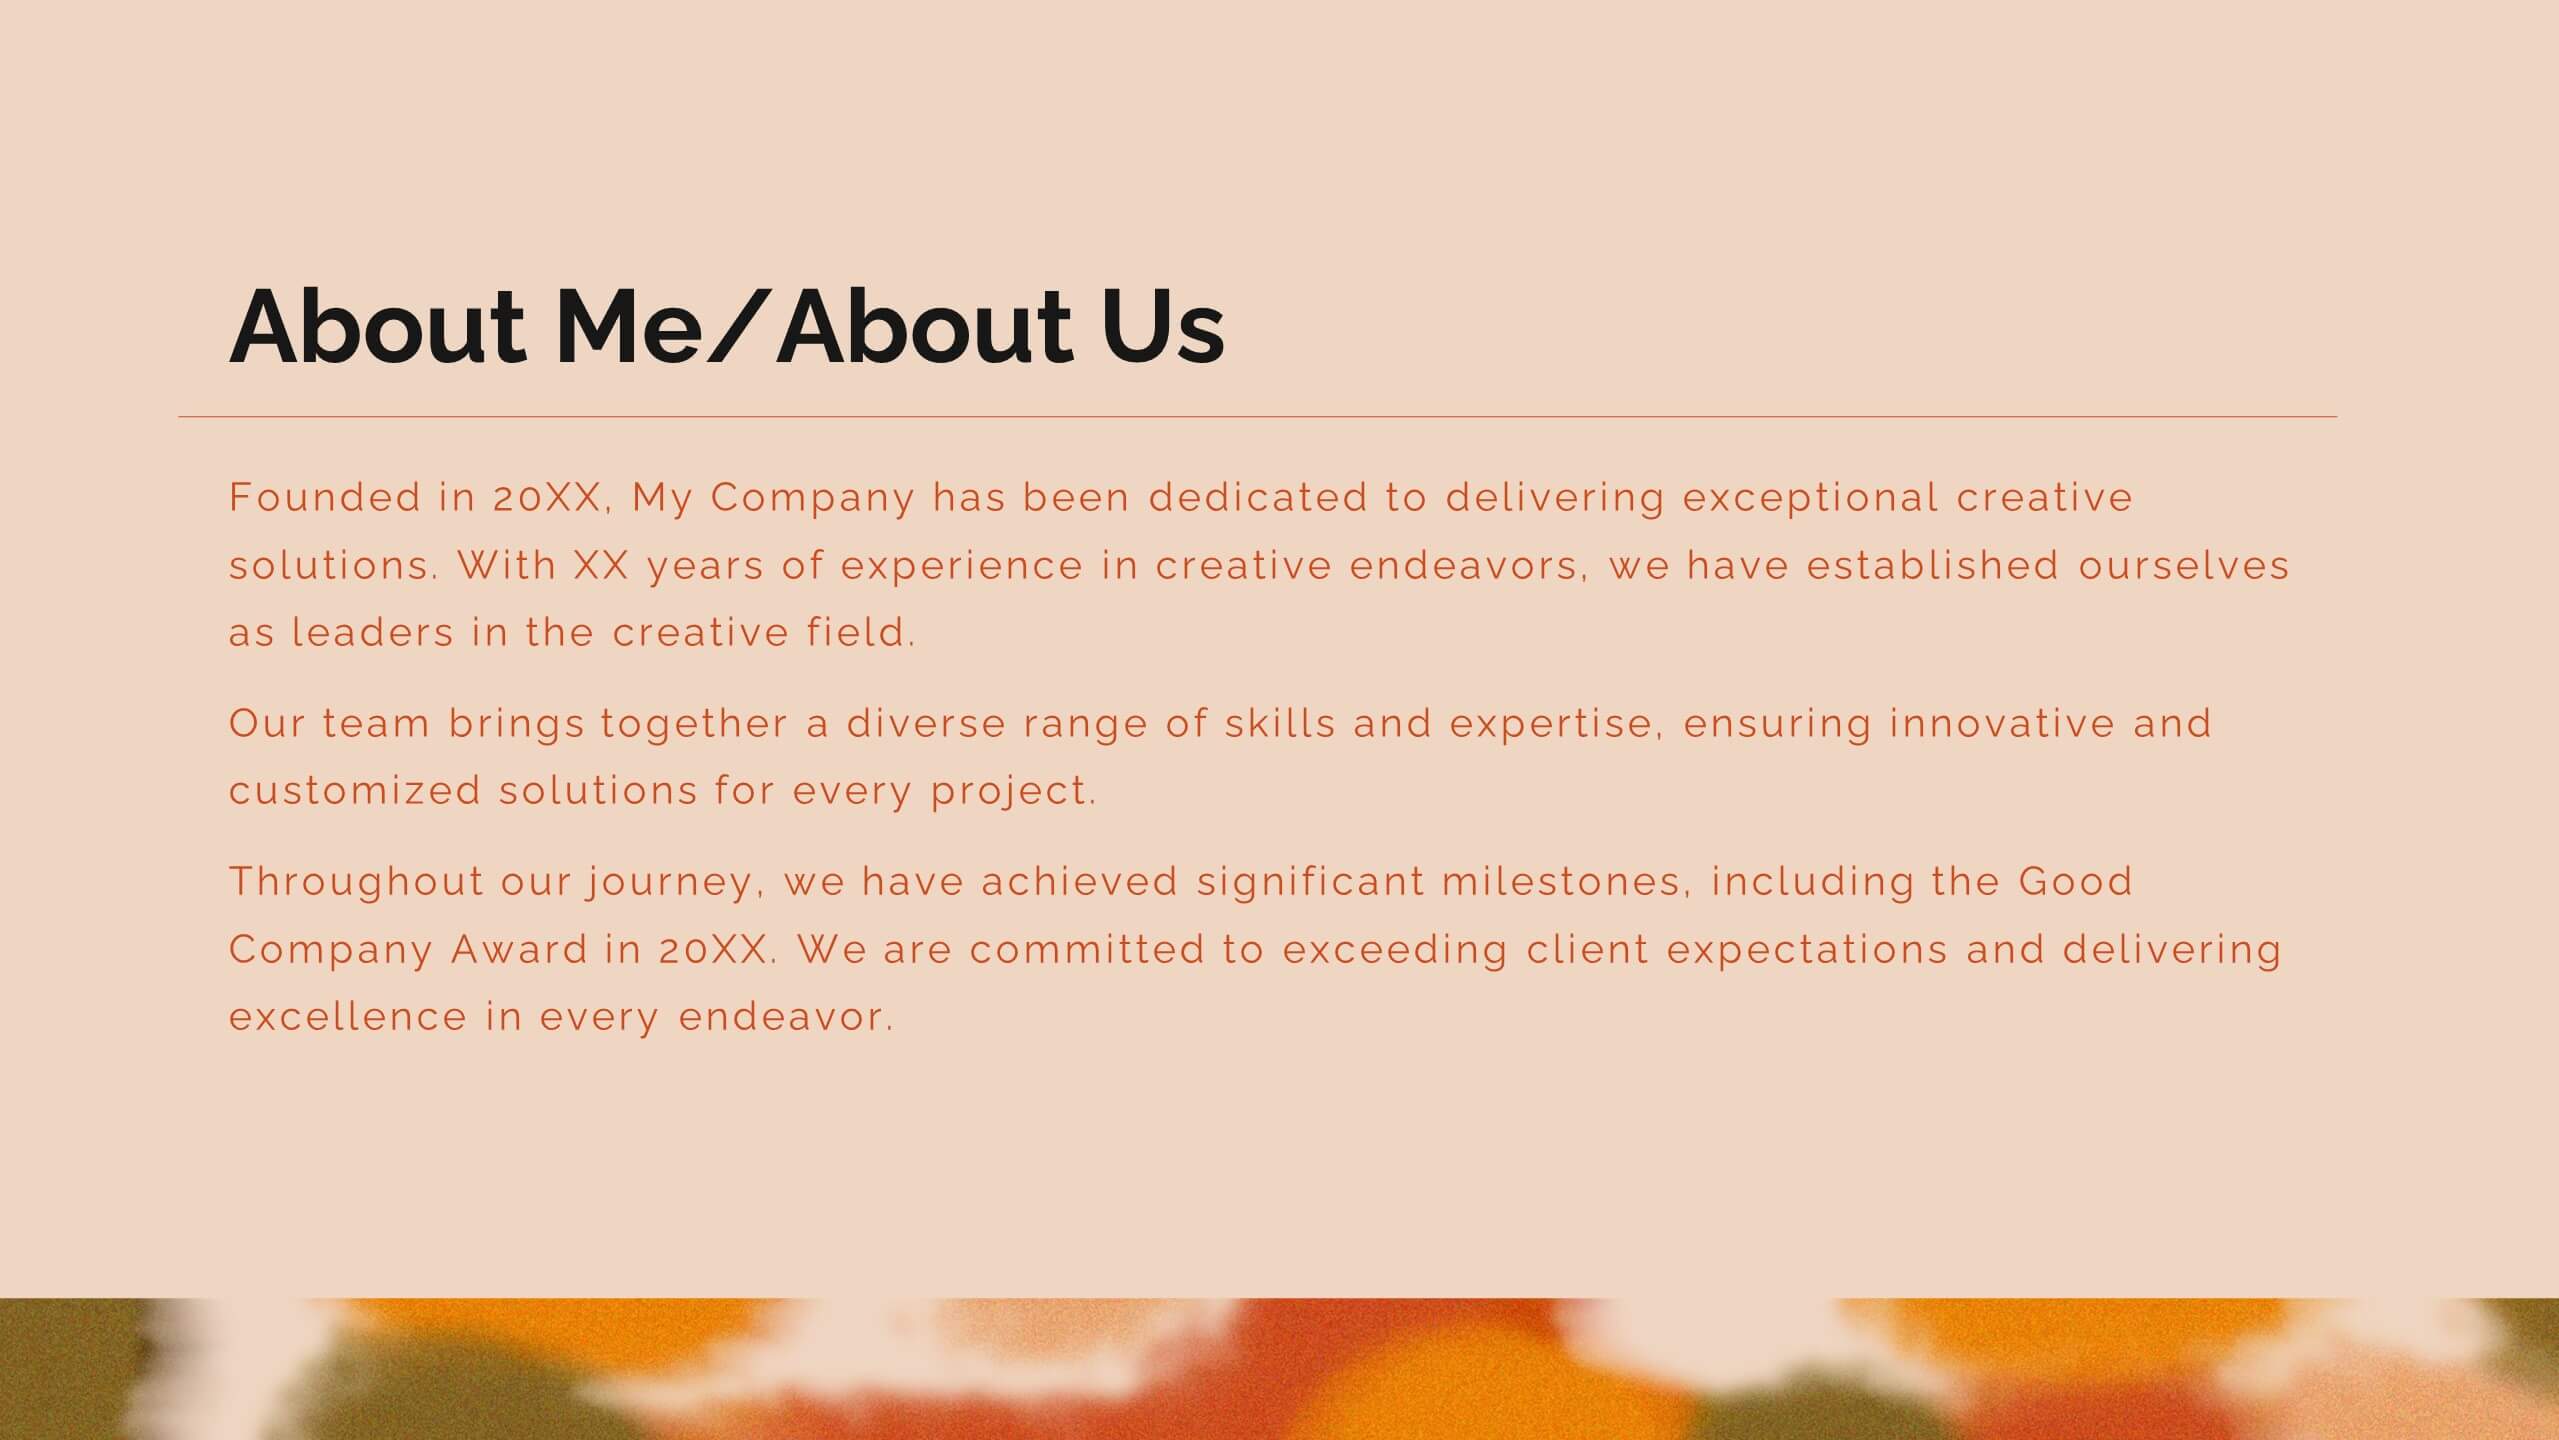
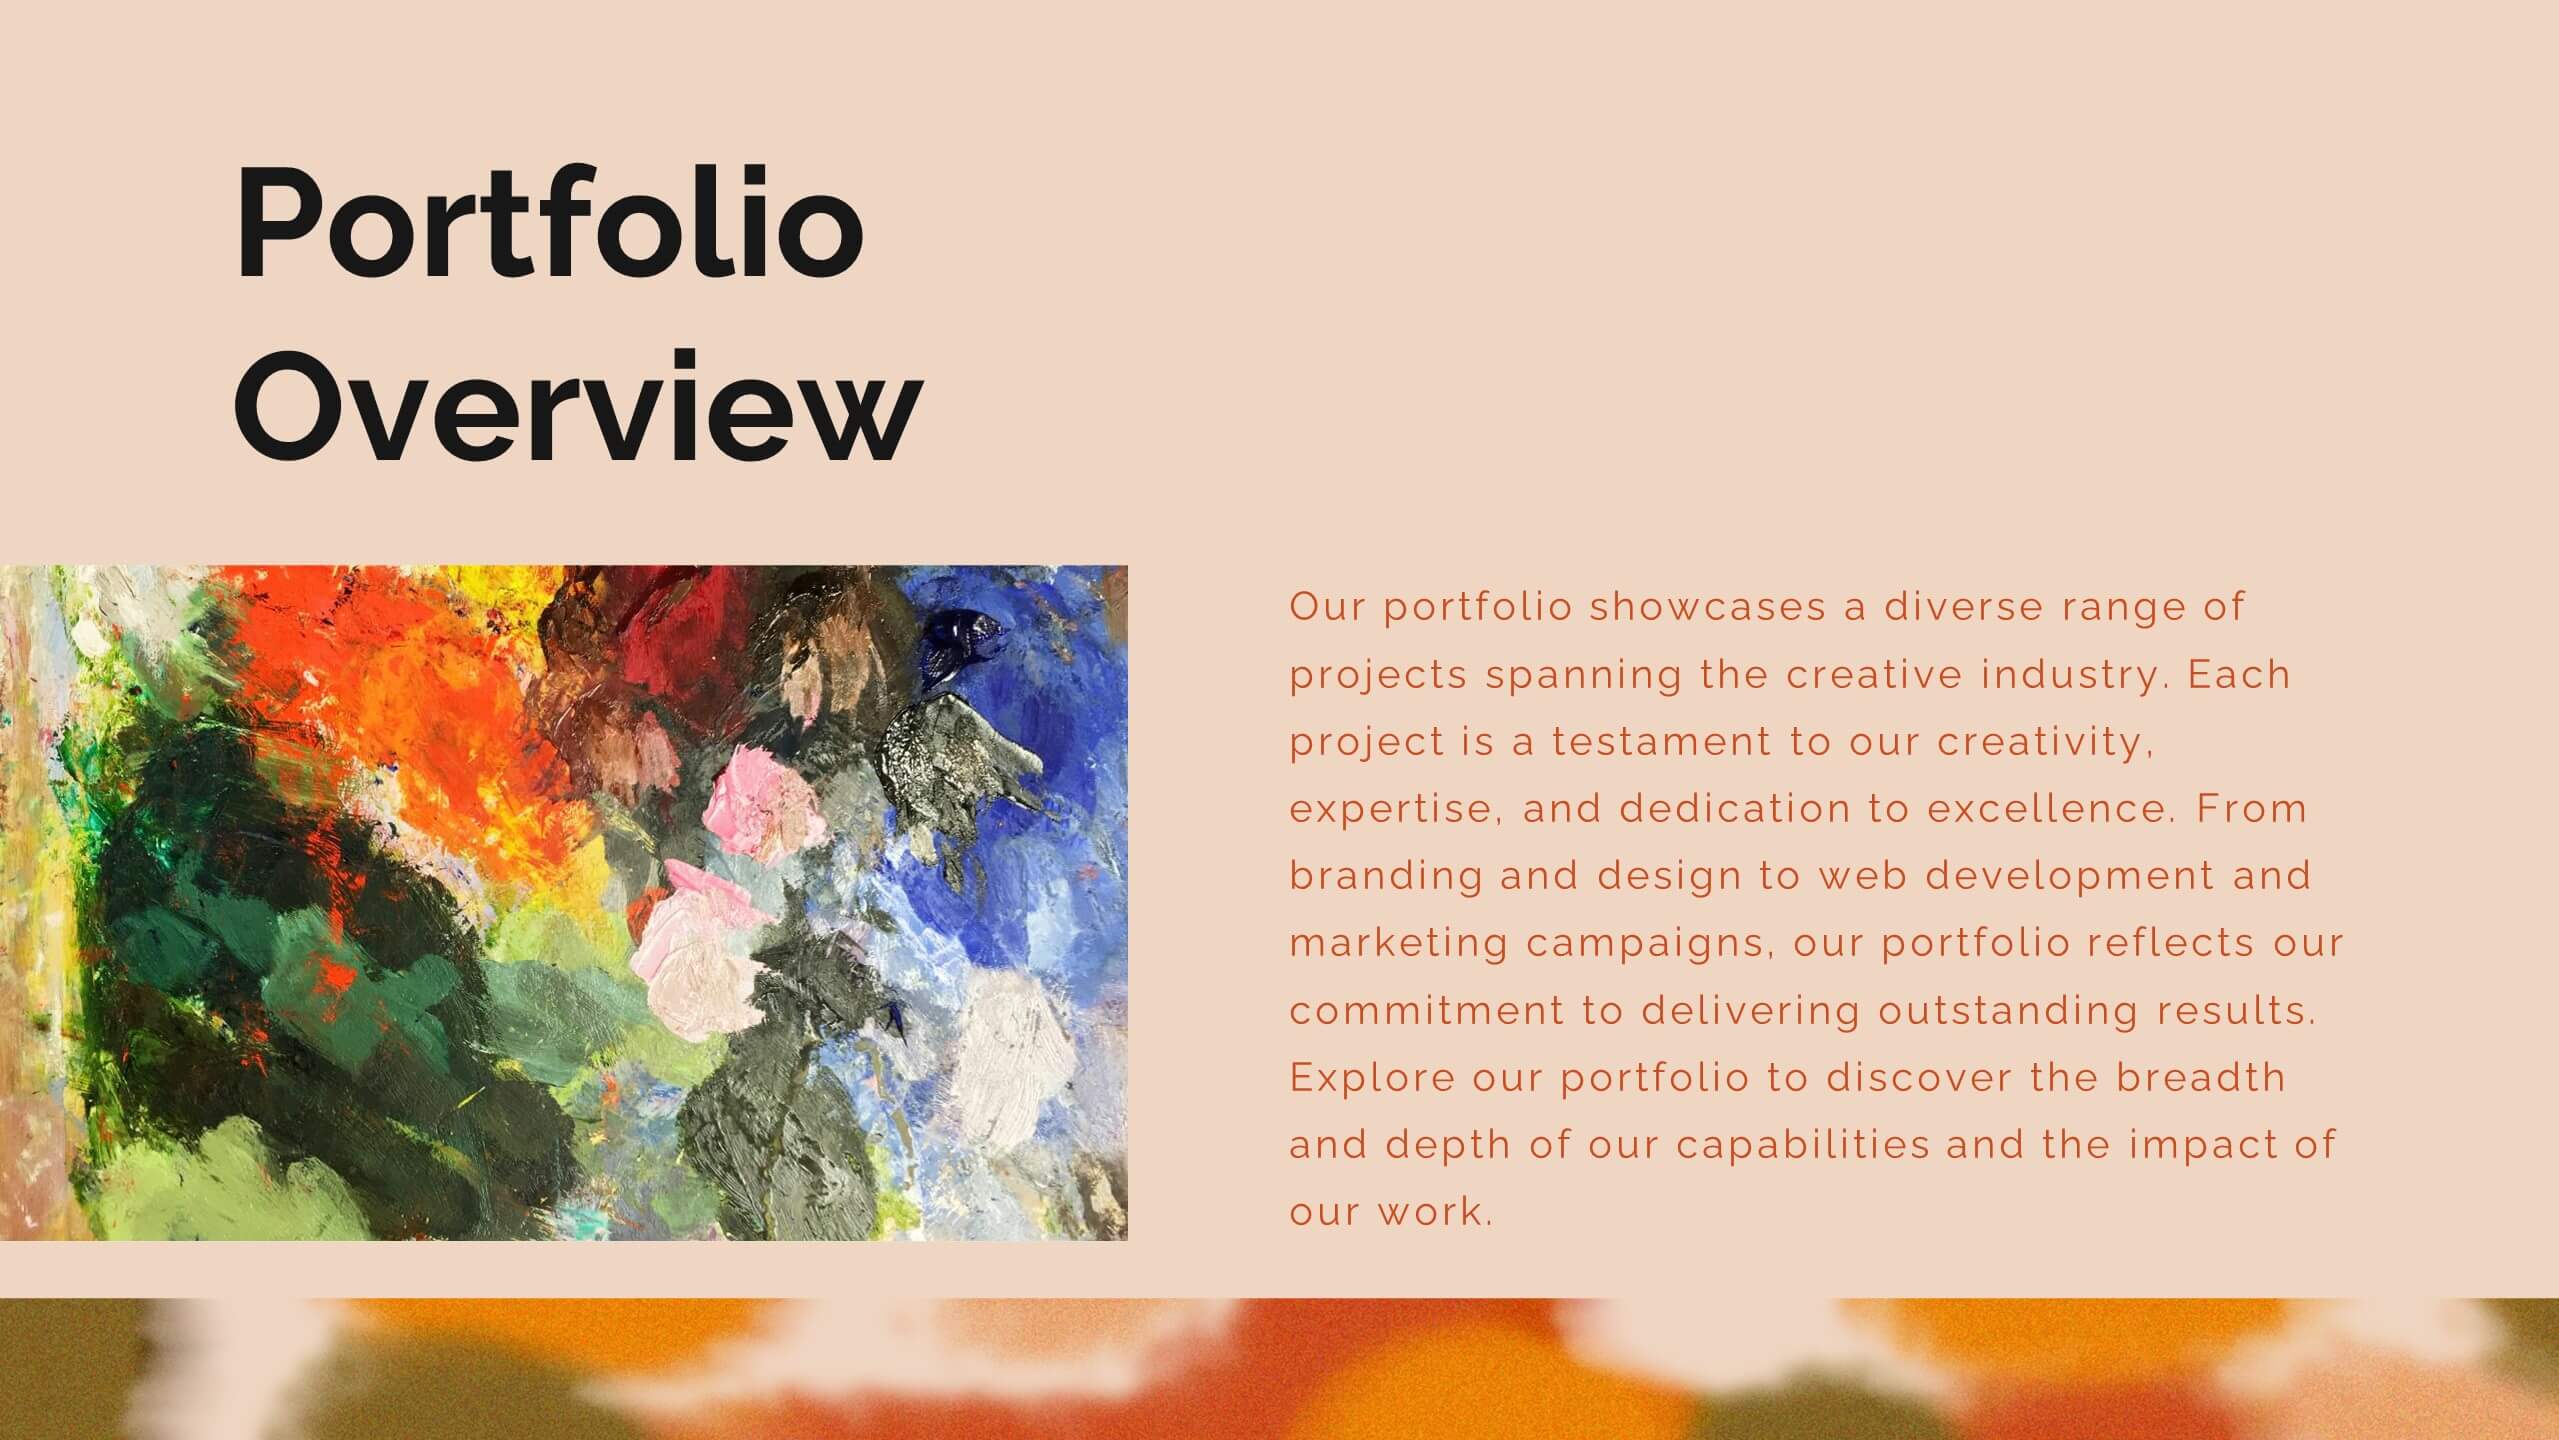
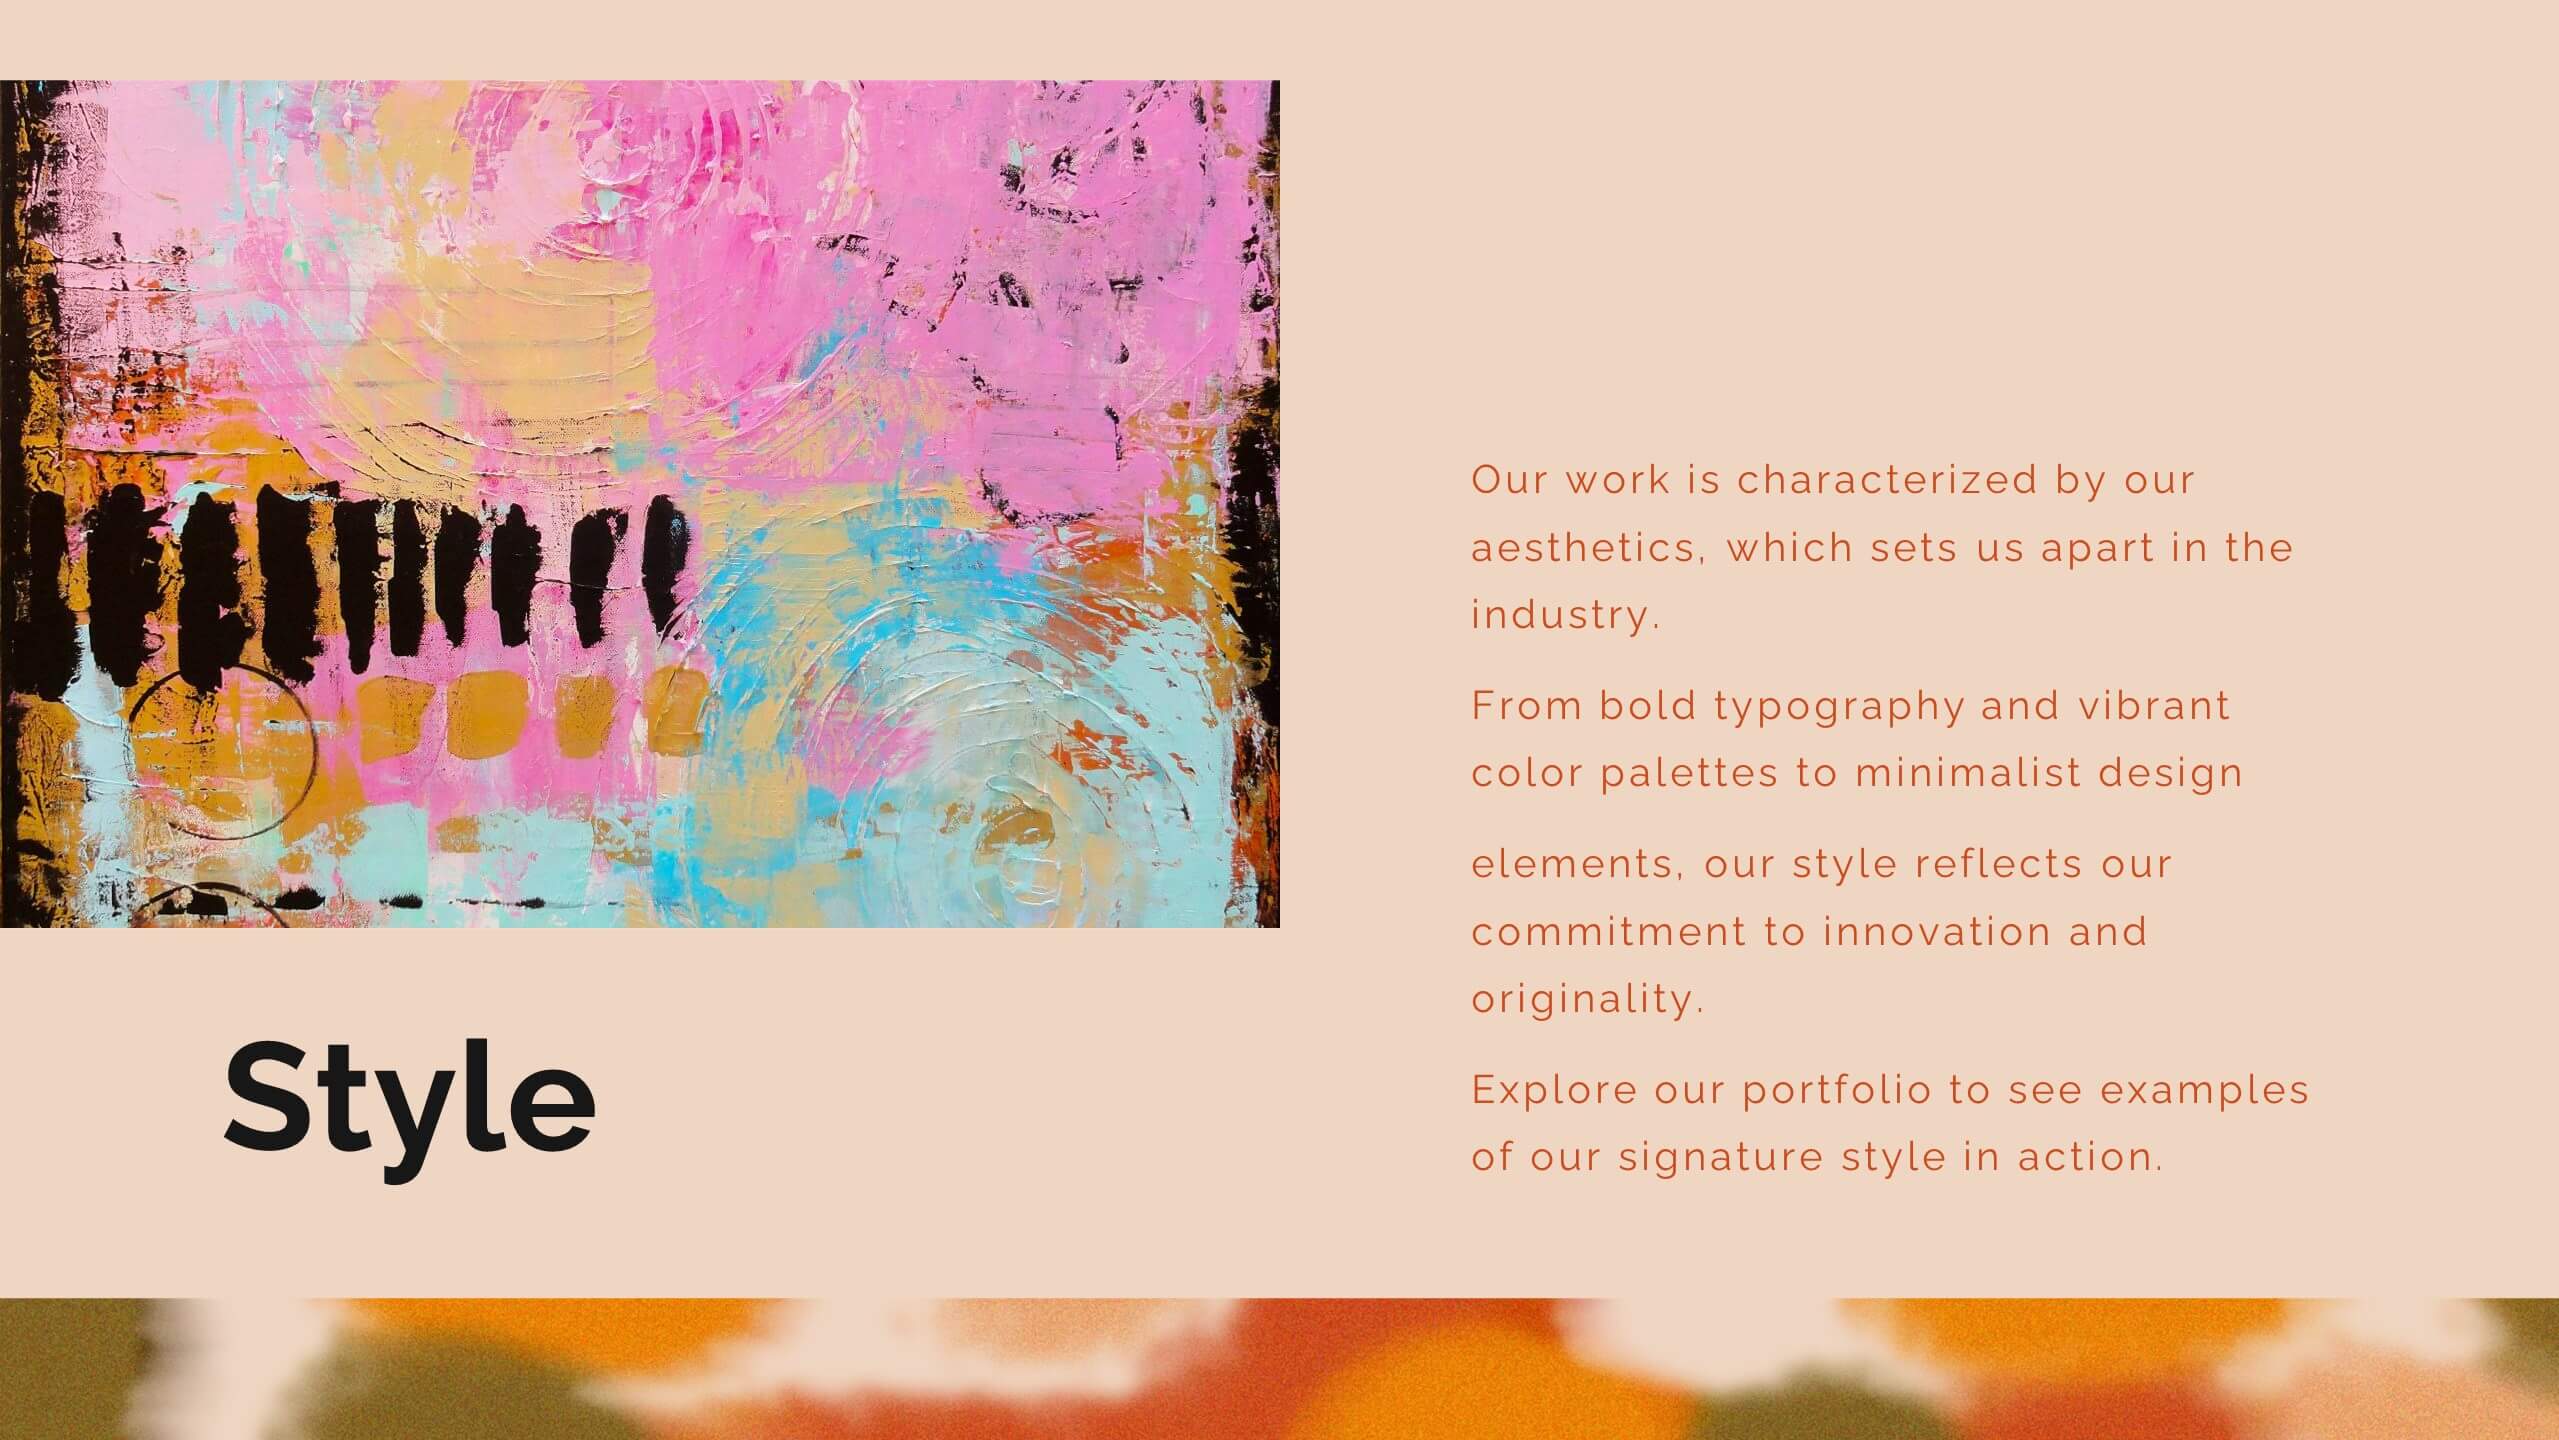
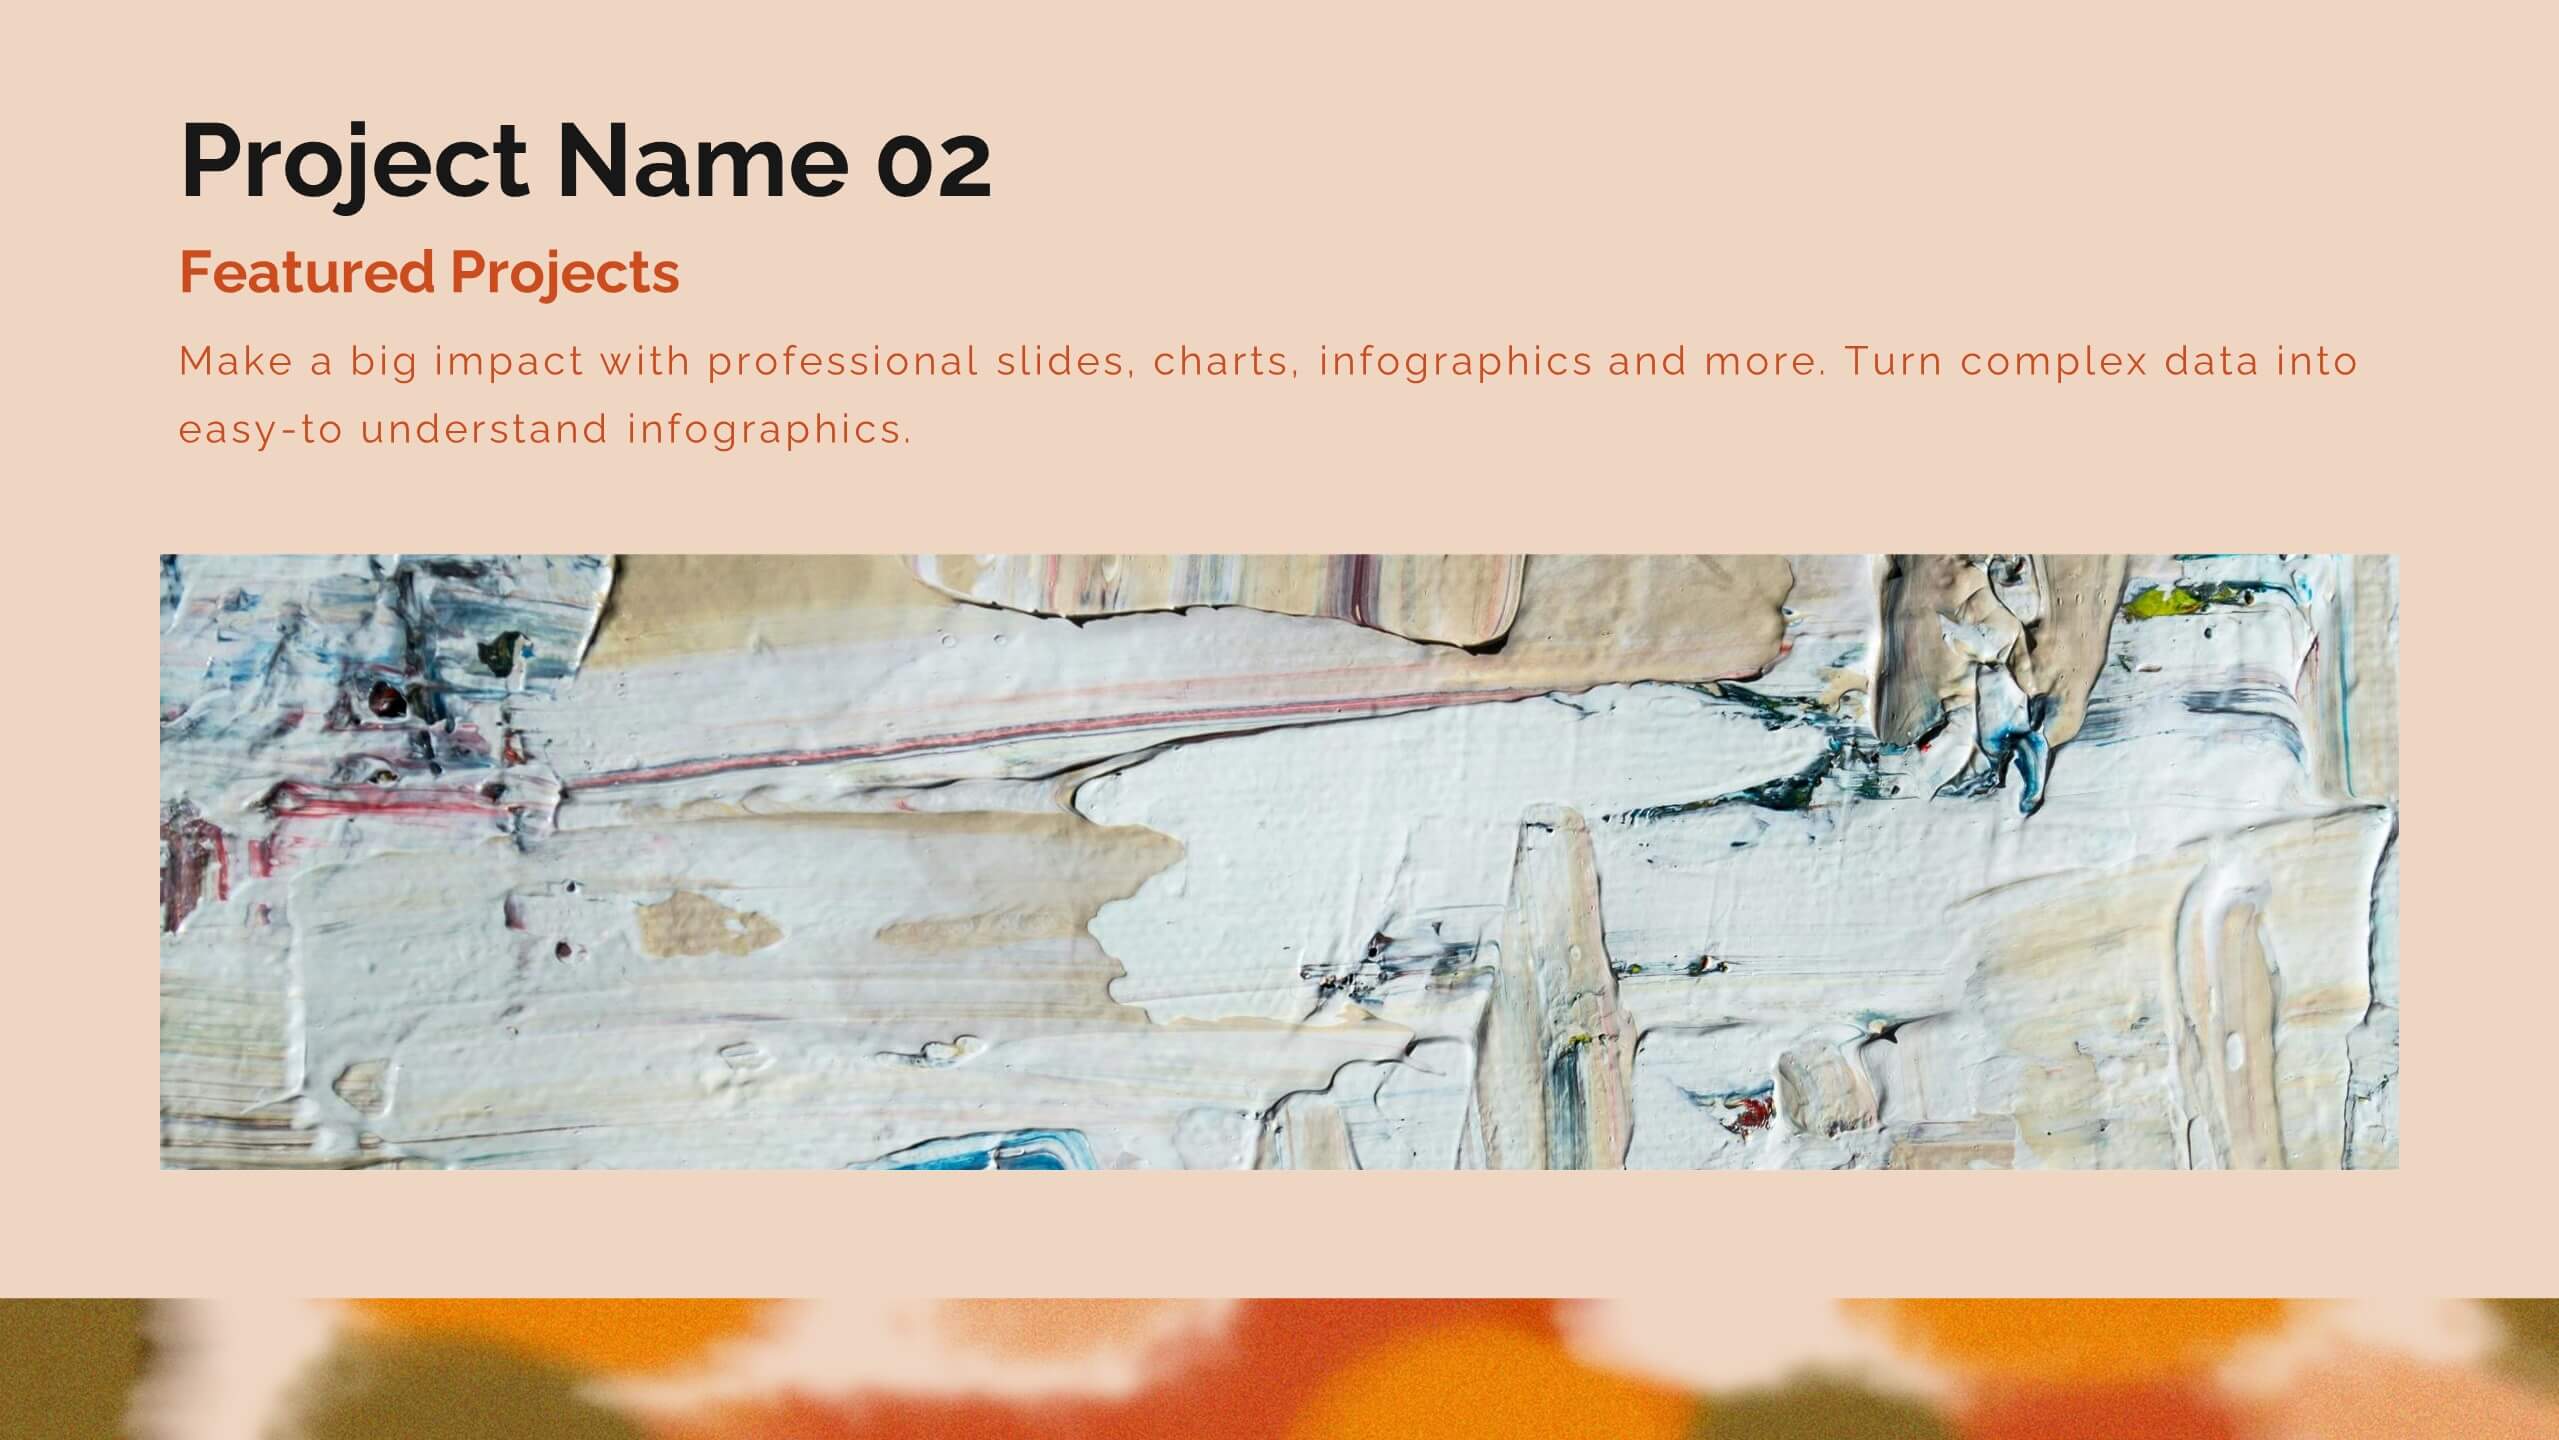
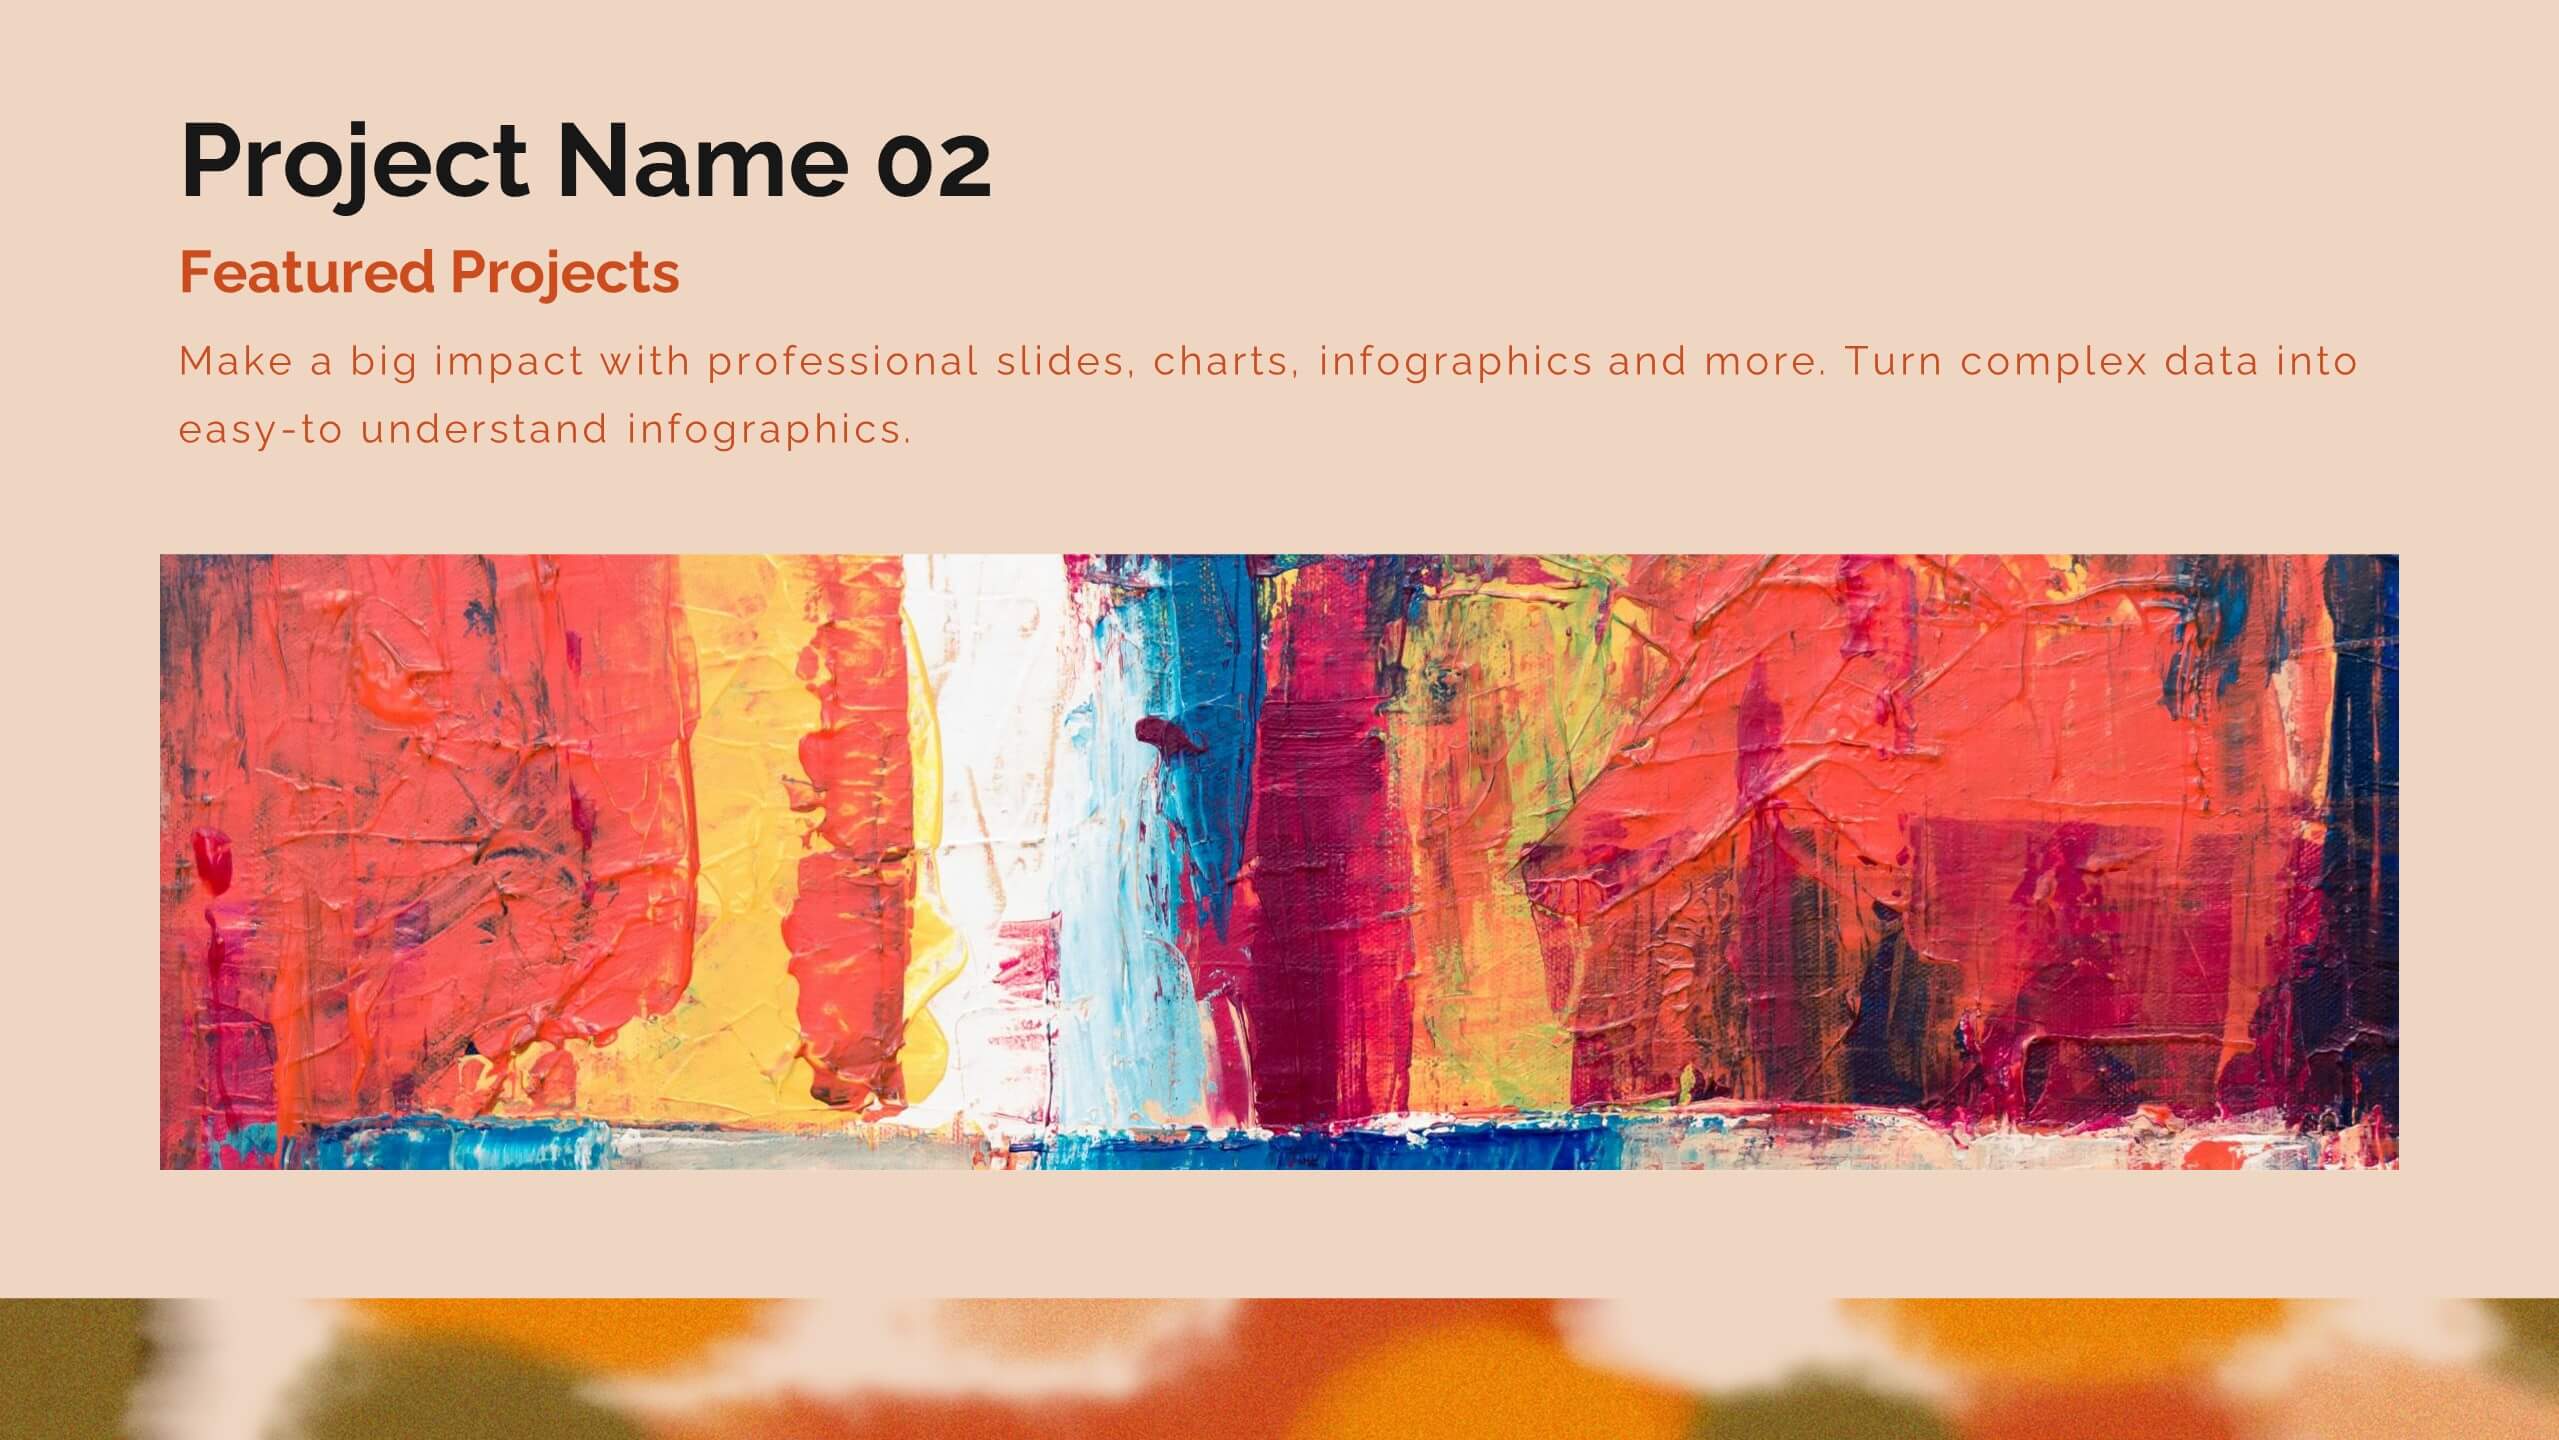
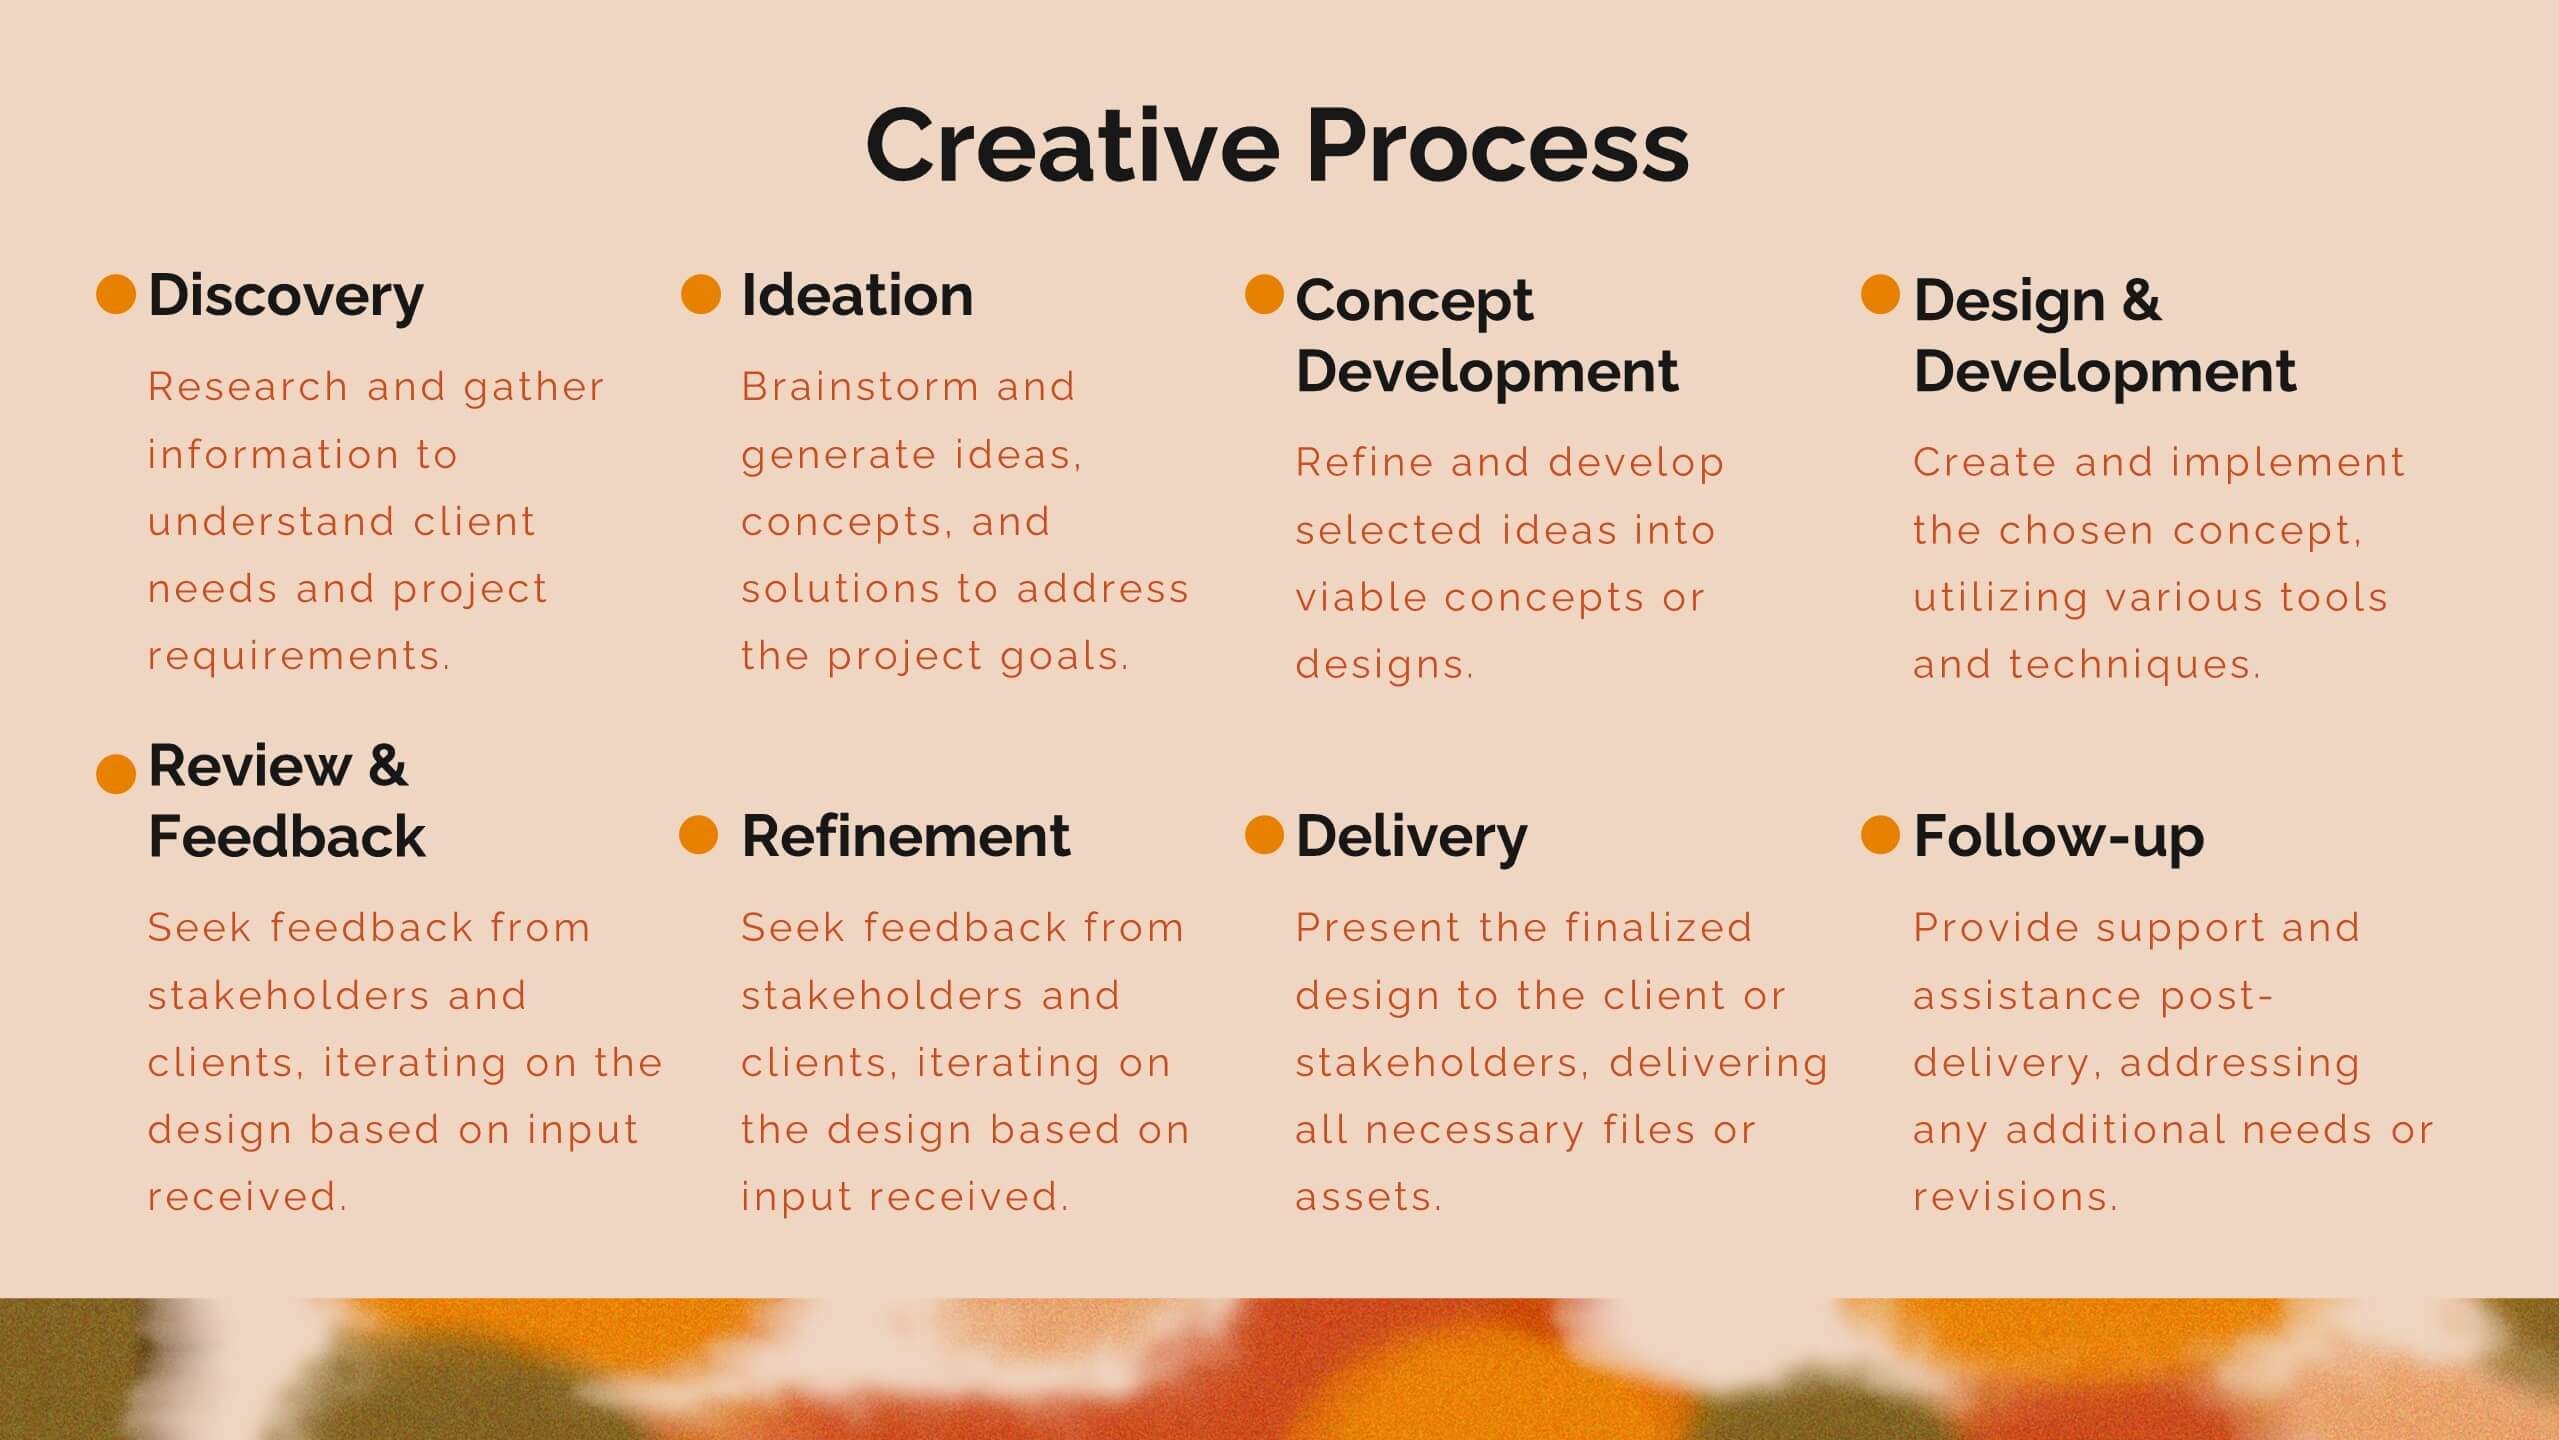
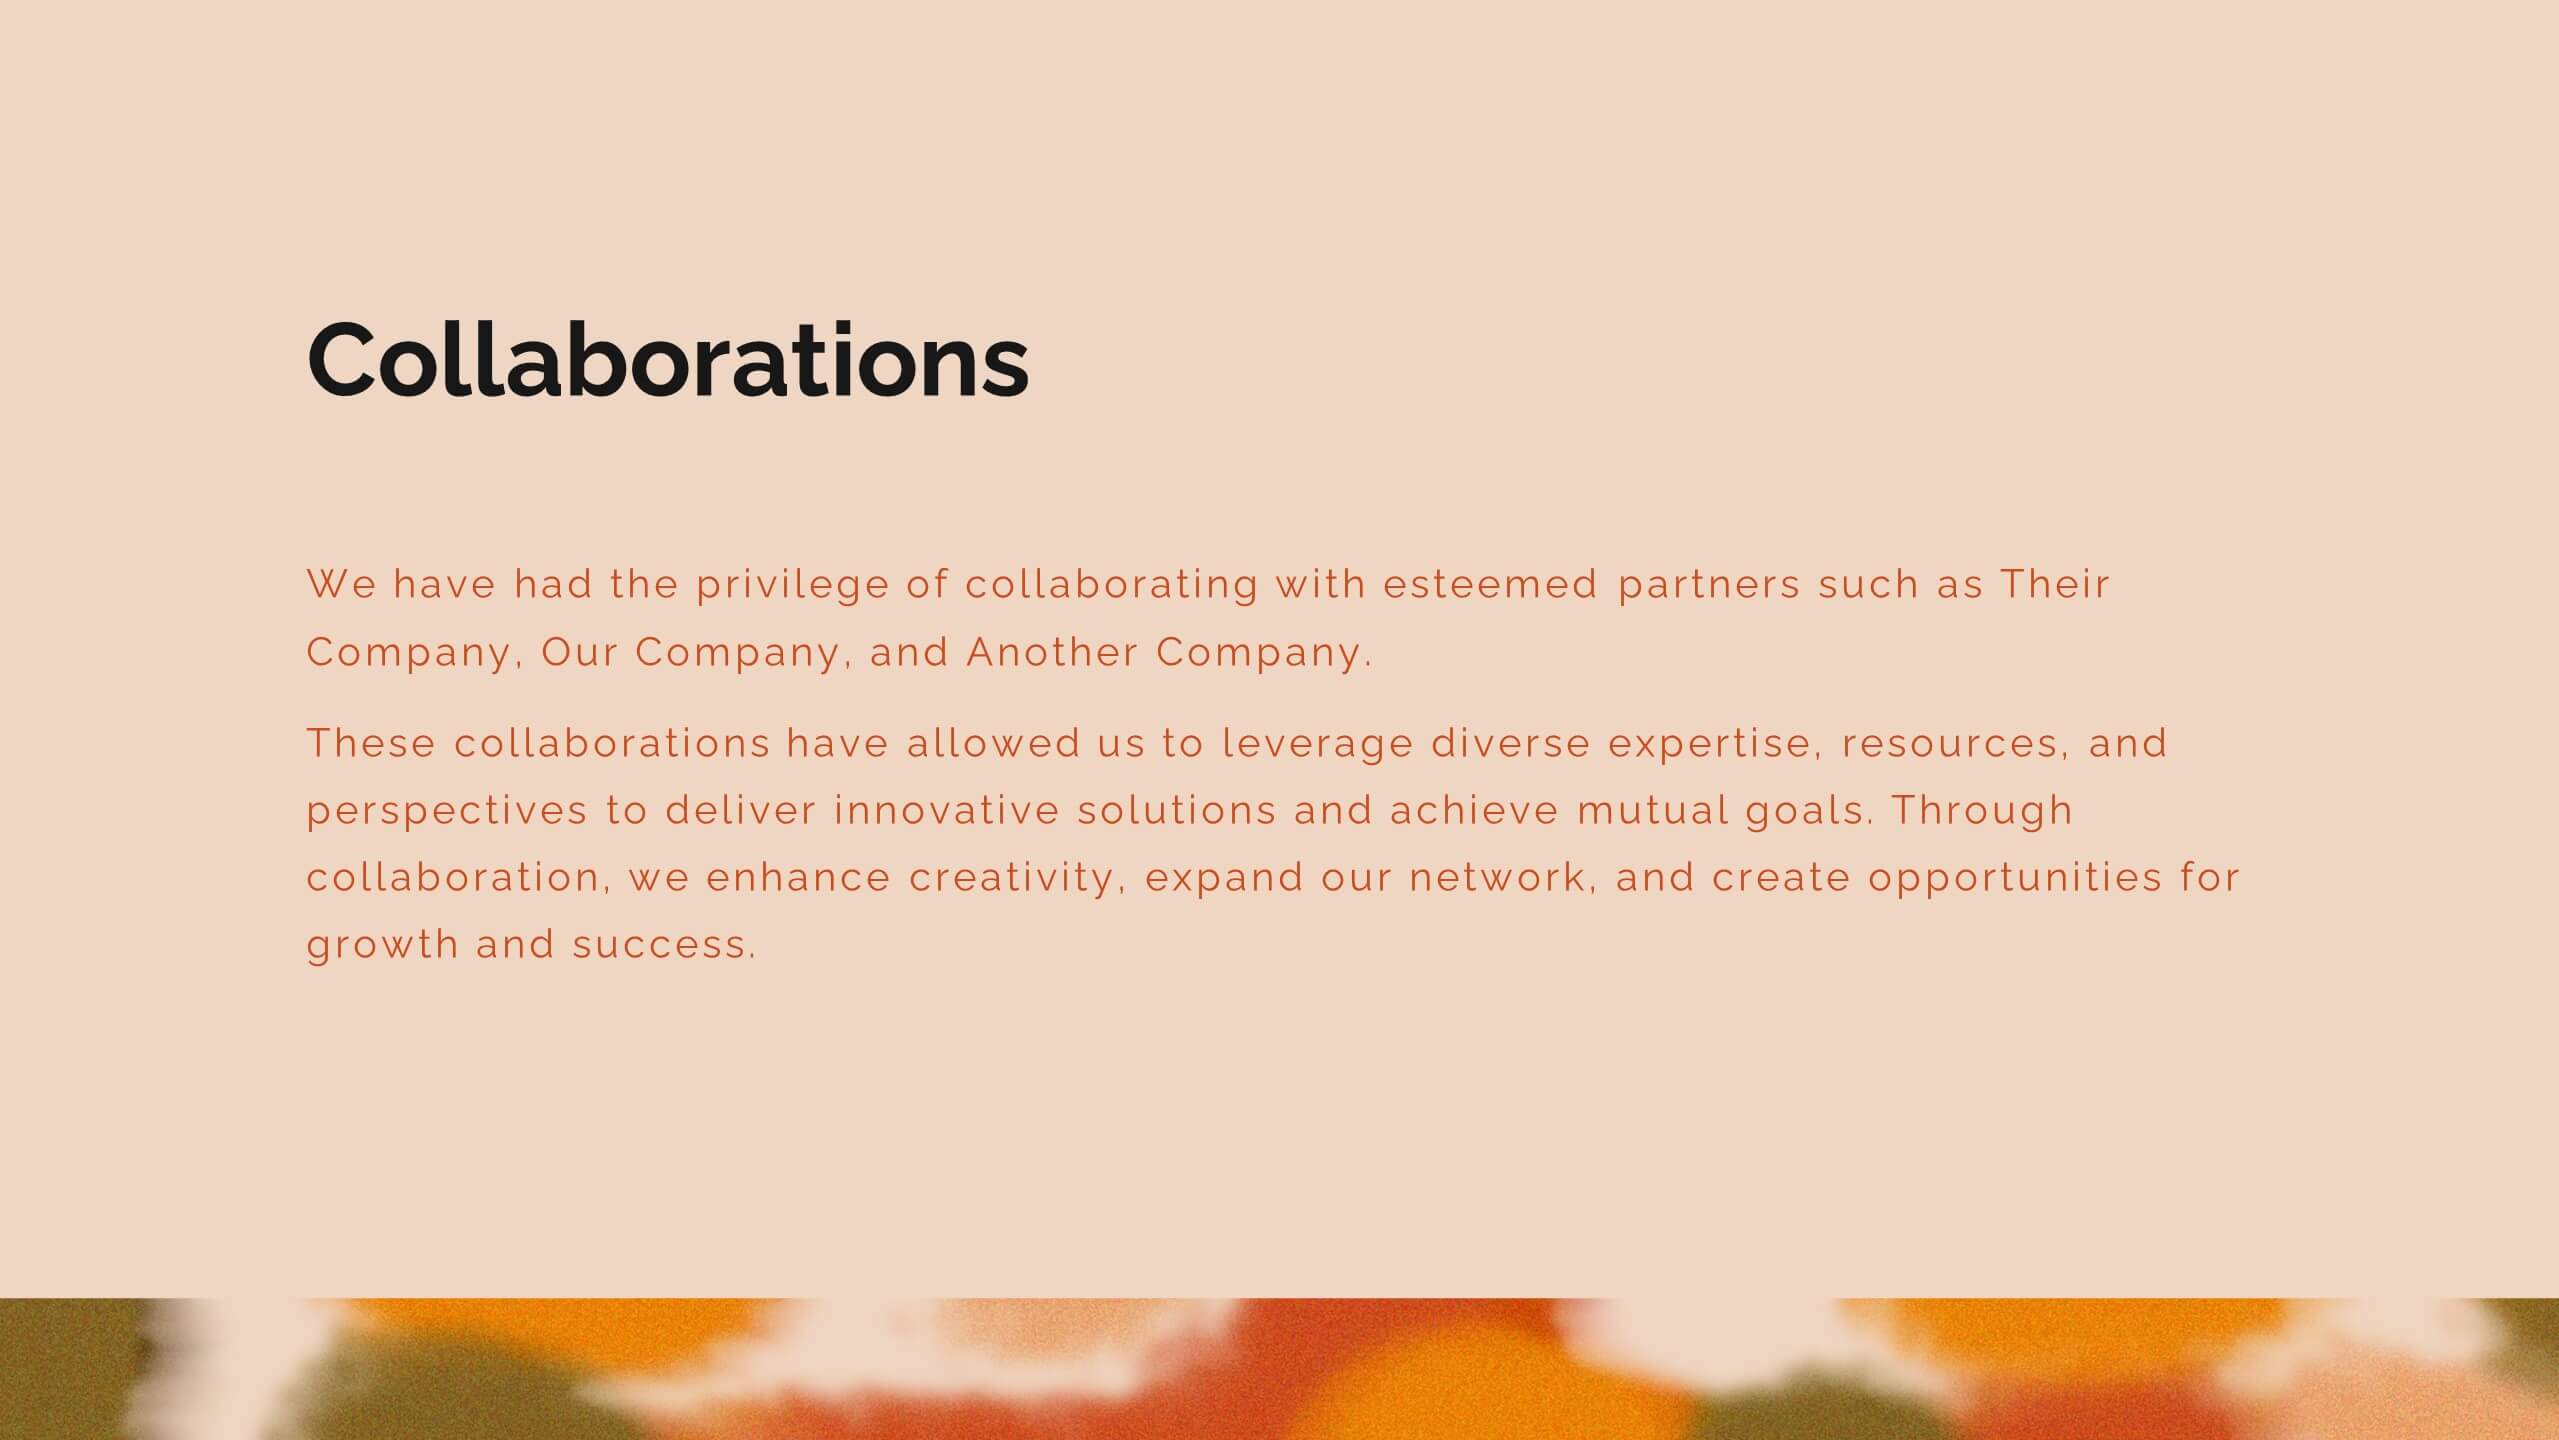
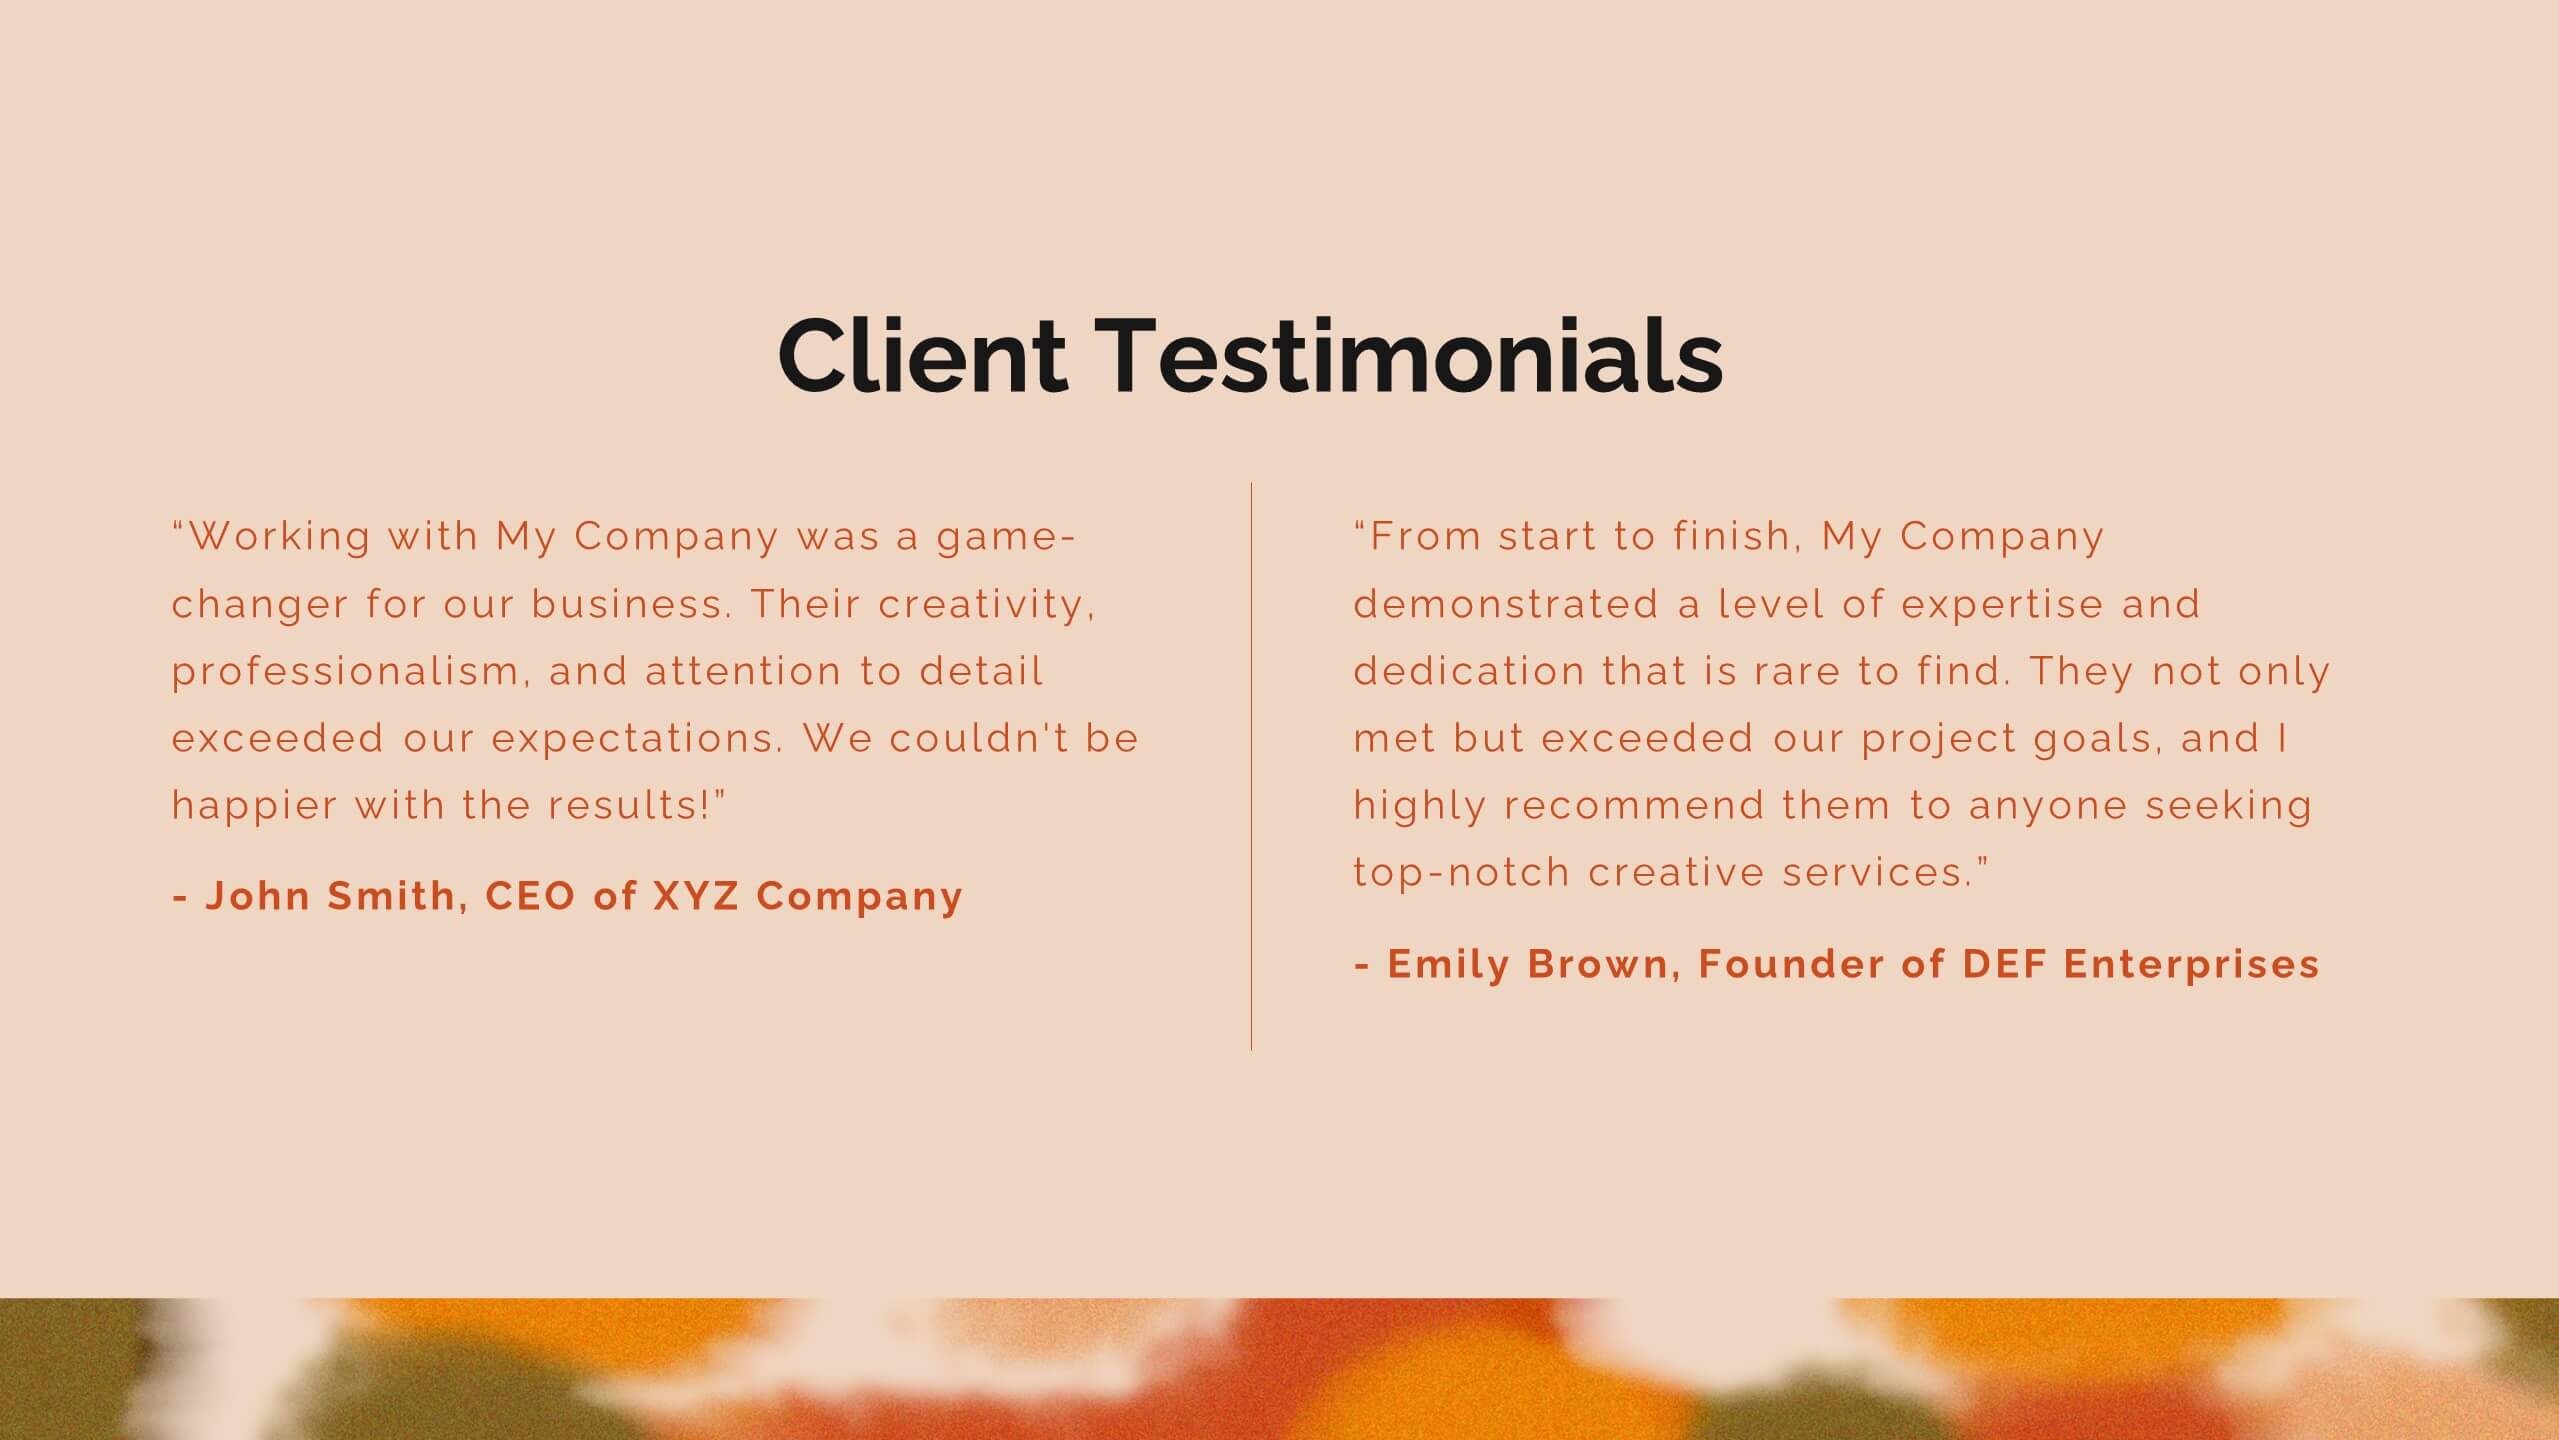
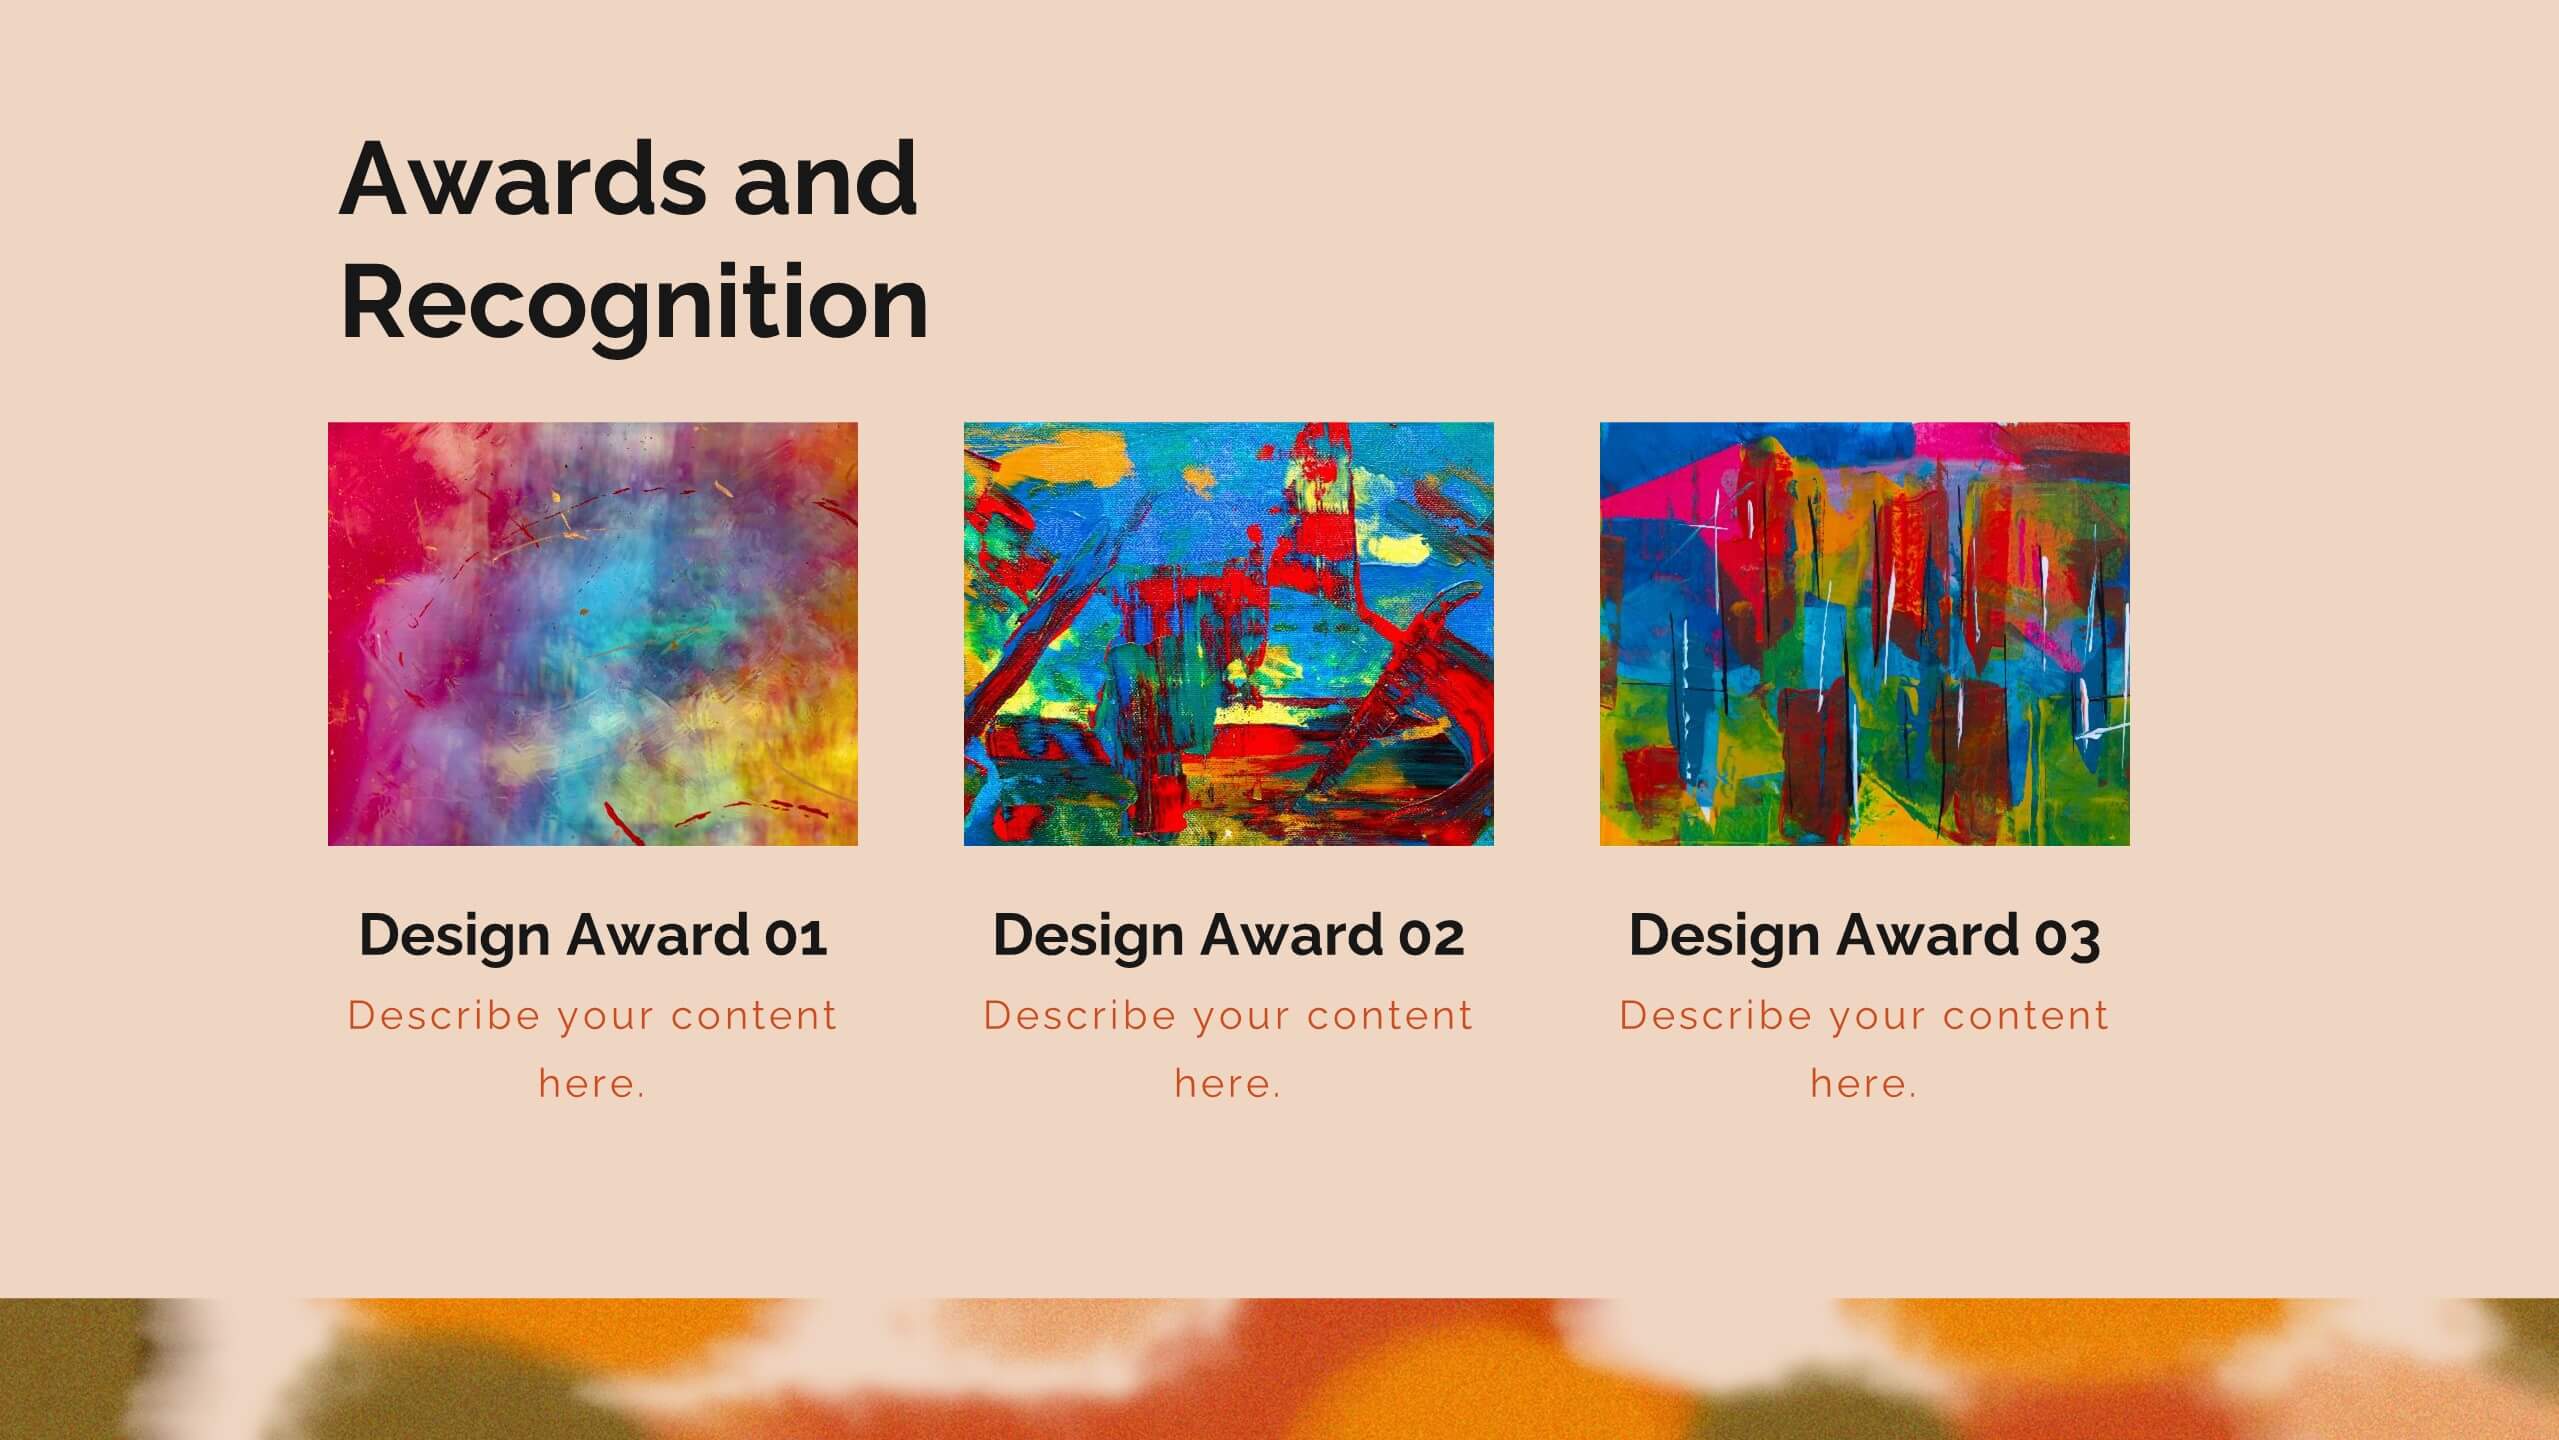
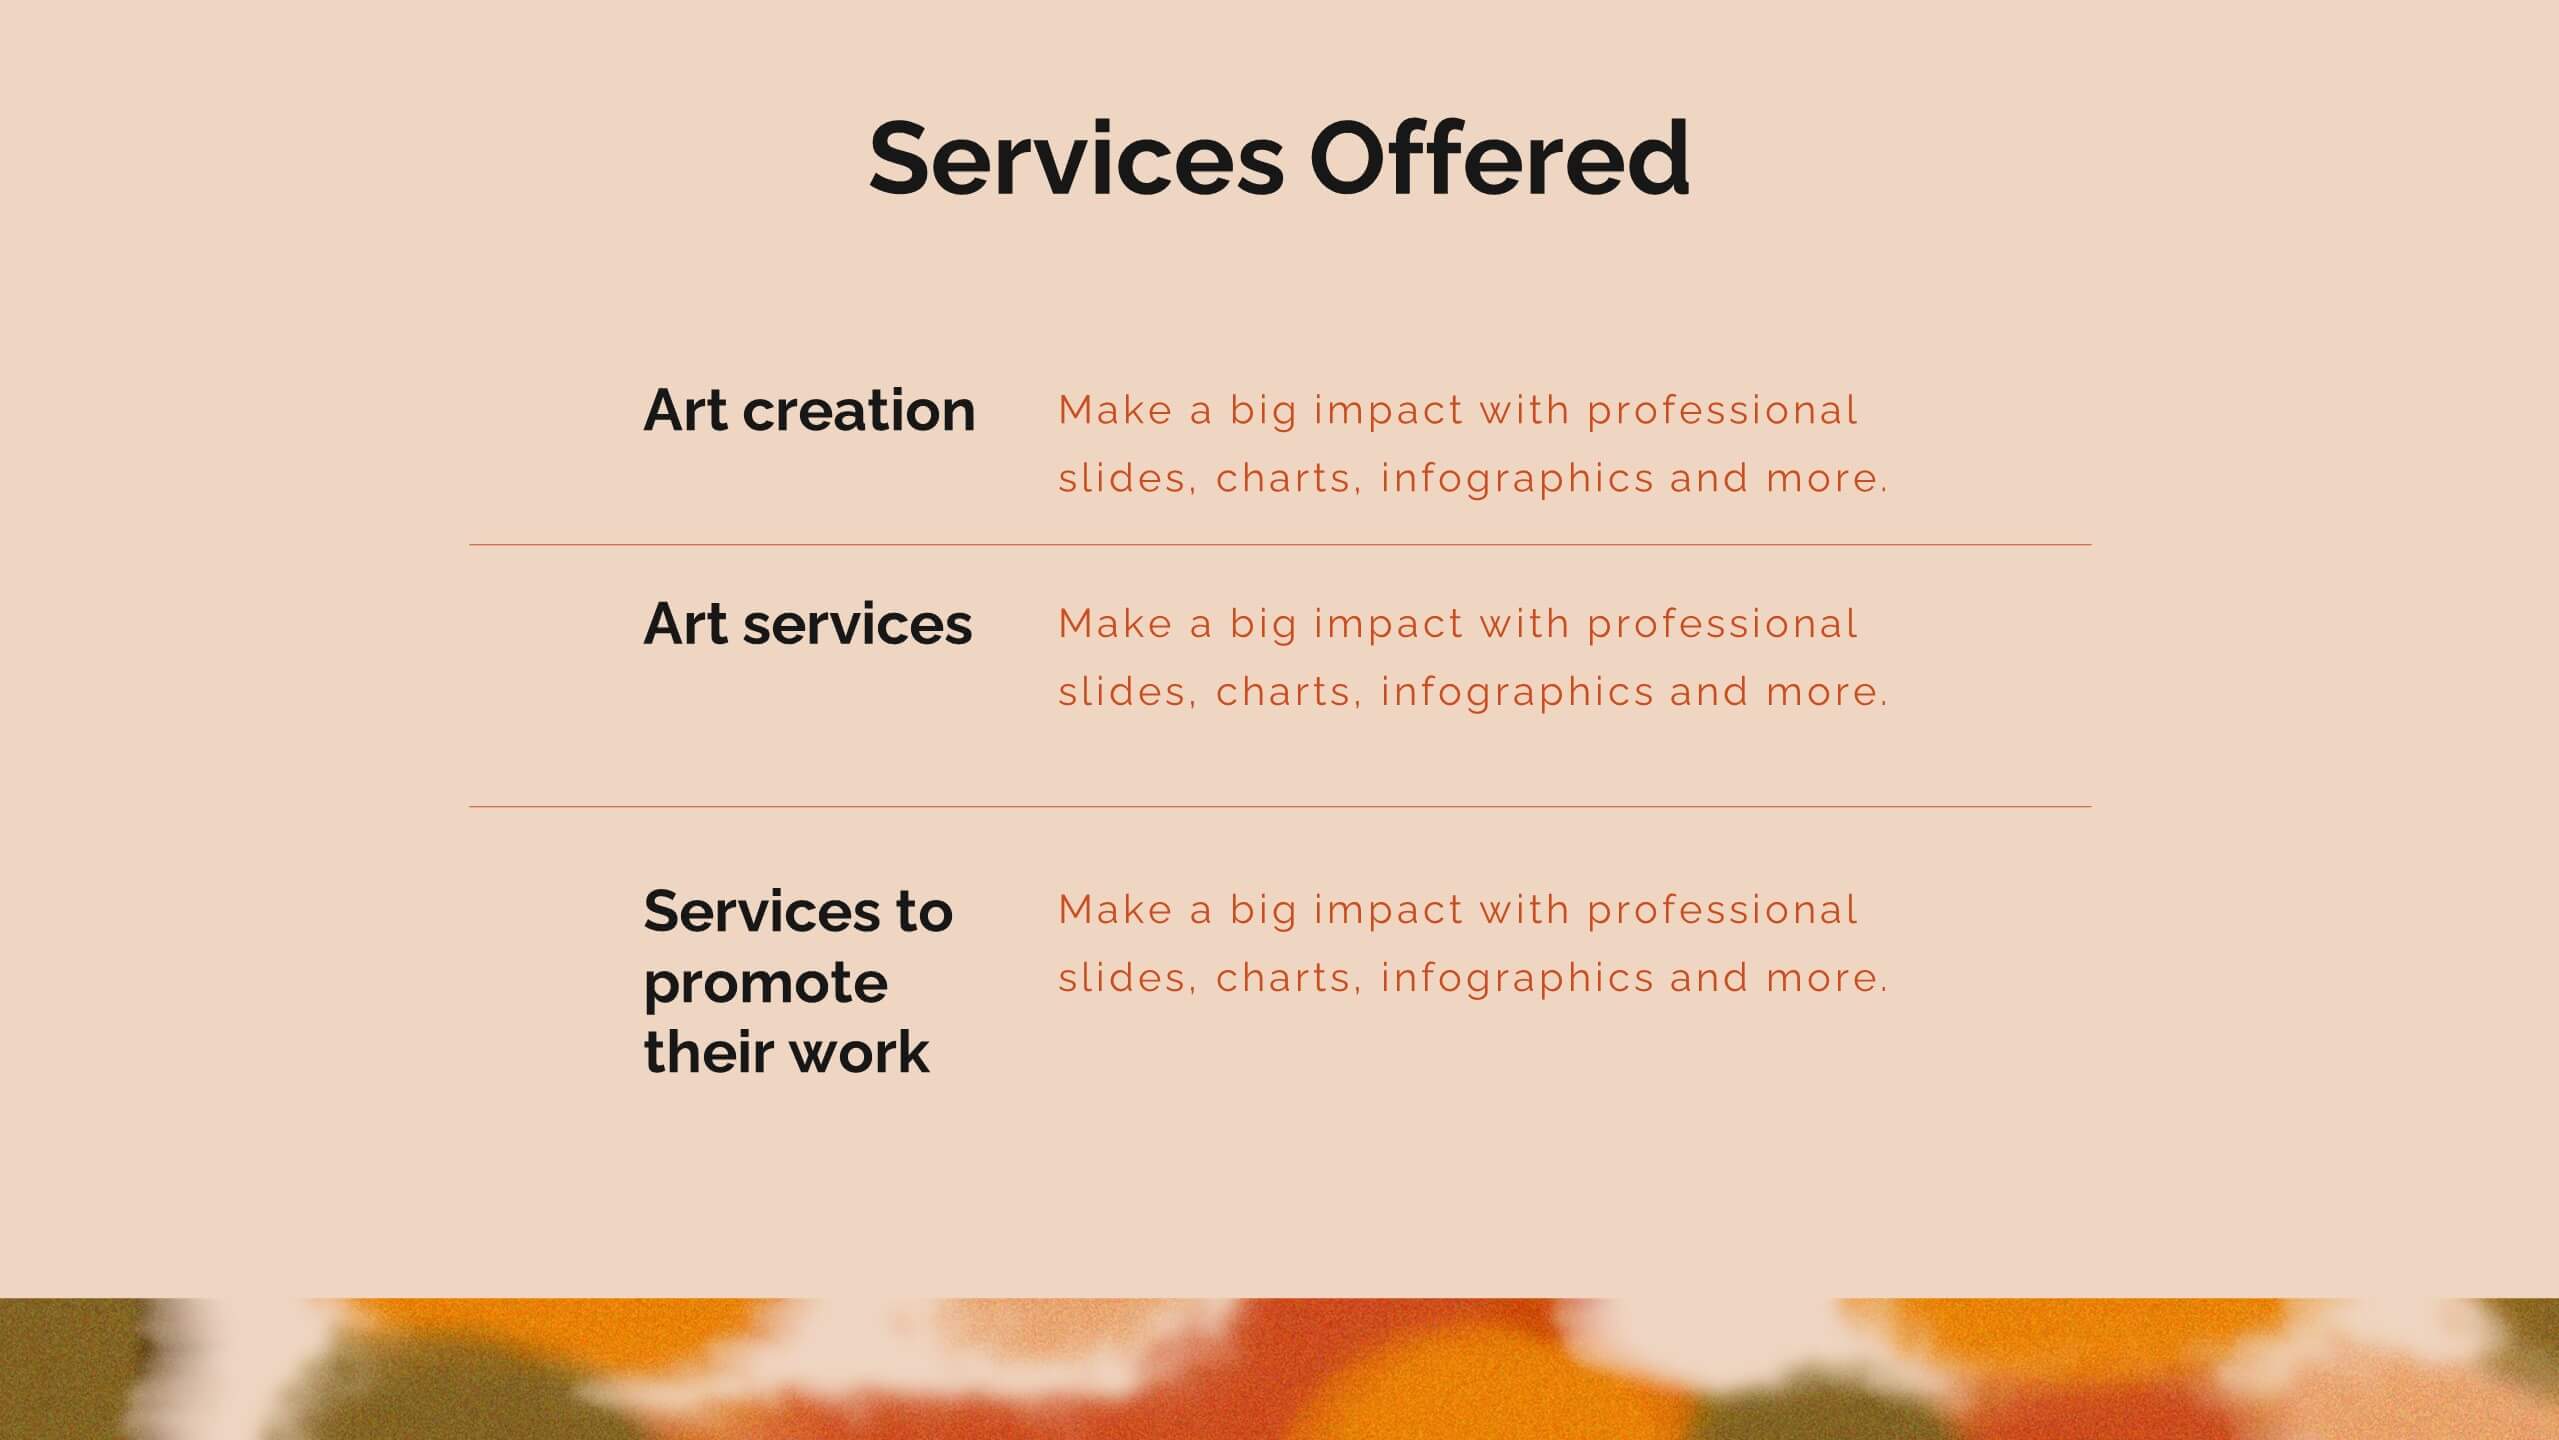
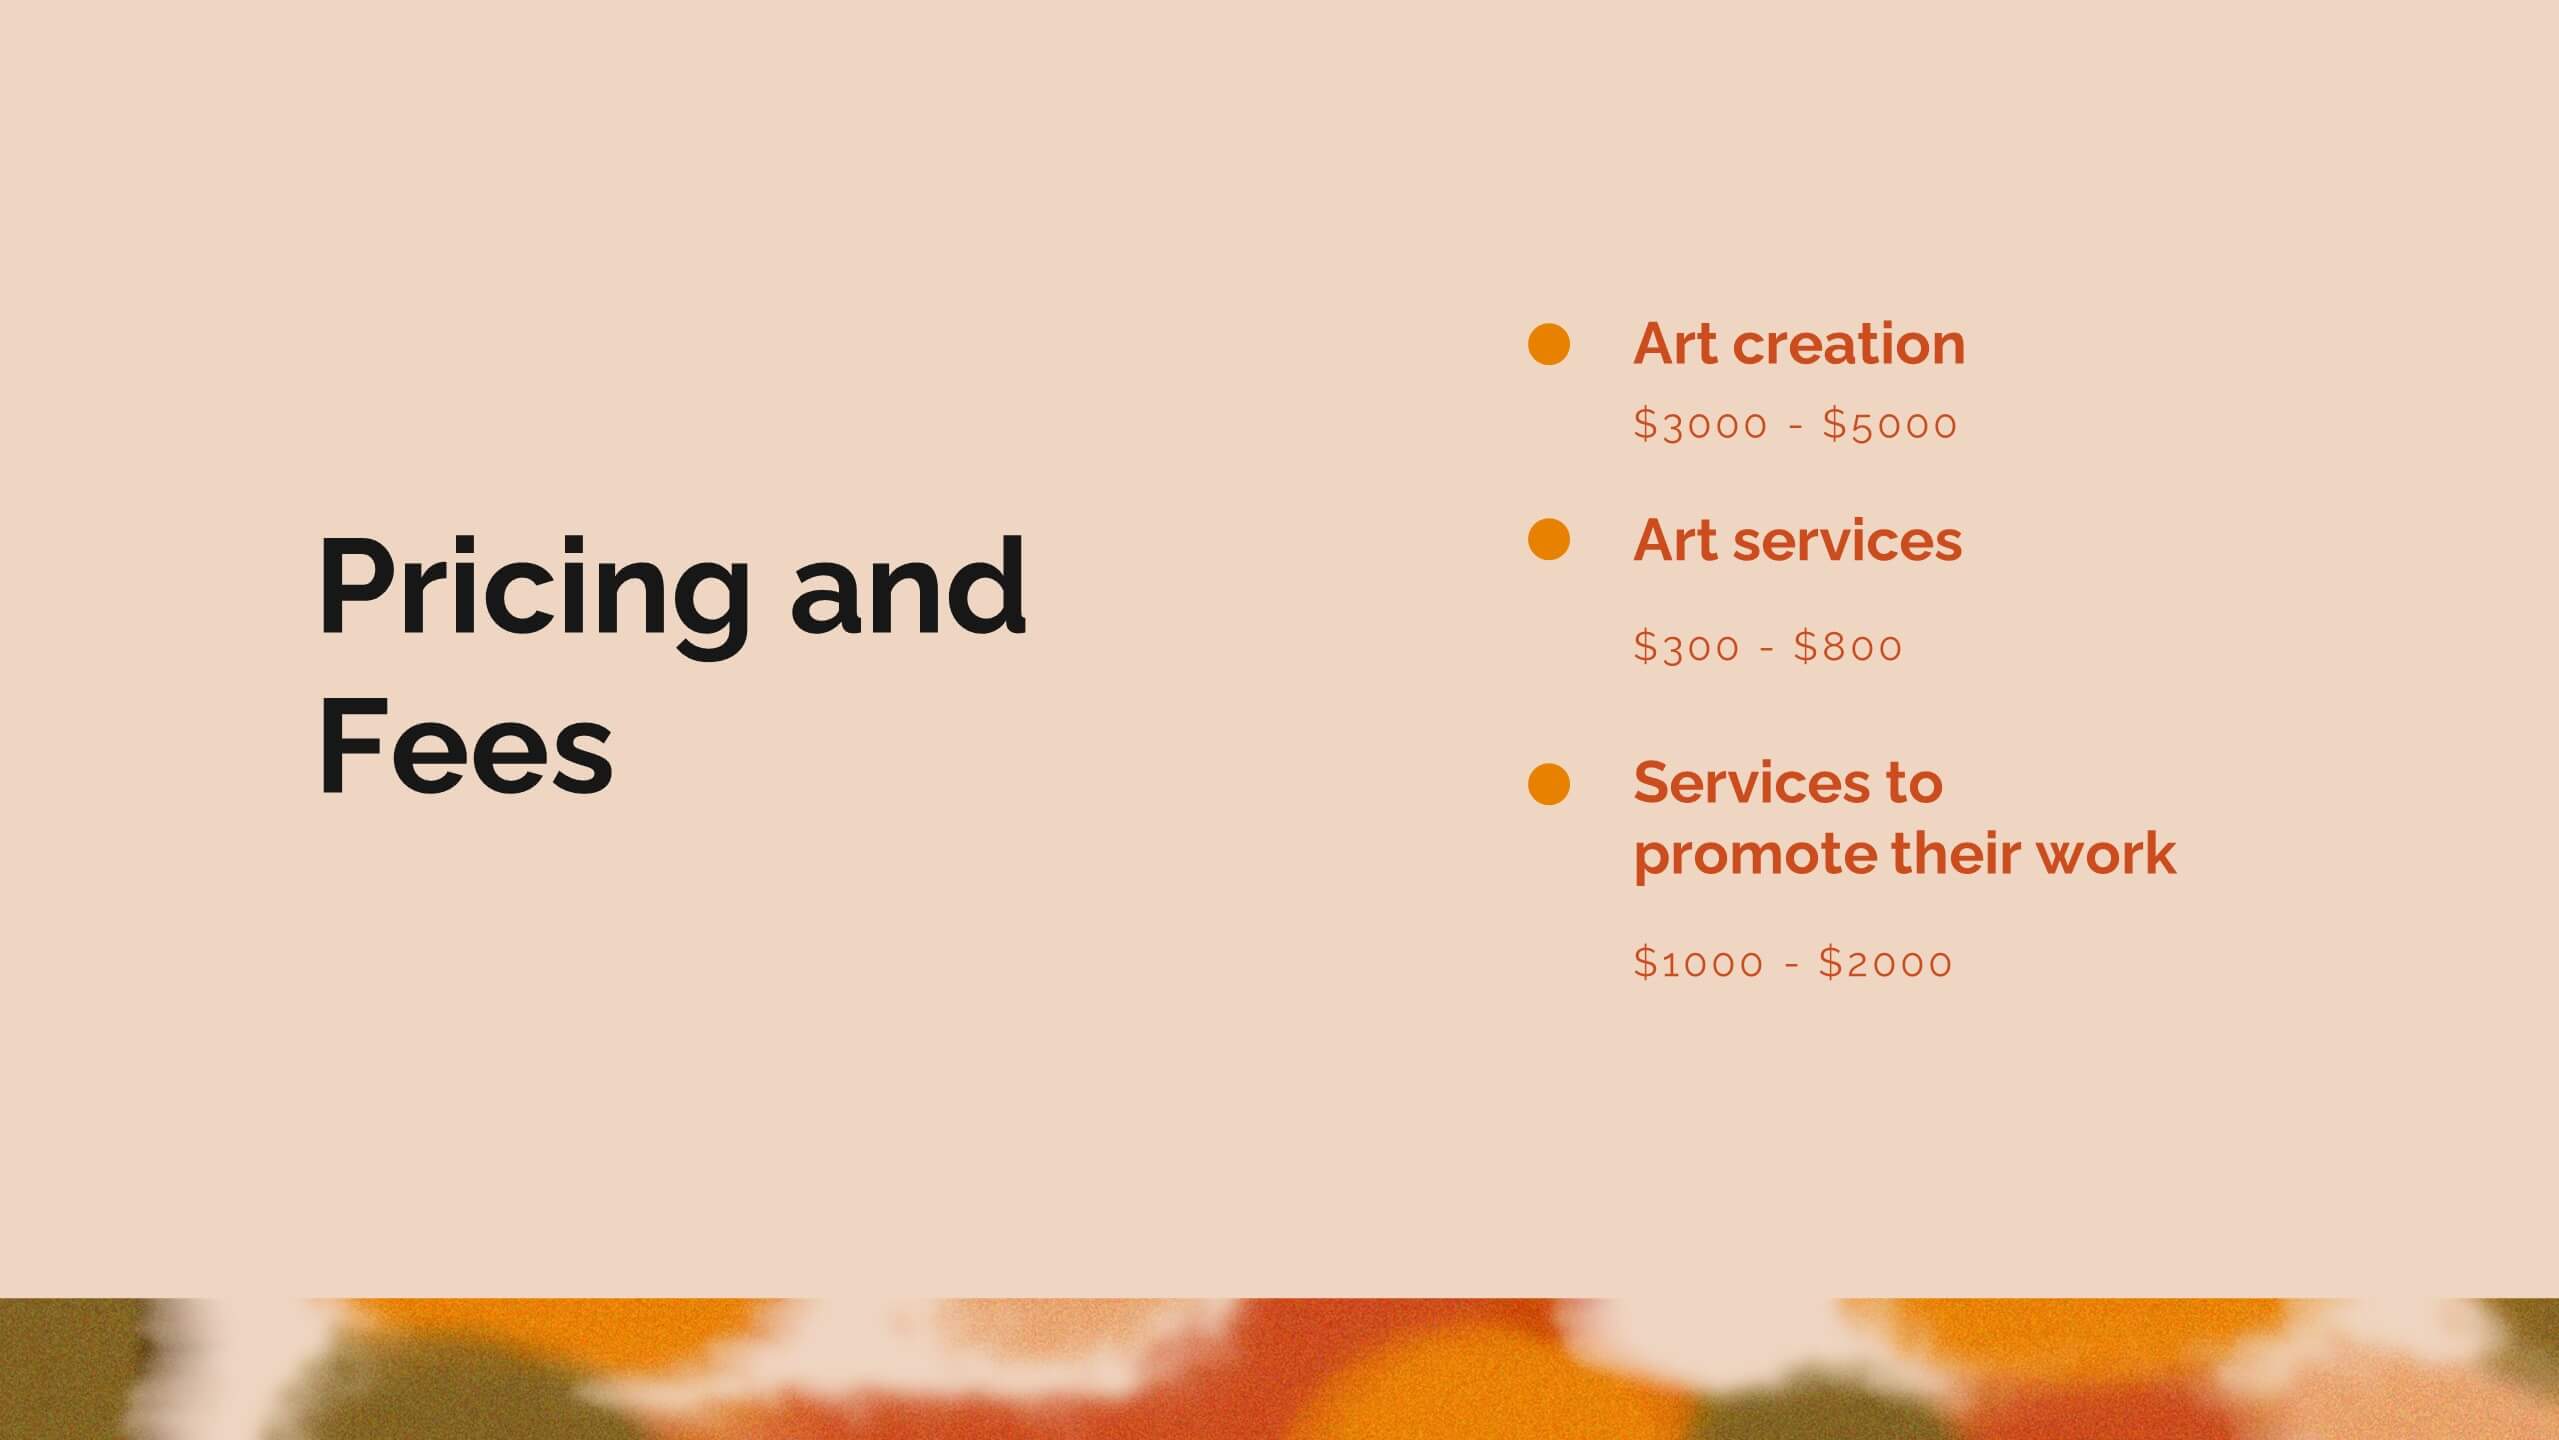
Zenith Artist Portfolio Presentation
Showcase your artistic journey with this captivating portfolio template! Perfect for presenting your projects, creative process, and client testimonials. Ideal for artists aiming to highlight their work and achievements. Compatible with PowerPoint, Keynote, and Google Slides, this template ensures your portfolio is visually stunning and professionally presented. Make your art stand out!


26 diapositivas
Sustainable Business Practices Presentation
Present your eco-friendly business approach with this straightforward template that reflects your commitment to sustainability. It's decked with leafy designs and organic textures that naturally convey your green message. From showcasing your leadership to illustrating growth with intuitive graphs, the template makes it simple to share your vision. Perfect for any platform, like PowerPoint or Google Slides, it’s designed to help you communicate big ideas, like reducing carbon footprints or embracing renewable resources, in a way that’s easy for everyone to grasp. Let this template be the backdrop as you chart a course for a sustainable future, making complex concepts like ‘green initiatives’ and ‘sustainable practices’ clear and actionable.


4 diapositivas
Key Performance Indicators Presentation
Hit every target with a bold, visual layout that helps you present performance insights with clarity and impact. This presentation makes it easy to highlight goals, measure progress, and showcase meaningful data in a clean, modern design. Fully editable and compatible with PowerPoint, Keynote, and Google Slides.