


Características


¿Tienes alguna pregunta?
Recomendar


4 diapositivas
Comparison Tables Slide Presentation
Make your insights instantly comparable with a clean layout designed to highlight differences and advantages with ease. This presentation helps you break down options, features, or plans in a clear visual table your audience can understand at a glance. Fully compatible with PowerPoint, Keynote, and Google Slides.
5 diapositivas
Business Strategy Arrow Presentation
Enhance your strategic planning with the Business Strategy Arrow Presentation. This visually structured template guides your audience through a step-by-step progression, making it ideal for business roadmaps, strategic plans, and goal-oriented workflows. Easily customize the colors, text, and icons to align with your brand. Fully compatible with PowerPoint, Keynote, and Google Slides for effortless editing and professional presentations.


7 diapositivas
PESTEL Framework Business Presentation
The "PESTEL Framework Business" presentation effectively utilizes a segmented color scheme to categorize different environmental factors impacting business strategy: Political, Economic, Social, Technological, Environmental, and Legal. Each segment is color-coded and designated space for text, making it easy to highlight how each factor can influence business operations and decision-making processes. This visual arrangement not only aids in easy comprehension but also allows for a systematic review of external factors, essential for strategic planning.


6 diapositivas
5-Step Implementation for Business Growth Presentation
Present your strategic plan with clarity using the 5-Step Implementation for Business Growth Presentation. This horizontal arrow layout guides your audience through five key phases of execution—from planning to final results. Each step is clearly numbered and color-highlighted for visual flow. Fully editable in PowerPoint, Keynote, Google Slides, and Canva.


6 diapositivas
Project Milestone and Status Update Presentation
Clearly communicate progress at every project phase with the Project Milestone and Status Update presentation slide. This table-style layout visually breaks down percentage completion across five key stages—Initiation, Planning, Execution, Monitoring, and Closing—making it ideal for status meetings, project reviews, or executive reports. Color-coded for easy reference and fully customizable in PowerPoint, Keynote, and Google Slides.
4 diapositivas
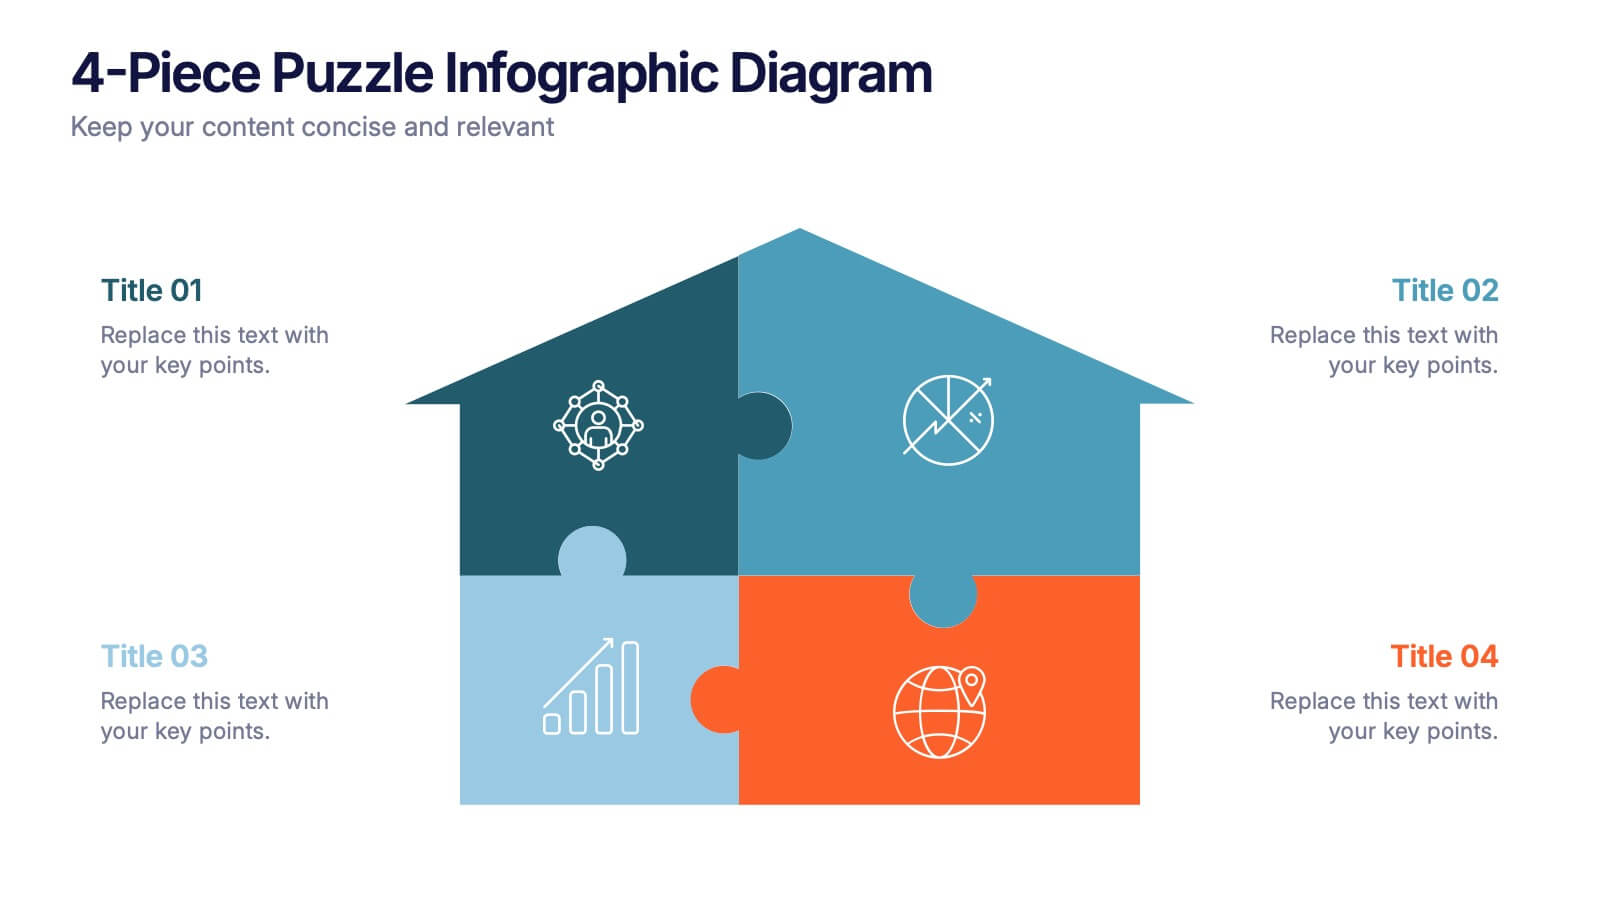
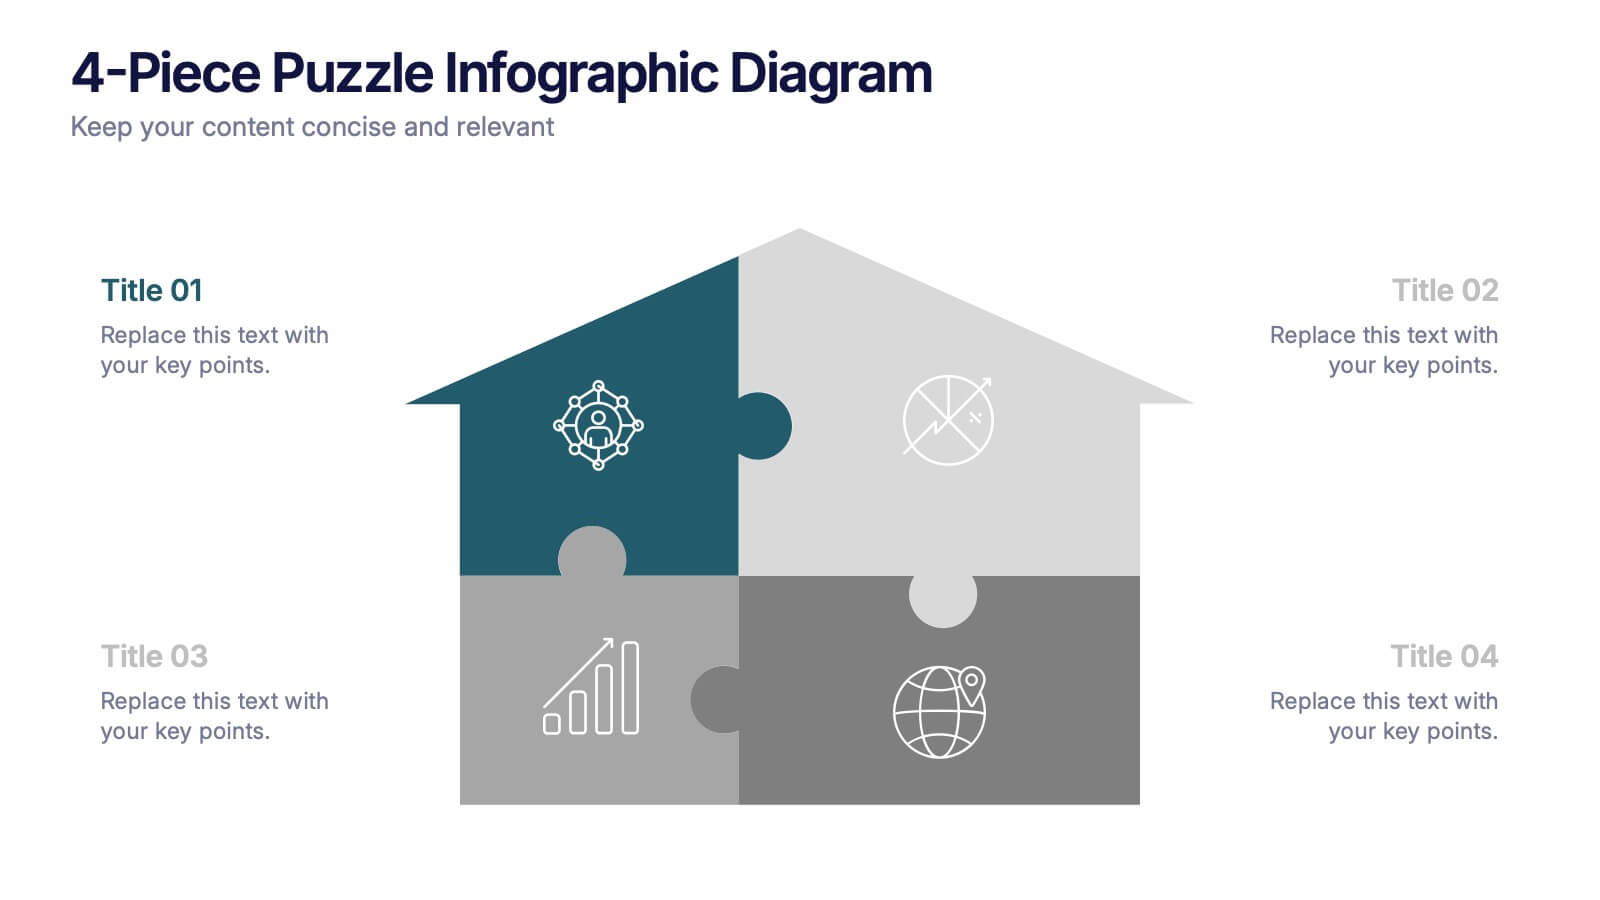
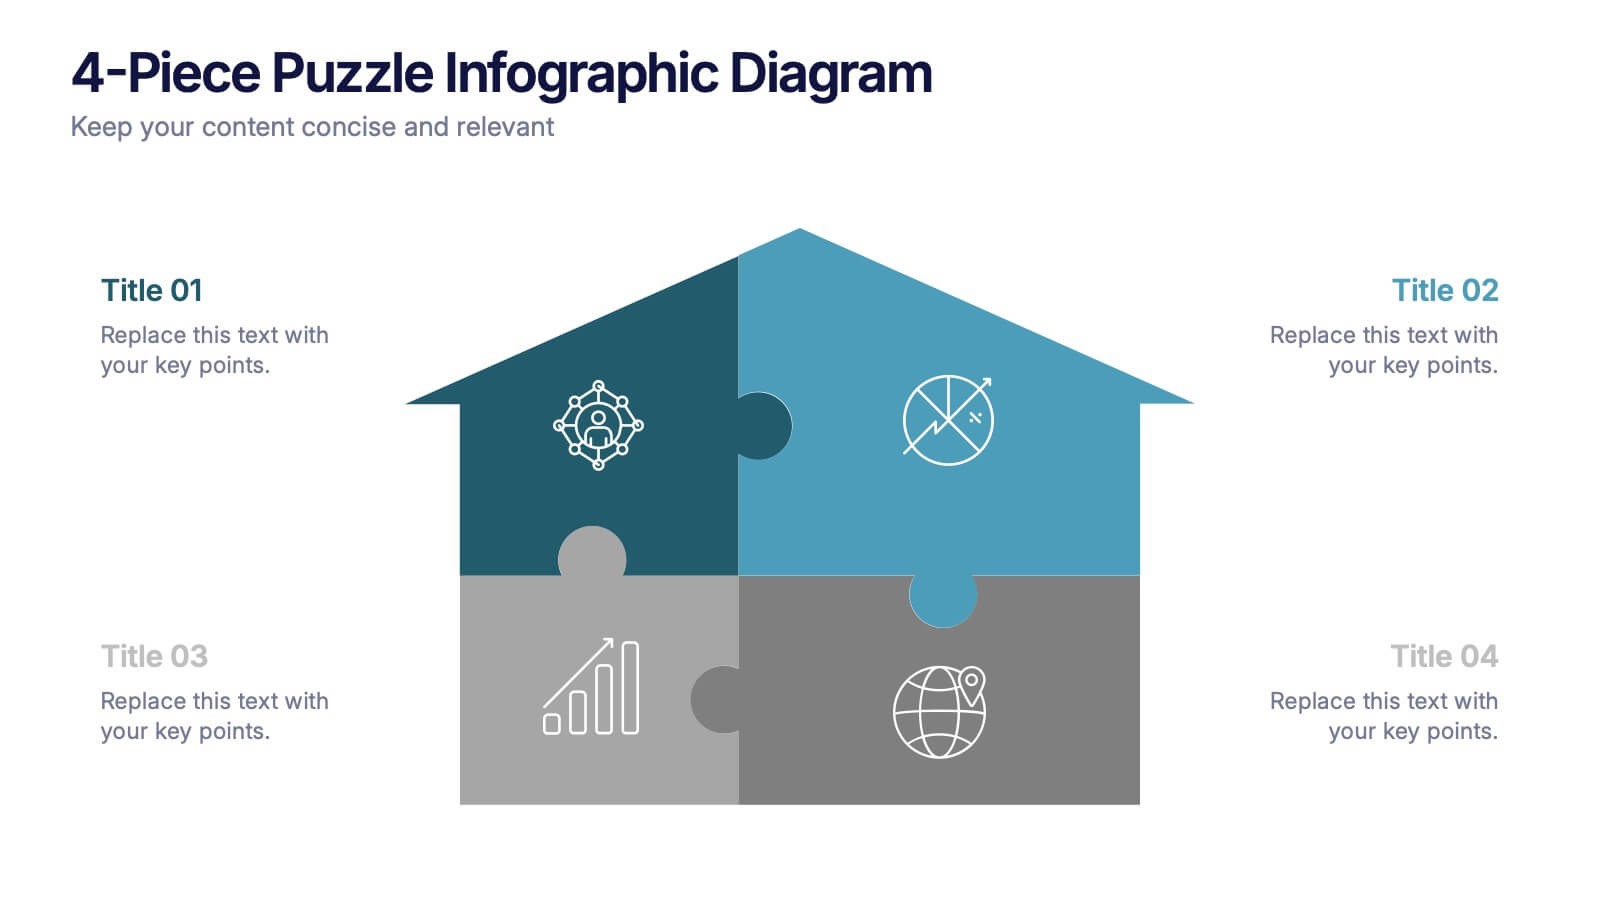
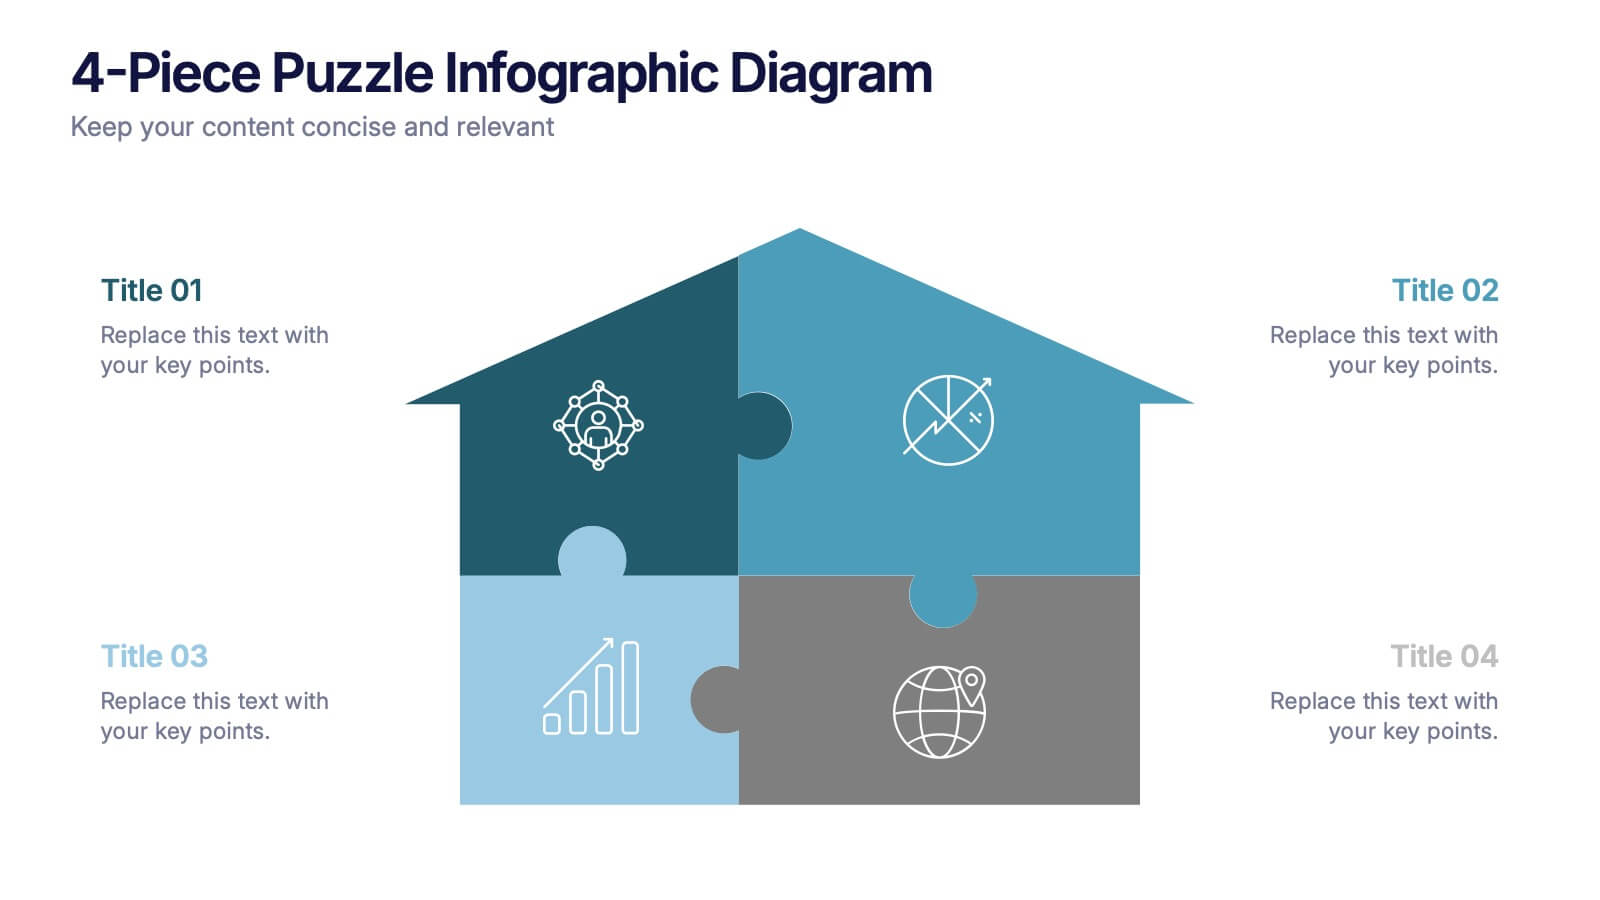
4-Piece Puzzle Infographic Diagram Presentation
Bring clarity and impact to your message with a visual layout that snaps big ideas together like a puzzle. This presentation helps you break complex concepts into four connected sections, making explanations easier and more engaging for any audience. Ideal for planning, insights, or strategy sessions. Fully compatible with PowerPoint, Keynote, and Google Slides.


6 diapositivas
5G Wireless Infographics
The "5G Wireless" infographic template is a futuristic and informative resource, perfect for PowerPoint, Keynote, and Google Slides. Designed for telecom companies, tech firms, and educators, this template is an excellent way to present the advancements and potentials of 5G technology. This template features key aspects of 5G technology, including advancements over previous generations, speed comparisons, and potential applications. Its high-tech design and clear layout make it ideal for explaining the complexities and advantages of 5G in a way that is easy to understand and visually appealing. This is especially beneficial for presentations aimed at highlighting the revolutionary impact of 5G on various industries and consumer technology. With a color scheme that uses shades of blue and metallic accents, the design conveys concepts of speed, connectivity, and innovation. This not only makes the template visually striking but also aligns with the cutting-edge nature of 5G technology. Whether used in corporate presentations, educational seminars, or tech expos, this template ensures that your insights into 5G wireless technology are communicated effectively and engagingly.


10 diapositivas
Depth-Based Visual Charts in 3D Presentation
Elevate your data storytelling with the Depth-Based Visual Charts in 3D Presentation. This slide set transforms layered information into eye-catching 3D stack visuals—perfect for showcasing rankings, workflows, or strategic hierarchies. Fully editable in PowerPoint, Keynote, and Google Slides for seamless customization.


4 diapositivas
Team Collaboration Strategy
Illustrate cross-functional teamwork with this visually engaging slide. Featuring color-coded team clusters, it's perfect for showcasing group dynamics, collaborative workflows, or project responsibilities. Use this diagram to break down organizational units, collaboration models, or department contributions. Fully editable in PowerPoint, Keynote, and Google Slides.


4 diapositivas
Corporate Governance Structure and Rules Presentation
Define leadership roles, responsibilities, and oversight with the Corporate Governance Structure and Rules Presentation. This minimalist bar-style layout is perfect for illustrating hierarchical influence, compliance levels, or board member functions. Each section can be fully edited to align with your company’s governance model, helping stakeholders visualize how power and accountability are distributed. Ideal for board meetings, corporate compliance reports, or executive briefings. Fully compatible with PowerPoint, Google Slides, and Keynote.


8 diapositivas
Geographic South America Template Presentation
Explore your data through a clean, professional map that highlights key insights and regional details across South America. Ideal for presenting demographics, business distribution, or performance metrics, this design combines clarity with impact. Fully compatible with PowerPoint, Keynote, and Google Slides for easy editing and seamless presentation.


7 diapositivas
Africa Population Infographic Presentation
An Africa Map infographic is a visual representation of the African continent, highlight its geography, population, culture, history, and other relevant information. This template provides a quick and easy way to understand complex information about the continent and make data more accessible and engaging to your audience. Use this template to include information about Africa's major cities, landmarks, natural resources, and cultural traditions. This template can be easily customized and modified to suit your specific needs, edit and highlight specific countries, regions, or data points.


5 diapositivas
Financial Goals Infographics
Financial Goals are essential for creating a roadmap towards a secure financial future. This vertical infographic template is designed to illustrates goals, progress, and performance of financial investments. This is a perfect tool to help businesses, investors, and financial advisors communicate complex financial data in a simple and easy-to-understand way. It includes colorful illustrations and icons with text boxes that can show financial growth and progress. There are also sections for your investment strategies and financial metrics. You can fully customize this template to suit your specific needs.


5 diapositivas
Organizational Tree Model
Present team structures or company hierarchies with ease using this Organizational Tree Model slide. With five clearly defined roles branching from a central trunk, it’s perfect for visualizing leadership flow, reporting lines, or role responsibilities. Fully editable in PowerPoint, Keynote, and Google Slides.


7 diapositivas
Mind Map Program Infographic Presentation
Mind Maps are appealing visuals that are easy to follow. Use our high quality template to create a mind map infographic that explains your concepts, or use it to highlight the benefits of your product in an educational way. Map out your ideas and create a visual that can be explored from many different directions. This template is suitable for both business and educational applications, so you can use it at work, school or as part of your portfolio. It’s easy to customize and compatible with PowerPoint, Keynote and Google Slides. Easily create a dynamic and engaging project in just minutes!


6 diapositivas
Hierarchical Thought Flow Mind Map Presentation
Present your ideas with clarity using this Hierarchical Thought Flow Mind Map presentation. Designed for structured thinking, this layout displays six key concepts radiating from a central theme, making it ideal for workflows, strategies, or team roles. Fully editable in Canva, PowerPoint, and Google Slides for total customization.


6 diapositivas
Circular Motion Business Wheel Diagram Presentation
Showcase continuous processes or interconnected strategies with the Circular Motion Business Wheel Diagram Presentation. This visually engaging template features a six-part circular layout, ideal for illustrating business cycles, project workflows, or recurring tasks. Each segment includes customizable titles, icons, and content areas to support clarity and impact. Fully compatible with PowerPoint, Keynote, and Google Slides.