


Características


¿Tienes alguna pregunta?
Recomendar


5 diapositivas
Oceania Business Opportunities Map Presentation
Unlock growth potential with the Oceania Business Opportunities Map template, crafted to showcase key investment zones and emerging markets across the region. Utilize interactive mapping tools to analyze market viability and sector-specific opportunities effectively. Ideal for businesses looking to expand in Oceania. Compatible with PowerPoint, Keynote, and Google Slides.


10 diapositivas
4 Stages of Strategic Execution Process Presentation
Clarify your strategy with the 4 Stages of Strategic Execution Process Presentation. This visually layered circle layout walks your audience through each key stage of execution—ideal for planning, operations, and team alignment. Each step is color-coded and fully editable, ensuring your message stays focused. Compatible with PowerPoint, Keynote, Google Slides, and Canva.


23 diapositivas
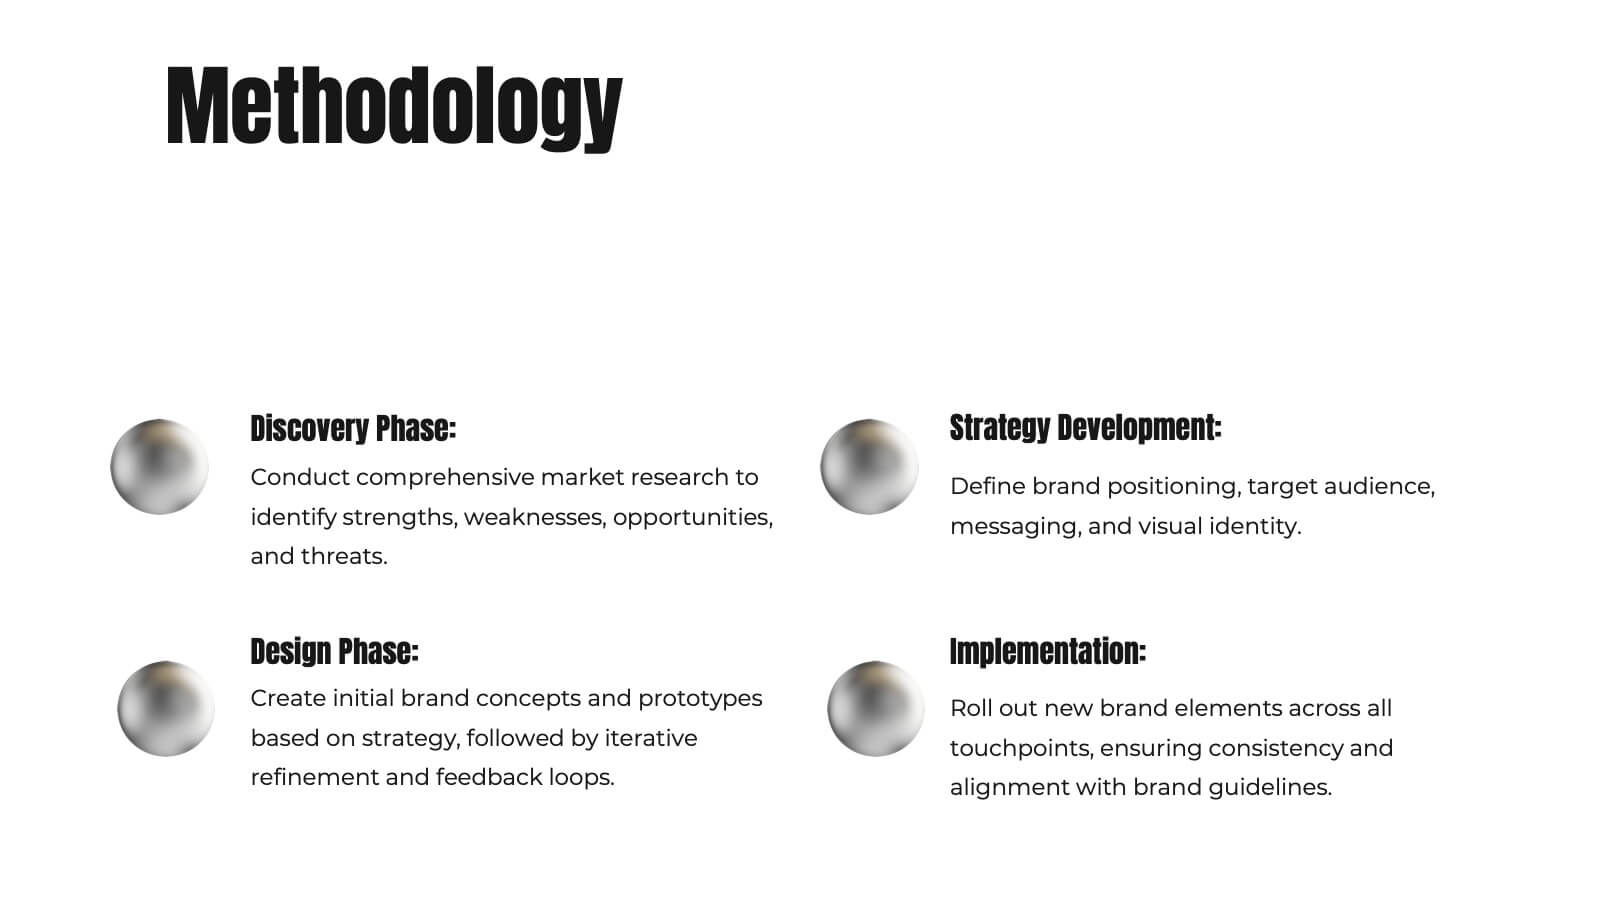
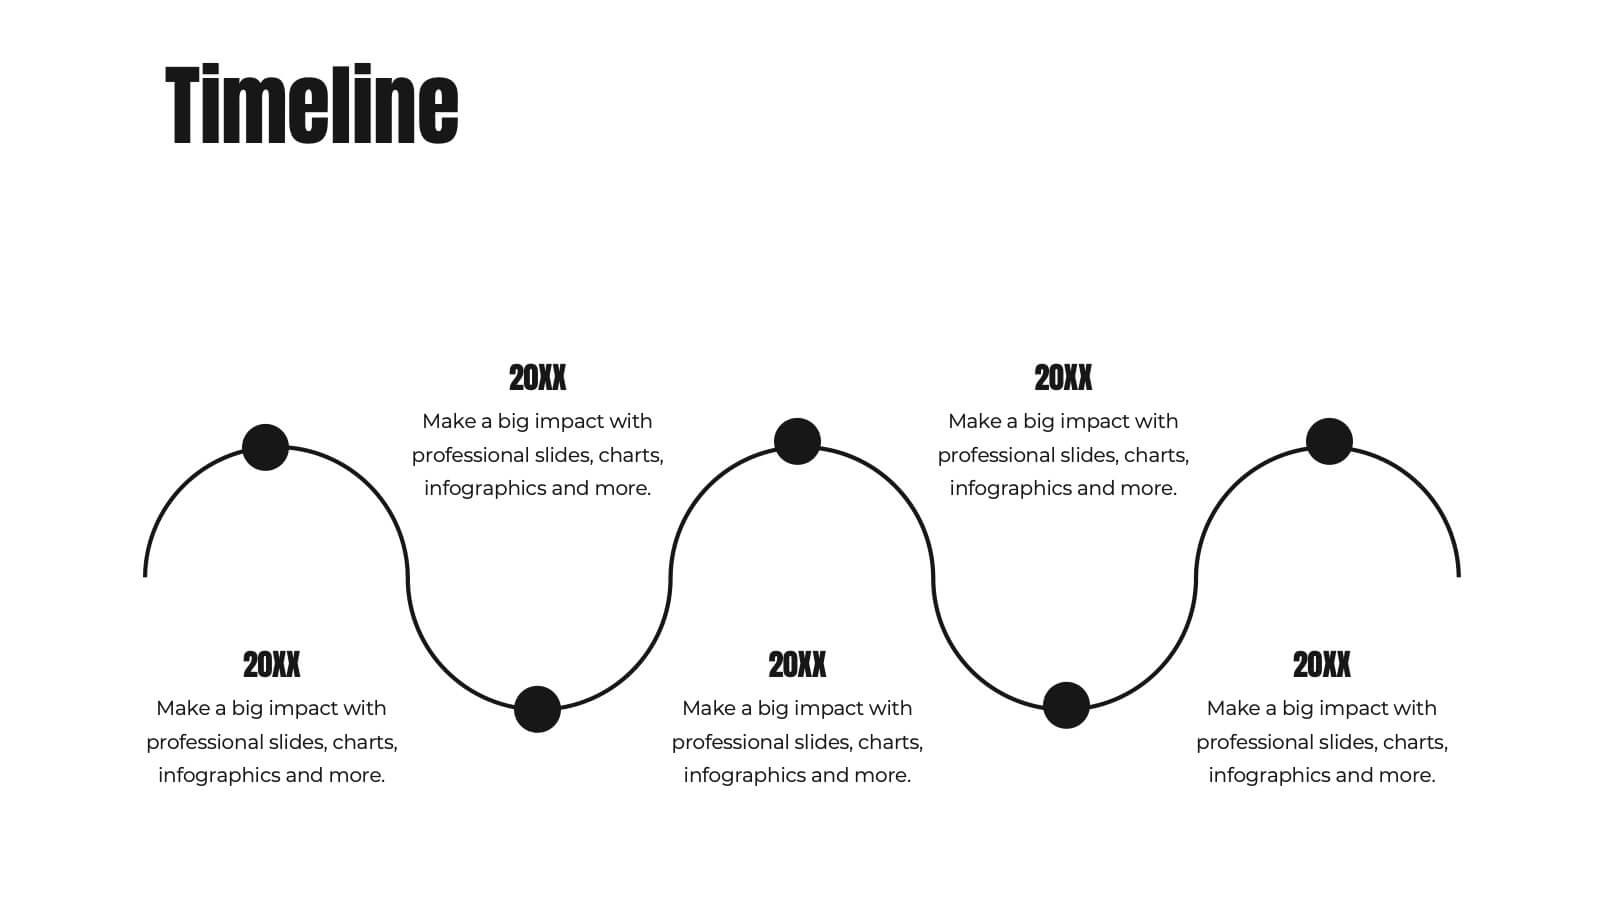
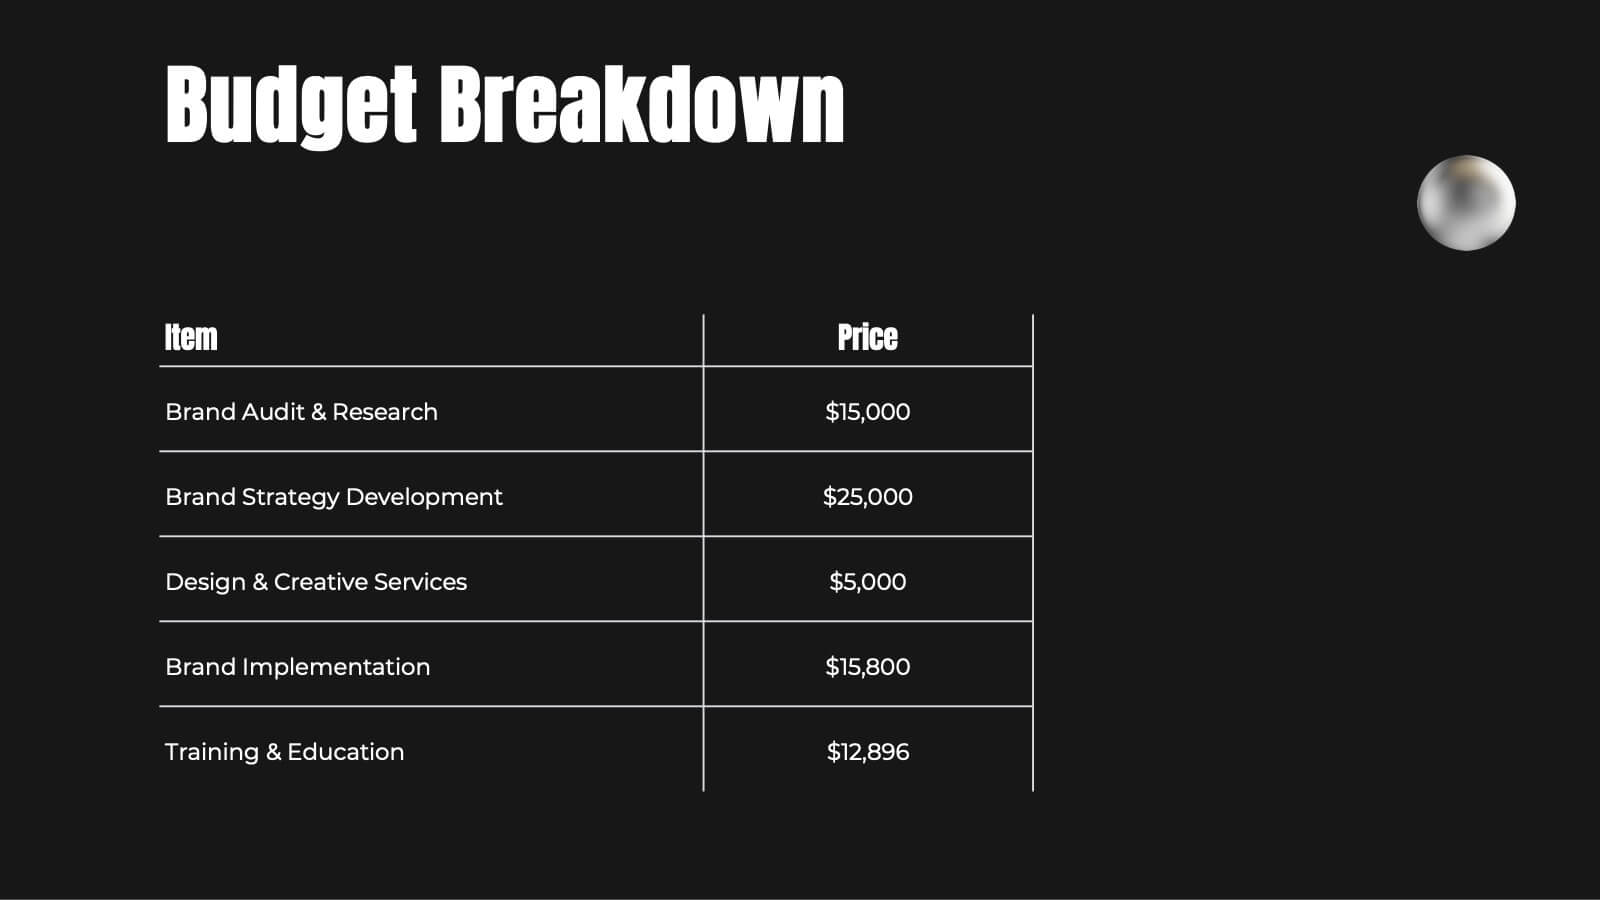
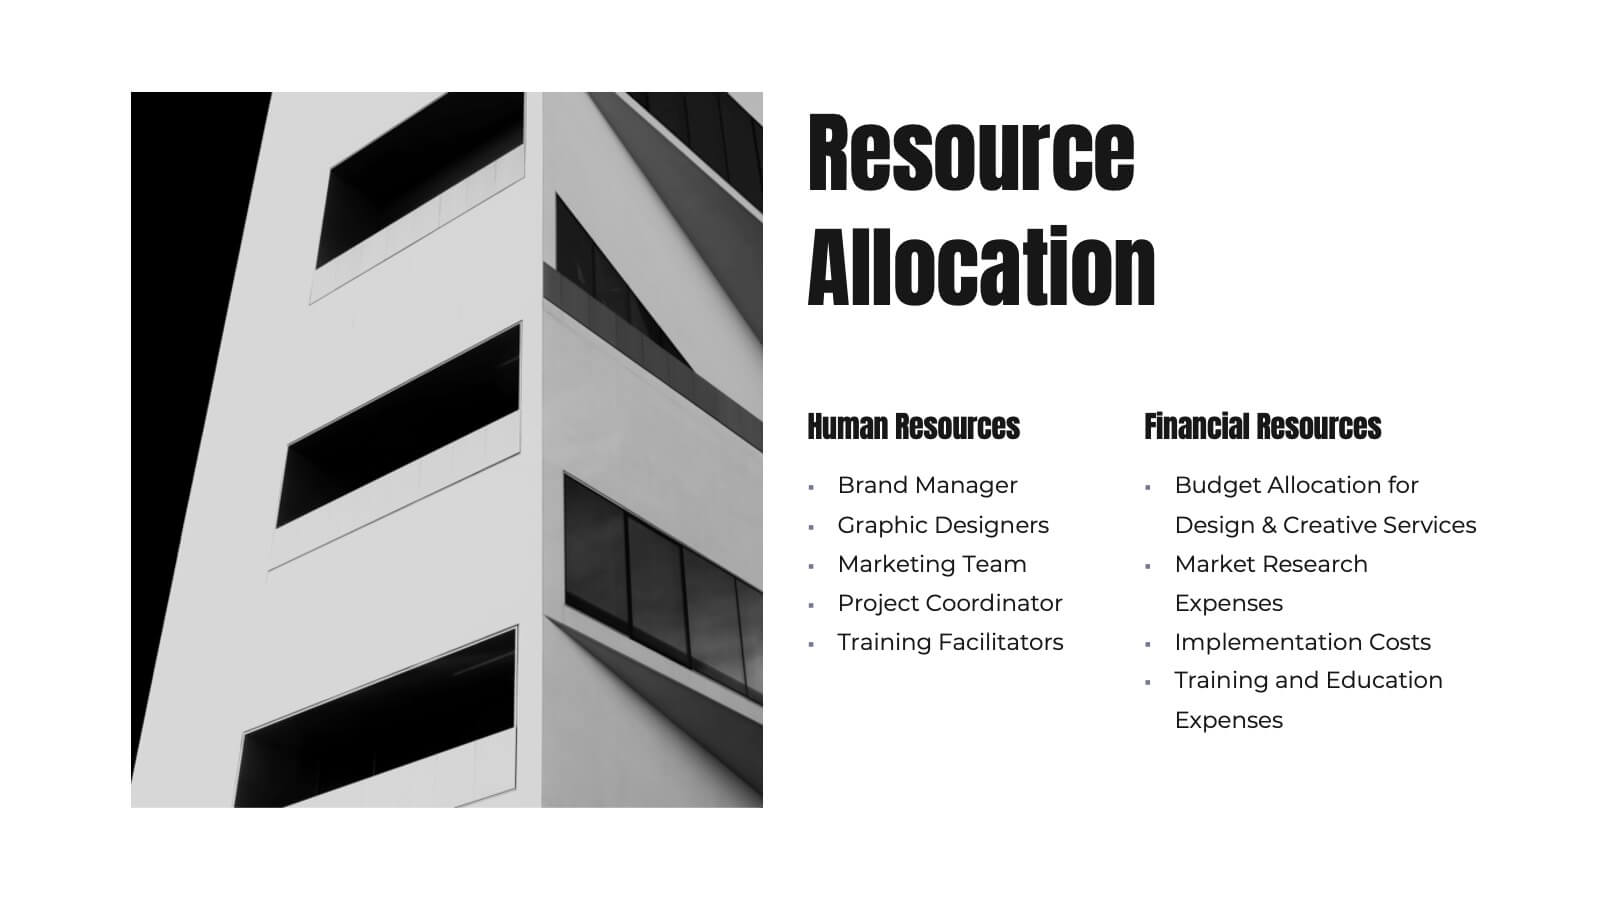
Artarix Business Development Proposal Presentation
Streamline your growth strategy with this modern and professional presentation template. Covering key elements such as collaboration opportunities, performance metrics, process improvement, and resource allocation, it provides a structured approach to business expansion. Fully customizable and compatible with PowerPoint, Keynote, and Google Slides for seamless editing.


23 diapositivas
Flash Cannon Corporate Strategy Report Presentation
Get ready to elevate your business presentations with the Flash Canvas Corporate Strategy Report template! This bold and modern template is designed to command attention with its striking black and blue color scheme, perfect for delivering high-impact reports. Whether you're outlining strategic initiatives, showcasing performance metrics, or discussing team updates, this template ensures your content is not only informative but also visually compelling. The clean and structured layout guides your audience through every key point, making complex information easy to digest. Each slide is tailored to present challenges, solutions, collaboration opportunities, and more, in a way that is both professional and engaging. Ideal for corporate environments, board meetings, or any setting where you need to communicate strategy effectively. Fully compatible with PowerPoint, Keynote, and Google Slides, this template is your go-to for delivering presentations that leave a lasting impression.


5 diapositivas
Effective Time Management Strategies Presentation
Master productivity with structured time management strategies using this Effective Time Management Strategies template. Featuring a dynamic stopwatch visual, this slide is perfect for presenting key productivity techniques, time-blocking methods, and efficiency-boosting strategies. Ideal for business professionals, project managers, and personal development trainers, this template is fully customizable and compatible with PowerPoint, Keynote, and Google Slides.


6 diapositivas
Strategic Triangle Layout Presentation
Turn your ideas into a visual roadmap with this sleek, geometric layout that balances design and strategy. Perfect for illustrating workflows, key milestones, or connected concepts, it helps your message flow seamlessly across stages. Fully editable and compatible with PowerPoint, Keynote, and Google Slides for effortless customization.


21 diapositivas
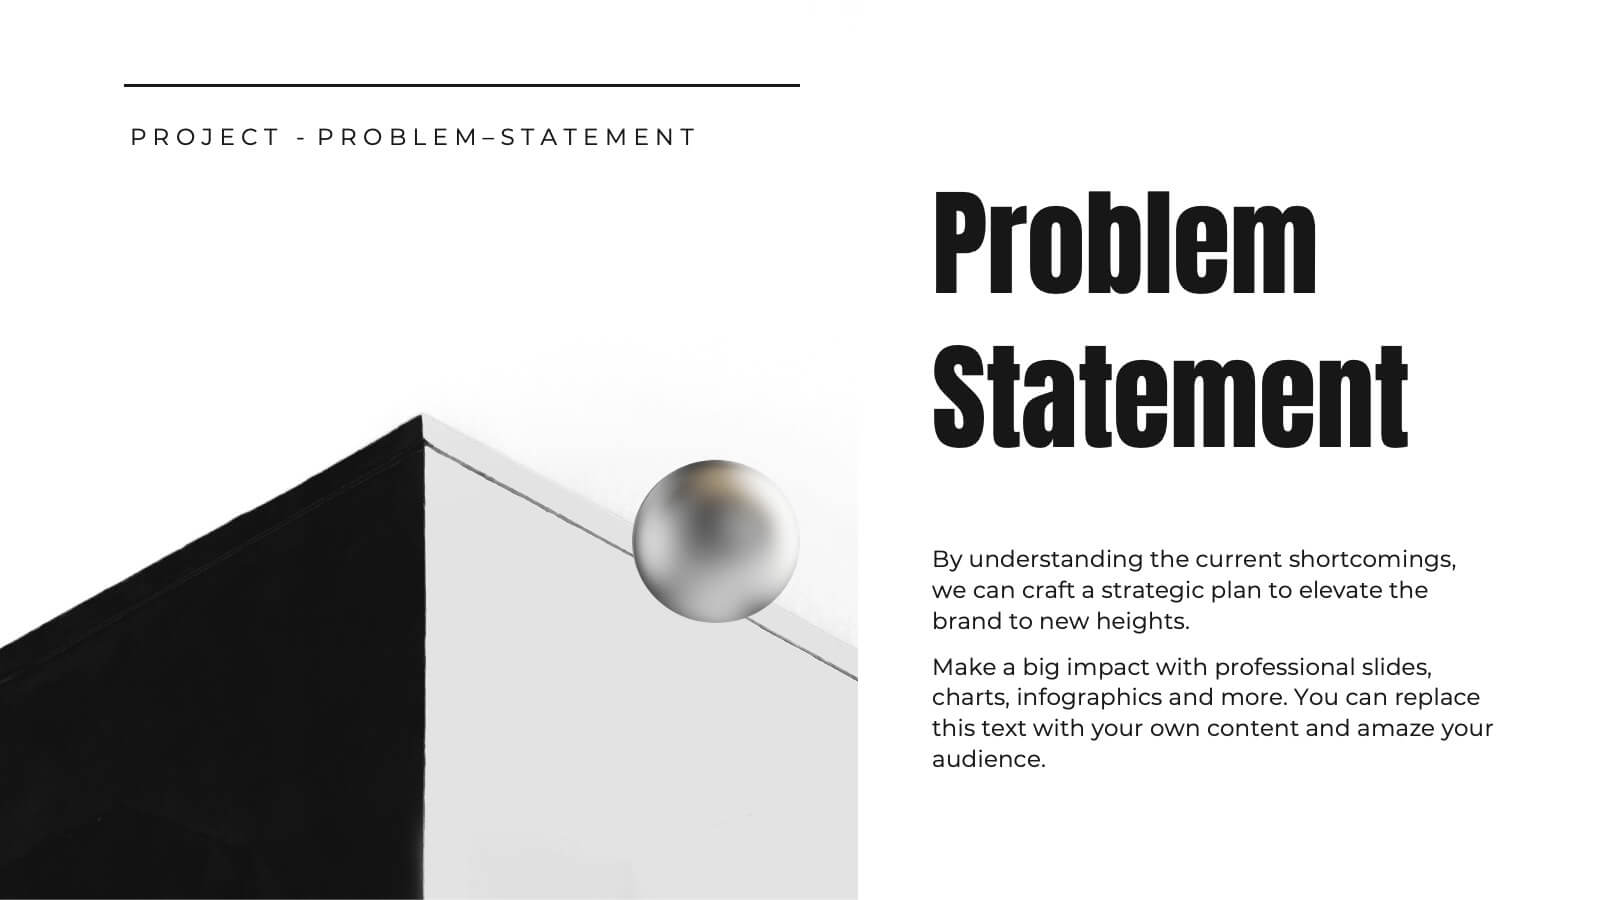
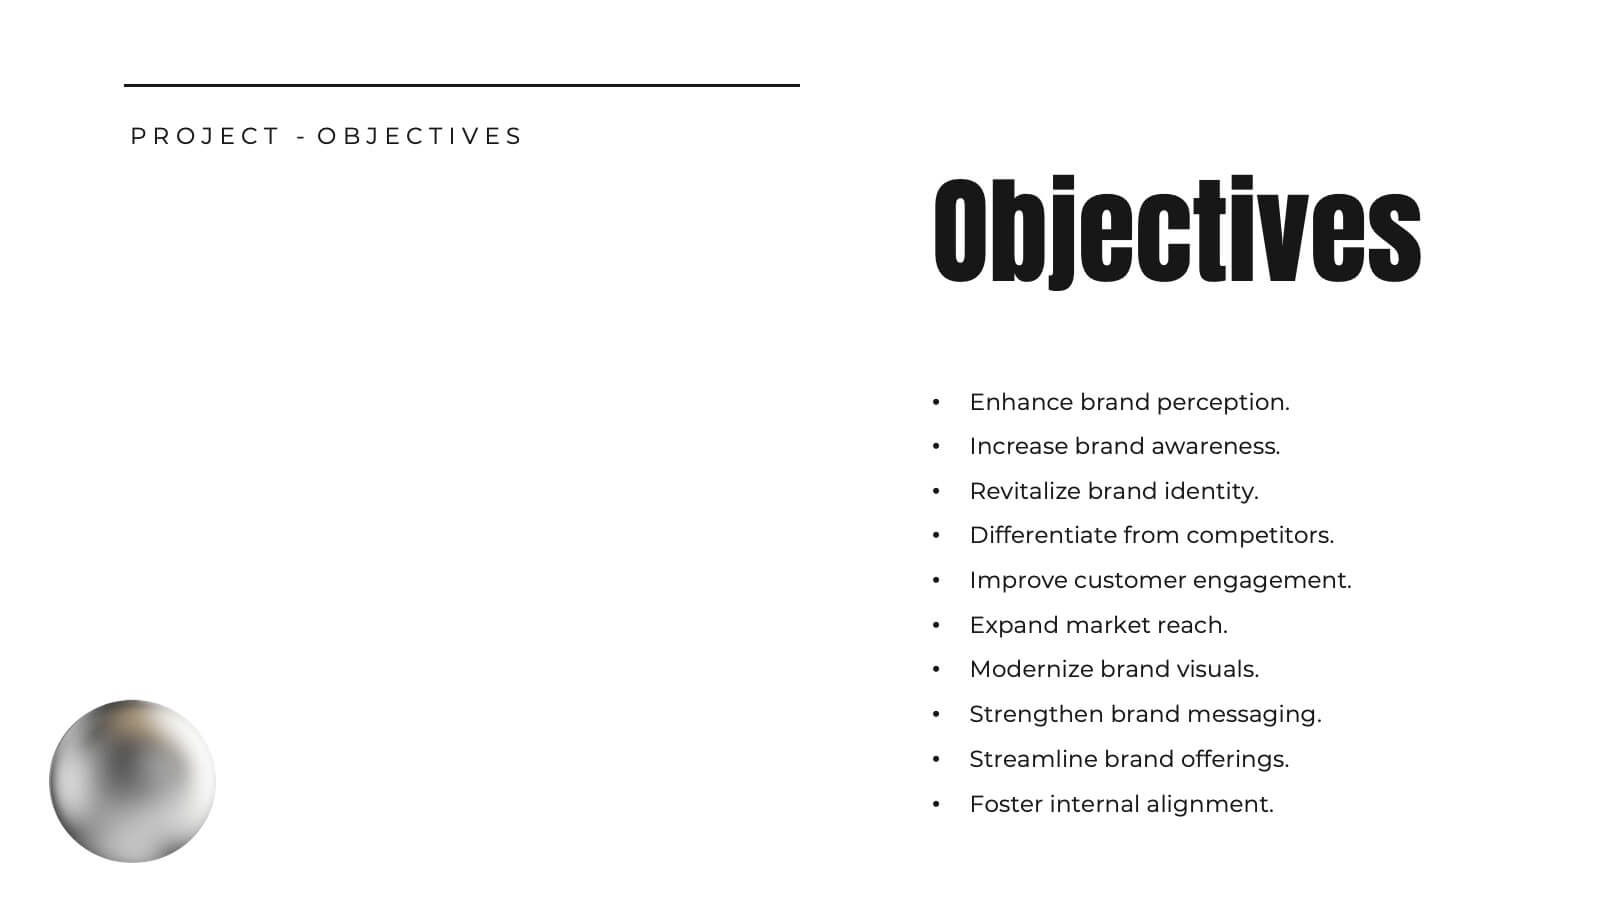
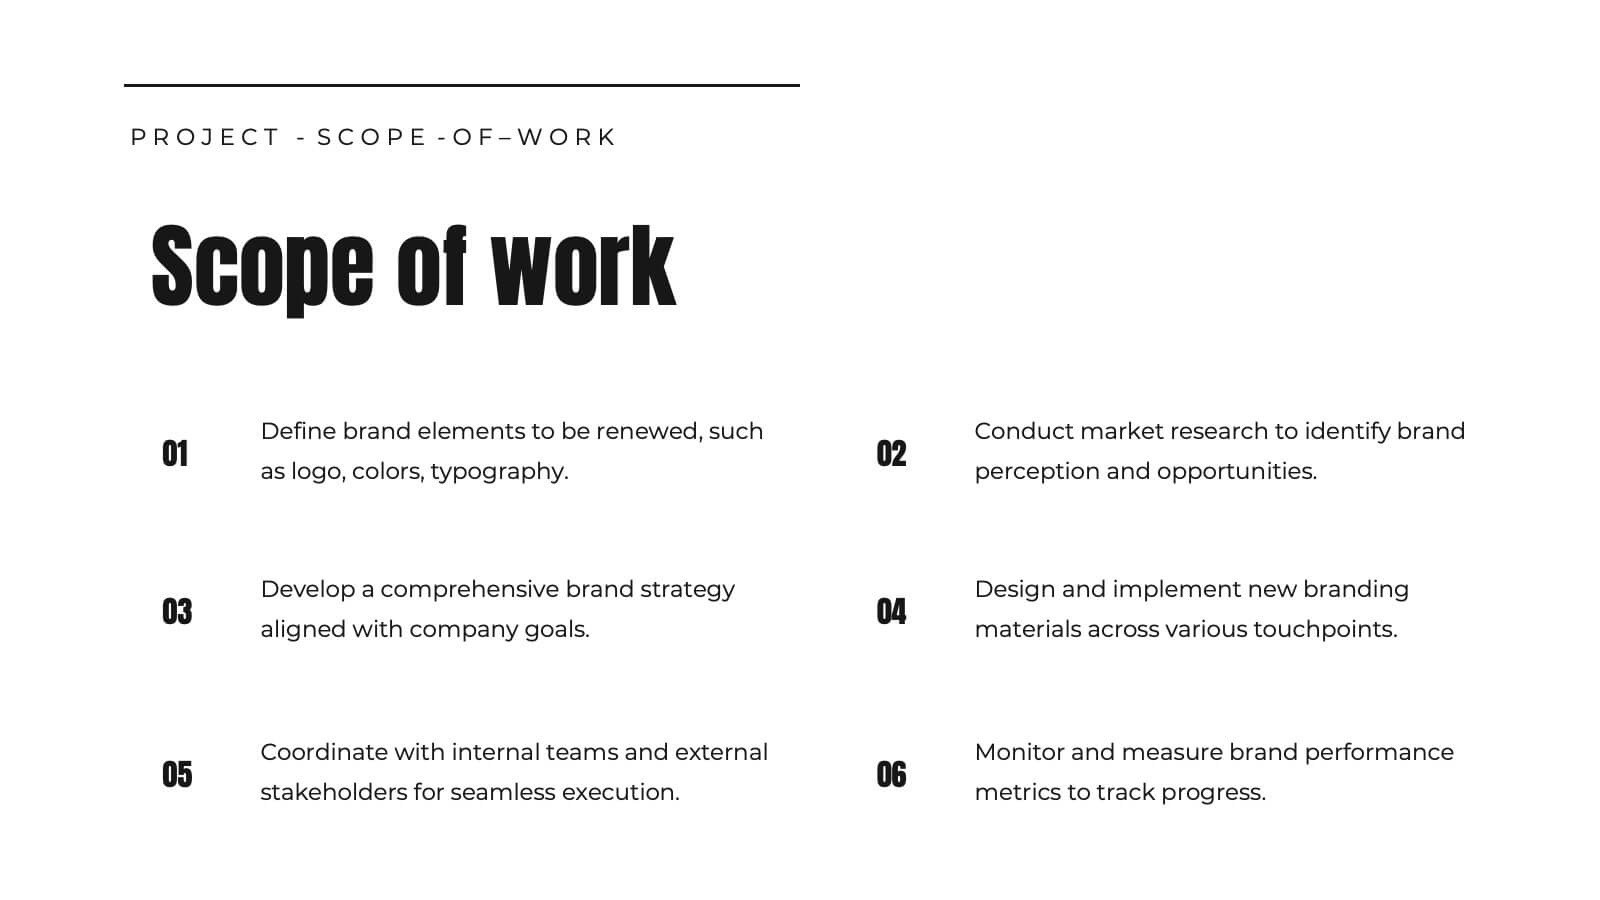
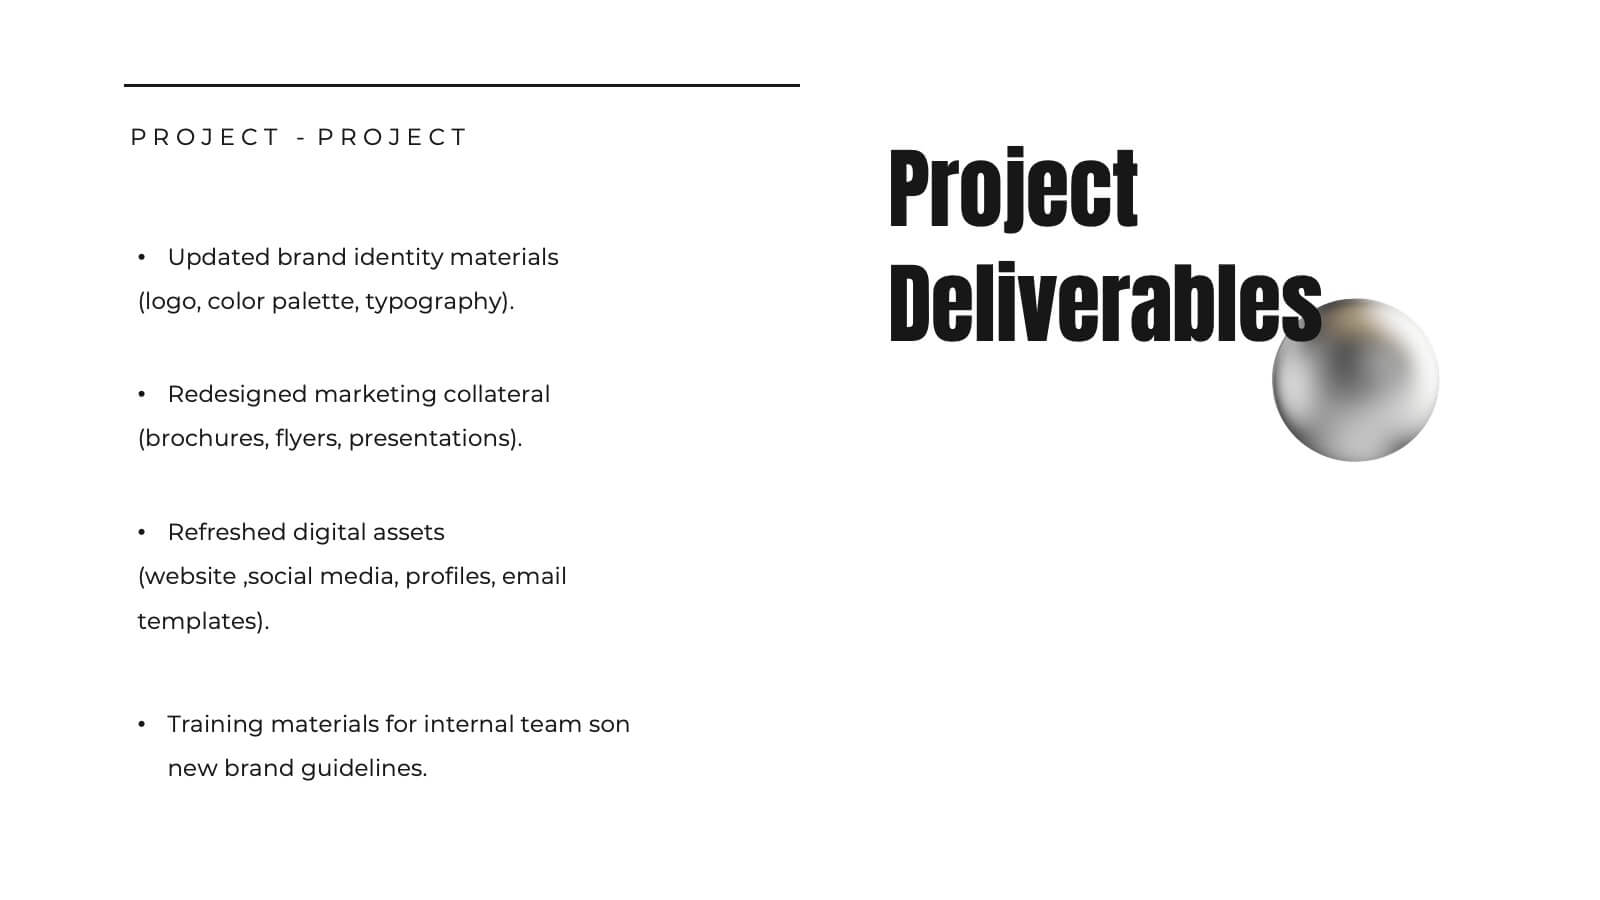
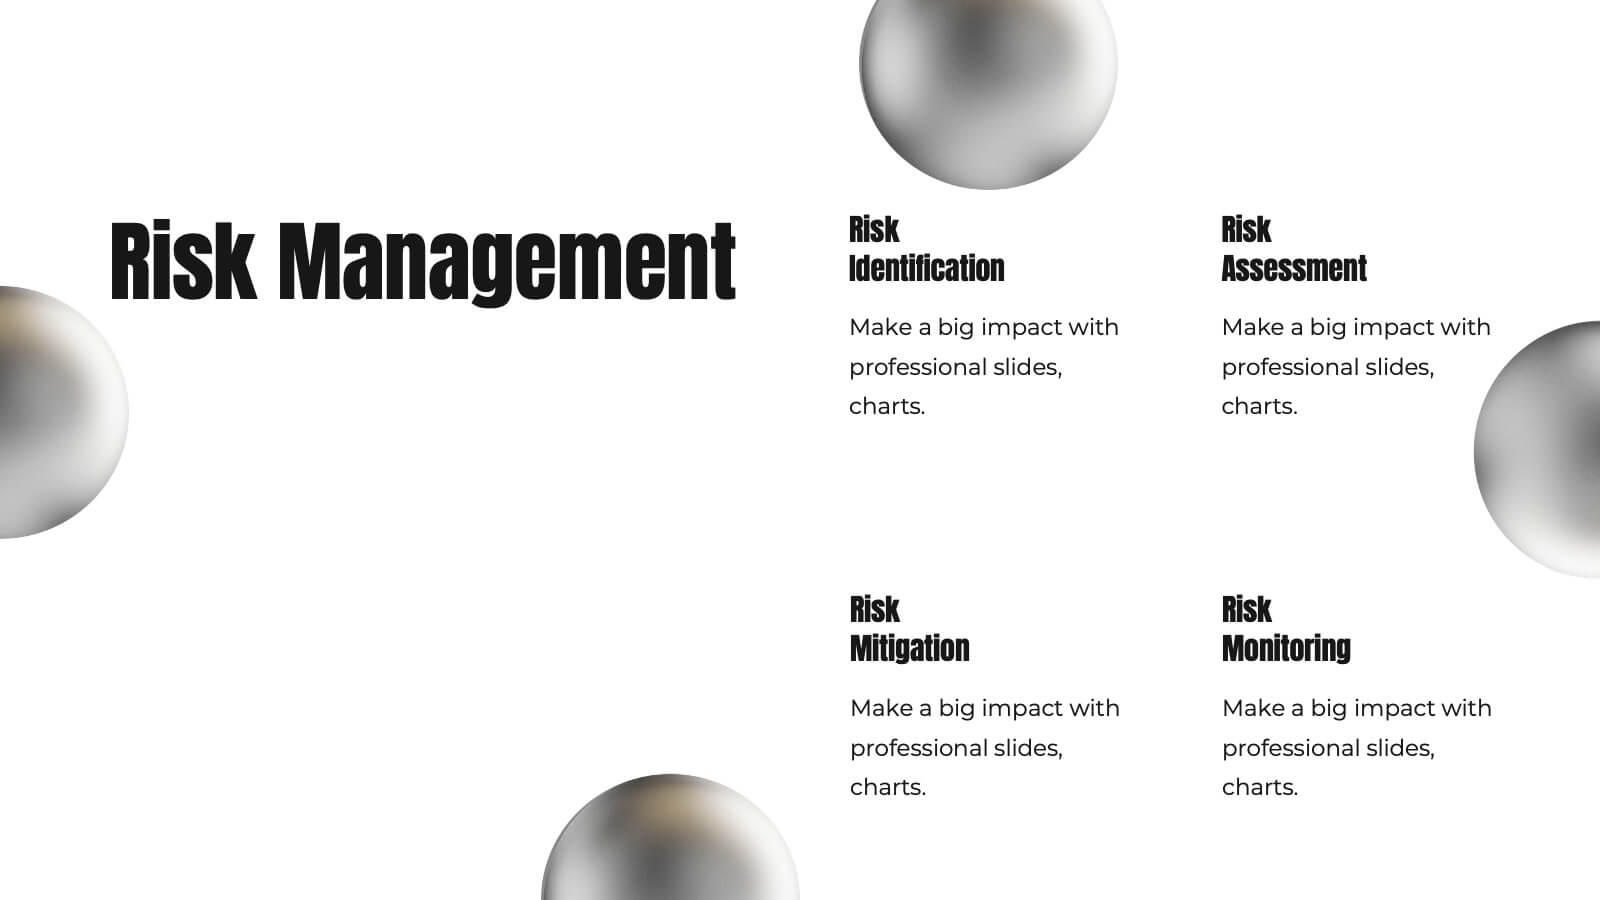
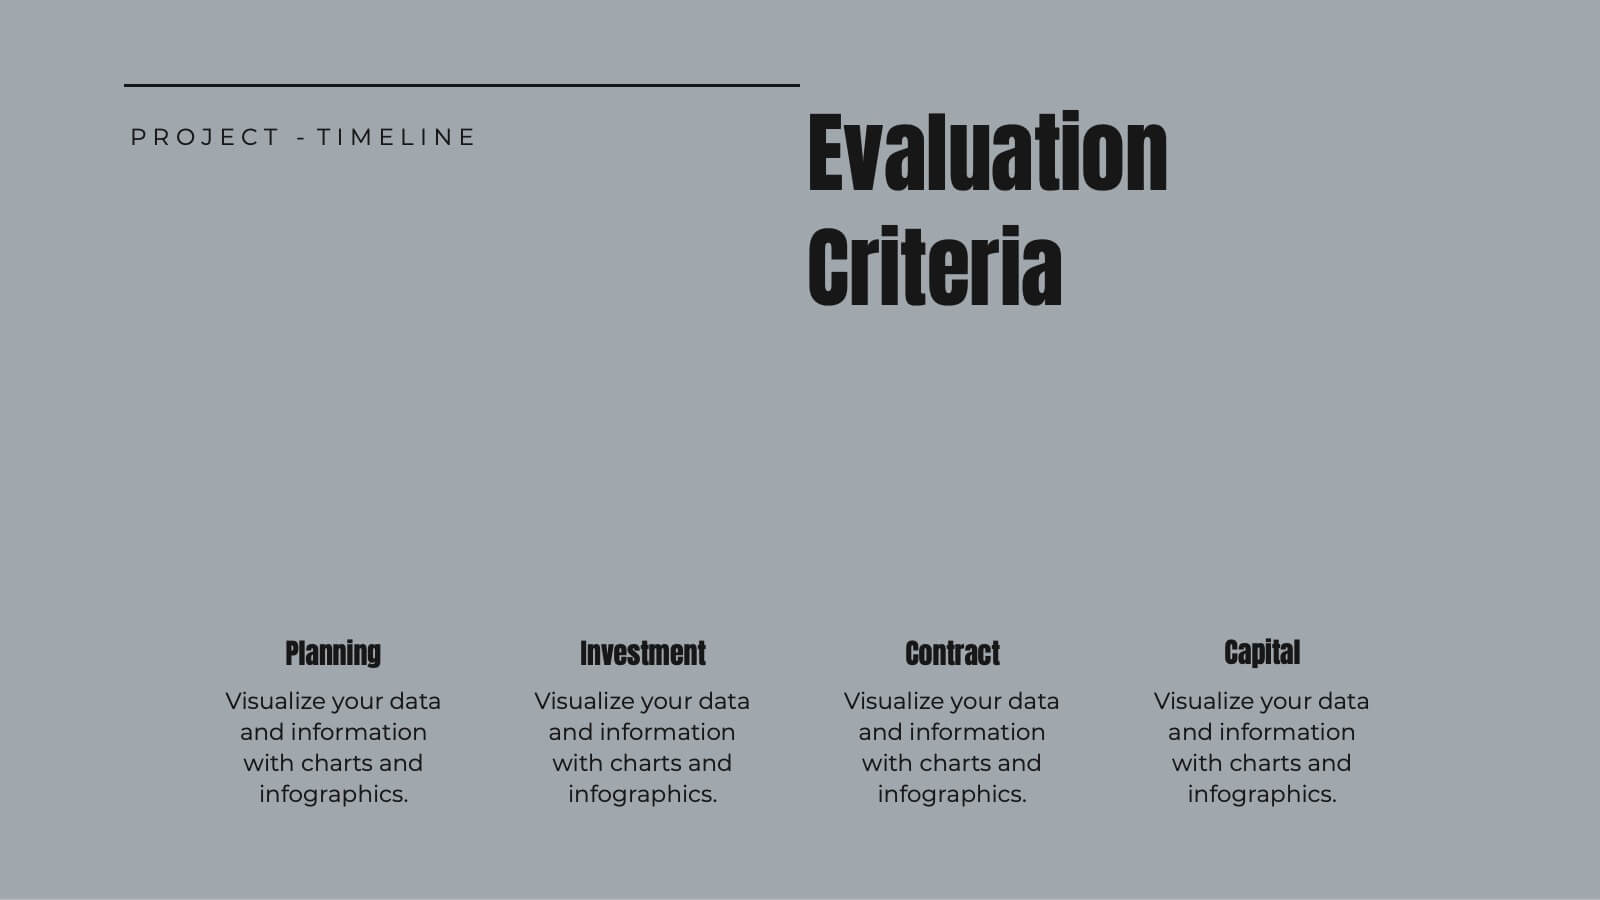
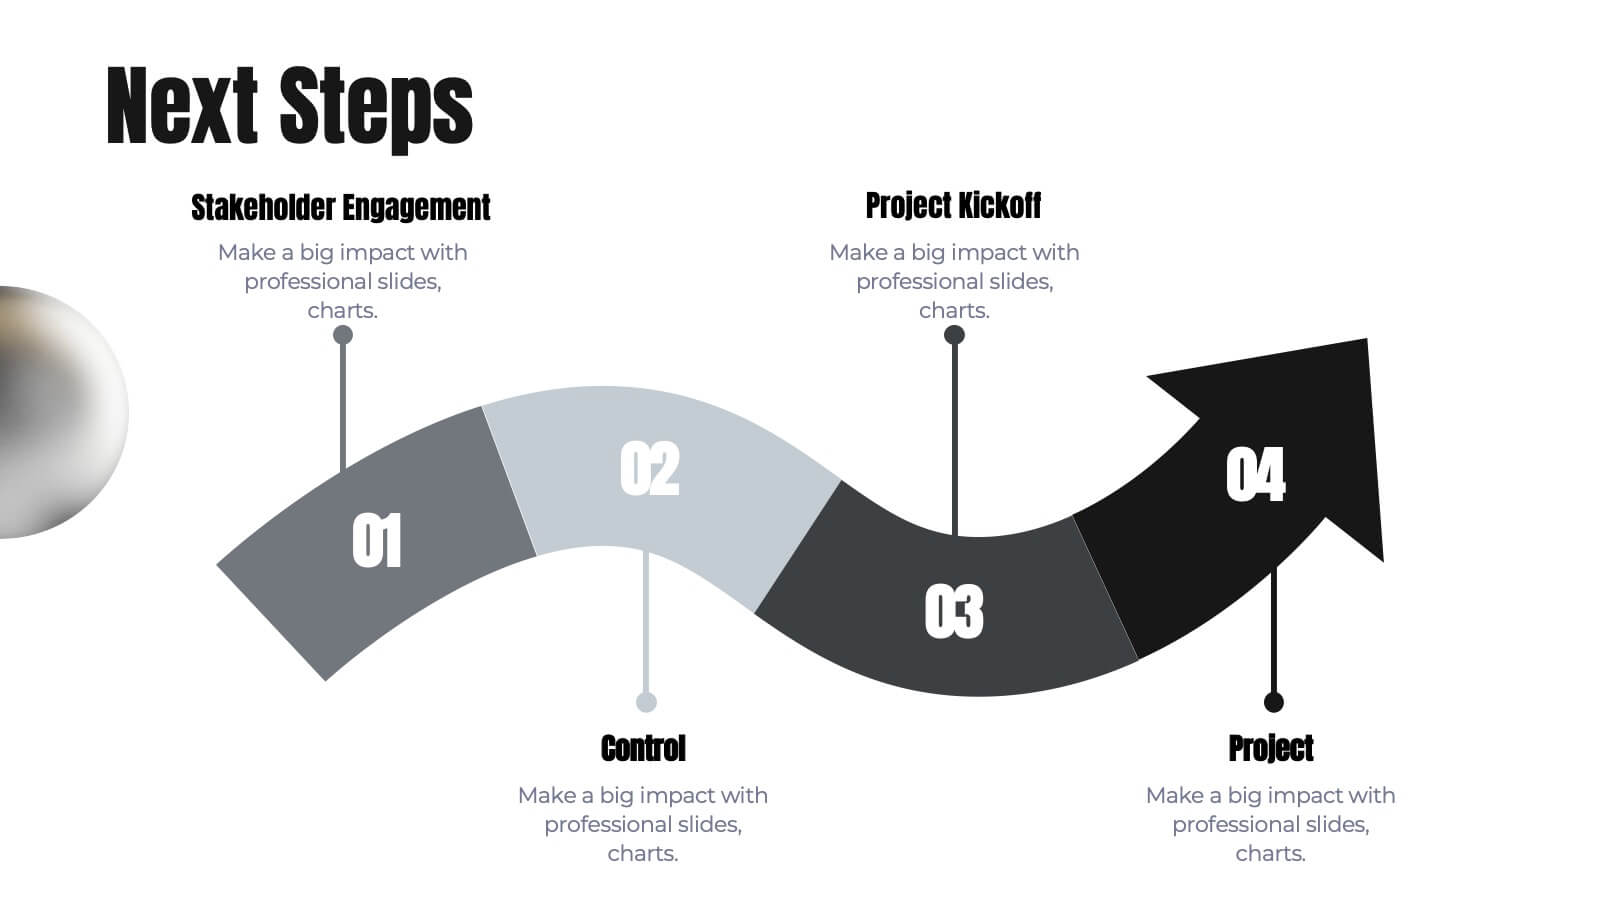
Janus Project Timeline Presentation
Craft a seamless project plan with this sleek and professional presentation template! Designed to guide you through every step, from project overview and scope of work to risk management and resource allocation, this template covers all the essentials. It's perfect for keeping your team on track with clear deliverables, timelines, and evaluation criteria. Compatible with PowerPoint, Keynote, and Google Slides for effortless presentations.


5 diapositivas
Product Life Cycle Strategy Framework Presentation
Bring structure and clarity to your business strategy with this clean circular infographic design. Ideal for showcasing product evolution, performance metrics, and planning stages, it helps visualize complex data in a professional, easy-to-follow format. Fully editable and compatible with PowerPoint, Keynote, and Google Slides for seamless customization.


4 diapositivas
To-Do Lists and Task Management Presentation
Stay organized and boost productivity with the To-Do Lists and Task Management Presentation. This sleek layout features vertical note-style columns that are perfect for displaying tasks, priorities, or checklists in a structured format. Ideal for project timelines, personal goals, or team deliverables. Each list area includes customizable titles, checkmarks, and space for key points. Fully editable in PowerPoint, Keynote, and Google Slides—perfect for visual task tracking across presentations.


4 diapositivas
Execution Phase Project Status Dashboard Presentation
Track execution phase progress at a glance with the Execution Phase Project Status Dashboard presentation slide. Featuring a visual traffic light indicator and pie charts, this layout helps communicate key metrics, task status, and completion percentages in a clear, engaging way. Ideal for internal reviews, stakeholder updates, or project team briefings. Fully editable in PowerPoint, Keynote, and Google Slides.


5 diapositivas
Cybersecurity Threat Analysis Presentation
Stay one step ahead with this bold, eye-catching slide design that makes complex cyber risk insights clear and easy to present. This layout helps you break down key threats, vulnerabilities, and security actions in a clean visual structure. Fully compatible with PowerPoint, Keynote, and Google Slides.


4 diapositivas
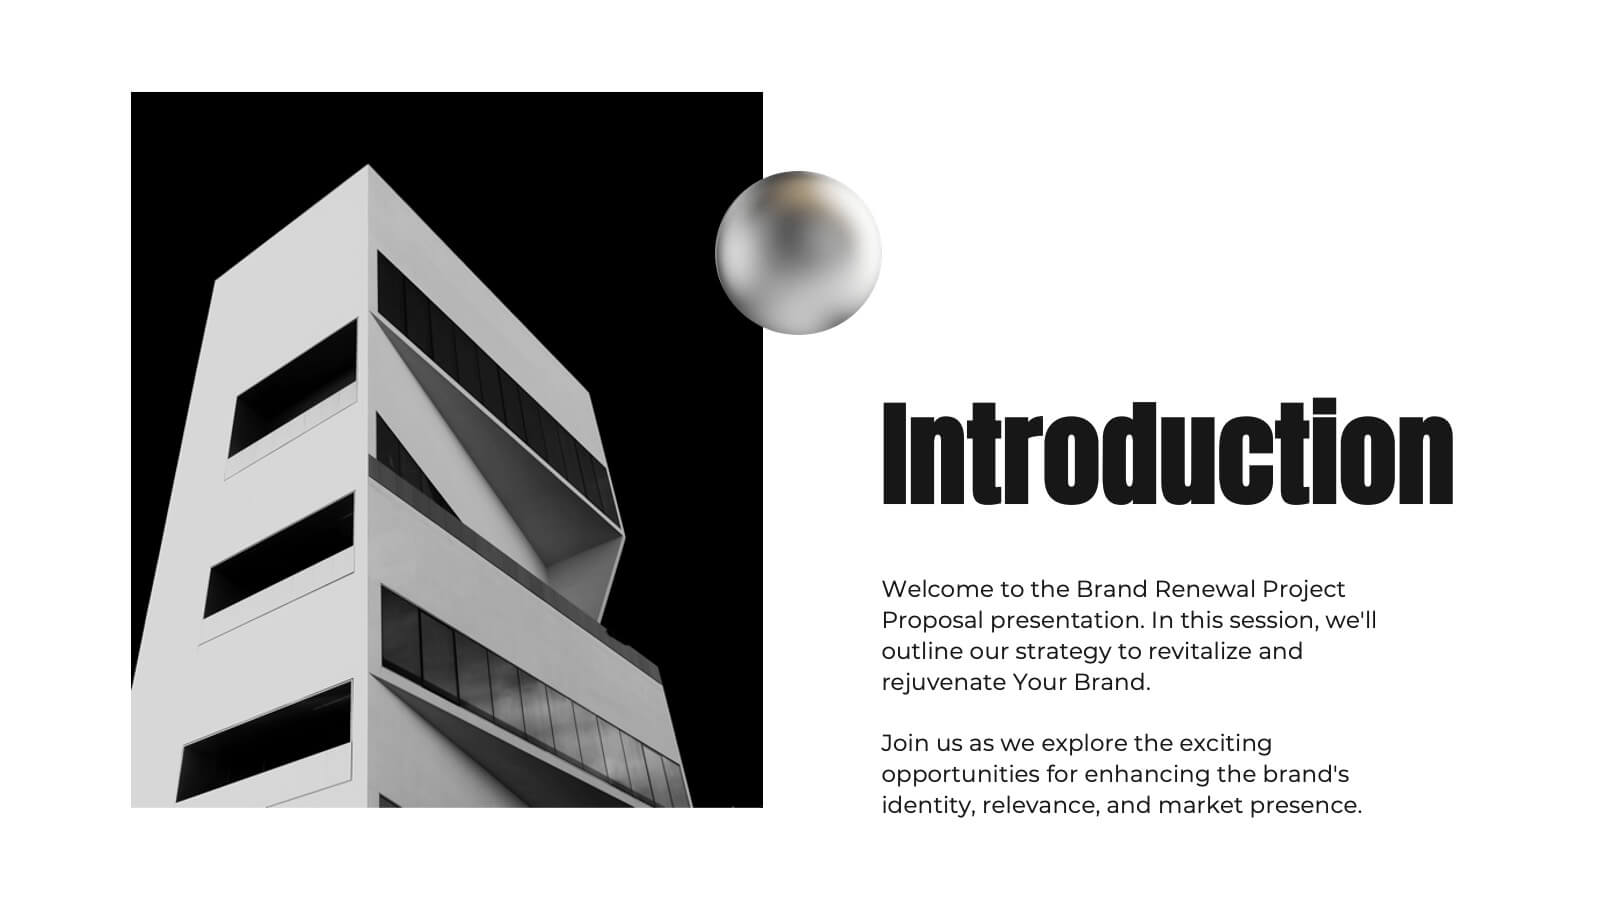
Creative Title Slide Templates Presentation
Make a bold first impression with the Creative Title Slide Templates Presentation. Featuring a sleek, split-layout design with glowing blue abstract waves, this template combines modern aesthetics with functional clarity. Circular icons on the side offer quick visual cues for business categories or departments. Ideal for keynote introductions or professional project kickoffs. Compatible with PowerPoint, Keynote, and Google Slides.


4 diapositivas
Real Estate and Housing Market Presentation
Turn market insights into visual stories that captivate investors and clients alike. This sleek and modern presentation helps you illustrate property trends, housing data, and real estate growth with clarity and confidence. Fully customizable and compatible with PowerPoint, Keynote, and Google Slides for easy editing and professional results.


5 diapositivas
Big Data Analytics Process Presentation
Visualize your data journey with this clean and professional slide layout. Featuring four circular icons around a central cloud graphic, it’s ideal for showcasing data collection, processing, analysis, and storage. Perfect for tech briefings or analytics teams. Fully editable and compatible with PowerPoint, Keynote, and Google Slides.


5 diapositivas
Supply Chain Management Plan Presentation
Streamline your presentation with a sleek and organized design built to illustrate process flow and logistics. Perfect for explaining production stages, delivery systems, or business operations, this visual layout brings clarity and structure to your message. Compatible with PowerPoint, Keynote, and Google Slides for effortless customization and use.


4 diapositivas
South America Growth Market Strategy Presentation
Showcase expansion potential with the South America Growth Market Strategy Presentation. This slide template visually maps out your business strategy across the continent using location markers, ranking indicators (A–D), and concise text sections for each market. Perfect for growth analysis, investment briefings, or sales planning. Fully editable in PowerPoint, Keynote, Google Slides, and Canva.


5 diapositivas
Projects Milestone Timeline Presentation
Kickstart your story with a clean, engaging timeline that makes every achievement feel purposeful and easy to follow. This presentation helps you outline major milestones, track progress, and communicate project goals with clarity and structure. Ideal for planning, reporting, and strategy sessions. Fully compatible with PowerPoint, Keynote, and Google Slides.