


Características


¿Tienes alguna pregunta?
Recomendar


7 diapositivas
Investment Management Infographic
Investment management, also known as asset management or fund management, involves the professional management of various securities and assets with the goal of achieving specific investment objectives for individuals, institutions, or entities. This infographic will encourage your audience to start or enhance their investment journey for financial prosperity. Customize the content, design, and visuals to craft an engaging and informative infographic that educates about investment management. This infographic should serve as a useful guide for both beginners and those looking to refine their investment strategies.


7 diapositivas
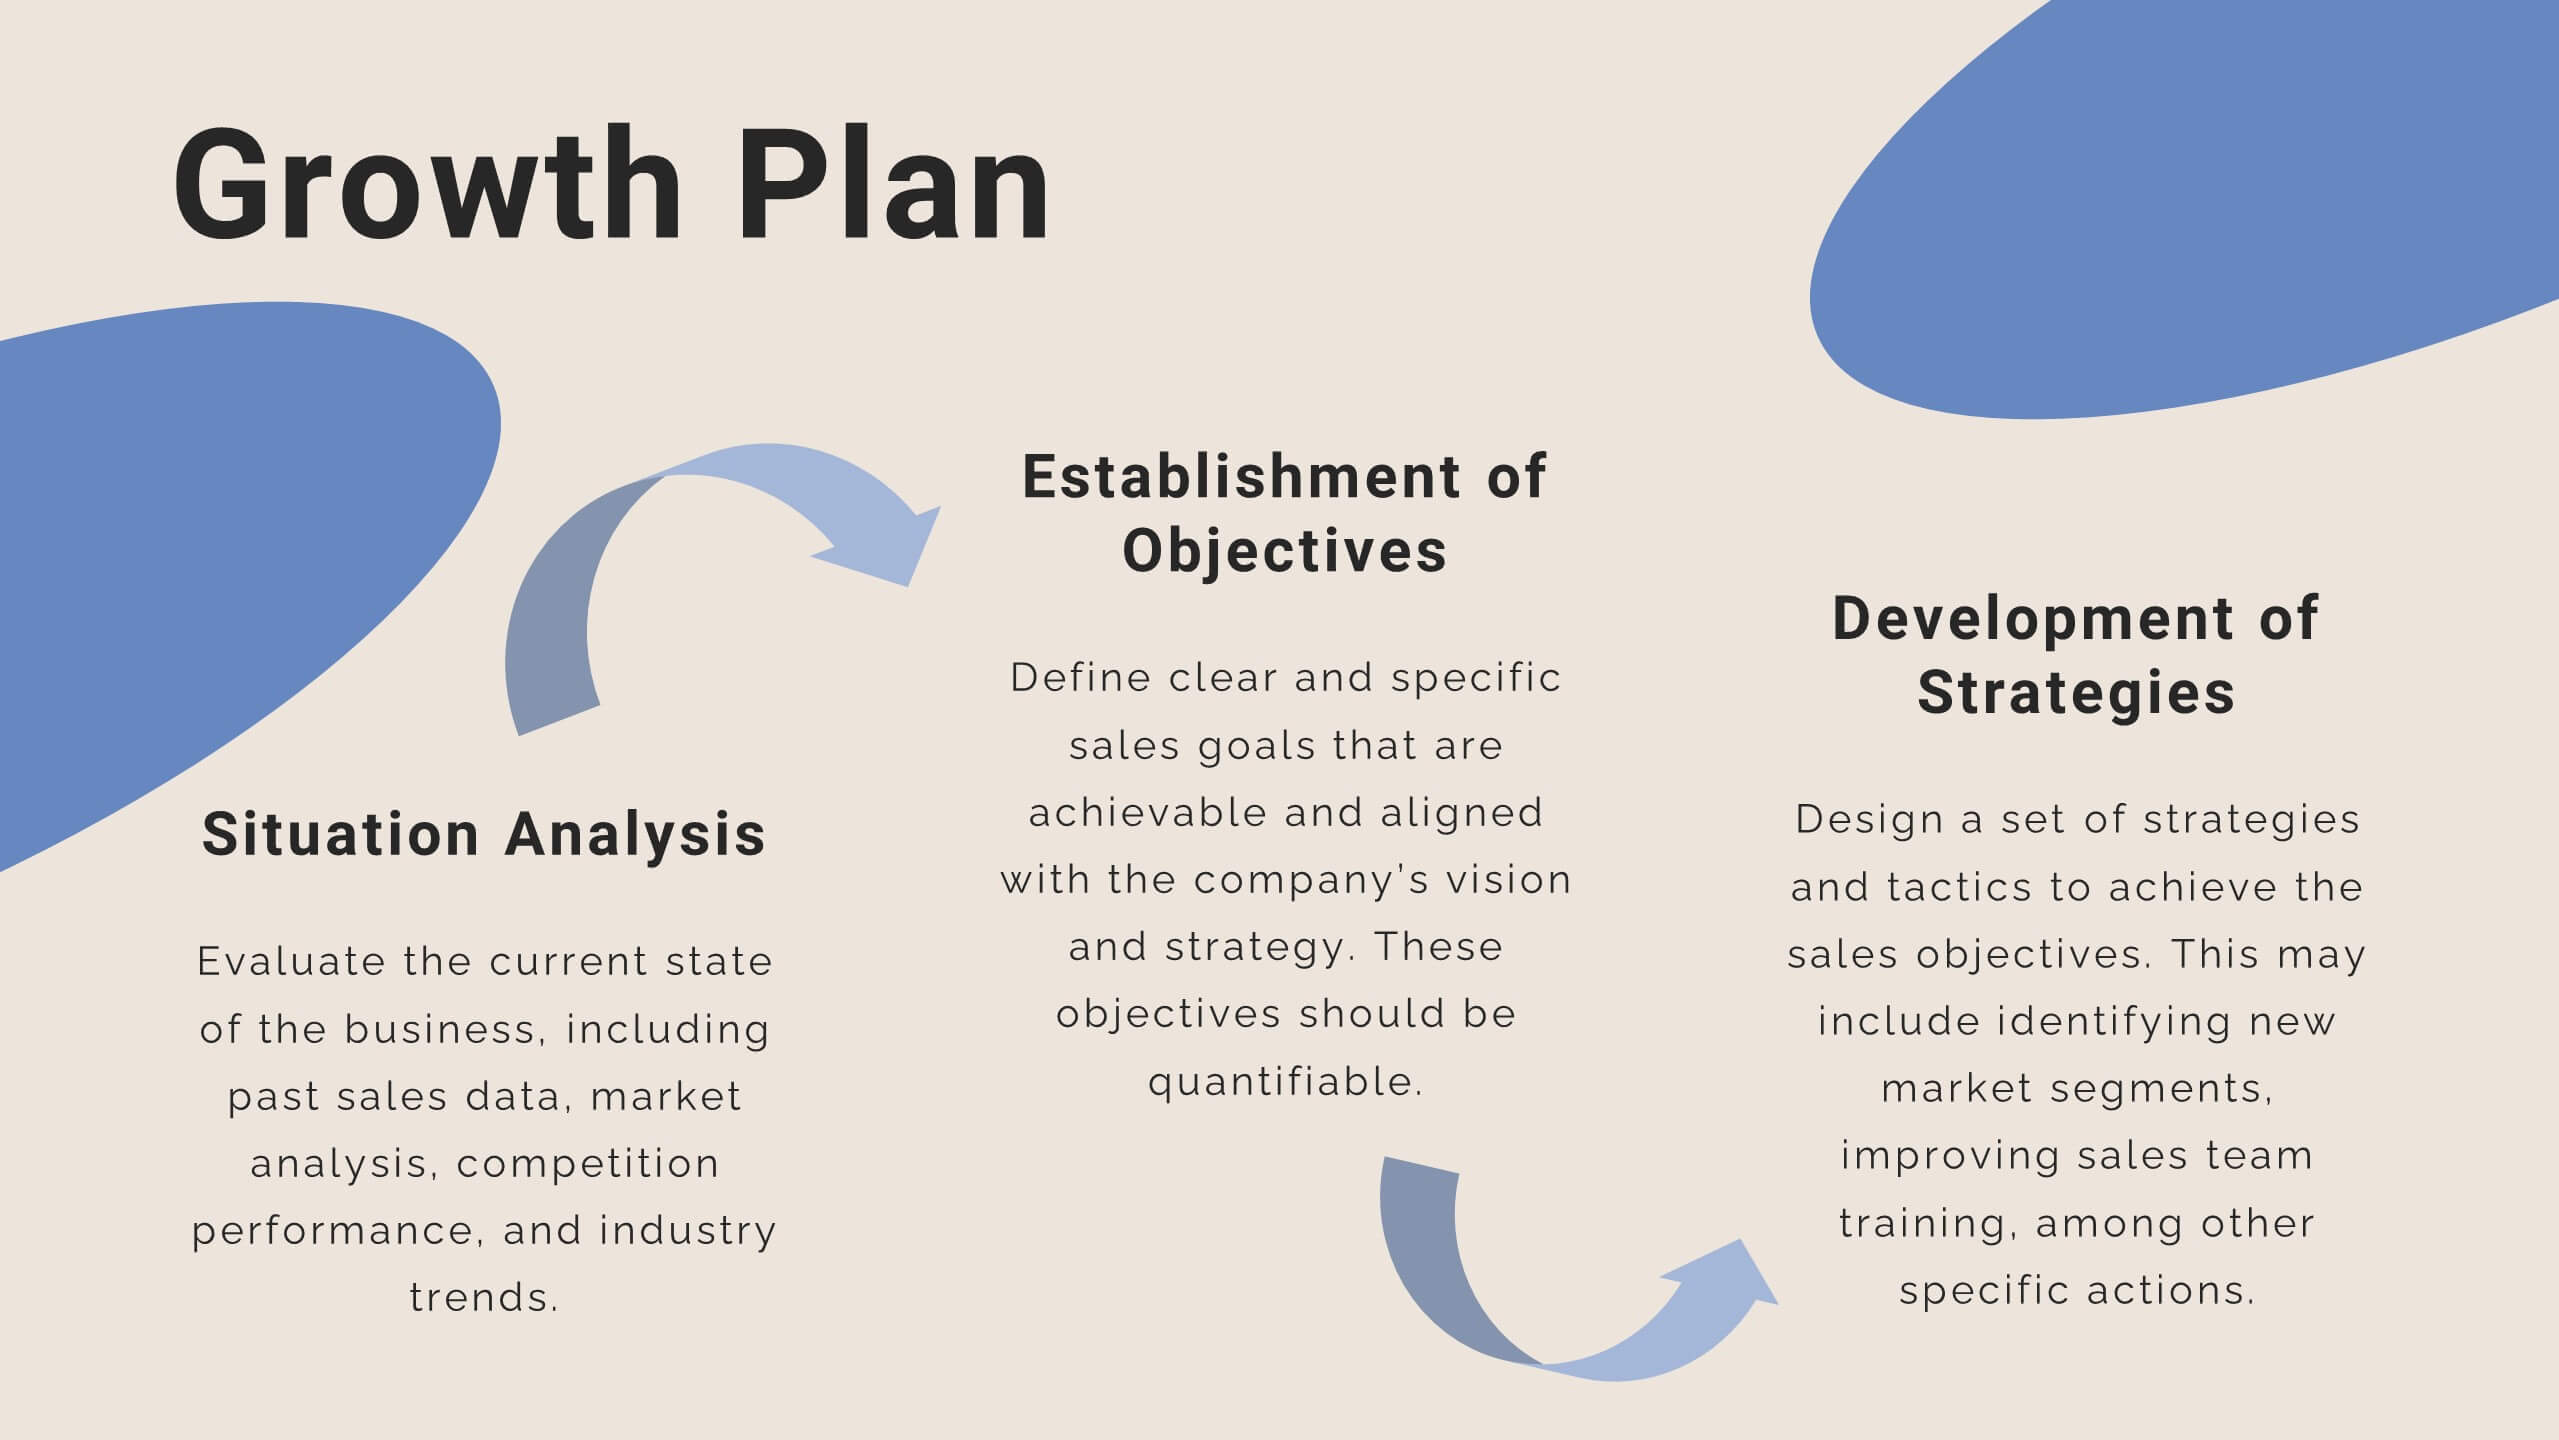
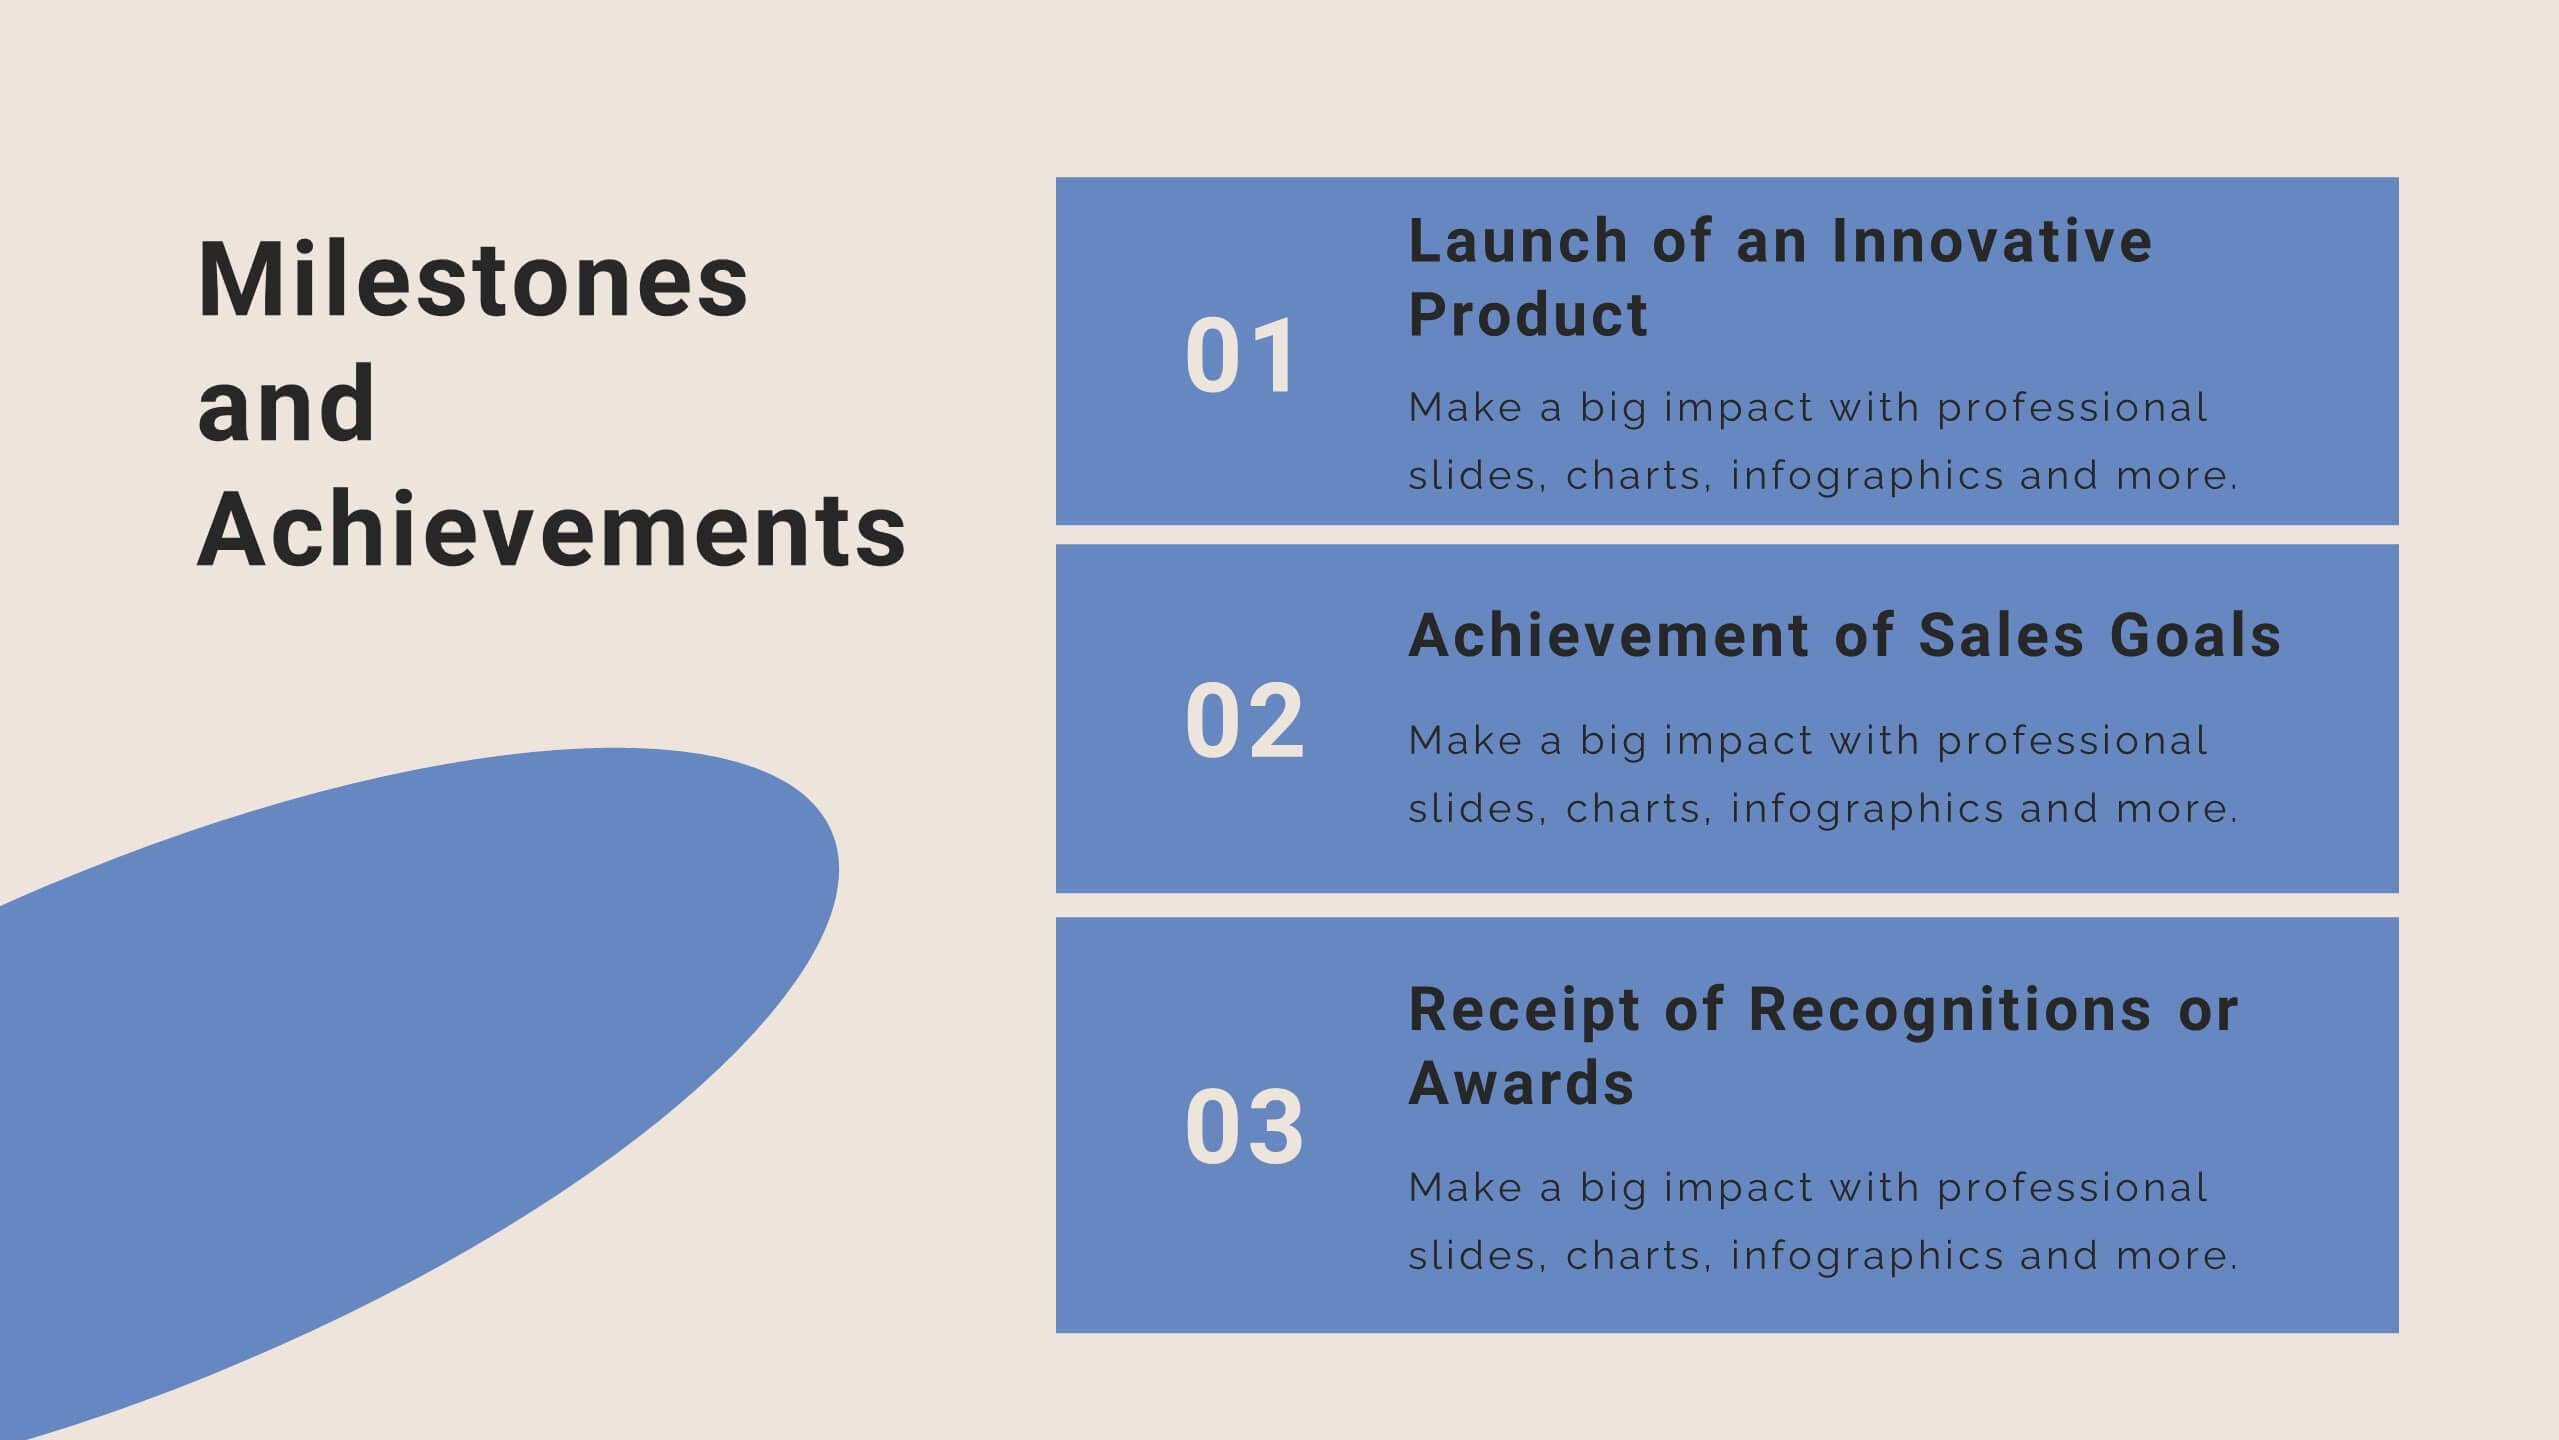
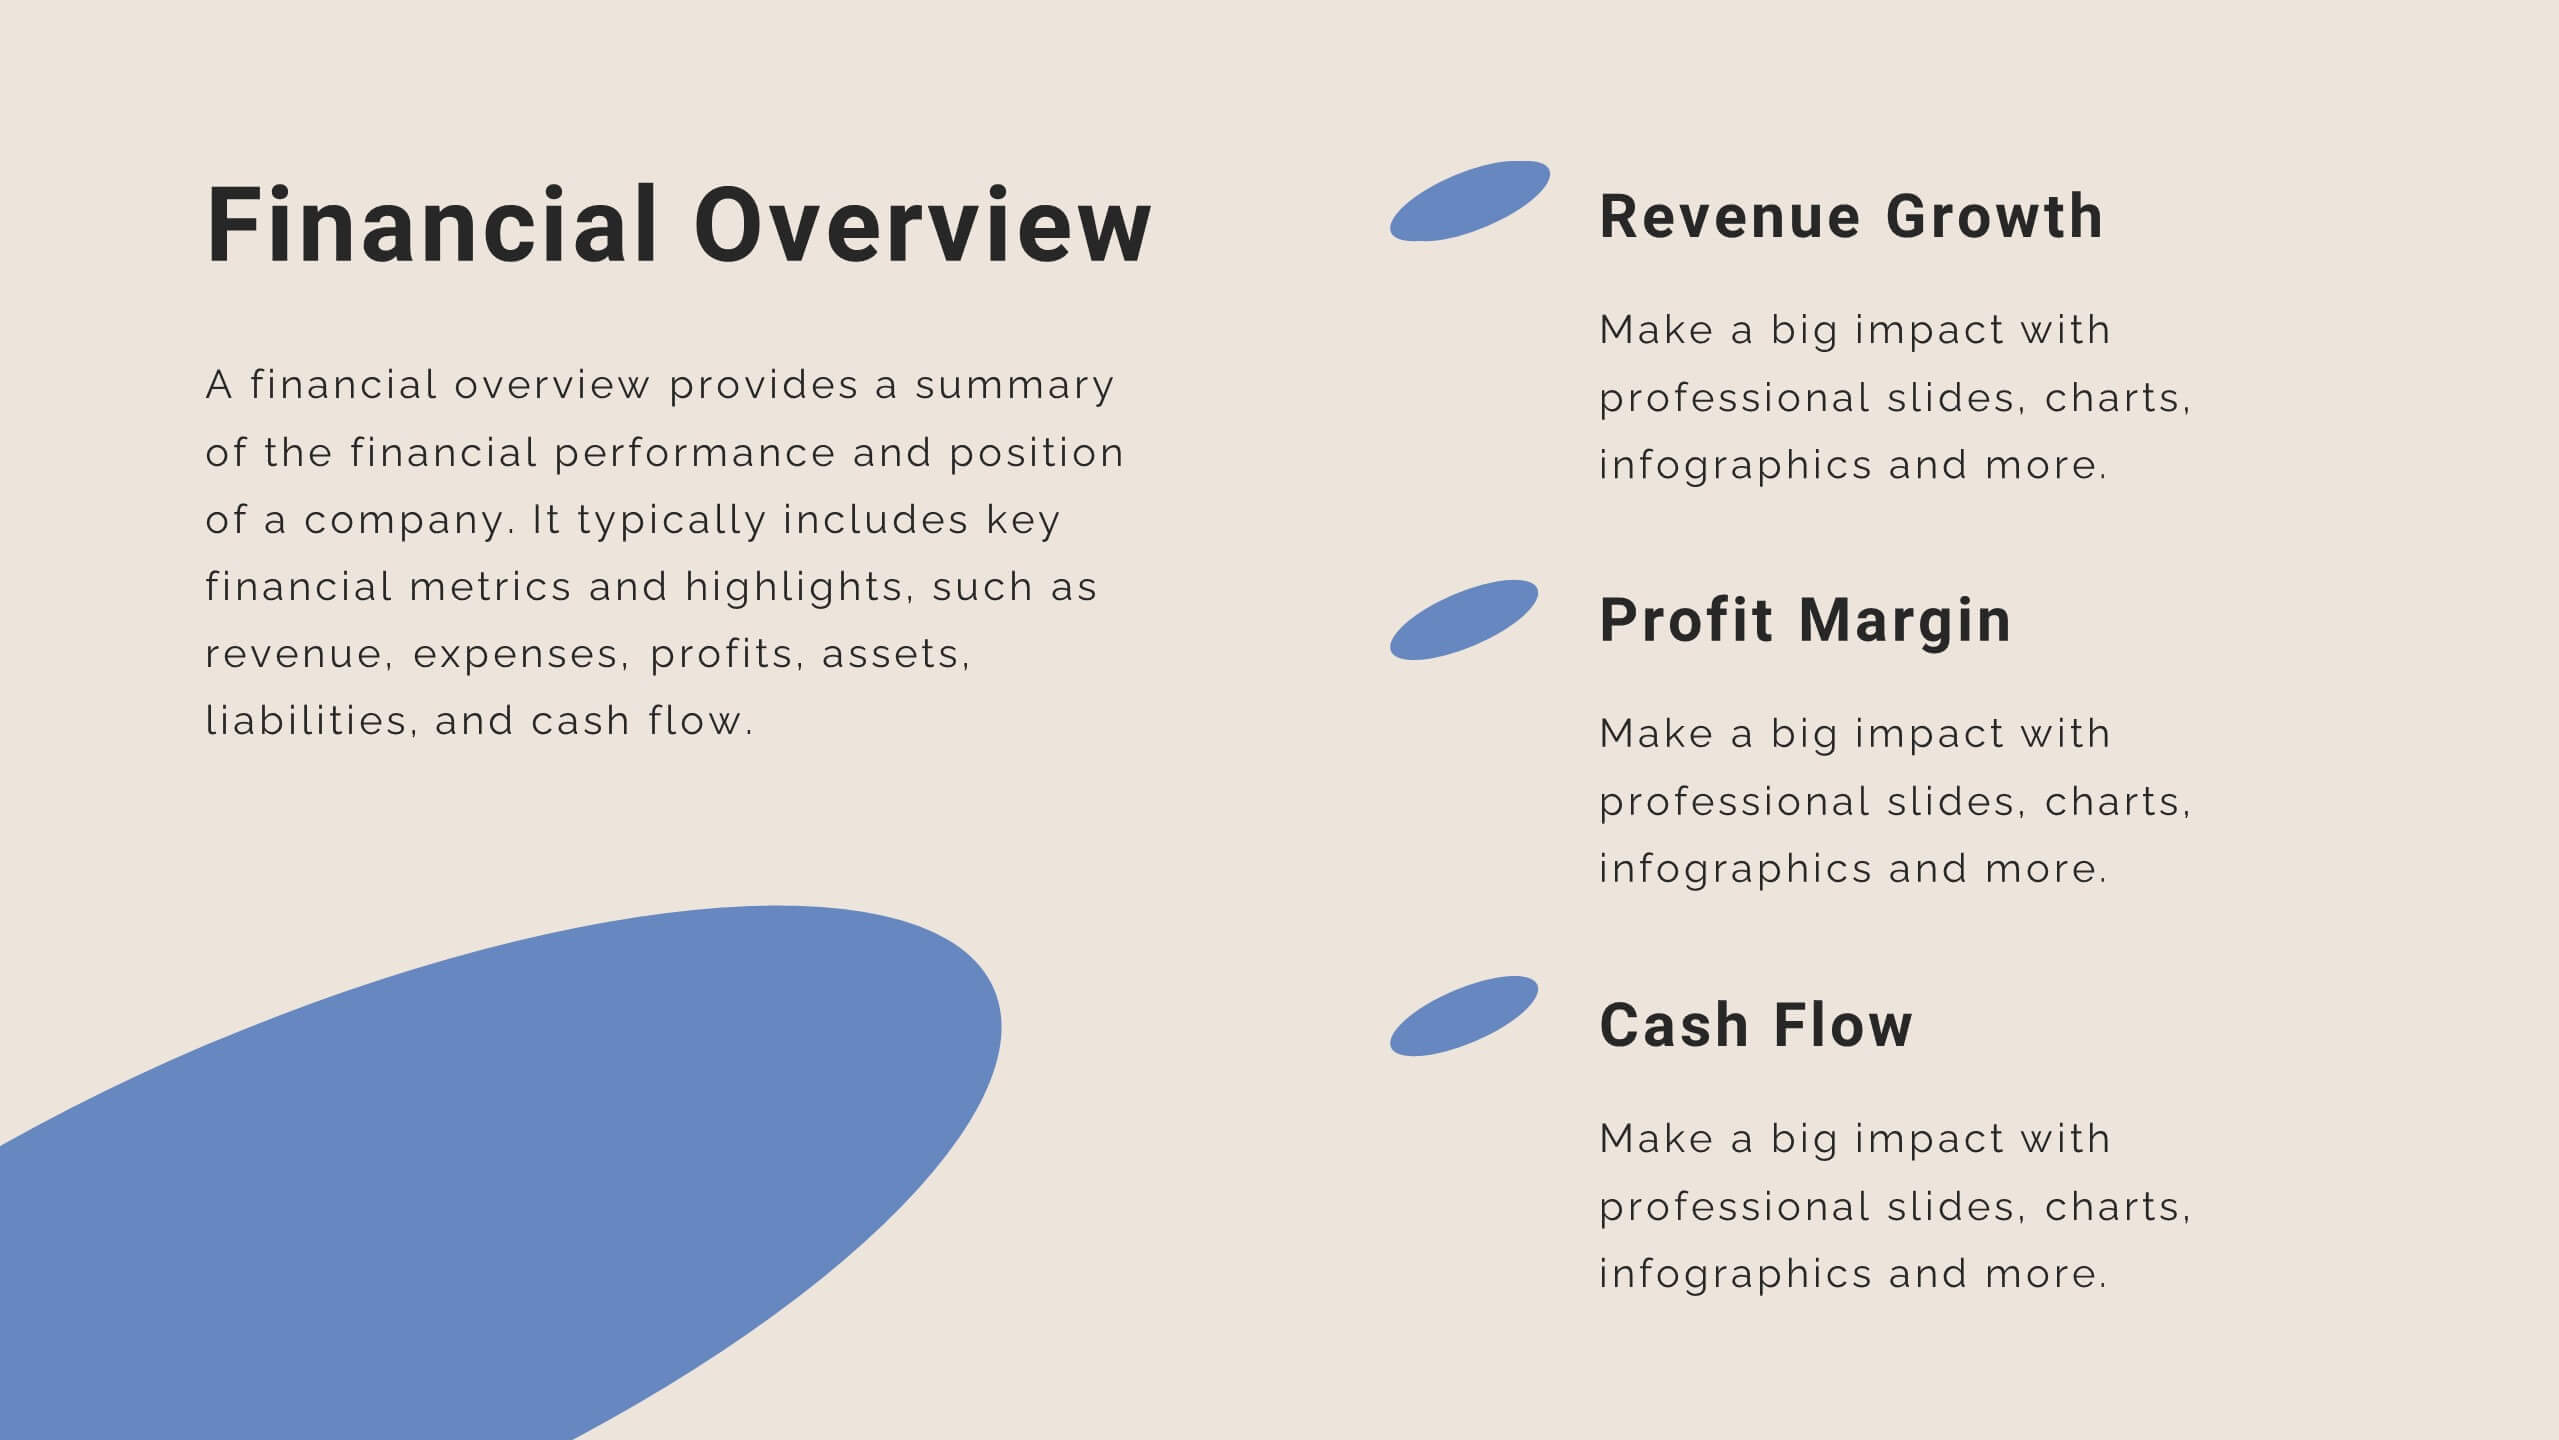
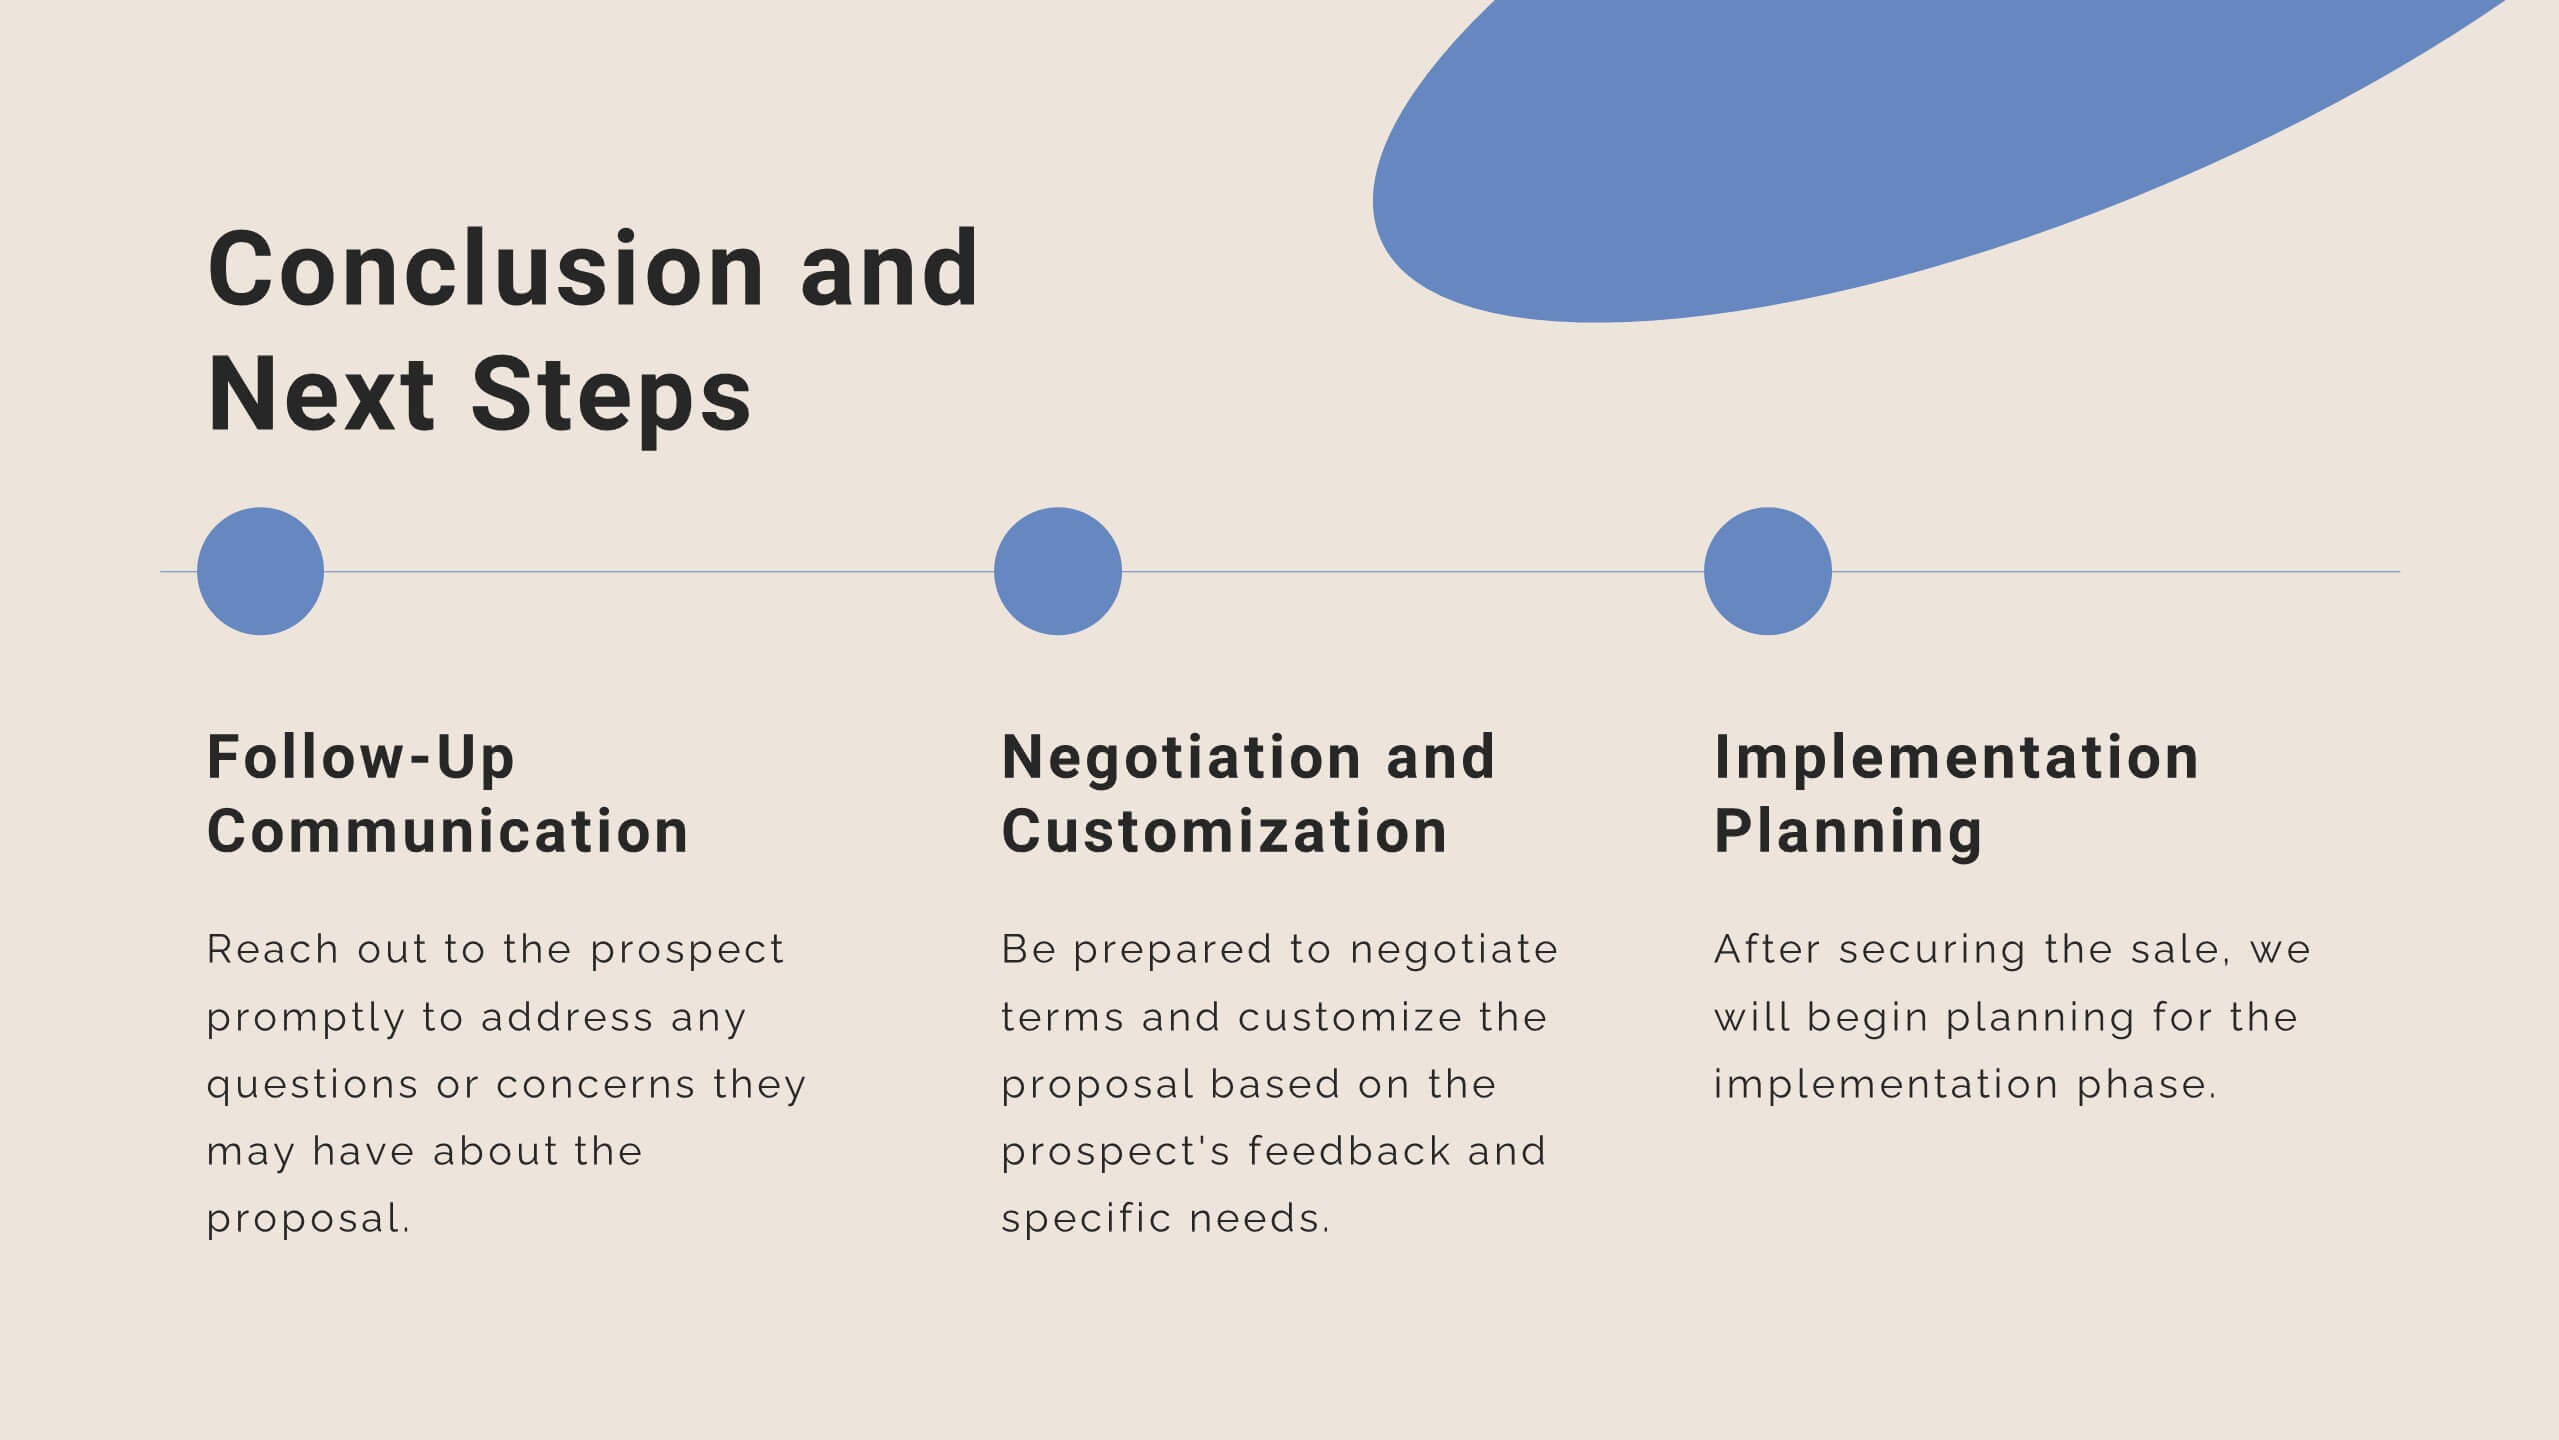
Business Process in Step-by-Step Presentation
Streamline operations with the Business Process in Step-by-Step presentation. This structured template breaks down complex workflows into clear, actionable steps, enhancing clarity and decision-making. Perfect for project planning, strategy execution, and workflow optimization. Fully customizable in PowerPoint, Keynote, and Google Slides for seamless presentation delivery.


5 diapositivas
Natural Sources of Energy Infographics
The importance of Natural Energy lies in its ability to reduce environmental impact, promote energy security, and create economic benefits. This vertical infographic template showcases the various types of renewable energy sources. It has a modern and clean design that highlights the importance of using sustainable energy sources. The template features customizable photo layouts and charts, along with icons and illustrations related to the energy sector. With this template, you can easily create an infographic that educates your audience about the importance of renewable energy sources and encourages them to adopt sustainable practices.


6 diapositivas
1-Page Executive Summary Slide Presentation
Bring clarity to complex updates in a single, colorful layout designed to keep your audience engaged from start to finish. This clean and modern slide breaks down key messages into six distinct points, making it easy to showcase progress, milestones, or strategies. Fully compatible with PowerPoint, Keynote, and Google Slides.


7 diapositivas
Asia Map Infographic Presentation Template
Asia is the largest, most populous, and most culturally diverse continent. Asia constitutes of nearly one-third of Earth's landmass and is lying entirely north of the equator. The continent is home to a variety of cultures, ethnic groups, and religions. This Asian map template includes the different labeled countries, and graphs with statistics. This can be used to show your audience the geographical layout of Asia, or as an example of what a modern, professional presentation should look like. This template is a great resource for students, teachers and people who want to learn more about Asia.


6 diapositivas
Pathway and Options Framework Analysis Presentation
Navigate your business strategy with clarity using the Pathway and Options Framework Analysis Presentation. This slide features a horizontal hexagon progression that visually maps out five distinct stages or decision points. Ideal for illustrating phased development, strategic alternatives, or milestone-based planning. Each segment includes an icon and customizable title area for key data points. Use this clean, modern layout to engage stakeholders or clarify complex processes. Fully editable in PowerPoint, Keynote, and Google Slides.


7 diapositivas
Stock Market Infographic Presentation Template
The stock market is a global system that operates through electronic communication and trading. It allows buyers and sellers to meet, interact, and transact. This template is perfect if you want to become informed or want to inform someone how the stock market operates. This template comes packed with all the information you need. The market allows for price discovery and serve as a barometer for the overall economy. The stock market is highly transparent, allowing sellers to seek the best price. The illustrations provided are made to help you and your viewer understand the bull and bear market.


5 diapositivas
Root Cause Business Problem Slide
Uncover the foundation of complex challenges with this tree-inspired slide—perfect for visualizing root causes behind business problems. Showcase contributing factors at each root to guide effective solutions. Fully editable in PowerPoint, Keynote, and Google Slides.


5 diapositivas
Key Data and Performance Numbers Slide
Visualize data with impact using the Key Data and Performance Numbers Slide Presentation. This infographic-style layout features a central pie chart and five bold percentage callouts, making it ideal for presenting insights, progress, or KPIs. Easily customize the colors, titles, and text in PowerPoint, Keynote, or Google Slides.


4 diapositivas
Resource Mapping in African Regions Presentation
Visualize regional distribution clearly with the Resource Mapping in African Regions Presentation. This engaging slide highlights key areas using color-coded map segments, helping you present data like resource allocation, project focus, or regional analysis with clarity. Ideal for NGOs, researchers, or government briefings. Compatible with PowerPoint, Keynote, Canva, and Google Slides.


20 diapositivas
Visionix Project Management Plan Presentation
Streamline your project planning with this clean and modern presentation template. Covering key aspects such as objectives, timeline, budget breakdown, and risk management, it helps you organize and communicate your project strategy effectively. Ideal for business teams and project managers. Compatible with PowerPoint, Keynote, and Google Slides for easy customization.


5 diapositivas
World History Infographic Presentation
Bring the past to life with this engaging World History Infographic presentation. Featuring a circular layout with 4 editable sections, this infographic allows you to highlight key events, historical milestones, or cultural movements. Ideal for educators, students, and history enthusiasts, it’s designed for clarity, storytelling, and visual appeal. Fully compatible with PowerPoint, Keynote, and Google Slides – and easy to customize for any topic or timeline.


4 diapositivas
Oceania Region Editable Map Slide Presentation
Highlight your insights across Australia and the Pacific with a clean, modern map layout designed for clarity and engagement. Ideal for visualizing market regions, travel data, or geographic comparisons, this slide combines style with precision. Fully compatible with PowerPoint, Keynote, and Google Slides for effortless customization and presentation.


23 diapositivas
Ionian Corporate Strategy Report Presentation
The Ionian Corporate Strategy Report template offers a modern and dynamic approach to corporate presentations, designed to keep your audience engaged throughout. With a sleek, contemporary design in black, white, and purple tones, this template is perfect for presenting strategic plans, conference overviews, session breakdowns, and more. Each slide is crafted to facilitate a seamless flow of information, whether you're introducing a keynote speaker, discussing key objectives, or outlining conference agendas. The template includes placeholders for breakout sessions, networking breaks, Q&A sessions, and more, making it versatile and adaptable for various corporate events. It's fully compatible with PowerPoint, Keynote, and Google Slides, ensuring easy customization and a professional presentation experience. Use the Ionian Corporate Strategy Report template to make your next corporate presentation both impactful and memorable.


22 diapositivas
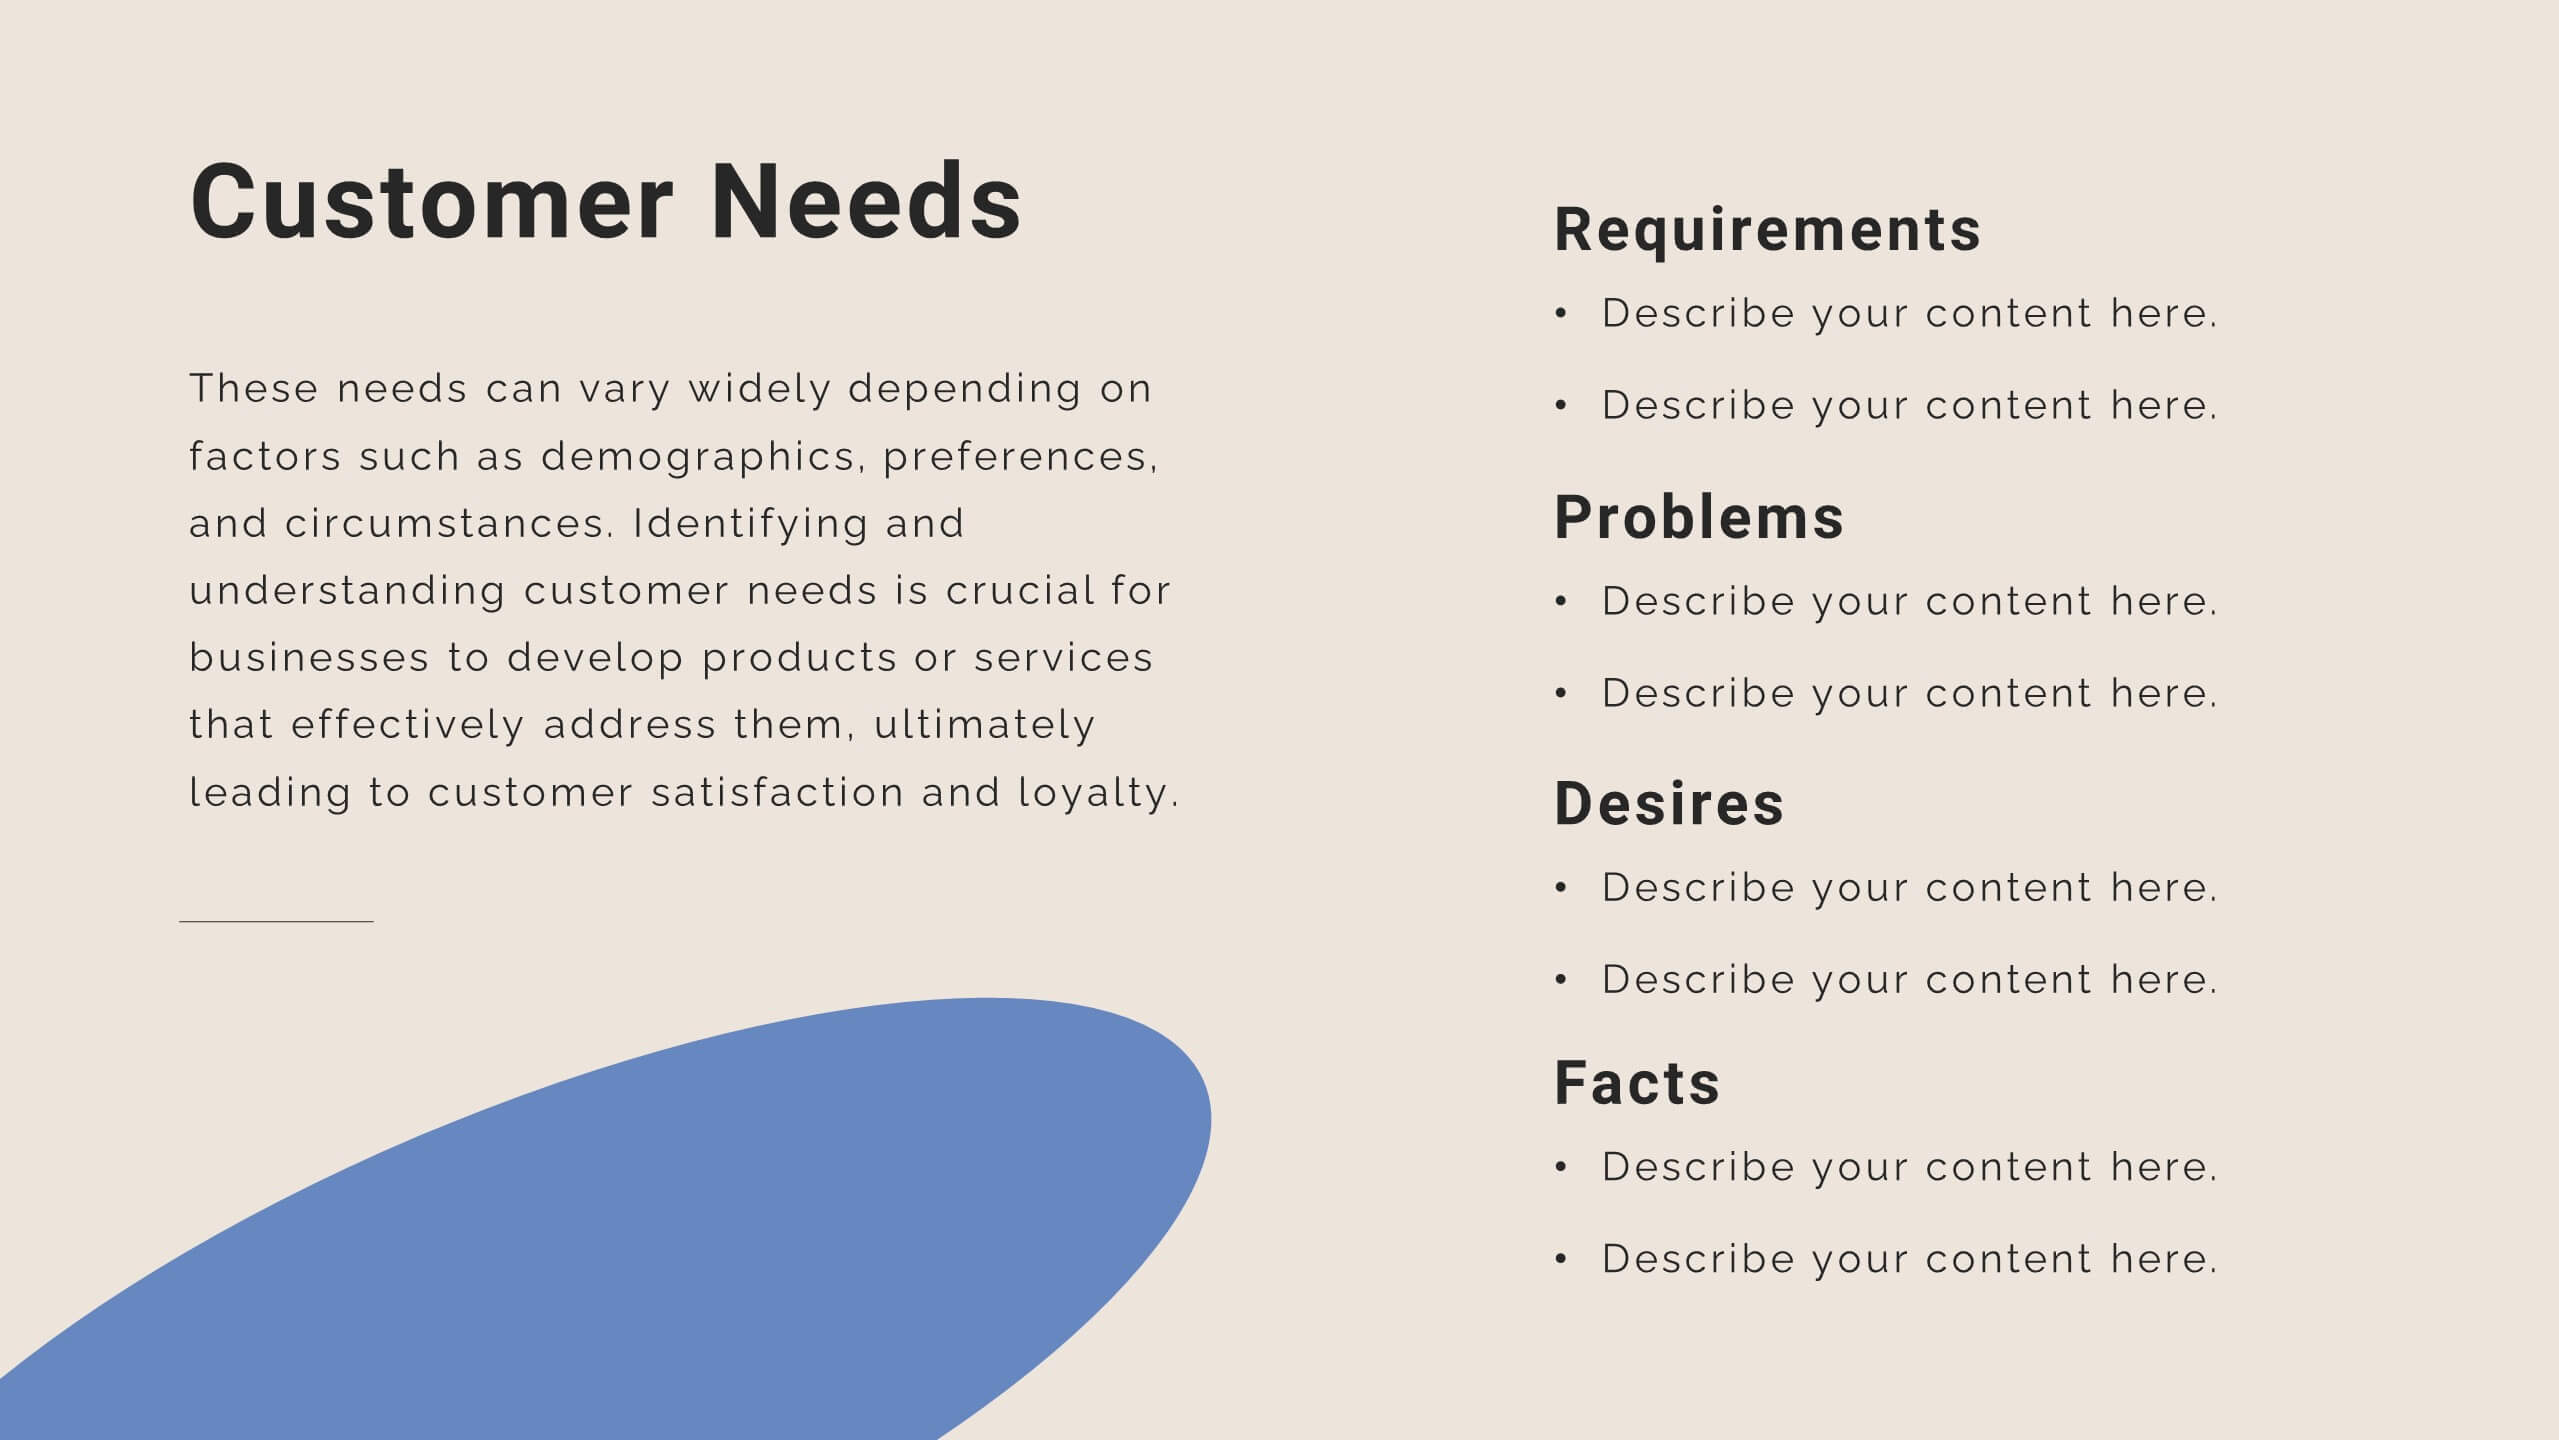
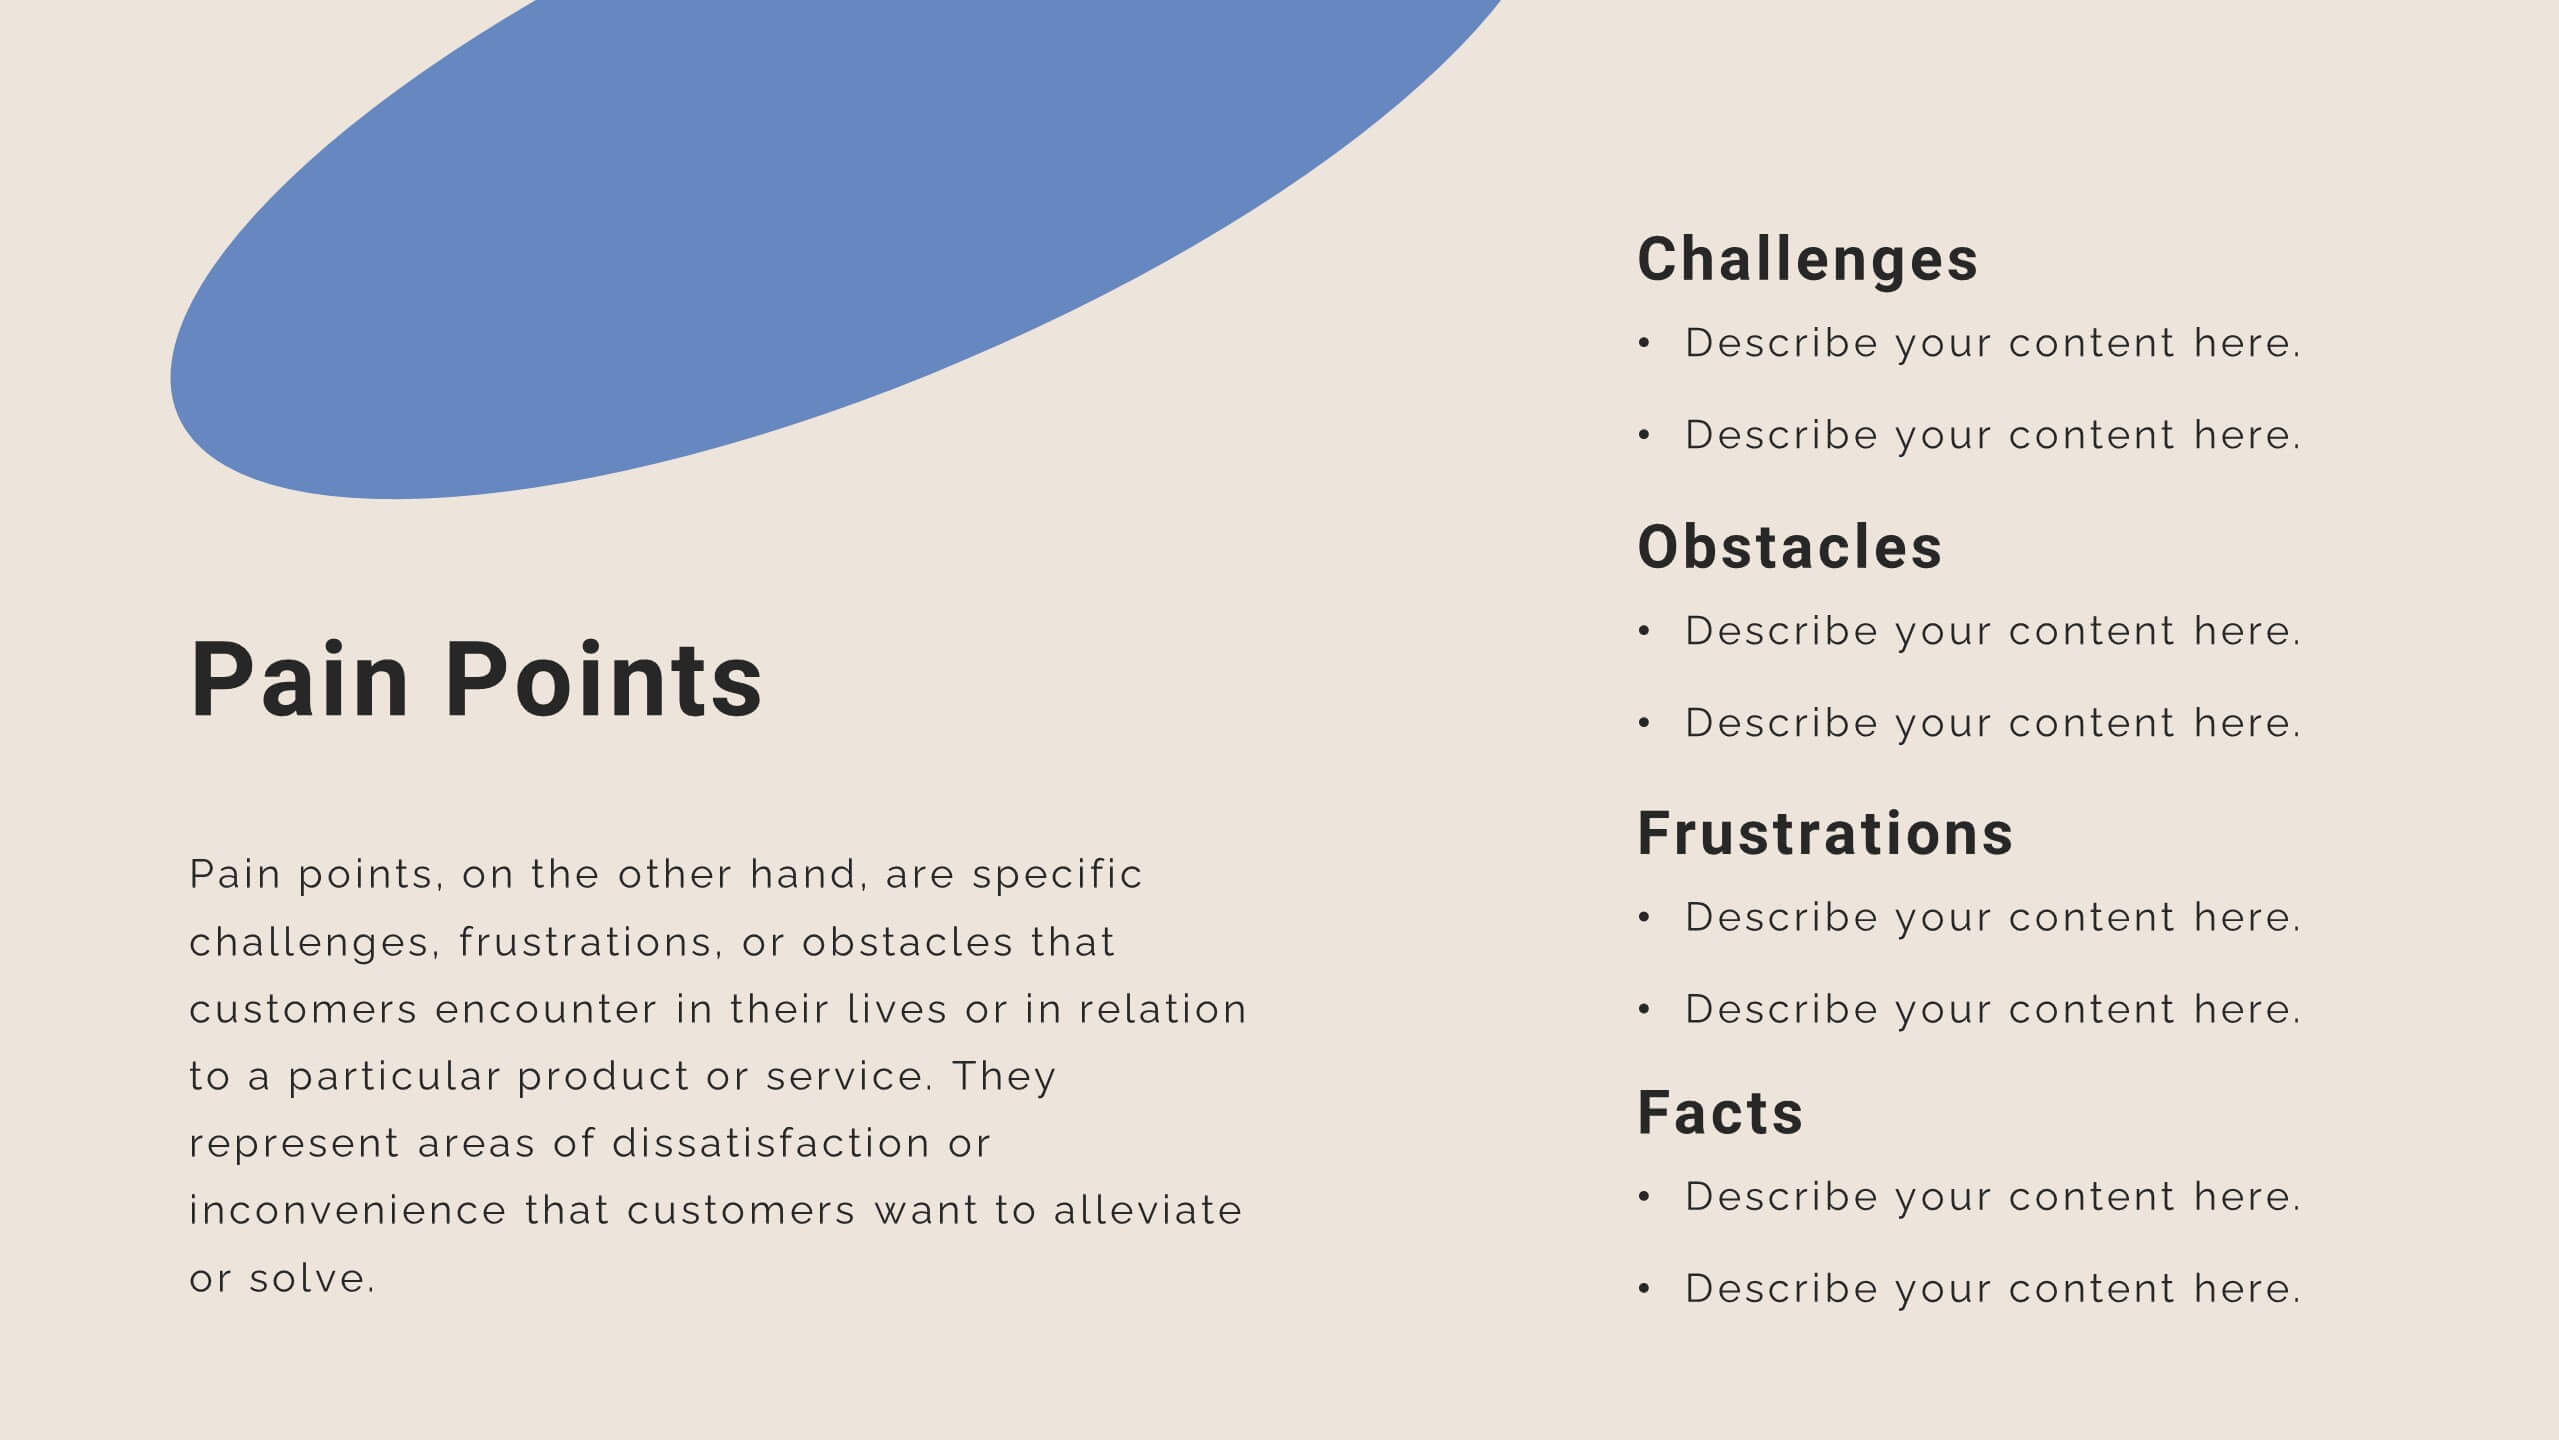
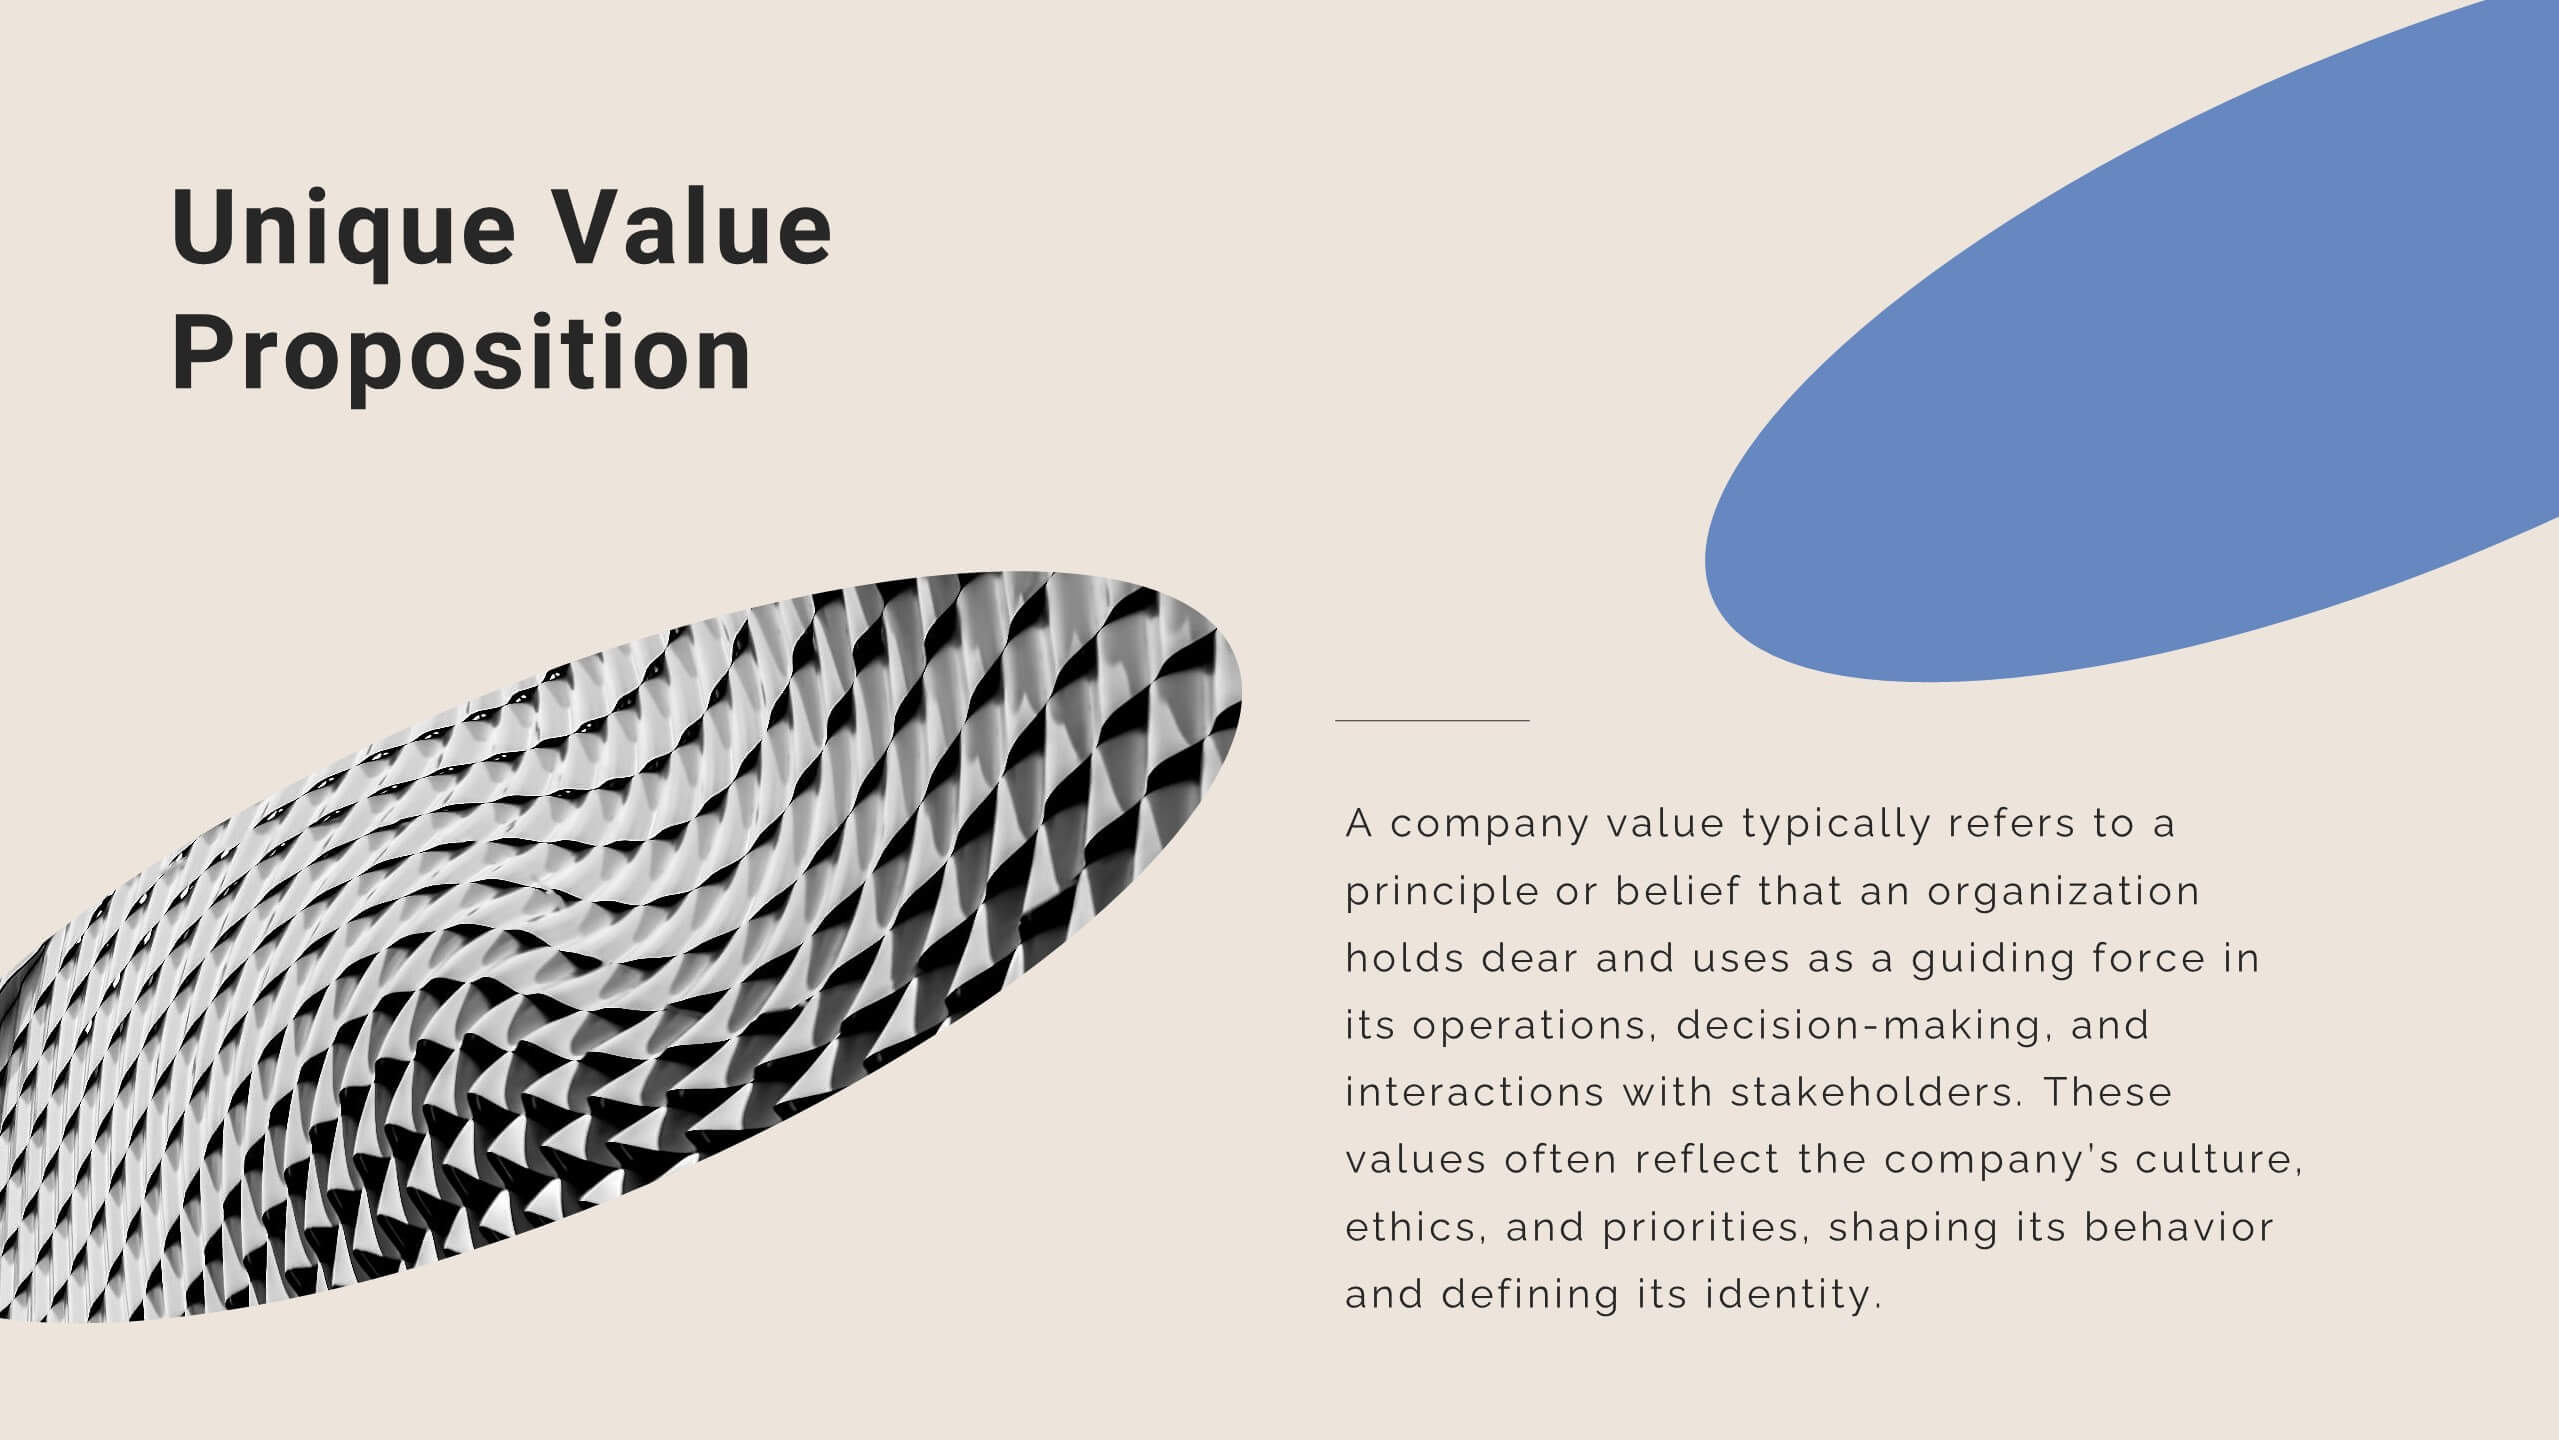
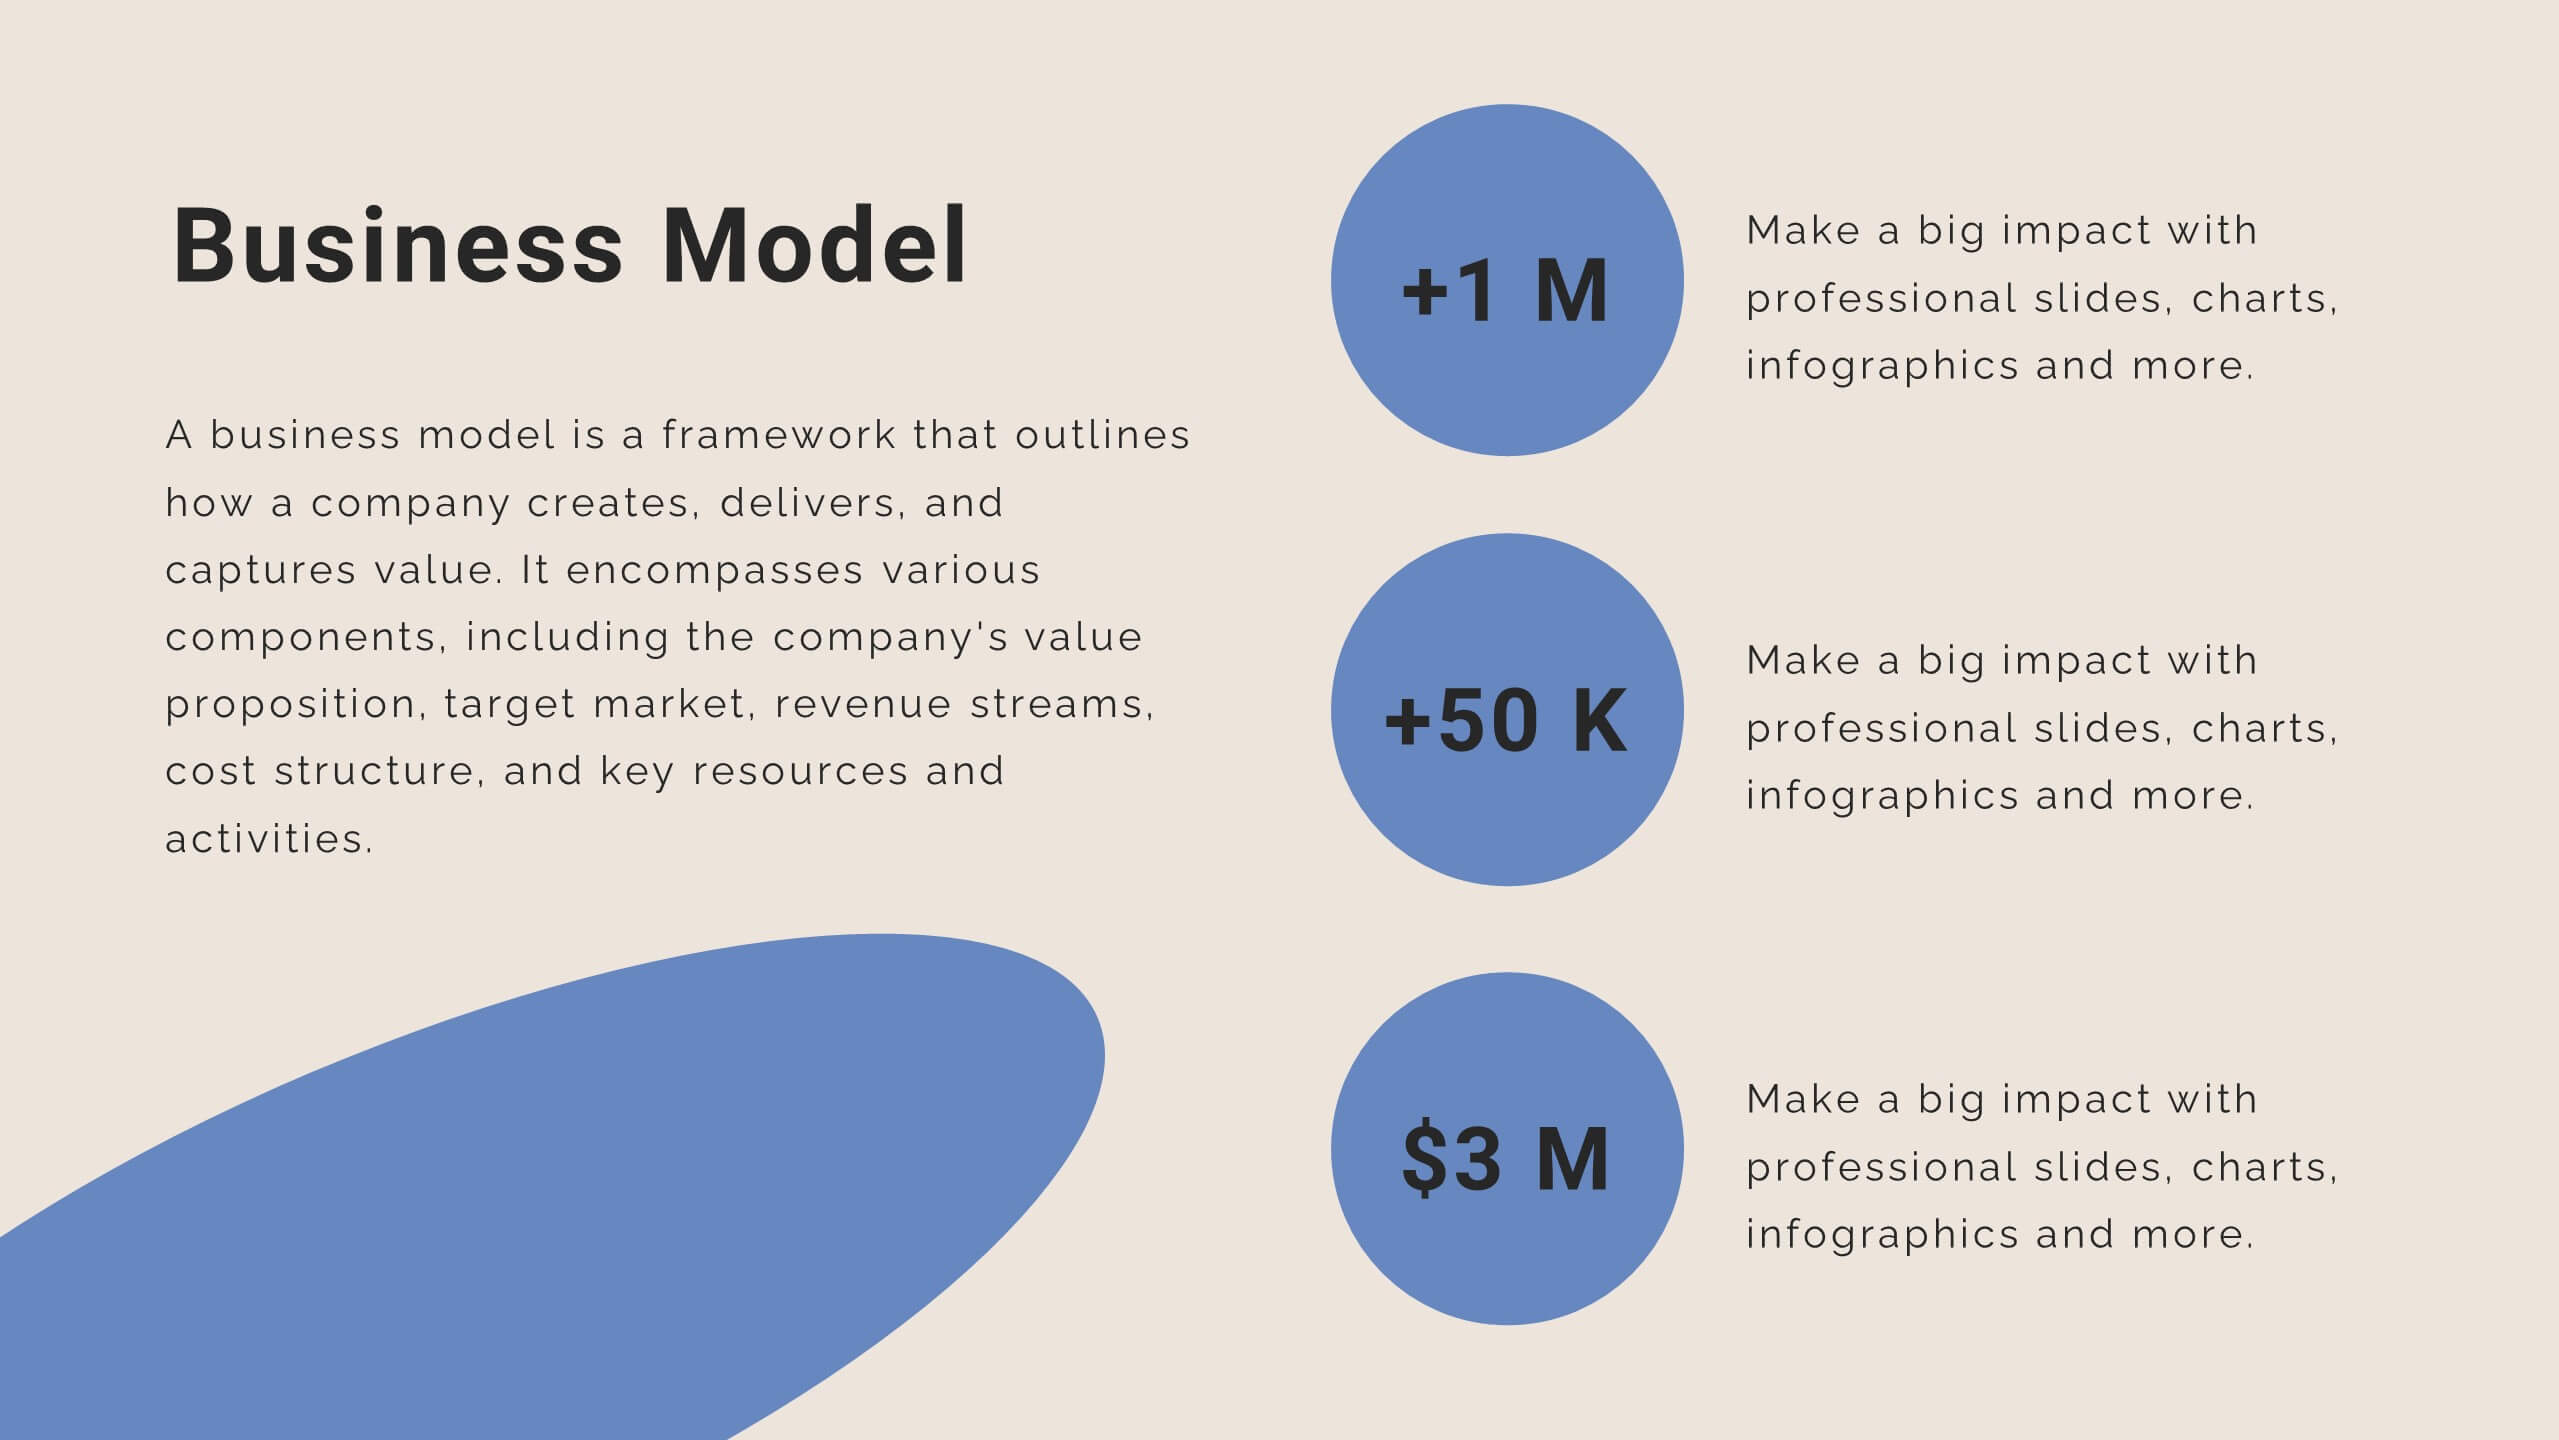
Mystic Startup Strategy Presentation
Launch your startup with confidence using this comprehensive funding proposal template! Perfect for showcasing your mission, vision, and business model to potential investors. Highlight your unique value proposition and growth plan with style. Compatible with PowerPoint, Keynote, and Google Slides, this template ensures your pitch stands out and secures the funding you need.


5 diapositivas
Risk and Return Investment Presentation
Navigate the high seas of finance with our captivating infographic presentation template, designed to visually break down the complex relationship between risk and return in investments. This template simplifies presenting key data points, making it ideal for financiers and investors looking to make informed decisions. Each slide is meticulously crafted to ensure clarity and impact, highlighting the balance of potential rewards against possible risks. Perfect for use in PowerPoint, Keynote, and Google Slides, this template is a must-have tool for anyone in the financial sector aiming to convey their strategy with precision and flair.


20 diapositivas
Creative Marketing Proposal Presentation
Elevate your business proposals with this sleek marketing proposal template, designed in dynamic purple tones. It comprehensively covers everything from company overview to pricing structures, making it perfect for detailing your marketing strategies effectively. Compatible with PowerPoint, Google Slides, and Keynote, it's ideal for professionals aiming to impress clients and secure projects.