


Características


¿Tienes alguna pregunta?
Recomendar


5 diapositivas
Business Model Canvas and Strategy Presentation
Visualize your entire business model in one clean, structured slide. This presentation template breaks down key areas—Partners, Activities, Value Propositions, Customers, Channels, Costs, and Revenue—into a color-coded layout for strategic clarity. Perfect for startups, consultants, or internal strategy teams. Fully editable in PowerPoint, Keynote, and Google Slides.


5 diapositivas
Marketing Customer Journey Presentation
Visualize your customer’s path with the Marketing Customer Journey Presentation. This slide layout is perfect for outlining the stages of your buyer’s decision-making process—from awareness to action. Highlight critical touchpoints and engagement strategies with a clean, easy-to-follow design. Fully customizable and compatible with PowerPoint, Keynote, and Google Slides.


22 diapositivas
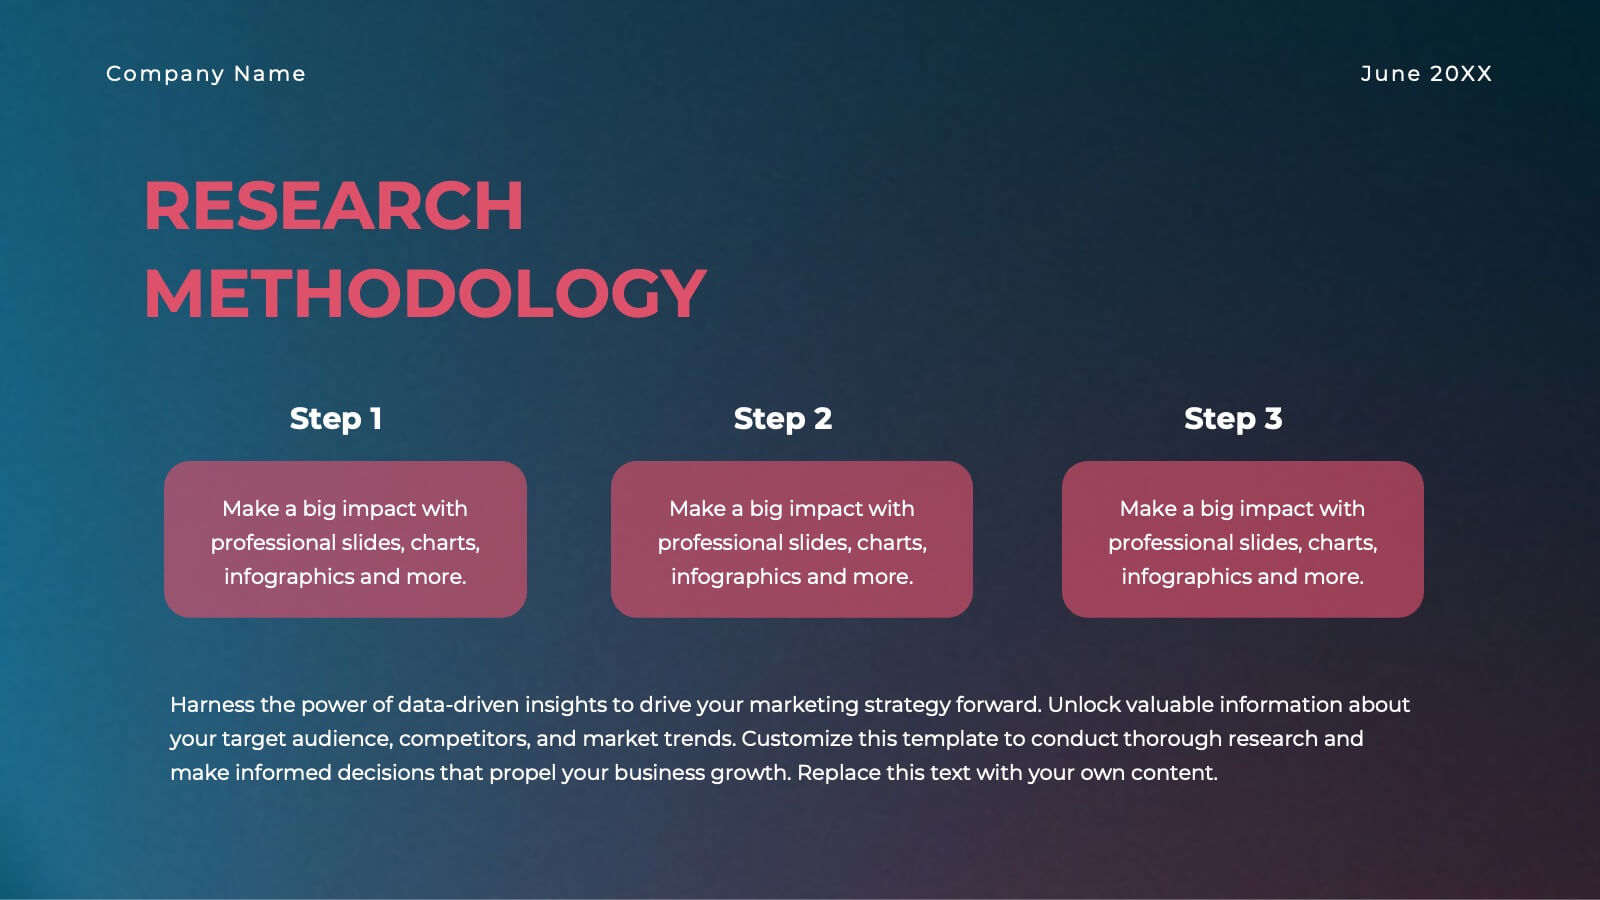
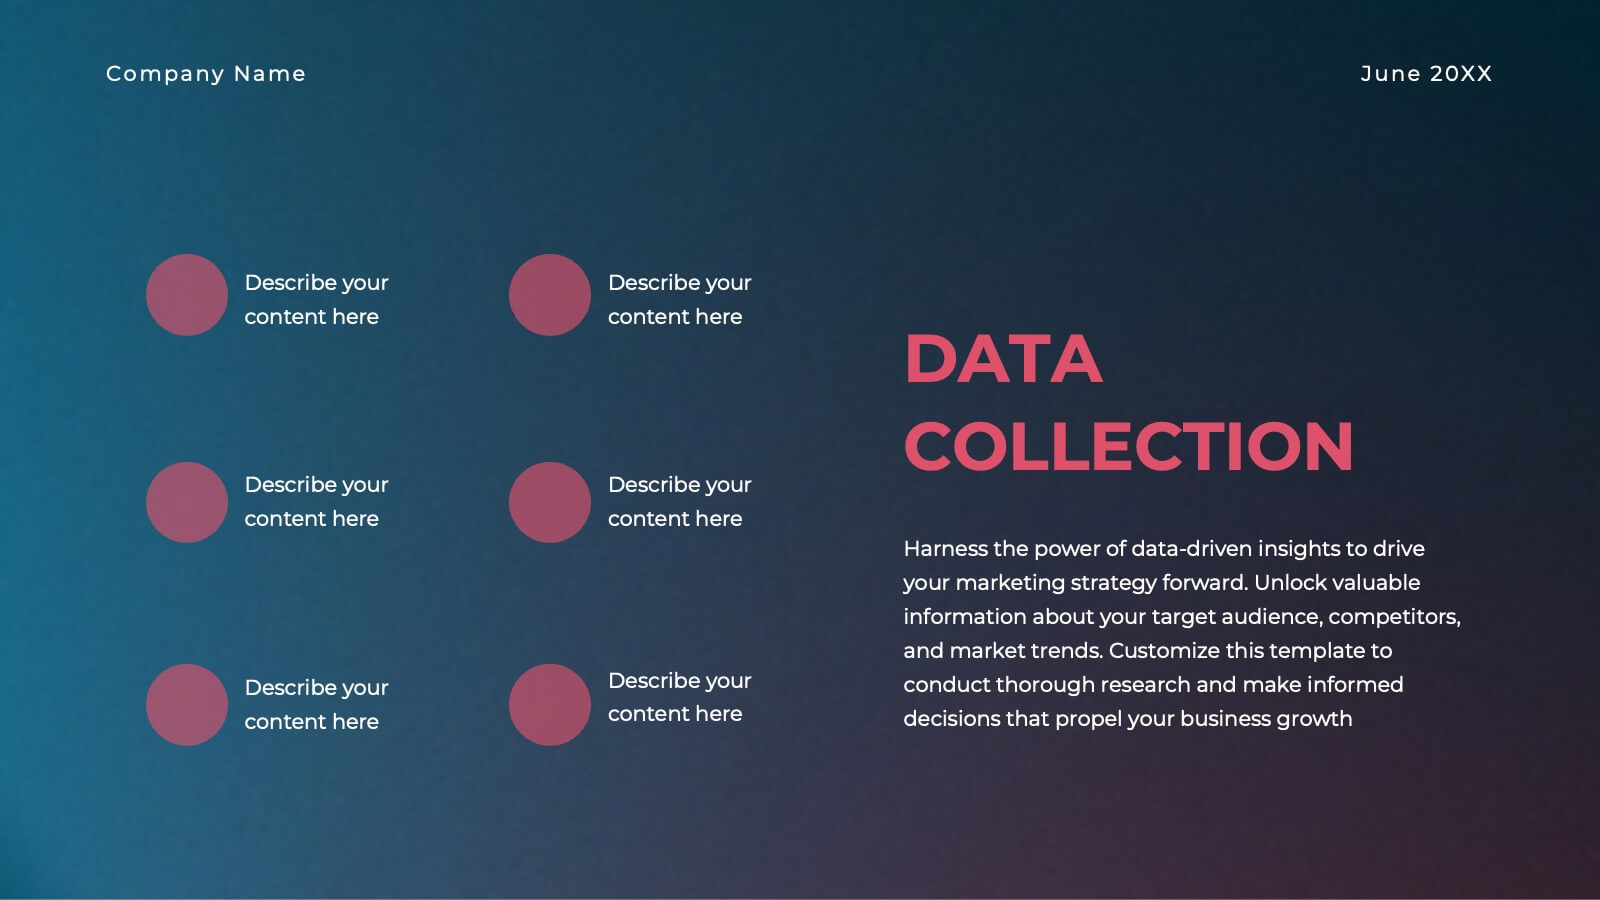
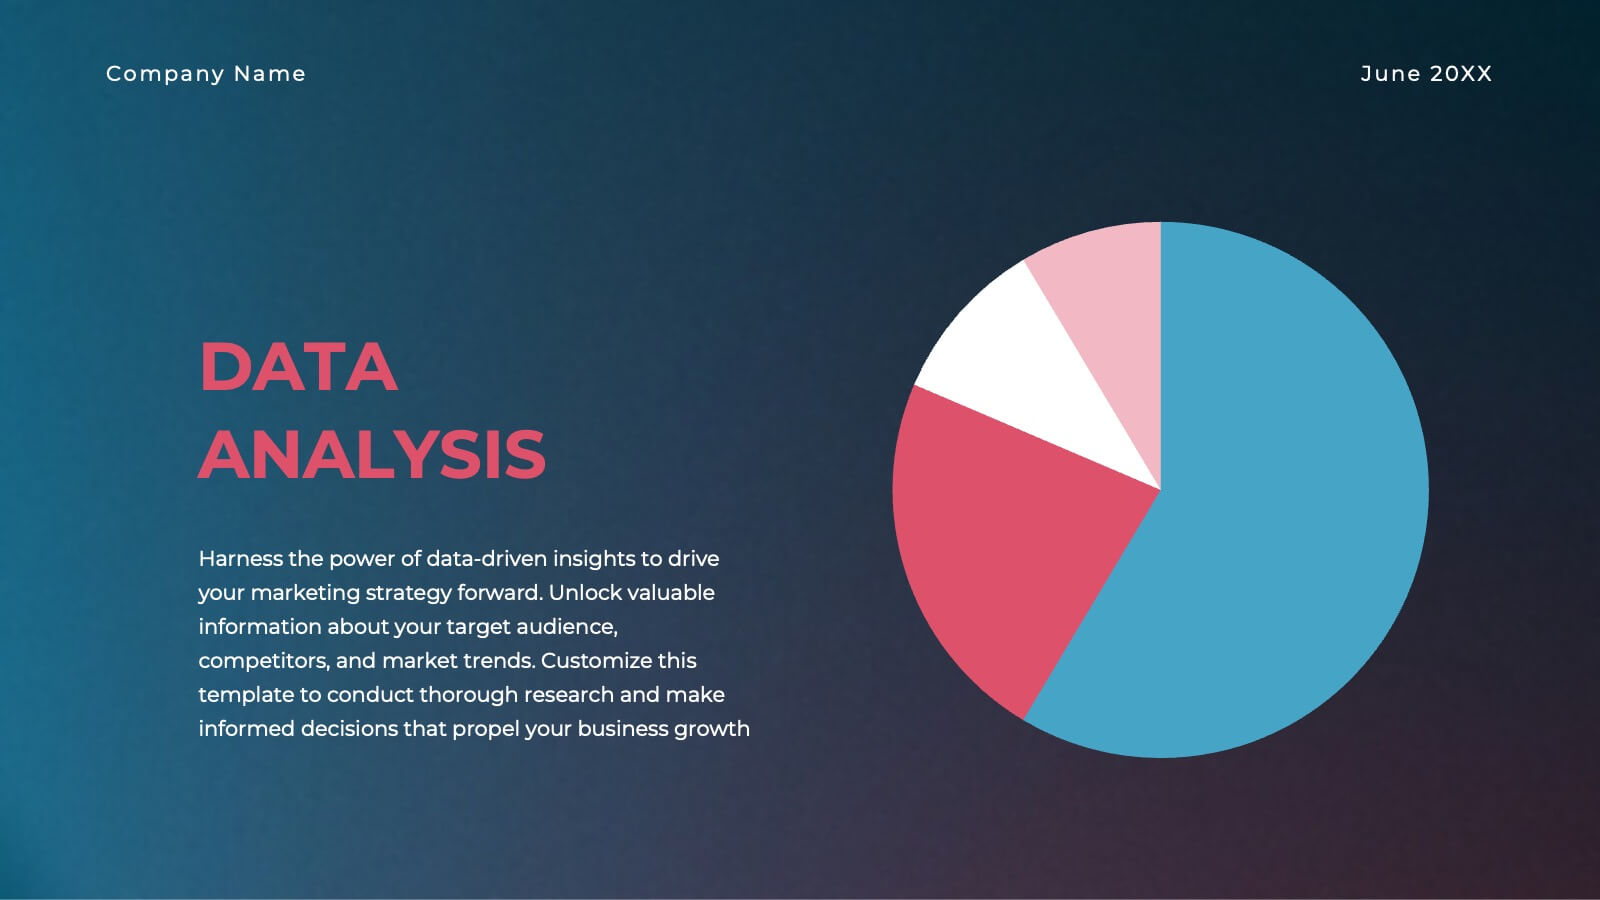
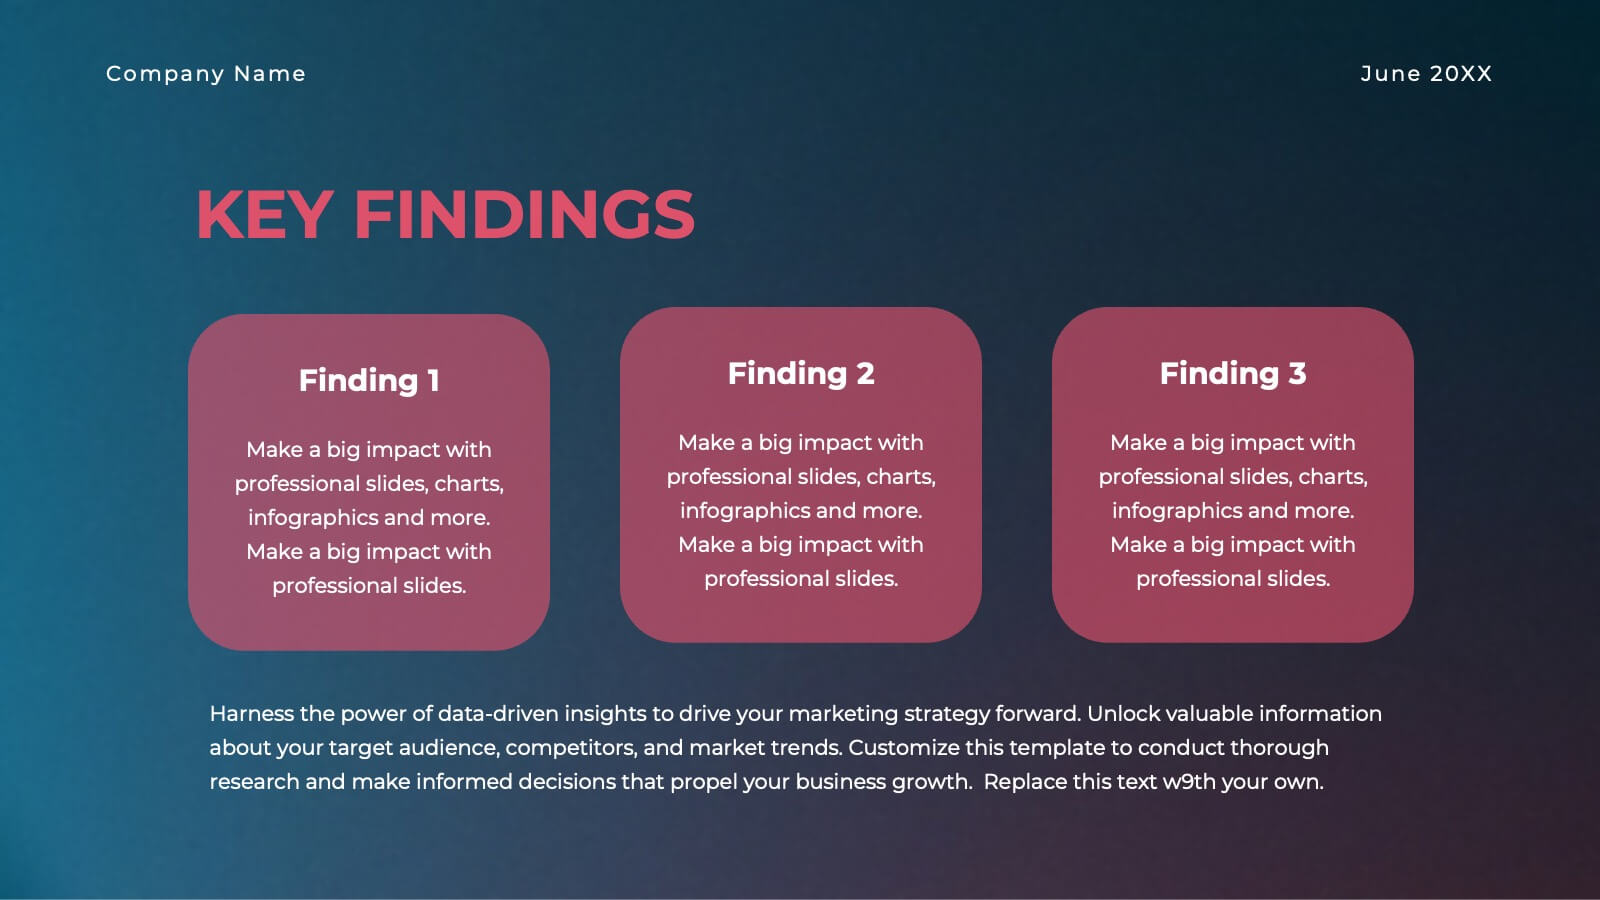
Gold Research Proposal Presentation
Present your research with impact using this sleek and modern research proposal template! Featuring sections for objectives, data collection, analysis, key findings, and recommendations, this template helps organize your research clearly and professionally. Fully customizable and compatible with PowerPoint, Keynote, and Google Slides, it's ideal for any research presentation.


4 diapositivas
Multi-Stage Process Hexagon Infographic Presentation
Showcase your workflows clearly with the Multi-Stage Process Hexagon Infographic Presentation. This template features a sleek chain of hexagons, ideal for visualizing linear steps, sequential planning, or project phases. Each stage is editable, color-coded, and easy to customize in PowerPoint, Keynote, or Google Slides—perfect for teams, educators, or project managers.


6 diapositivas
Work from Home Best Practices Presentation
The "Work from Home Best Practices" presentation template is thoughtfully designed to display metrics and insights for remote work effectiveness. Each slide provides visual elements like bar graphs, line charts, and icon grids to represent various data points such as weekly activity percentage, hours worked, and number of projects managed. This setup is ideal for illustrating best practices and benchmarks in remote work environments, enabling clear communication of goals, achievements, and areas for improvement. The template uses a clean and professional layout with plenty of space for customization, making it a versatile tool for remote teams looking to optimize their workflows and productivity.


7 diapositivas
Root Cause Analysis for Problem Solving Presentation
Identify and Resolve Issues Effectively with this Root Cause Analysis for Problem Solving presentation template. Designed to streamline complex problem-solving, this layout features clear visual markers, structured iconography, and step-by-step segmentation to help teams analyze causes, pinpoint bottlenecks, and implement solutions efficiently. Ideal for project managers, business analysts, and operational teams, this template is fully customizable and works seamlessly in PowerPoint, Keynote, and Google Slides, ensuring a professional and engaging presentation experience.


6 diapositivas
RAPID Roles and Responsibilities Slide Presentation
Make teamwork crystal clear with a structured chart that defines who does what and when. This organized layout helps map decision-making roles, streamline collaboration, and prevent confusion in complex projects. Easy to edit and ready to use, it’s fully compatible with PowerPoint, Keynote, and Google Slides for smooth customization.


6 diapositivas
Thank You Letter Infographic
Showcase your appreciation with this collection, perfectly curated to express gratitude in the most heartfelt way. Each template is designed with a unique blend of style and simplicity, featuring modern layouts, elegant fonts, and a calming color scheme that adds a touch of sophistication to your message. These designs are versatile enough to be adapted for a variety of occasions, whether it's thanking a colleague, client, or friend. They provide a professional yet personal means to convey your thanks, enhancing the sincerity of your message. Customize the templates to include personal anecdotes or details specific to the recipient, making each thank you letter feel both genuine and thoughtful. Ideal for both corporate and personal use, this collection ensures that your gesture of gratitude leaves a lasting impression, enhancing professional relationships and personal bonds alike.


22 diapositivas
Jade Graphic Design Project Plan Presentation
Unleash creativity with this vibrant Graphic Design Project template! Perfect for showcasing your design process, prototypes, and assets, it keeps the audience captivated with clean visuals and a fresh, modern look. Whether you're outlining color palettes or final designs, every slide exudes style. Ideal for PowerPoint, Keynote, and Google Slides!


7 diapositivas
Executive Summary Format Infographic
Concisely communicate your organization's high-level insights with our Executive Summary Infographic, perfect for business reports and strategic presentations. This infographic is a vital tool for executives, managers, and business analysts to encapsulate key information. Our Executive Summary Infographic offers a visually engaging layout that summarizes complex data into digestible segments. It includes sections for financial highlights, performance metrics, strategic goals, and key achievements. With its customizable features, you can tailor the infographic to represent organizational successes, growth percentages, target completions, and forecasted trends. This SEO-optimized infographic ensures that your executive insights capture the attention of stakeholders and team members alike. Incorporate our infographic into your business documentation to provide a snapshot of your company's performance and strategic direction efficiently.


5 diapositivas
Marketing Strategy Wheel Diagram Presentation
Visualize your marketing framework in a clear and engaging way with this Marketing Strategy Wheel Diagram. Designed to highlight key components like audience targeting, communication channels, and campaign goals, this circular format brings strategy to life. Fully customizable and compatible with PowerPoint, Keynote, and Google Slides. Ideal for marketers, agencies, and branding professionals.


6 diapositivas
Touchpoint-Based Customer Journey Map Presentation
Visualize each stage of the user experience with this Touchpoint-Based Customer Journey Map presentation. Perfect for tracking interactions across the customer lifecycle—from awareness to loyalty—this layout helps pinpoint strengths and gaps at every phase. Clean columns and color-coded touchpoints ensure quick analysis. Fully compatible with PowerPoint, Canva, and Google Slides.


20 diapositivas
Trend Report Presentation
Navigate the latest market developments with this Trend Report presentation template. Perfect for displaying current marketing trends, consumer behavior, and future predictions, this vibrant template includes slides for social media strategies, influencer marketing, and more. Fully compatible with PowerPoint, Keynote, and Google Slides, it’s ideal for professionals looking to stay ahead in dynamic industries.


23 diapositivas
Quest Qualitative Research Findings Presentation
This dynamic and sleek research template presents qualitative findings with style and clarity. Dive into research objectives, data collection, key findings, and future directions, all showcased with a minimalist black-and-white design. Perfect for impactful presentations, this template is compatible with PowerPoint, Keynote, and Google Slides, making it versatile for any audience!


4 diapositivas
Buyer Persona Research and Profile Map Presentation
Make your audience feel like they already know your ideal customer. This creative template helps you visually map out key buyer persona data, such as demographics, goals, behavior, and pain points. Perfect for marketing strategy and customer research presentations. Fully compatible with PowerPoint, Keynote, and Google Slides for seamless editing.


10 diapositivas
Digital Transformation Strategy Presentation
The "Digital Transformation Strategy Presentation" template is designed to clearly showcase the stages of digital transformation initiatives. It features a visually appealing layout with concentric circles or varying targets that focus on key elements of transformation strategy. This format is ideal for emphasizing the progression from planning to execution and monitoring of digital strategies. Each section is distinctly colored and provides a space for succinctly labeled titles and detailed descriptions, making it perfect for presenting strategic initiatives, technology implementation, or progress metrics in corporate settings. The template ensures that complex strategies are communicated in an understandable and visually engaging manner.


7 diapositivas
North America Map Infographic Presentation Template
North America is a continent entirely within the Northern Hemisphere and almost all within the Western Hemisphere. It can also be considered a northern subcontinent of the Americas. North America is the third largest continent in the world, and home to some of the world's most iconic landmarks. This North America template is great for creating a simple and clean map. This easy-to-customize map includes icons in both light and dark color variations. This North America map template is great for presentations, reports and more. Add your data to create a professional presentation.