


Características


¿Tienes alguna pregunta?
Recomendar


7 diapositivas
Oceania Map Infographic Presentation Template
The Oceania Map is a geographical region comprising Australasia, Melanesia, Micronesia and Polynesia. The largest landmass of Oceania is Australia. Oceania's borders differ slightly from country to country, but its boundaries are mostly defined by the waters surrounding its many islands. This Oceania map template is the first step to creating an engaging and informative map. It features the entire continent, surrounding islands, and sub-regions. The white background makes it easy to fill out with your colorful content. This template is suitable for school projects or business presentations.


6 diapositivas
Strategy Investing Wheel Infographics
Illustrate your investment strategy effectively with our Strategy Investing Wheel infographic template. This template is fully compatible with popular presentation software like PowerPoint, Keynote, and Google Slides, allowing you to easily customize it to showcase your investment approach using a wheel diagram. The Strategy Investing Wheel infographic template offers a visually engaging platform to depict your investment strategy components, such as asset allocation, risk tolerance, time horizon, and diversification. Whether you're an investor, financial planner, or analyst, this template provides a user-friendly canvas to create informative presentations and reports on your investment strategy. Optimize your investment decision-making with this SEO-optimized Strategy Investing Wheel infographic template, thoughtfully designed for clarity and ease of use. Customize it to showcase your unique strategy, key principles, and investment objectives, helping you communicate your approach to stakeholders and clients effectively. Start crafting your personalized infographic today to convey your investment strategy with impact and clarity.


5 diapositivas
Food Business Pitch Deck Presentation
Bring your food concept to life with a lively, story-driven presentation that highlights flavor, creativity, and business potential. This slide design helps you explain your menu vision, branding approach, and restaurant strategy in a clean and engaging format. Fully compatible with PowerPoint, Keynote, and Google Slides.


5 diapositivas
Nutrition & Health Infographics
Nutrition & Health are essential aspects of a person's well-being. Good nutrition habits provide the nutrients that the body needs to function optimally. These infographics are visual representations of information related to the relationship between diet, exercise, and overall health. They are designed to provide concise, easily digestible information that can help people make informed decisions about their diet and lifestyle choices. Nutrition and health infographics can serve as a valuable tool for individuals looking to improve their overall health and well-being through informed dietary choices.


5 diapositivas
Investor-Ready Business Pitch Plan Presentation
Make your business roadmap stand out with this dynamic visual journey, perfect for impressing investors from the first slide. This infographic-style pitch deck helps clearly outline your business strategy across five milestones, using vibrant colors and icons for easy comprehension. Fully compatible with PowerPoint, Keynote, and Google Slides.


4 diapositivas
End-to-End Supply Chain Optimization Presentation
Streamline your logistics strategy with this modern End-to-End Supply Chain Optimization slide. Featuring bold vector icons representing production, automation, and distribution, this layout clearly visualizes key supply chain stages. Ideal for presenting operations flow, logistics planning, or manufacturing improvements. Fully customizable in PowerPoint, Keynote, and Google Slides for seamless integration into your business deck.


5 diapositivas
Health Awareness Campaign Presentation
Bright and uplifting, this slide brings awareness to important health causes through a clean ribbon-focused layout that’s easy to read and visually engaging. It helps present key messages, statistics, or campaign steps clearly while keeping the design calm and supportive. Fully compatible with PowerPoint, Keynote, and Google Slides.


4 diapositivas
Medical Theme Slides for Healthcare Presentation
Bring clarity and care to your data storytelling with this modern healthcare-themed presentation. Designed for hospitals, clinics, or medical professionals, it helps you present health data, research findings, and patient care insights with professionalism and trust. Fully customizable and compatible with PowerPoint, Keynote, and Google Slides for seamless editing.


6 diapositivas
Ecological Sustainability Goals Presentation
Bring your environmental vision to life with a clean, uplifting layout that guides audiences through key sustainability milestones. This presentation helps you explain eco-focused goals, long-term impact, and actionable strategies in a simple, structured way that’s easy to follow. Fully compatible with PowerPoint, Keynote, and Google Slides.


26 diapositivas
Wok Presentation Template
Want to learn about popular Chinese dishes? Wok is a fun and colorful template made for you. It includes all the essential elements of a food related template: fresh ingredients and vibrant colors. Wok was developed to meet the needs of those who want to promote their business with a clean and organized design. It has easy editing features making it simple to customize by adding company logos and other relevant details. The template is responsive, which means that it will adapt its layout based on how the user wants it displayed. This makes it easy to access the site from wherever you may be.


20 diapositivas
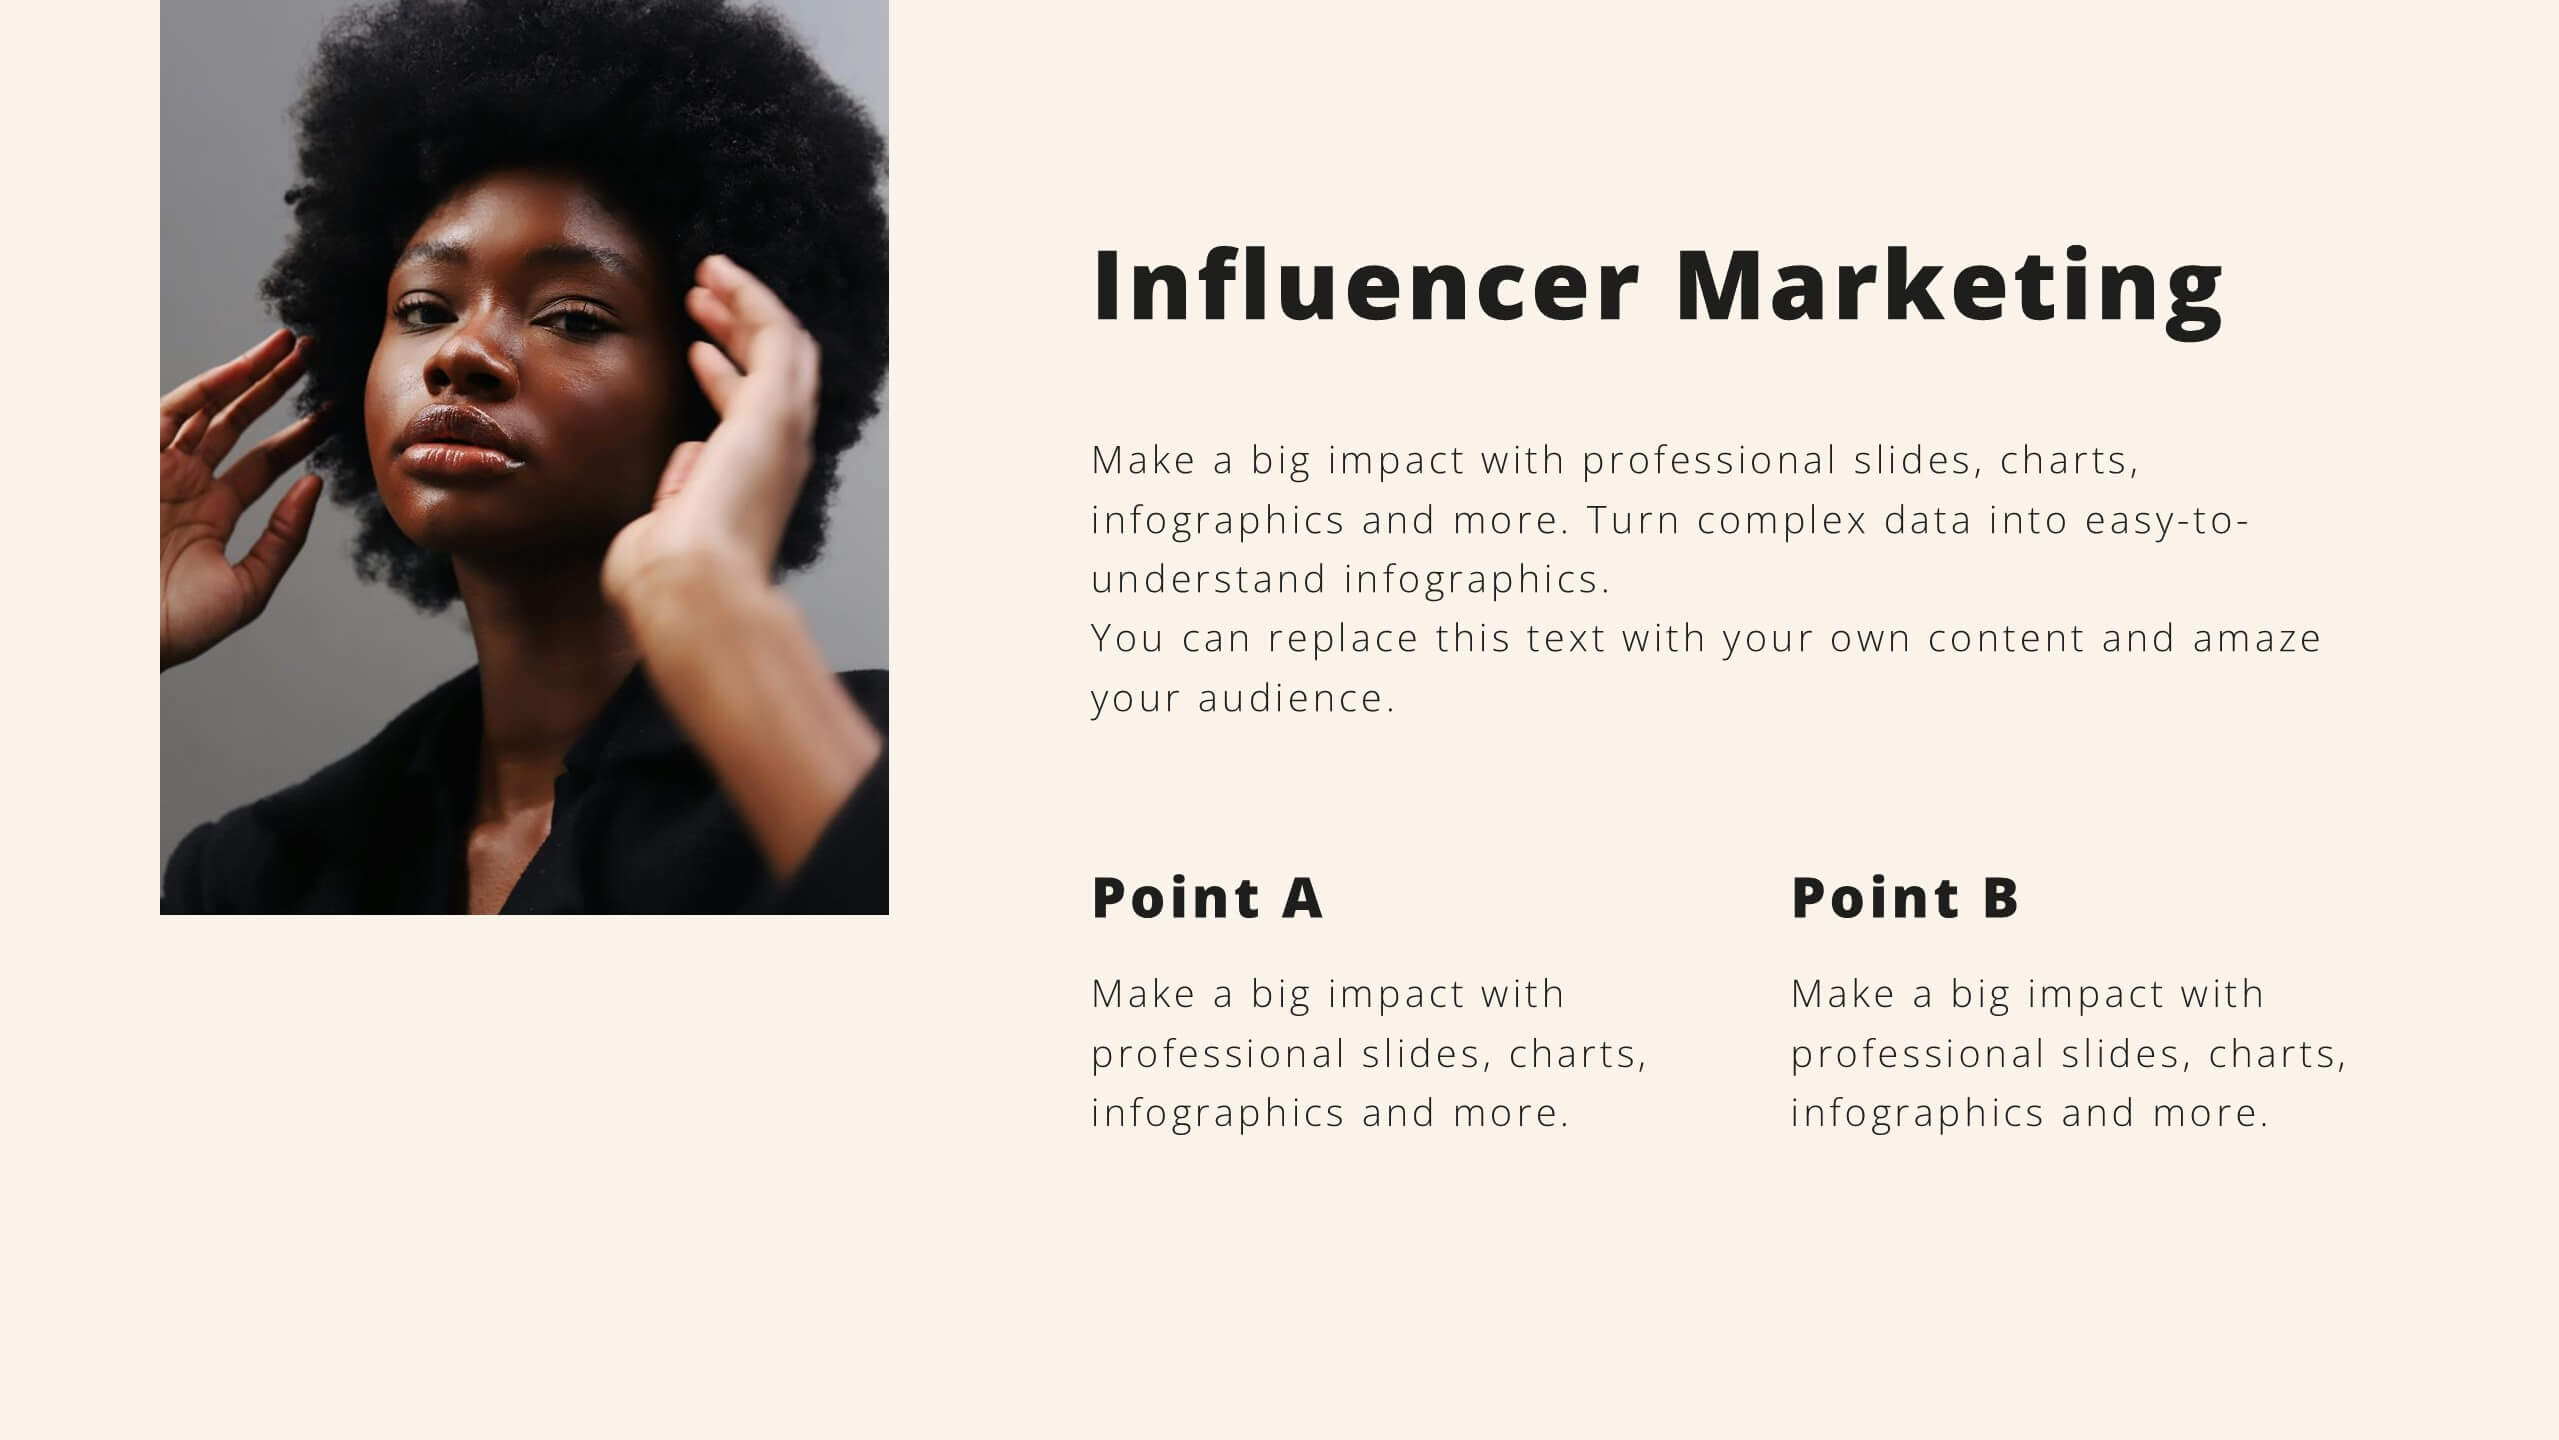
Amethyst Marketing Proposal Template Presentation
Bring your marketing ideas to life with this eye-catching amethyst-themed presentation! Tailored for presenting your marketing proposals, this template helps you outline key strategies, campaigns, and target audiences in a sleek, professional design. Its bold layout ensures your message shines through. Compatible with PowerPoint, Keynote, and Google Slides.


4 diapositivas
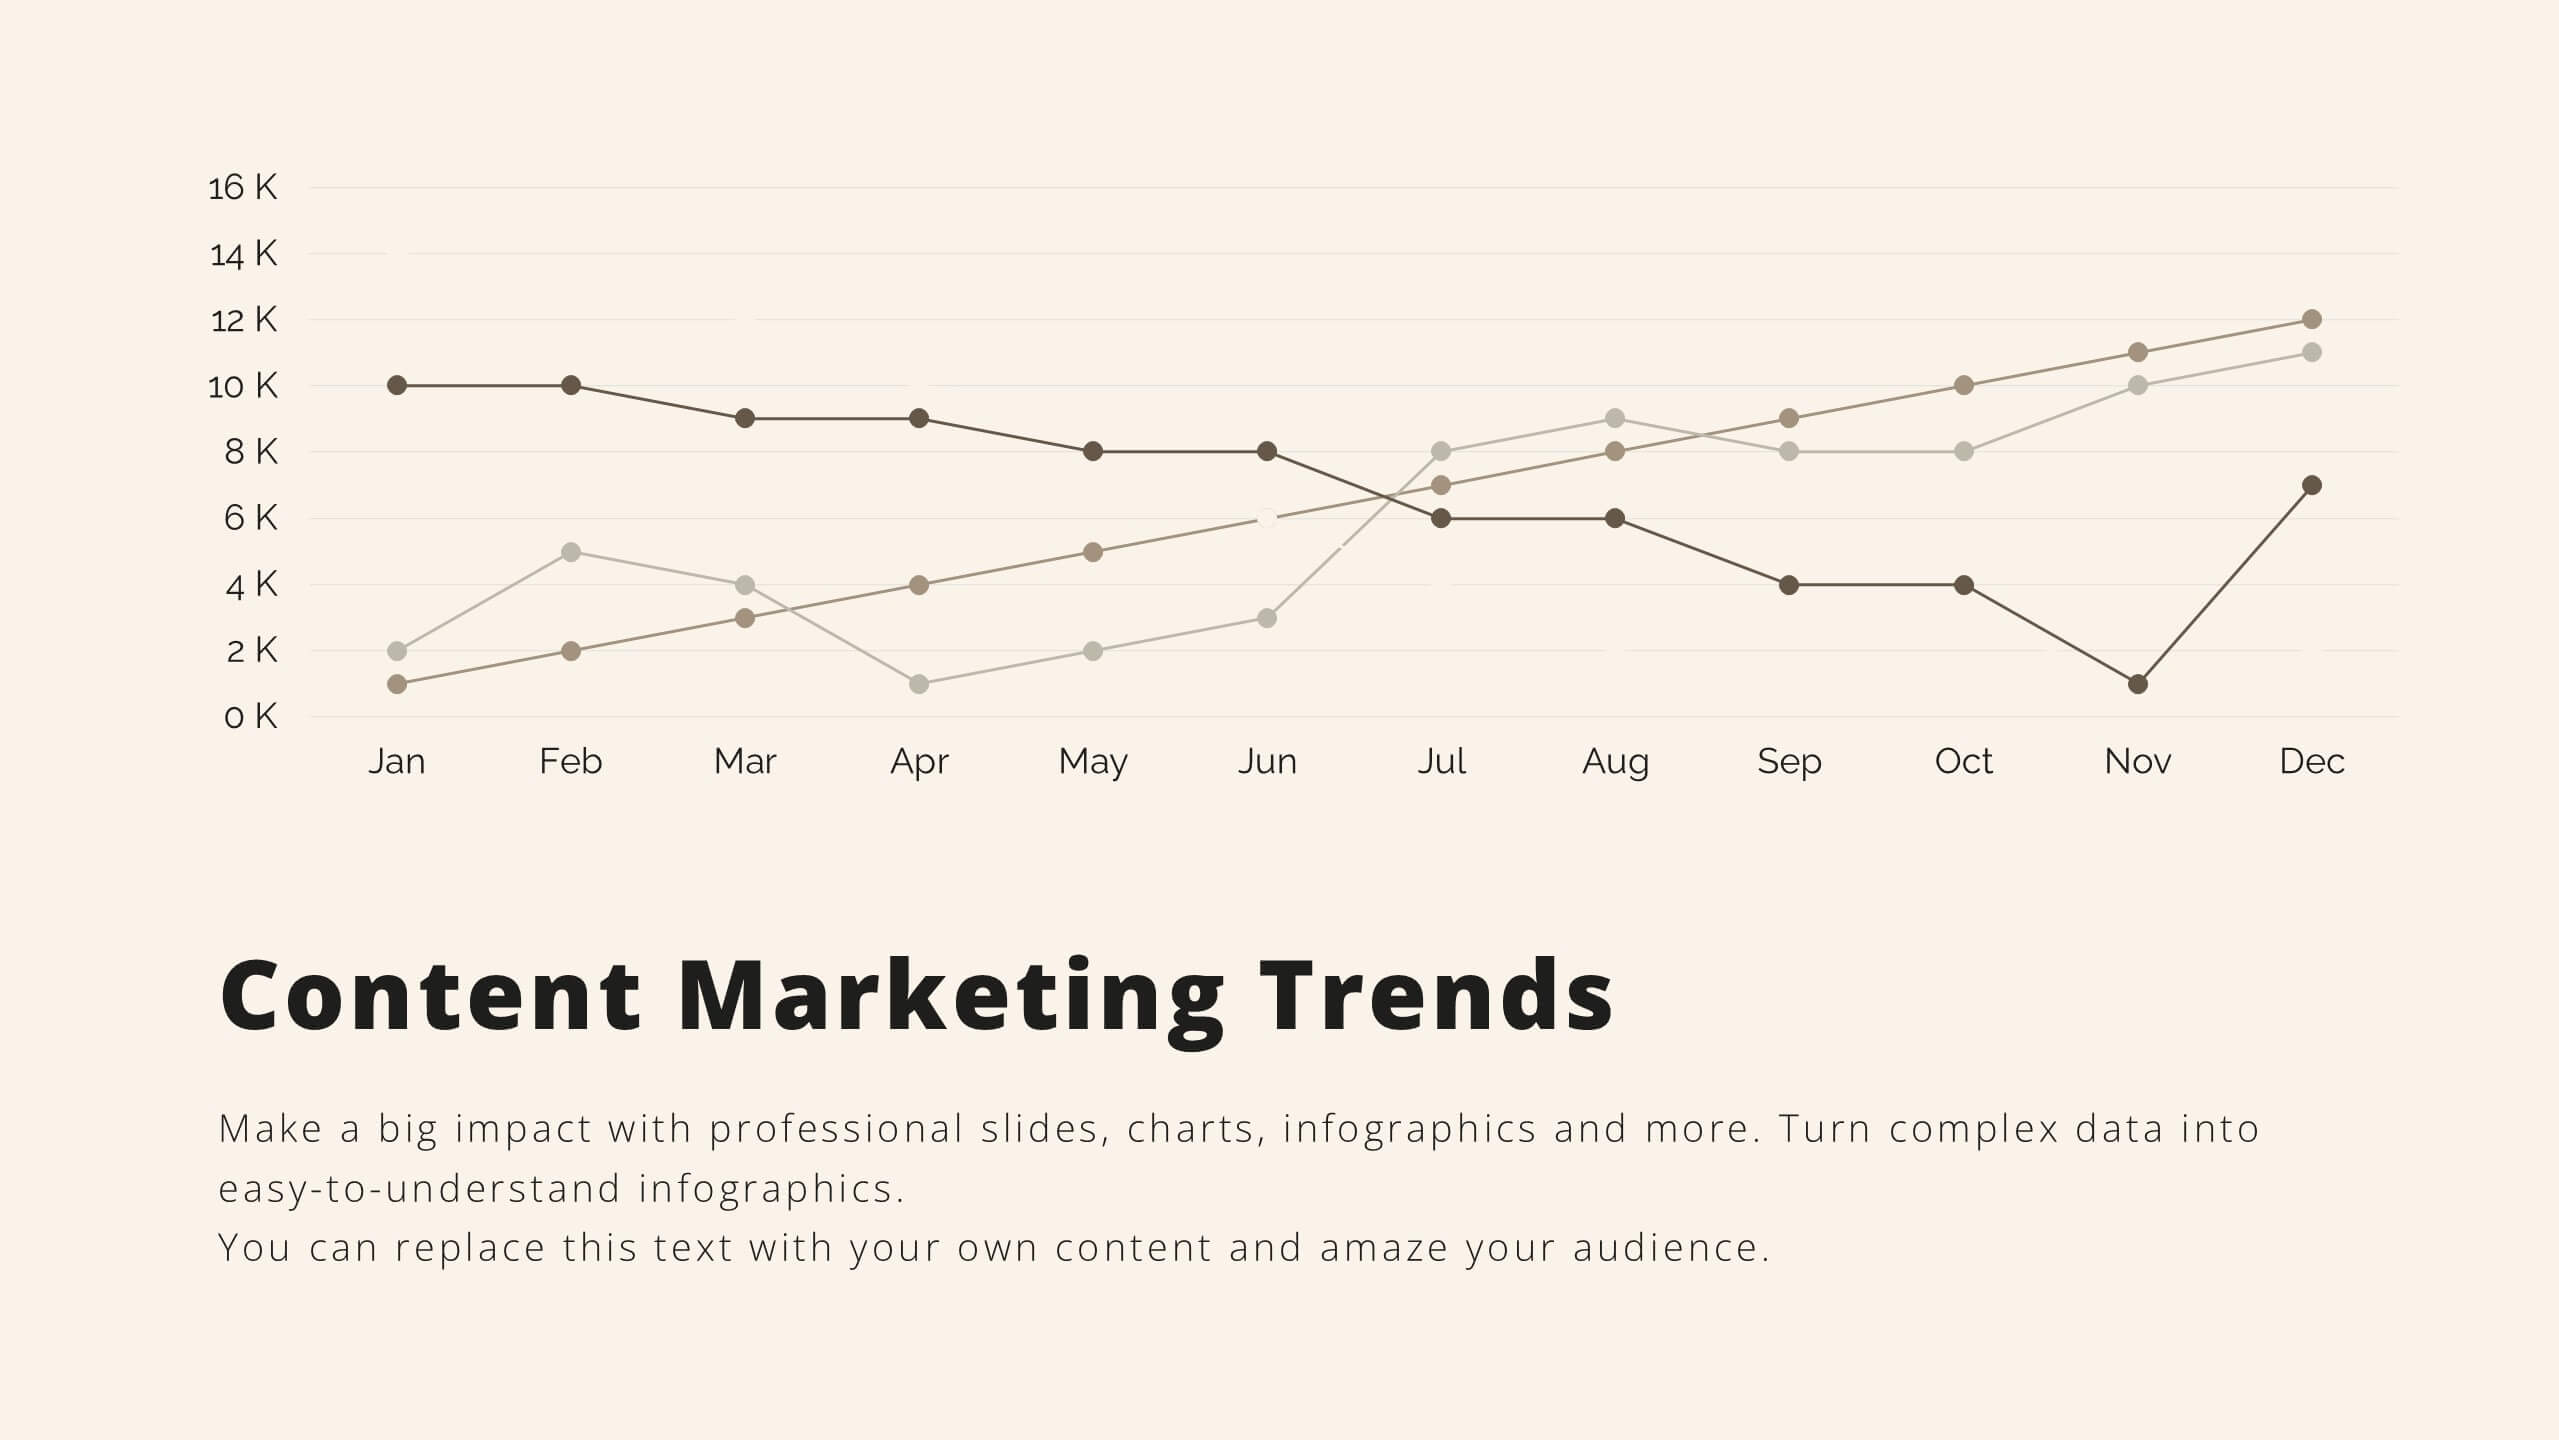
Strategic Planning Gap Assessment
Visualize growth opportunities with this Strategic Planning Gap Assessment template. Perfect for showcasing the gap between actual progression and potential performance over time. Ideal for risk evaluation, diversification, and product development planning. Fully editable for PowerPoint, Keynote, and Google Slides.


27 diapositivas
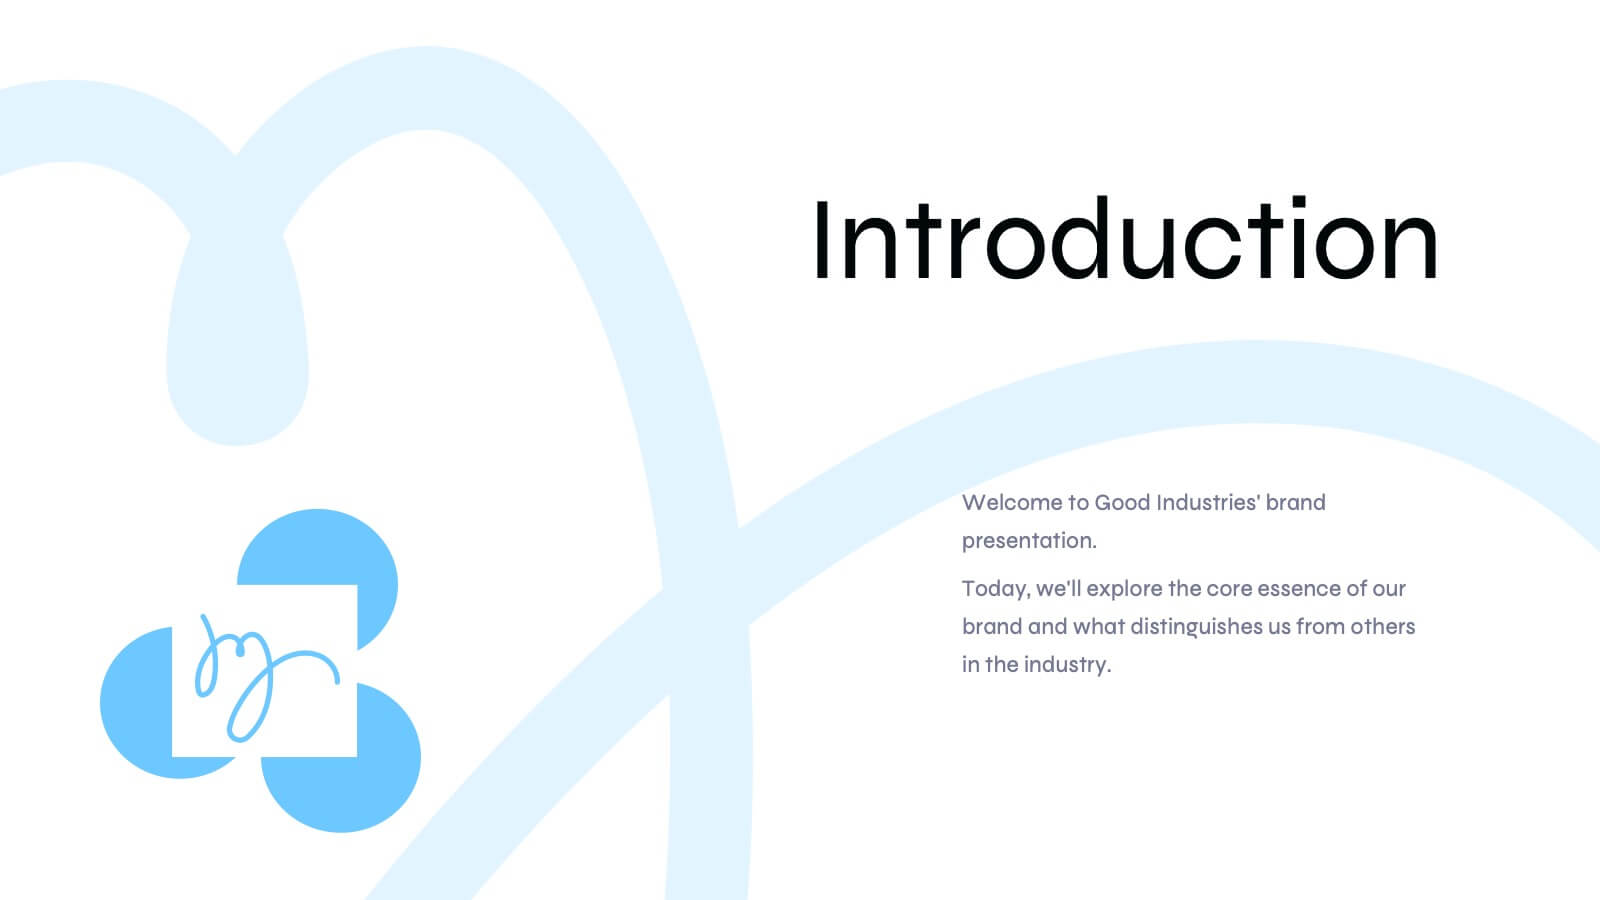
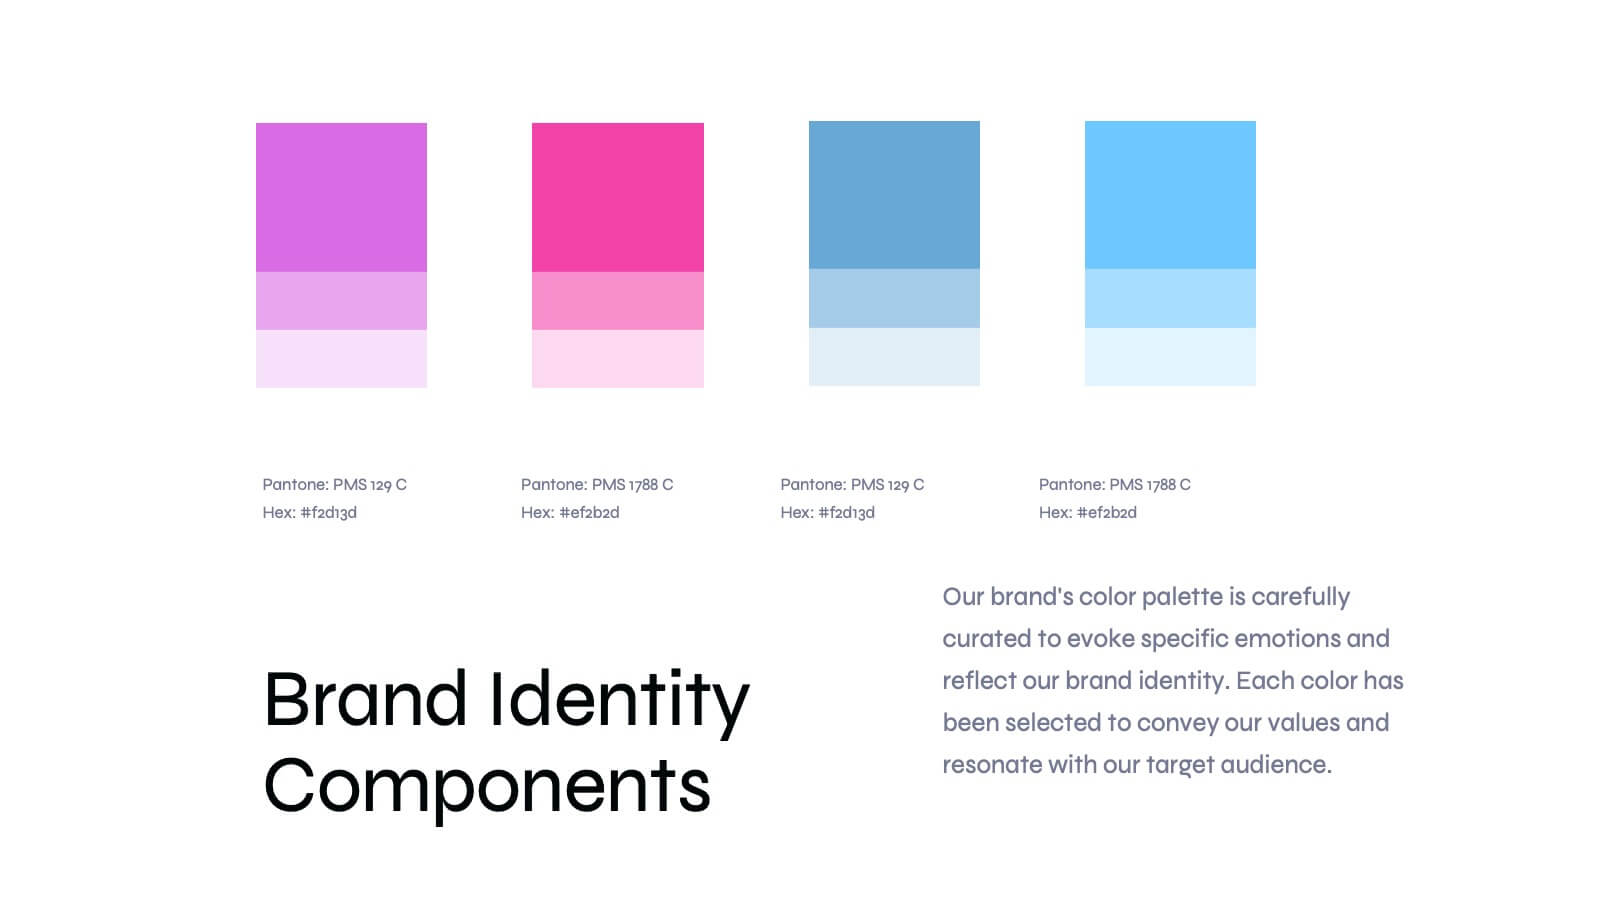
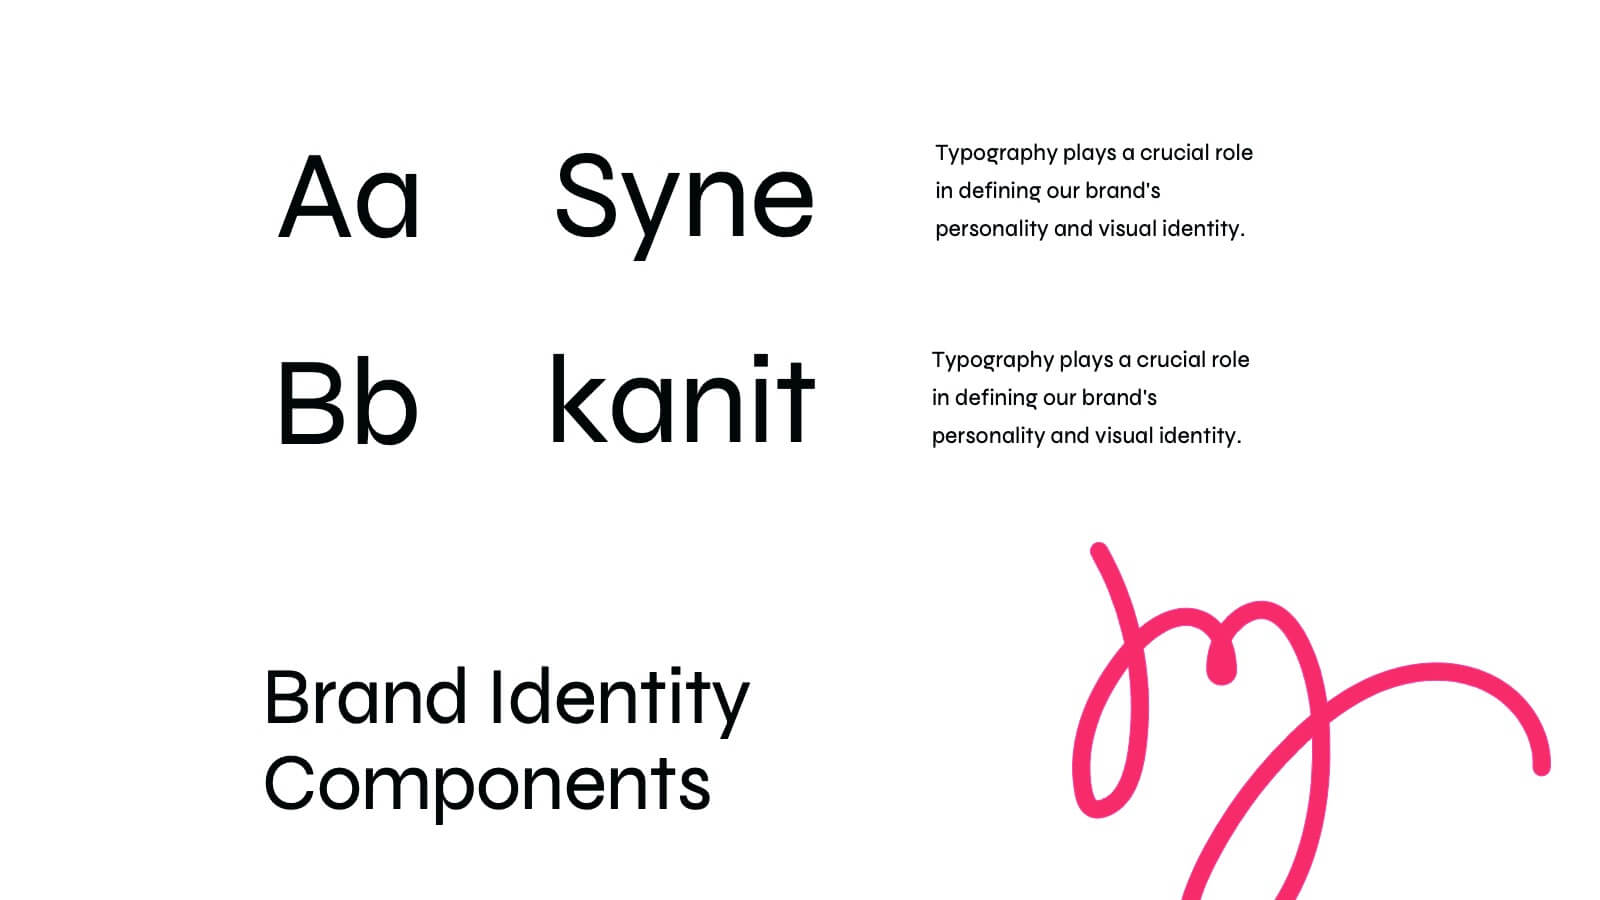
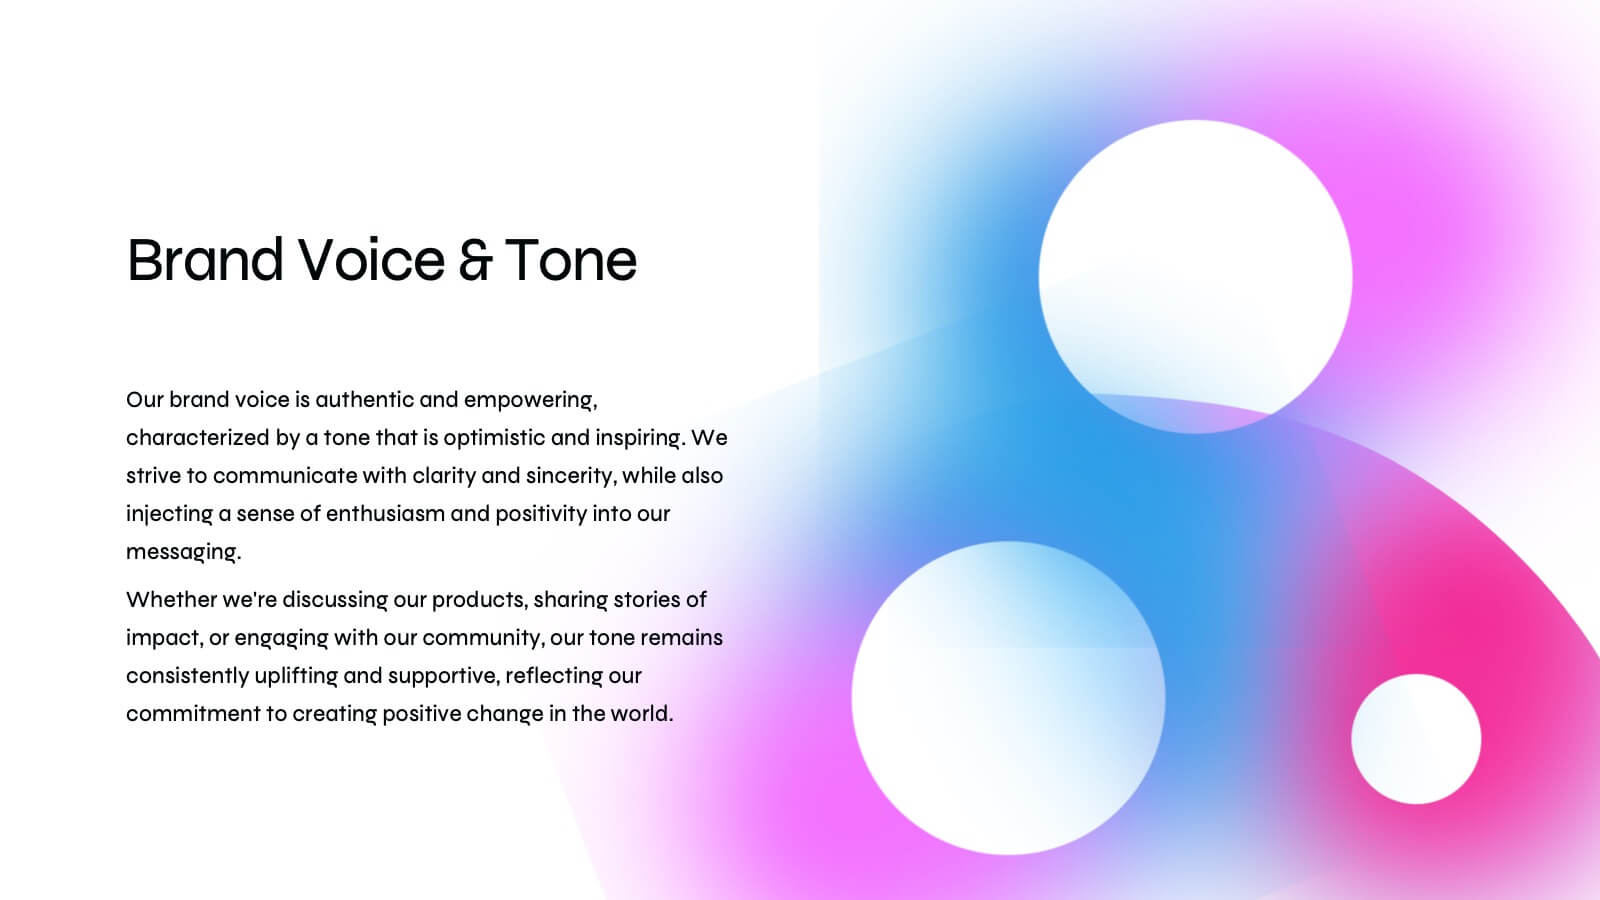
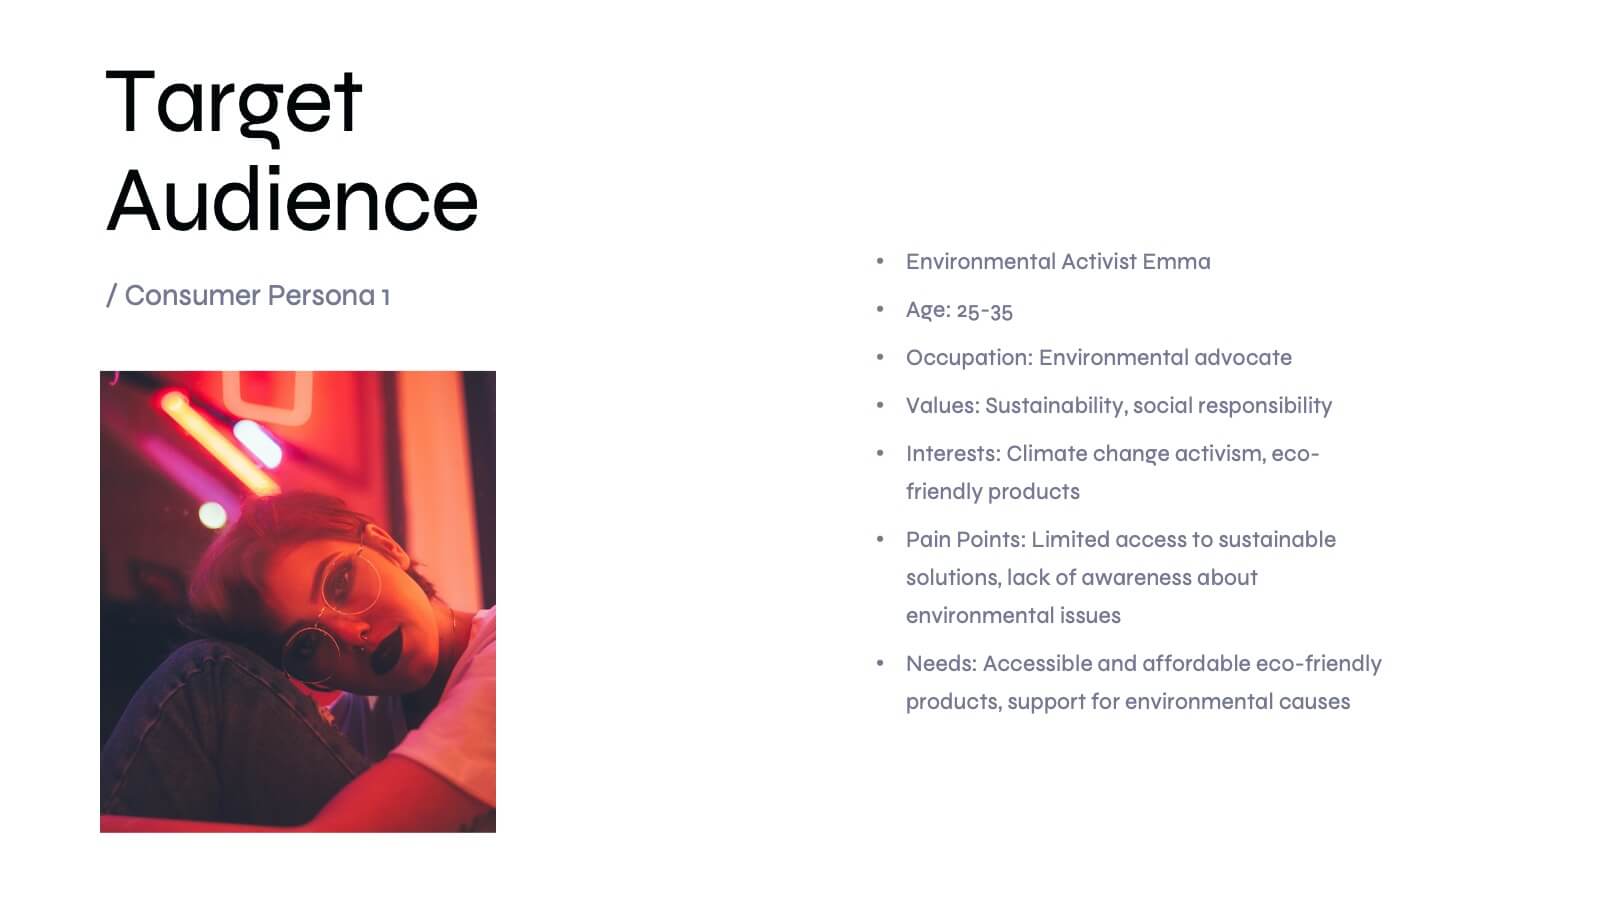
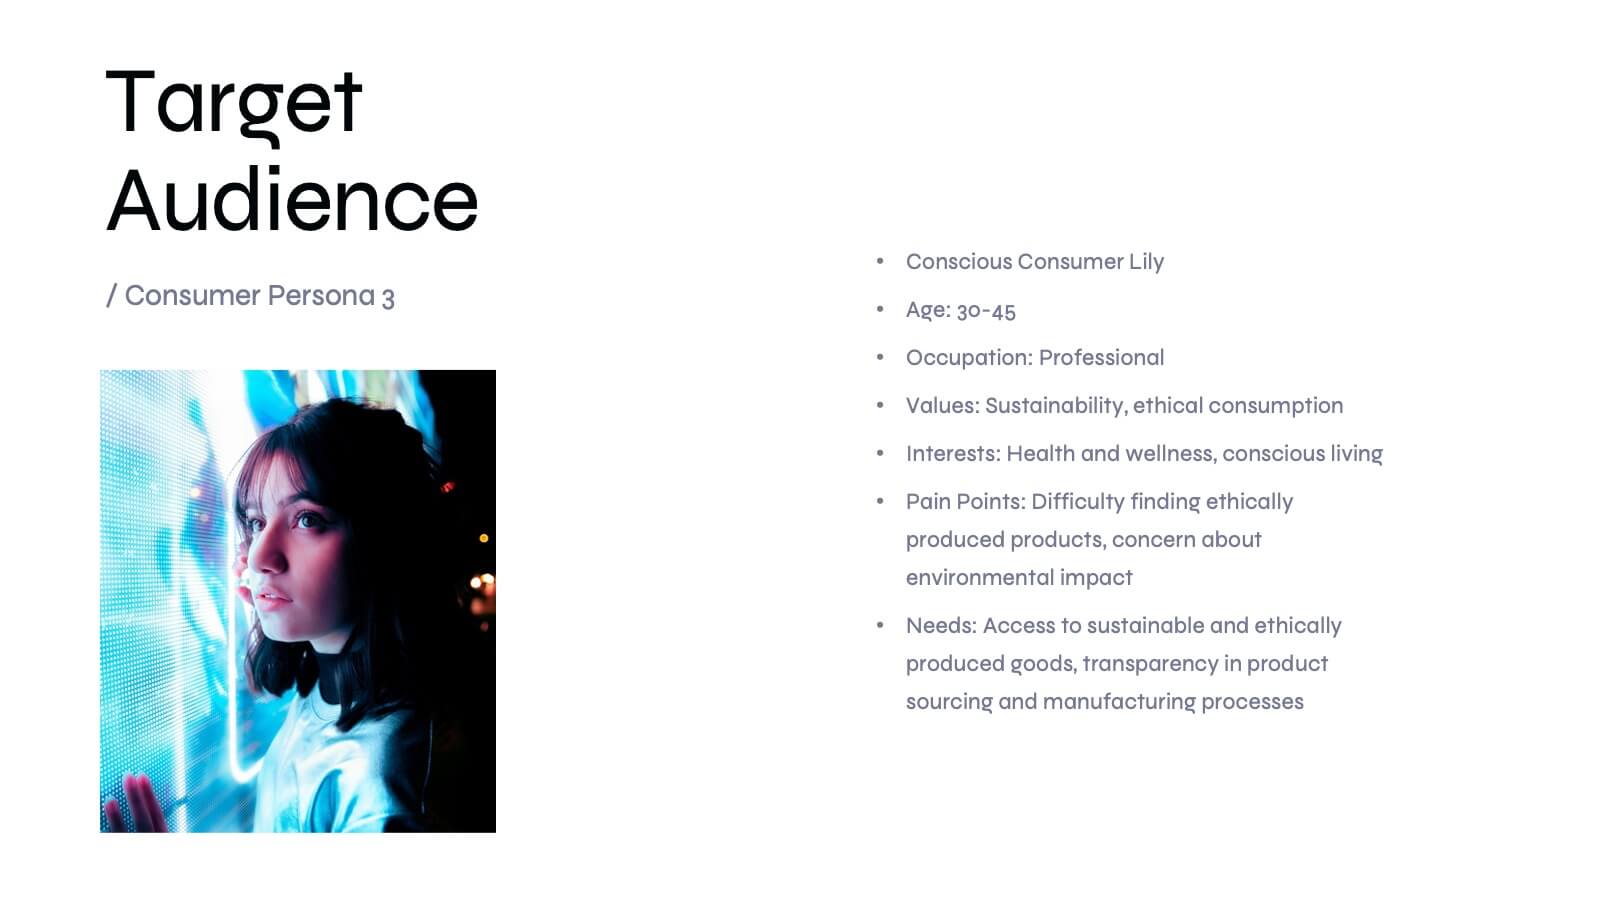
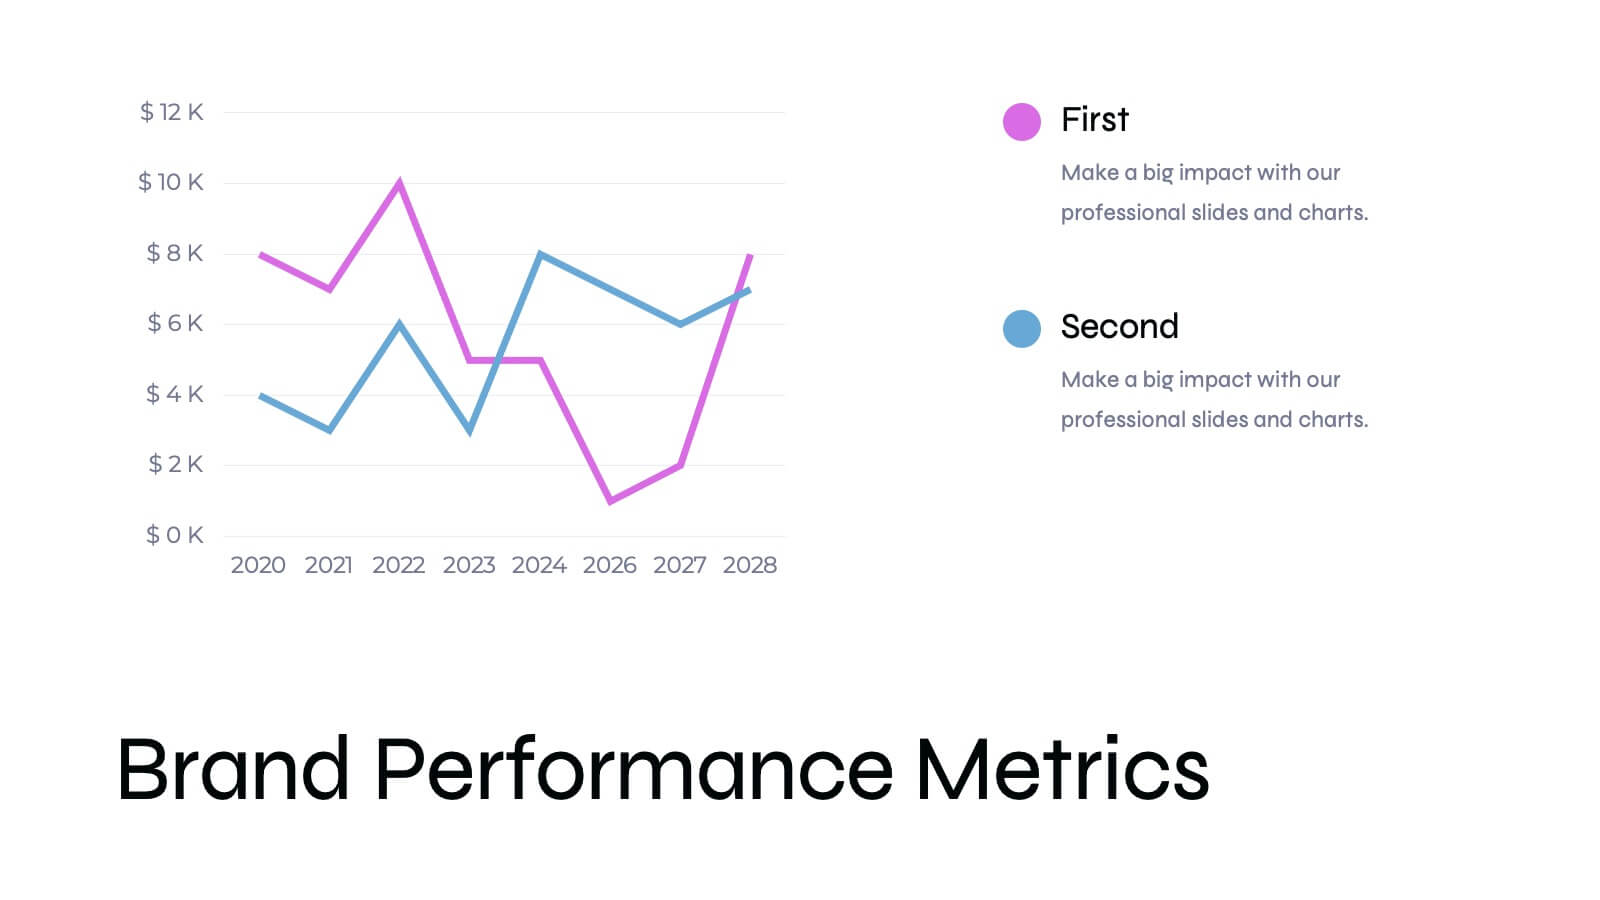
Basilisk Brand Guidelines Proposal Presentation
Present your brand strategy effectively with this modern brand guidelines proposal template! It includes sections for brand vision, values, identity, and market analysis. Fully customizable and compatible with PowerPoint, Keynote, and Google Slides, it’s perfect for showcasing your brand's identity and ensuring consistency across all platforms.


4 diapositivas
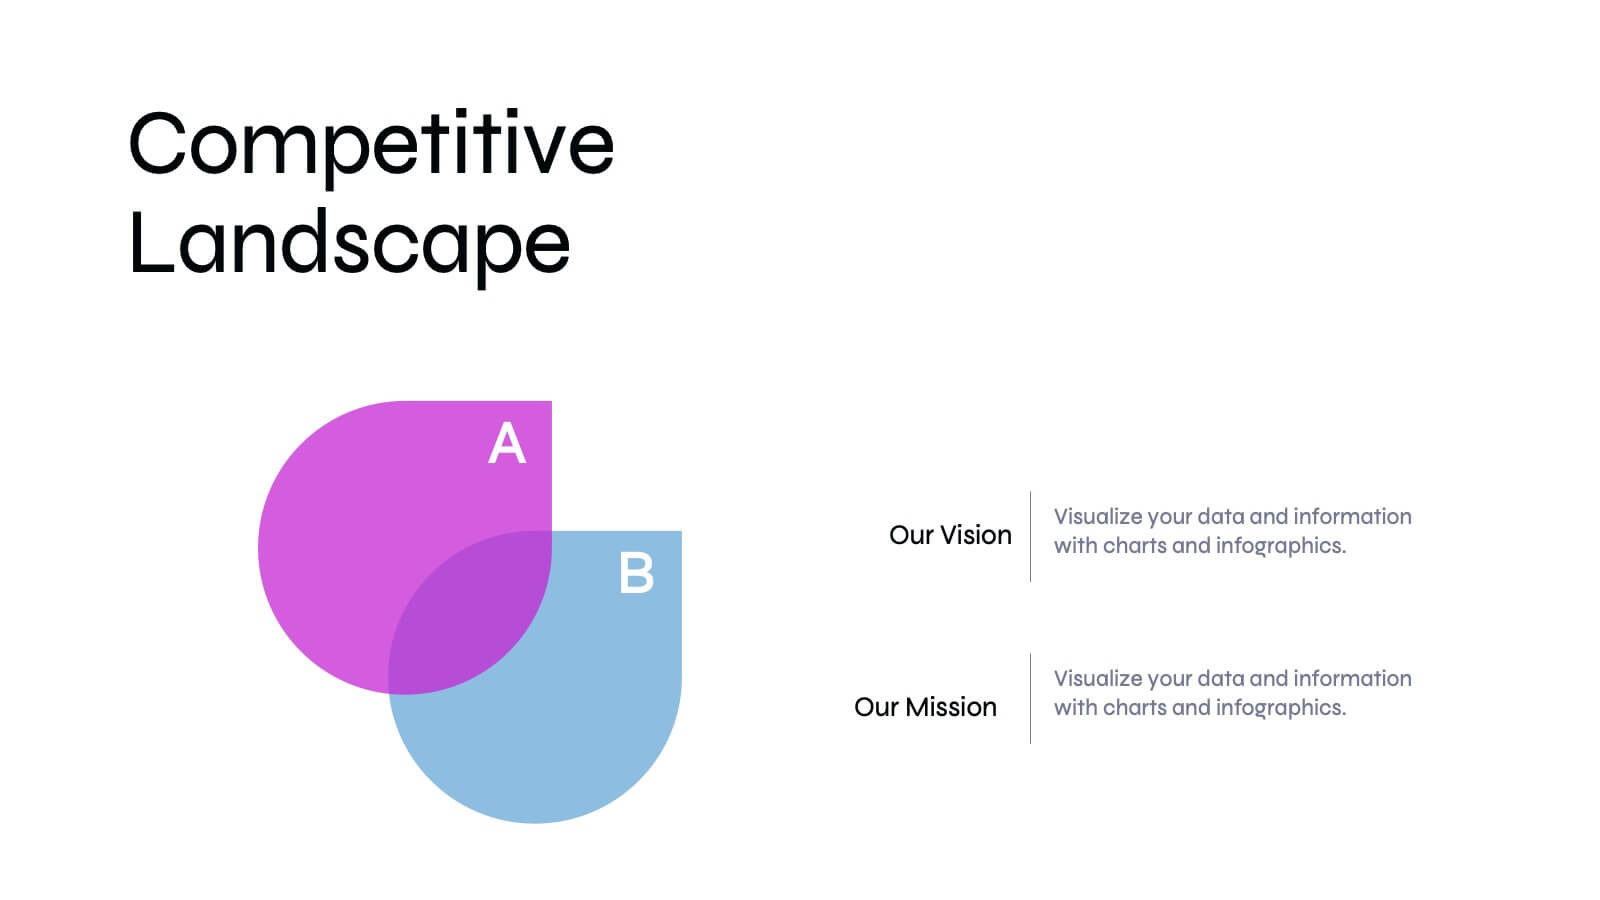
3-Circle Venn Diagram Presentation
Visualize overlap and connection with clarity using the 3-Circle Venn Diagram Presentation. This minimalist slide is ideal for showing relationships between three ideas, strategies, or data sets. Each circle is color-coded for distinction, and intersections highlight shared elements. Perfect for business models, marketing segments, or product comparisons. Fully editable in PowerPoint, Keynote, and Google Slides.


8 diapositivas
Healthcare Data Analysis Presentation
The "Healthcare Data Analysis Presentation" template offers a streamlined visual representation ideal for communicating complex healthcare data insights effectively. Designed with clarity in mind, it features sleek graphics symbolizing medical elements and clear percentage tags that quantify data in an immediately understandable way. This template facilitates the presentation of key data such as patient outcomes, treatment efficacy, or operational efficiency within healthcare settings. Its visual simplicity makes it an excellent choice for healthcare professionals and administrators who need to convey detailed statistics and results to stakeholders, ensuring that the key points are easily digestible and actionable.


6 diapositivas
Corporate Training Program Presentation
Build excitement from day one with a sleek and modern visual! This presentation template is ideal for outlining your professional development plans, onboarding paths, or internal training milestones in a structured, step-by-step format. Fully editable and designed to impress, it works seamlessly with PowerPoint, Keynote, and Google Slides.


6 diapositivas
Real Estate Property Market Overview Presentation
Present key property market insights using this structured, easy-to-follow layout. The slide features six labeled sections flanking a central house graphic—ideal for highlighting data points, regional comparisons, or investment factors. Fully customizable in Canva, PowerPoint, and Google Slides, making it perfect for real estate reports, pitches, or client presentations.