


Características


¿Tienes alguna pregunta?
Recomendar


7 diapositivas
Property Market Forecast and Trends Presentation
Present your real estate insights clearly with this Property Market Forecast and Trends Presentation. Featuring a central isometric house graphic surrounded by six editable segments, this layout is perfect for highlighting key indicators like market trends, pricing shifts, and investment zones. Use the icons and color-coded areas to enhance clarity. Ideal for housing reports and investor decks. Fully compatible with PowerPoint, Canva, Keynote, and Google Slides.


6 diapositivas
Conversion Funnel Stages Overview Presentation
Visualize user journeys with clarity using the Conversion Funnel Stages Overview Presentation. This funnel diagram template breaks down key conversion phases—from awareness to decision—into distinct, color-coded stages. Ideal for marketing reports, sales strategies, or product demos. Fully editable in PowerPoint, Google Slides, and Canva.


7 diapositivas
SWOT Analysis Marketing Infographic Presentation
SWOT Analysis is a simple, but powerful strategic planning method. It helps identify your company’s strengths, weaknesses, opportunities and threats as you plan a course for the future. This template includes everything you need for your next project, including data and insight about your business. This template comes with 7 slides. It includes a title for each infographic and allows you to build your swot charts, add icons and convert the text into bullet points. You have complete control over all elements within each slide and can easily add, delete or modify content at any time!


6 diapositivas
Roles and Responsibilities for Teams Presentation
Clearly outline team functions with this roles and responsibilities presentation. Highlight up to five individual positions using intuitive icons and clean visual layouts. Perfect for onboarding, team structuring, or project assignments. Fully editable in PowerPoint, Keynote, and Google Slides—ideal for aligning expectations and improving team collaboration across departments or initiatives.


7 diapositivas
Business Office Scenes Infographic Presentation
Office Scene Infographics can be a valuable tool for businesses or organizations that want to showcase their workplace culture or attract potential employees by providing a visual representation of what it's like to work at their company. This template is designed to provide a visual representation of different office scenarios and activities. The template is fully customizable and can be used for a variety of purposes, such as internal communication, training, marketing, and educational. It has a unique design, easy customization, and compatibility with Powerpoint, Keynote and Google Slides.


10 diapositivas
Business Scaling Strategy Presentation
Achieve rapid growth with the Business Scaling Strategy Diagram. This professional template helps you visualize key steps, strategic phases, and milestones for scaling a business effectively. Designed for entrepreneurs, executives, and consultants, this slide ensures a clear and structured presentation of your expansion strategy. Fully customizable and compatible with PowerPoint, Keynote, and Google Slides.


20 diapositivas
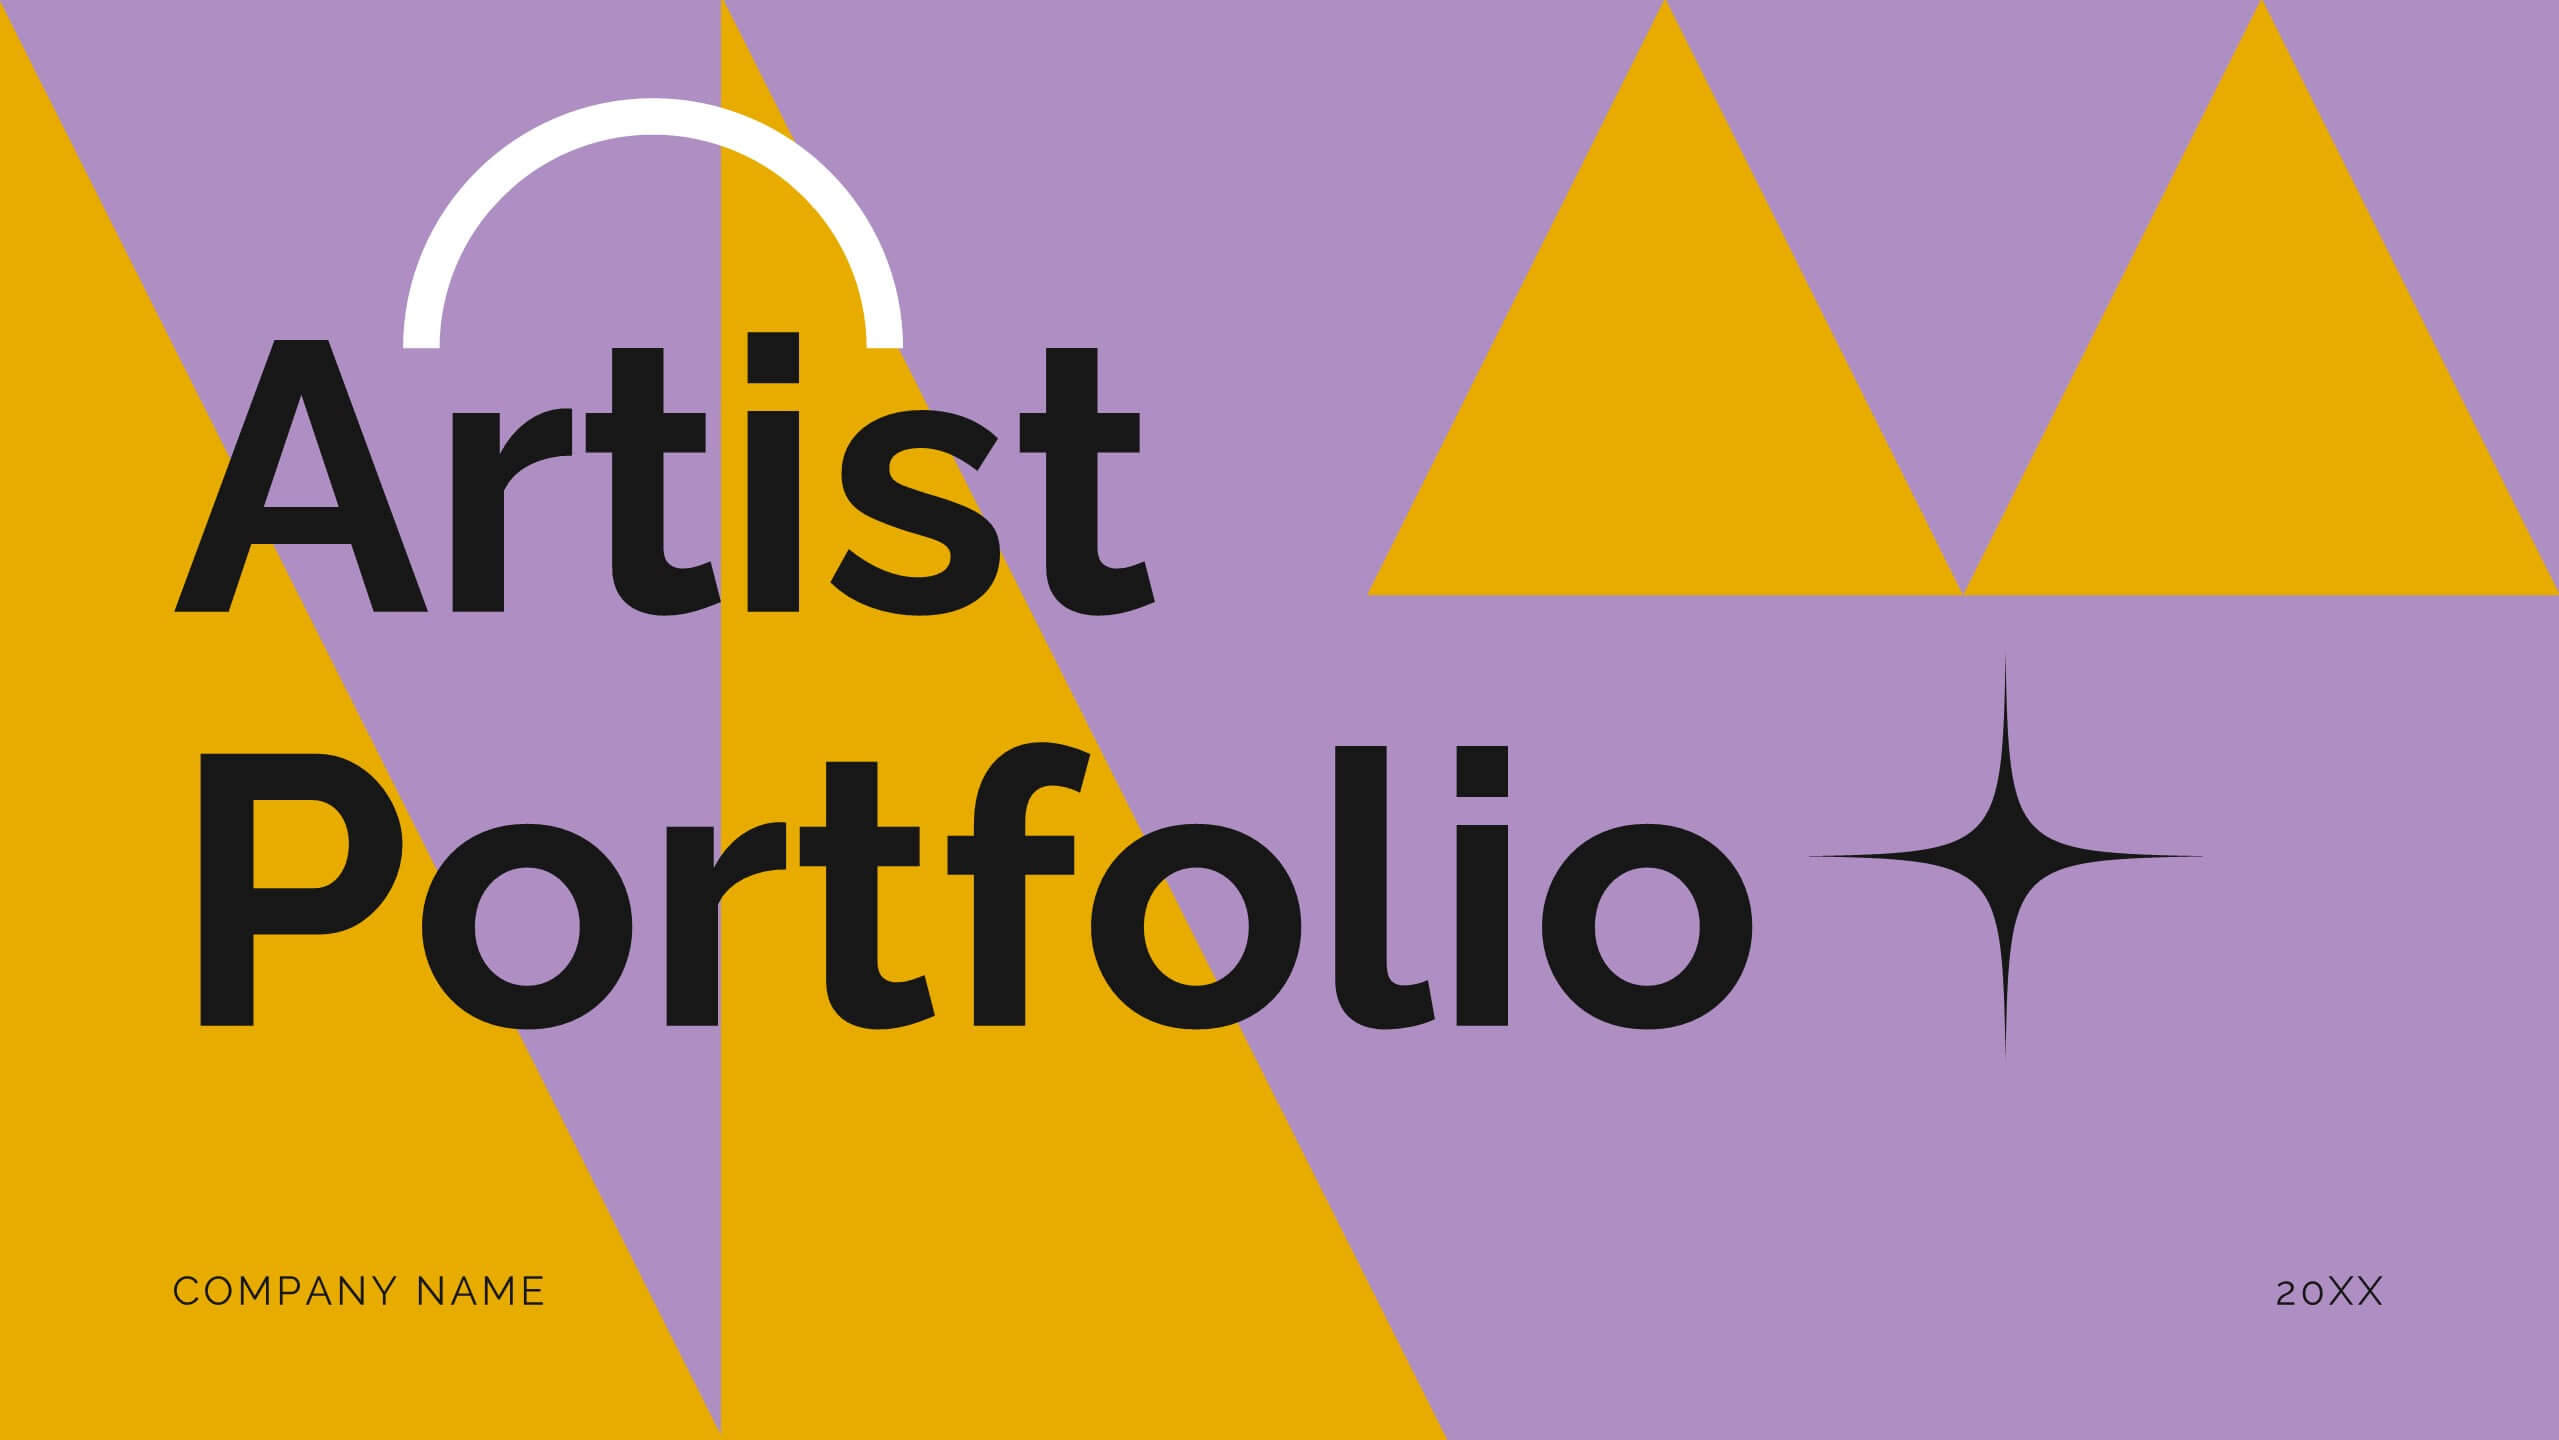
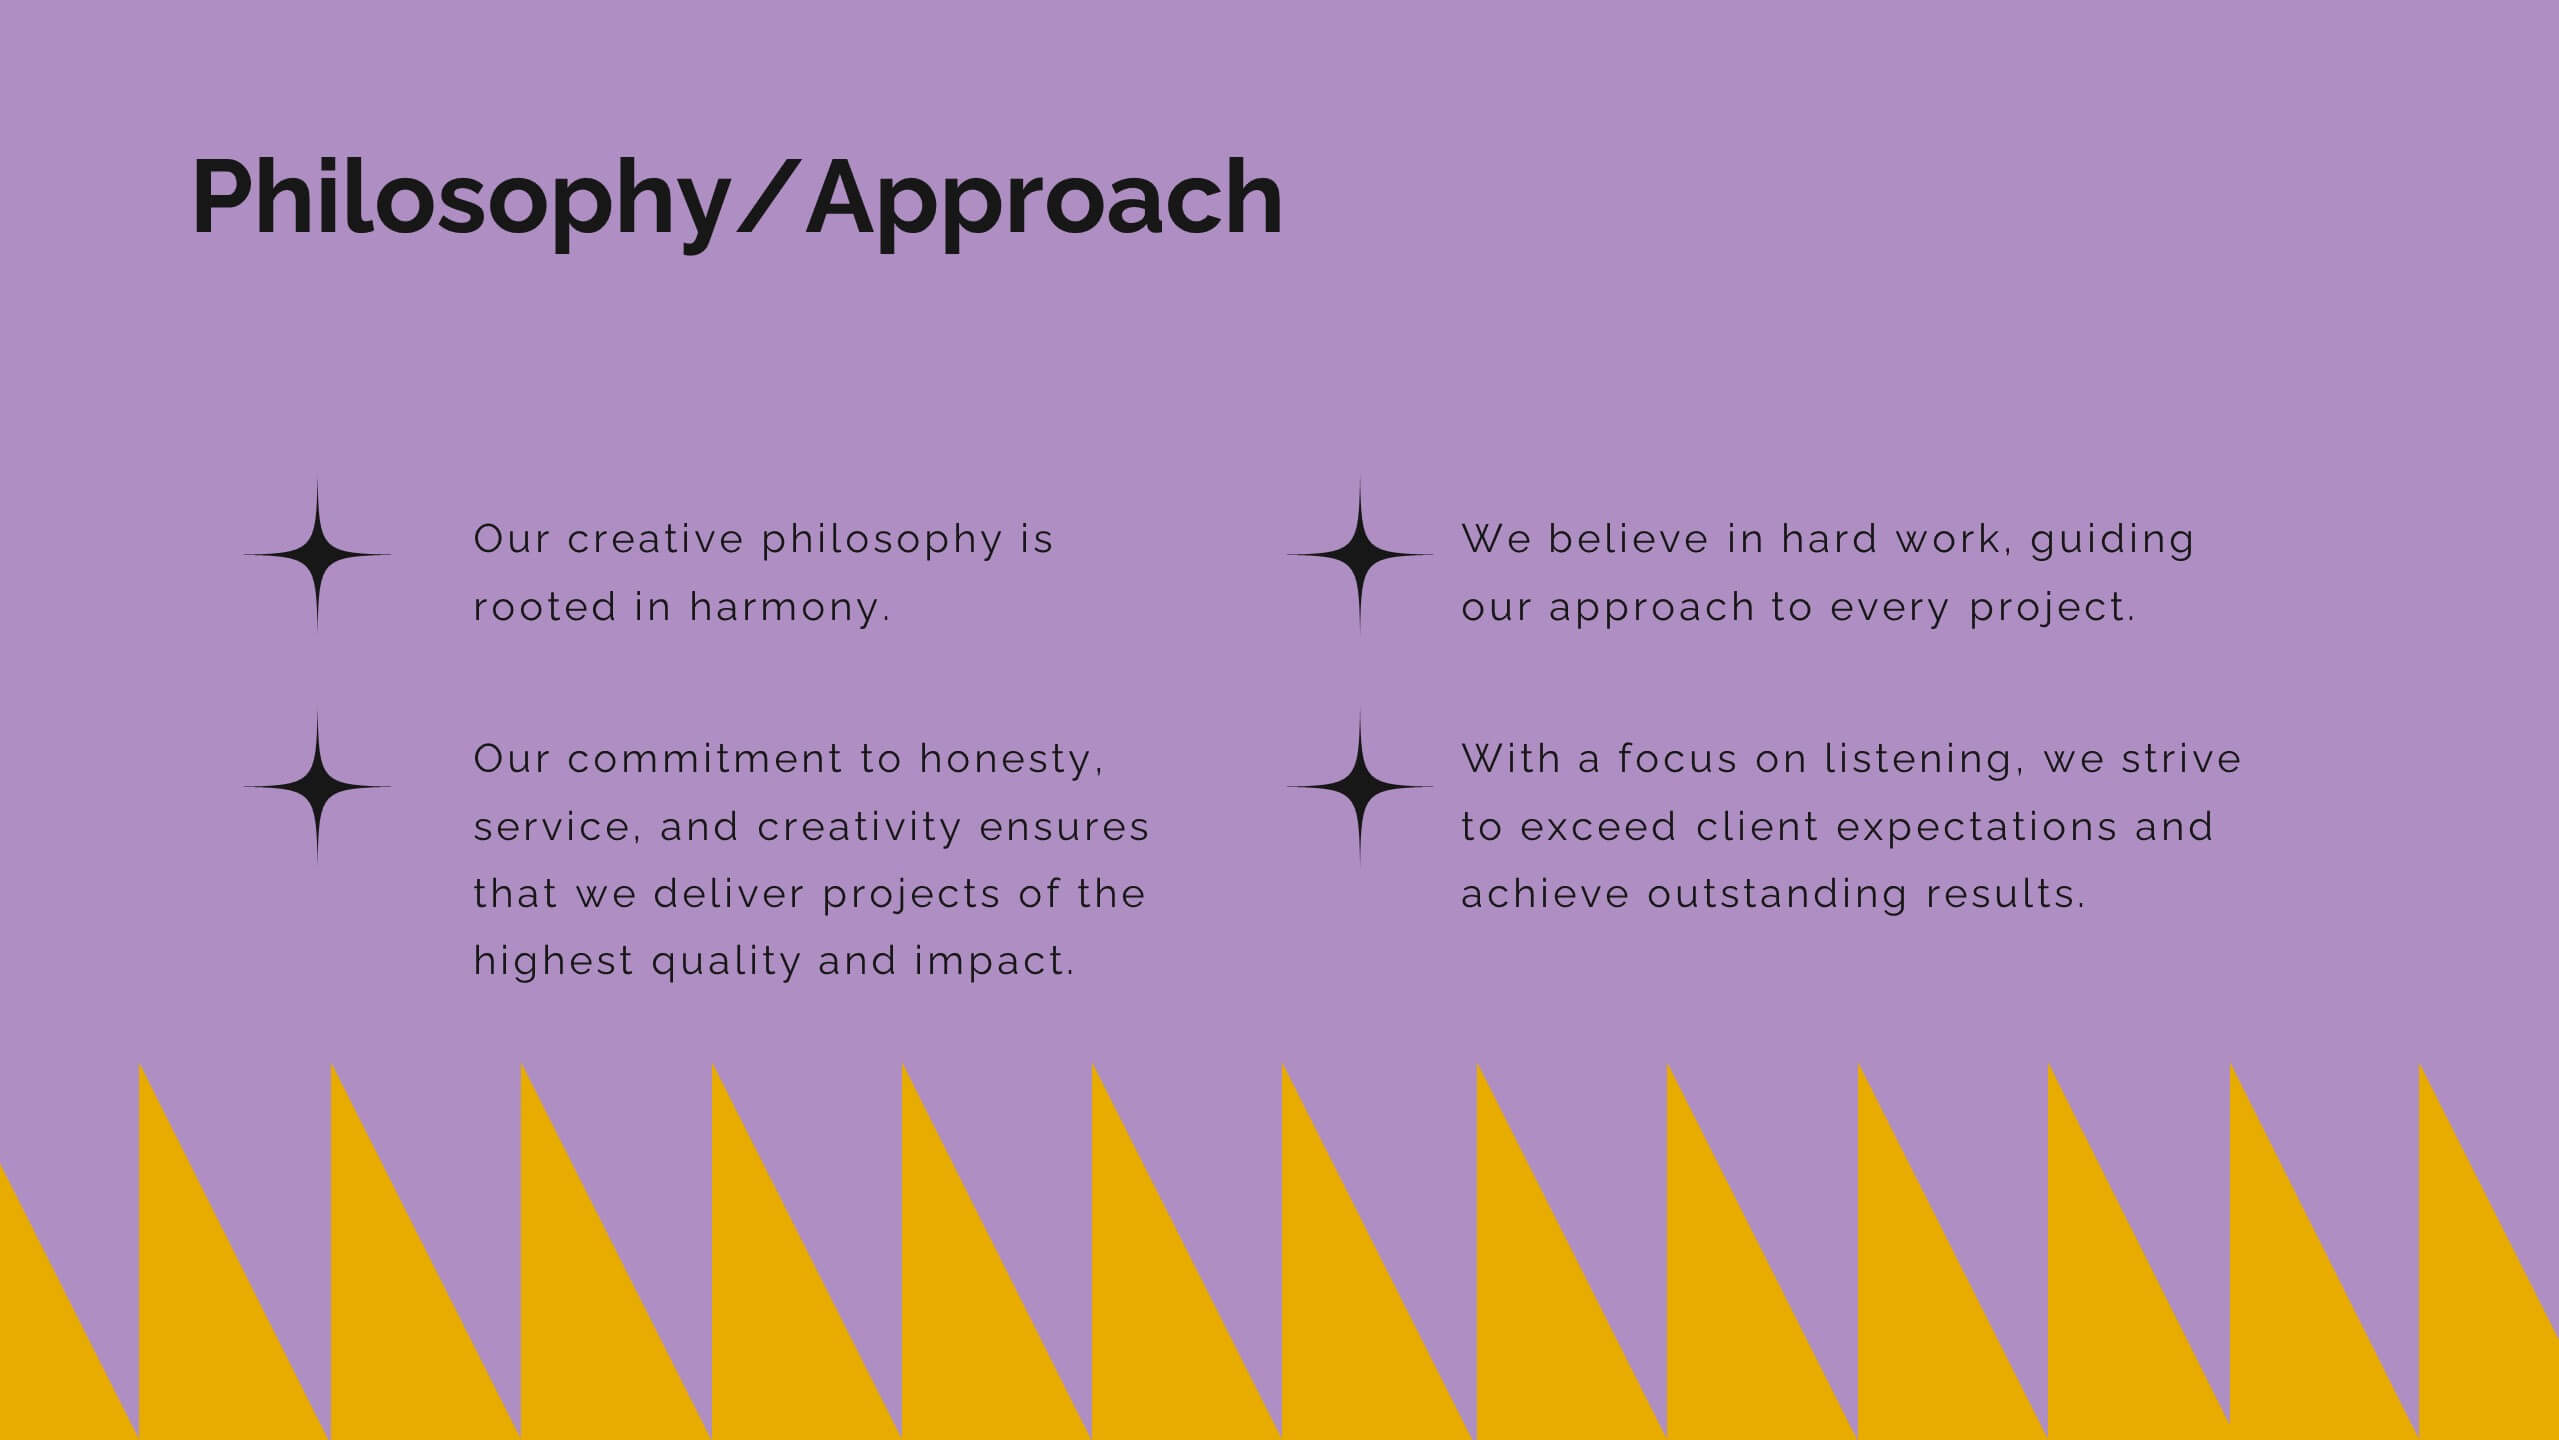
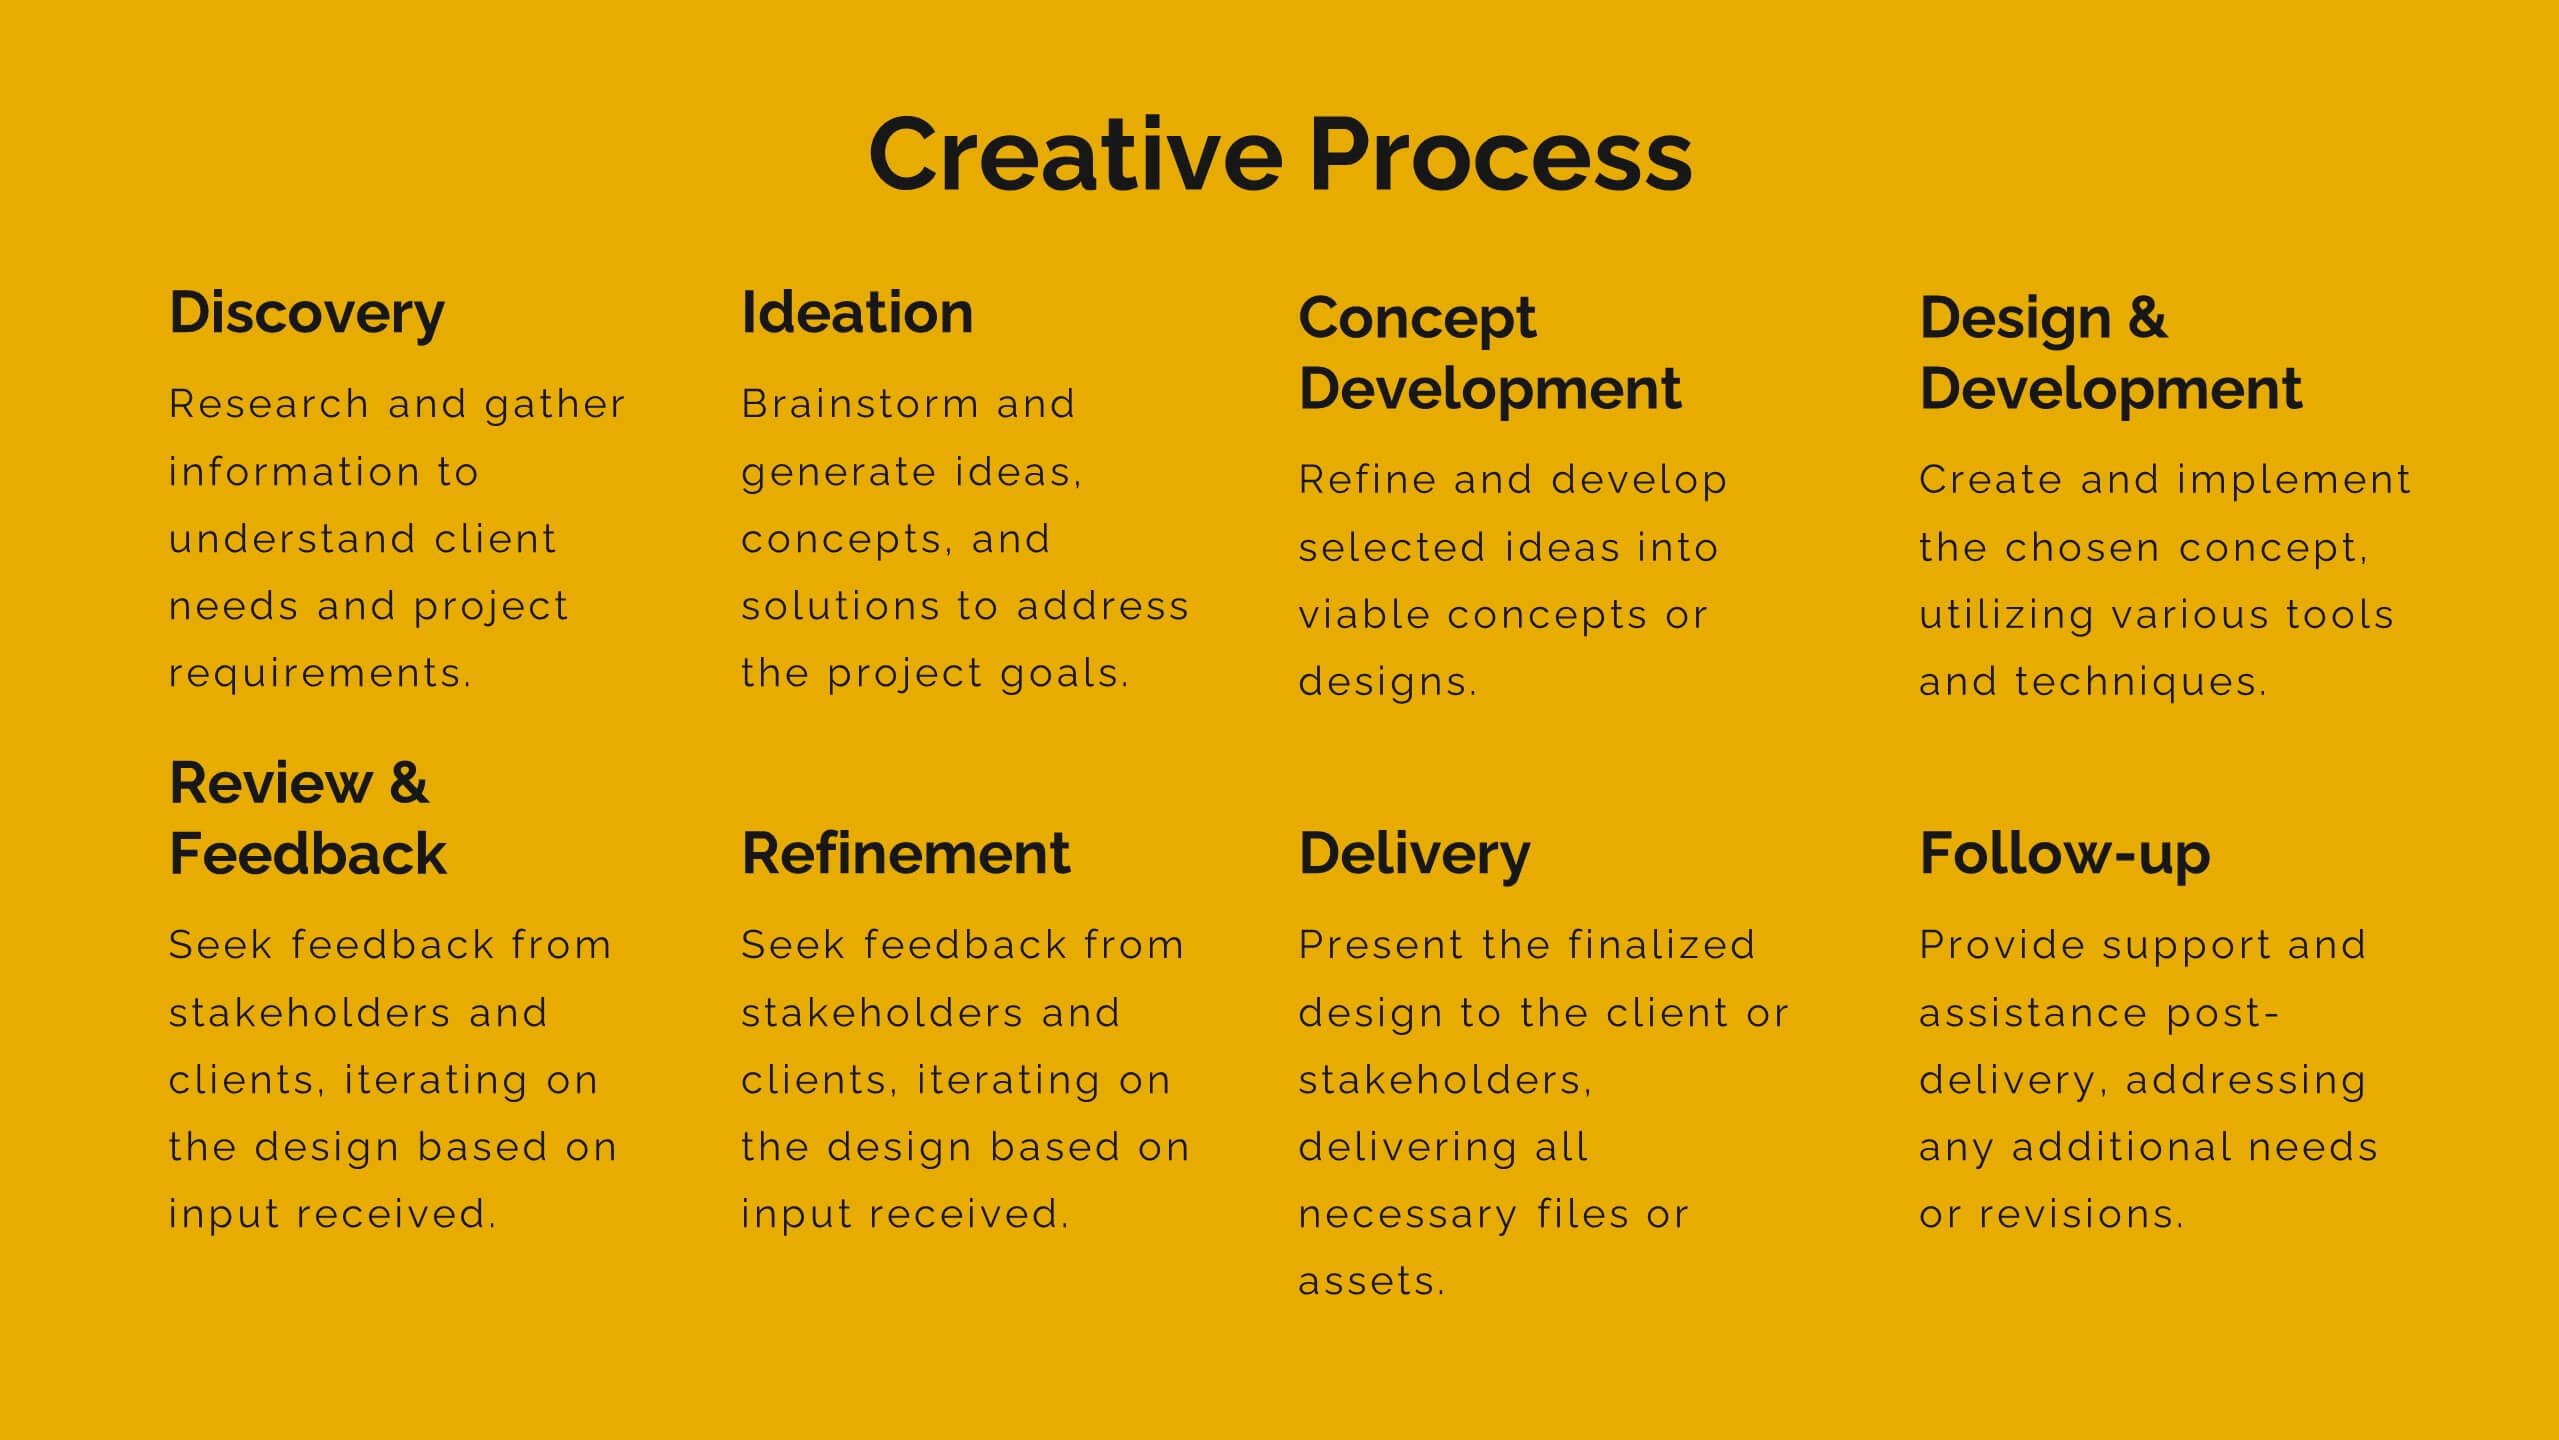
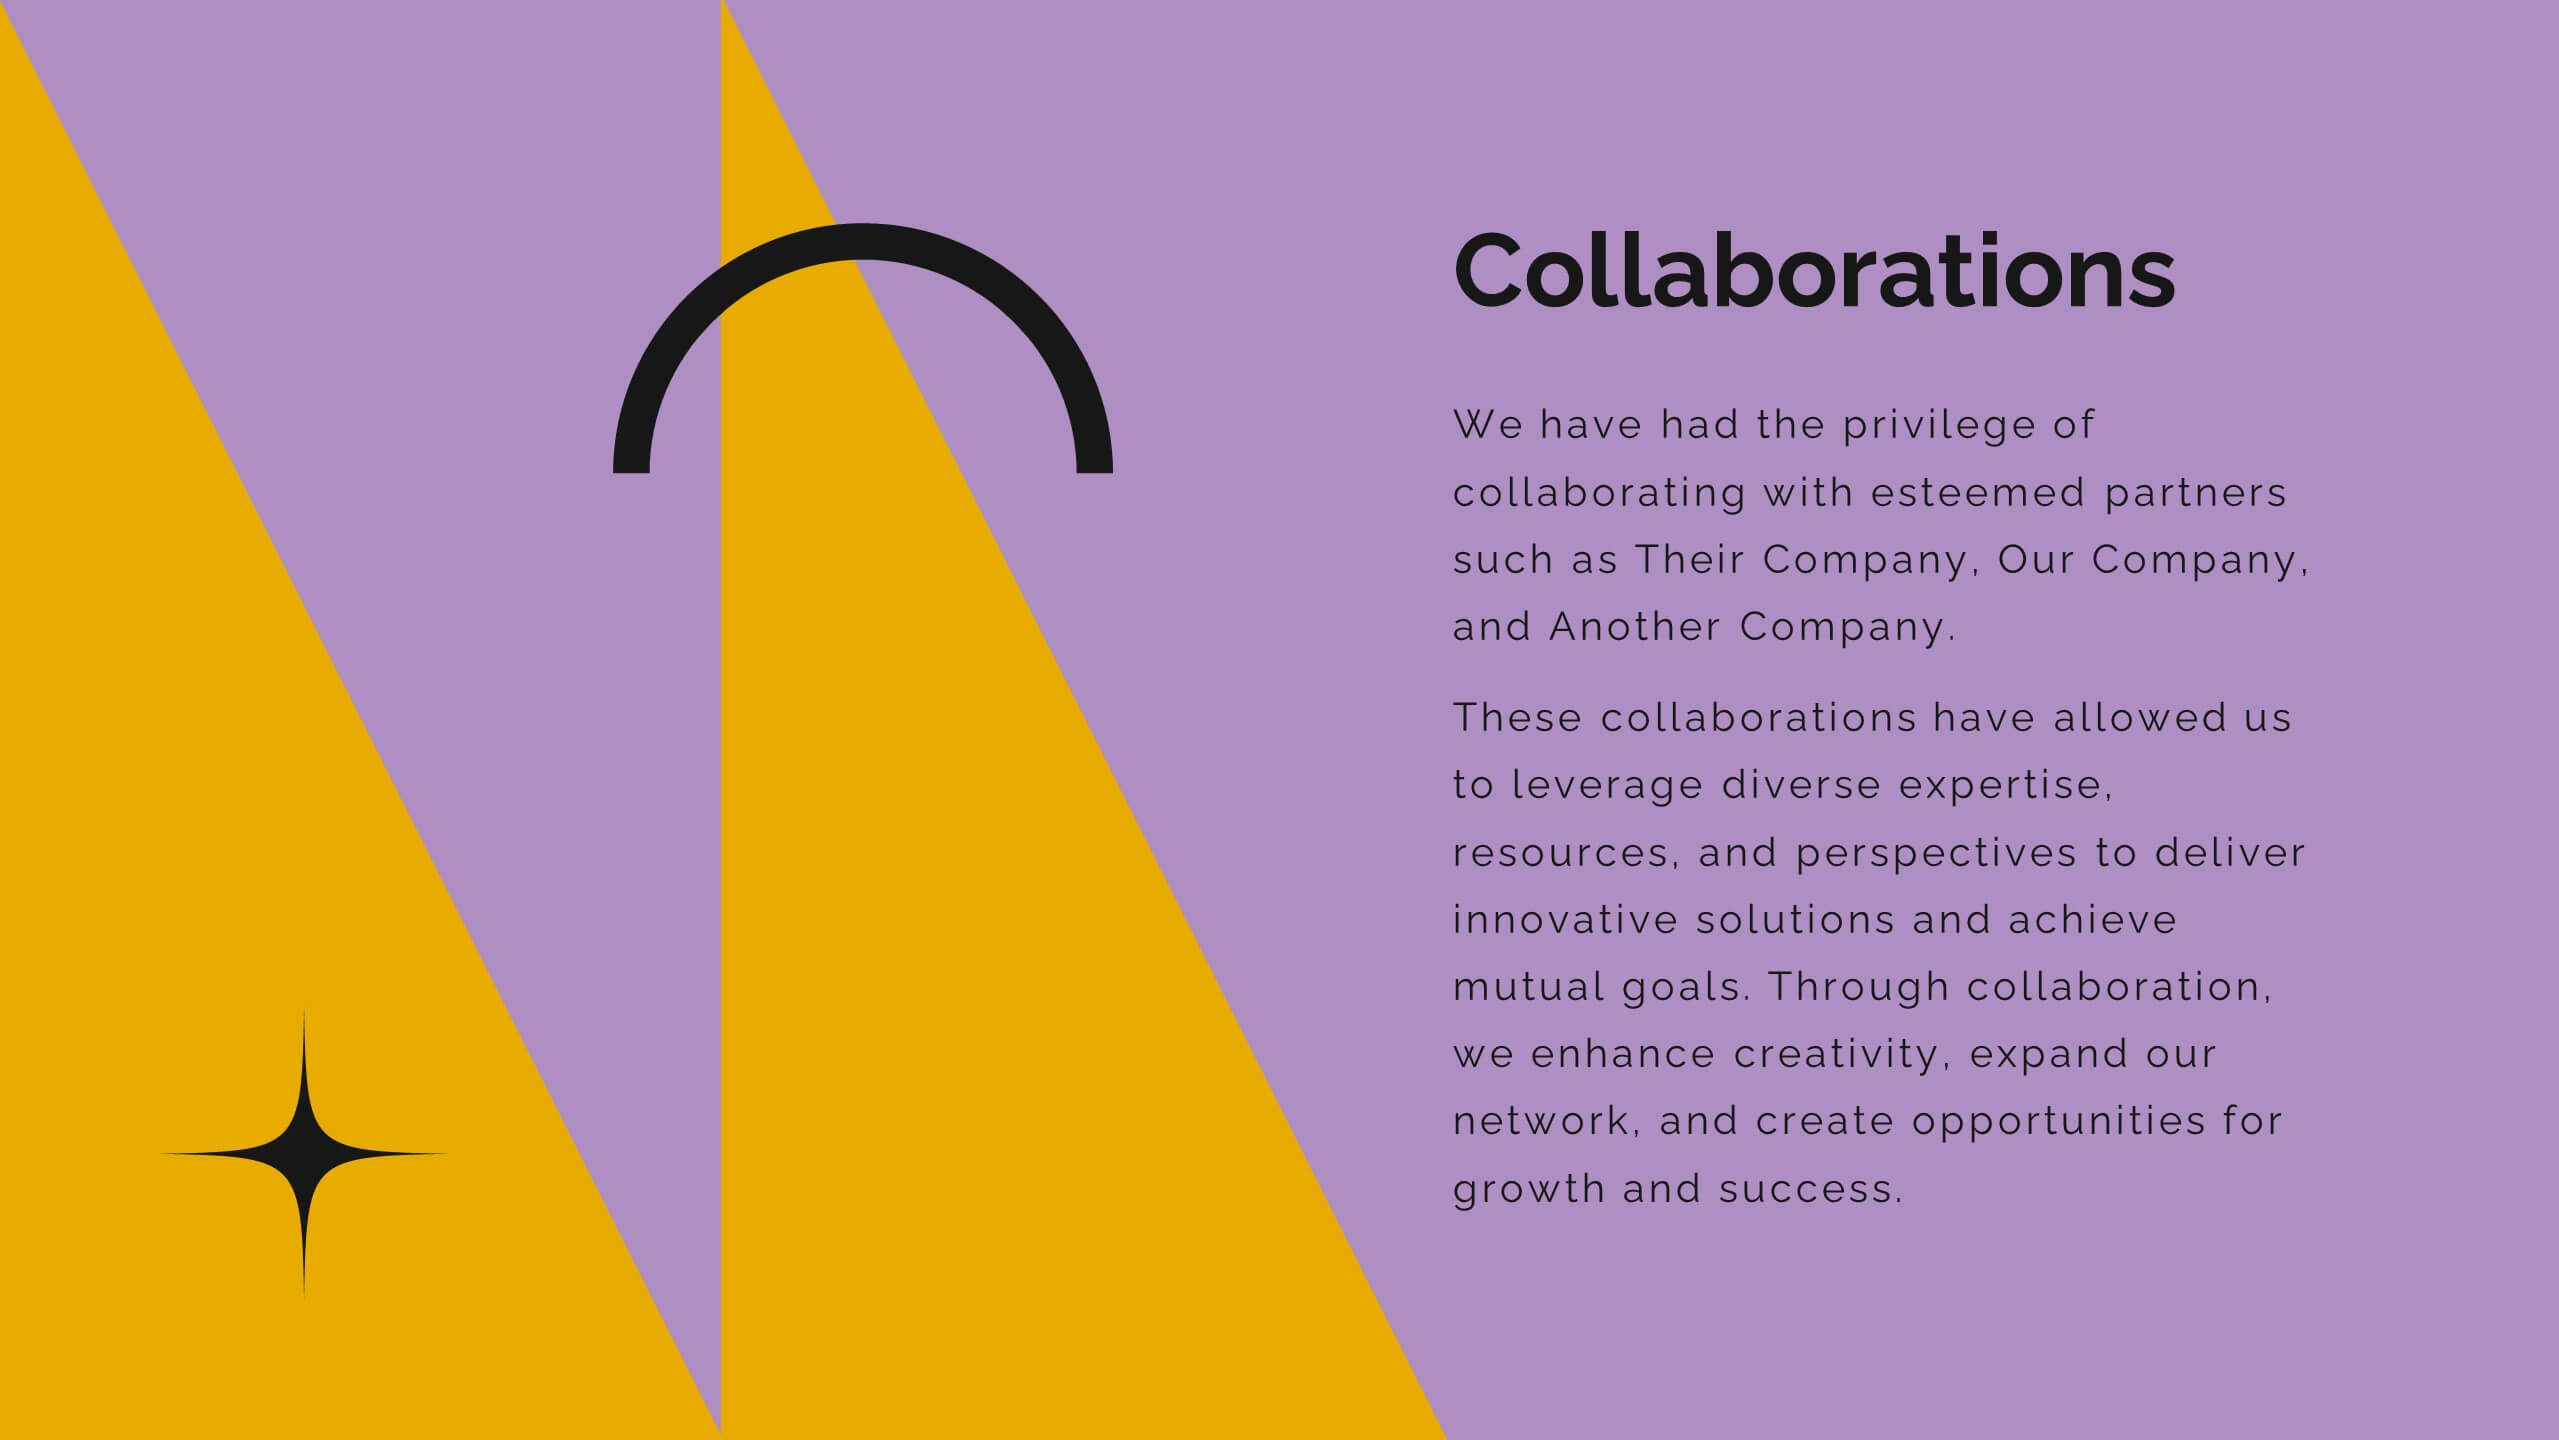
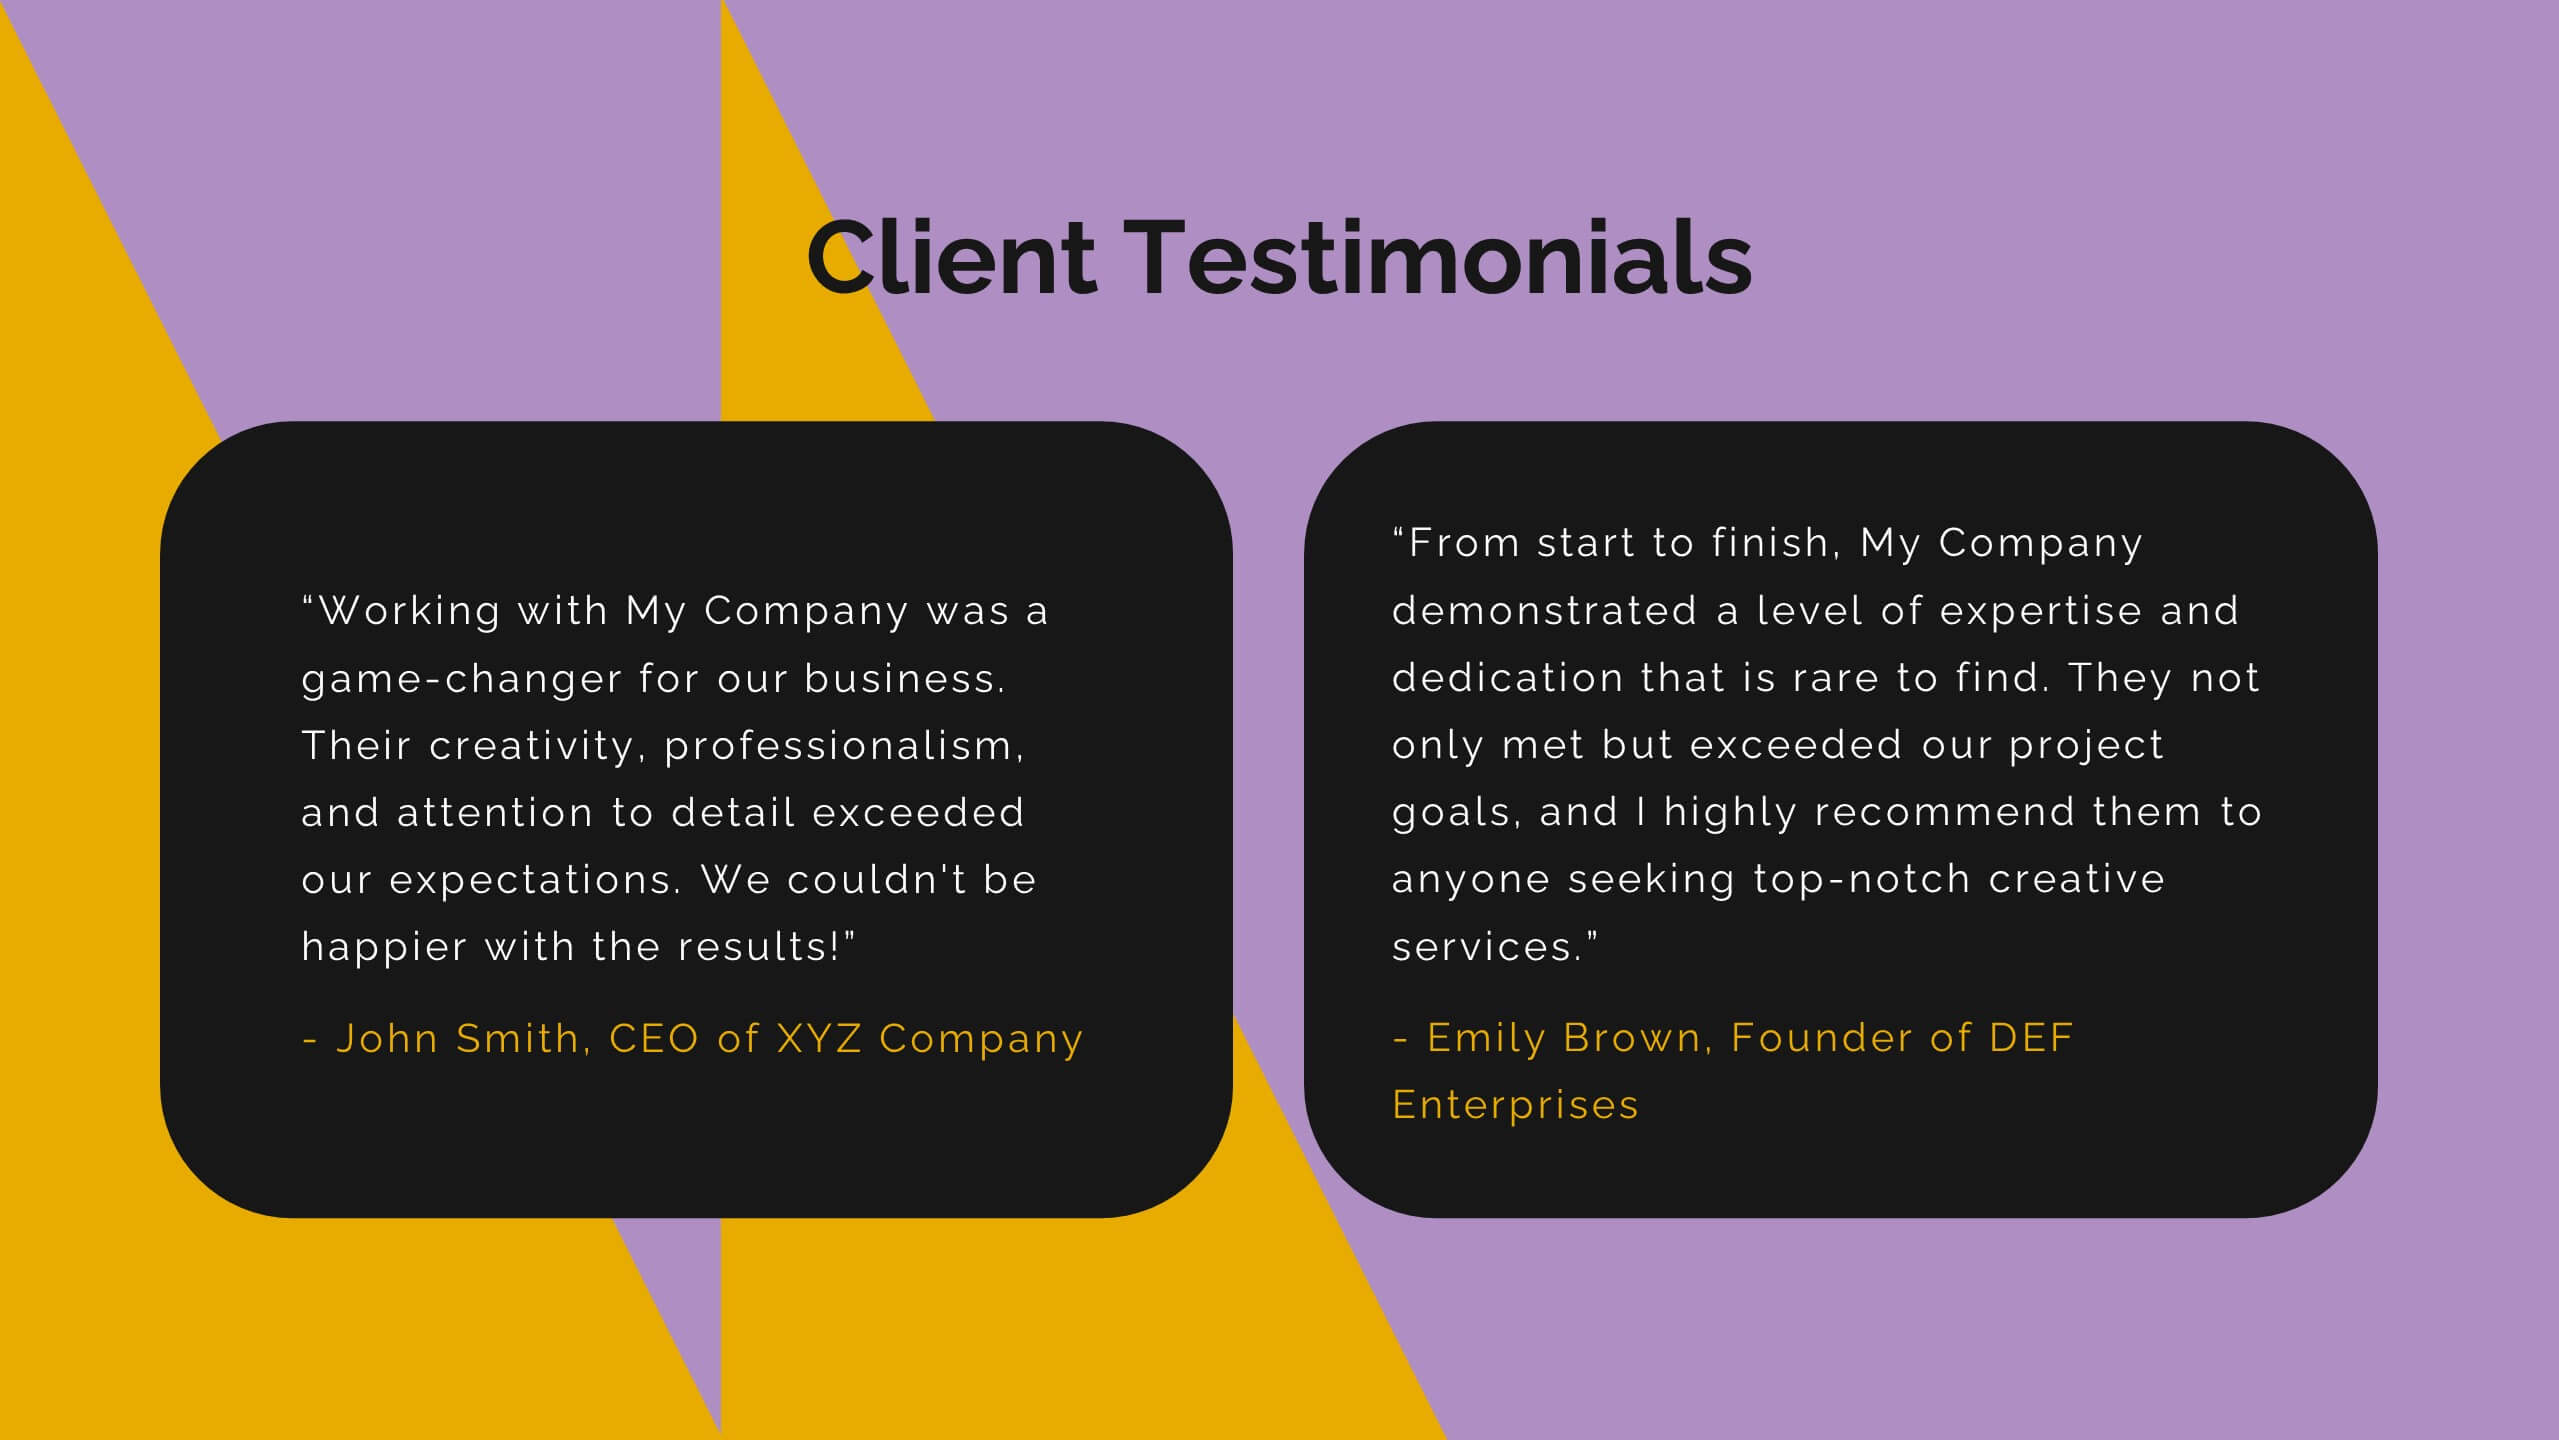
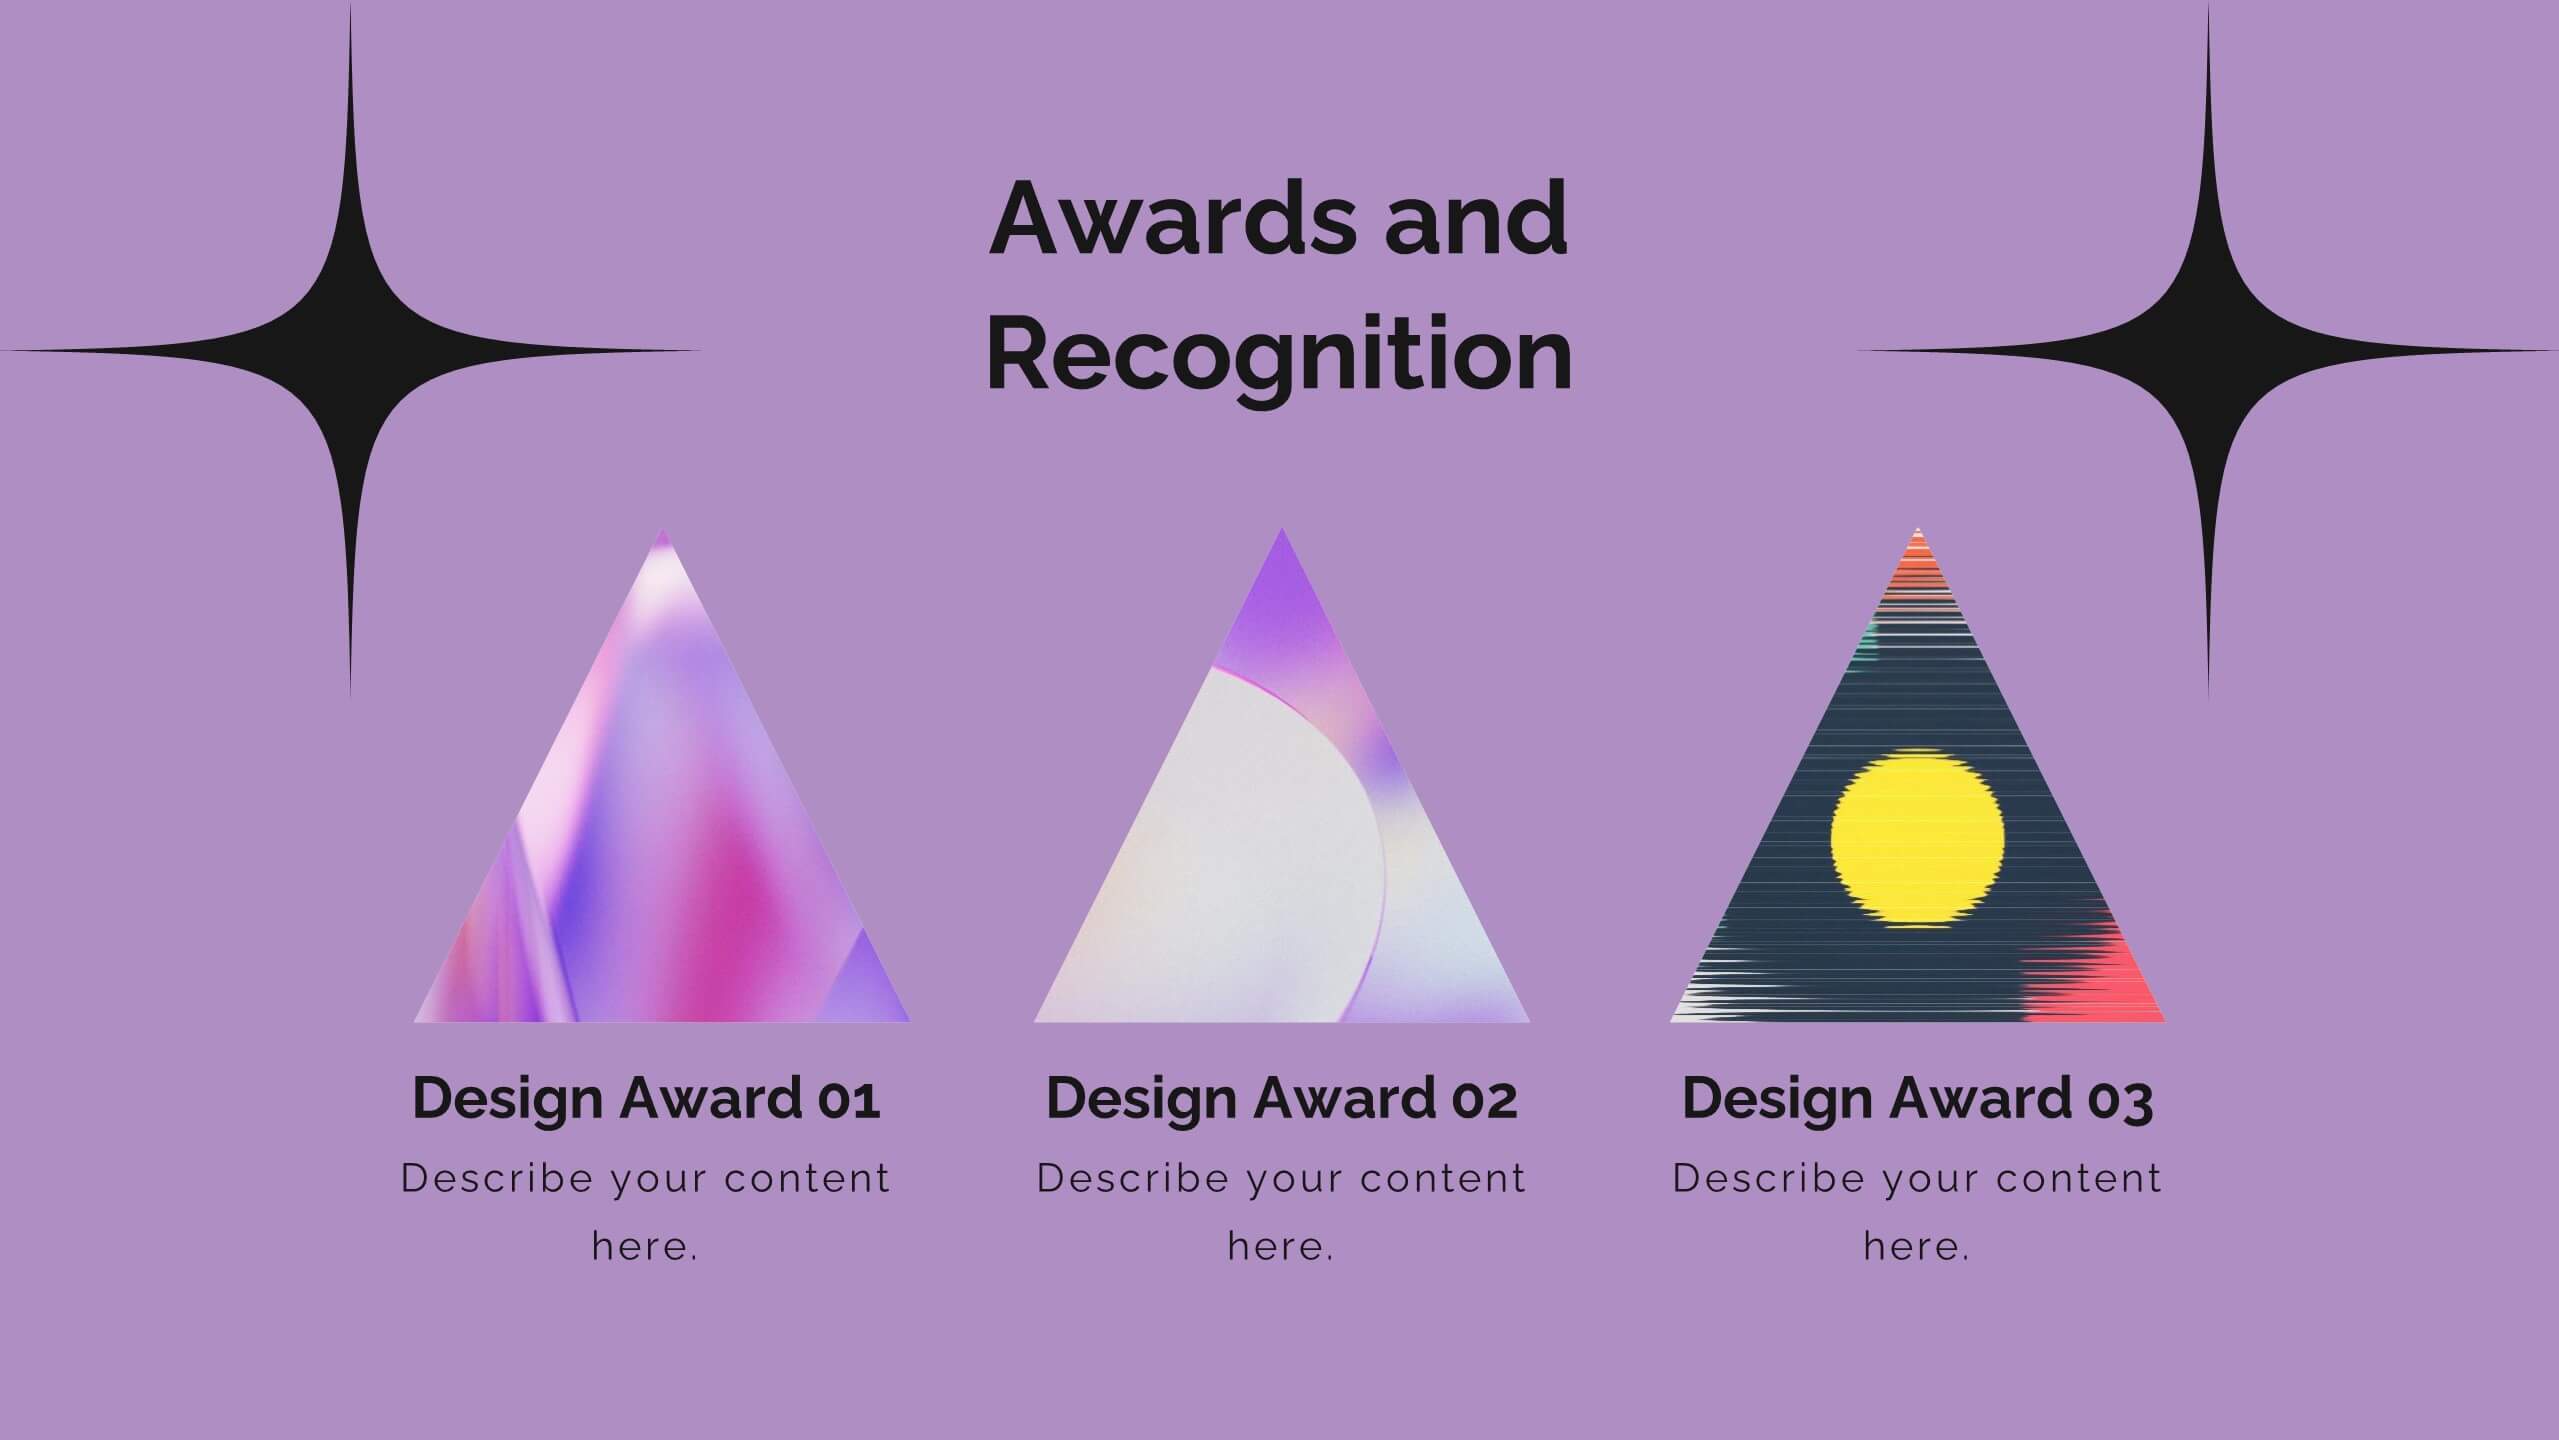
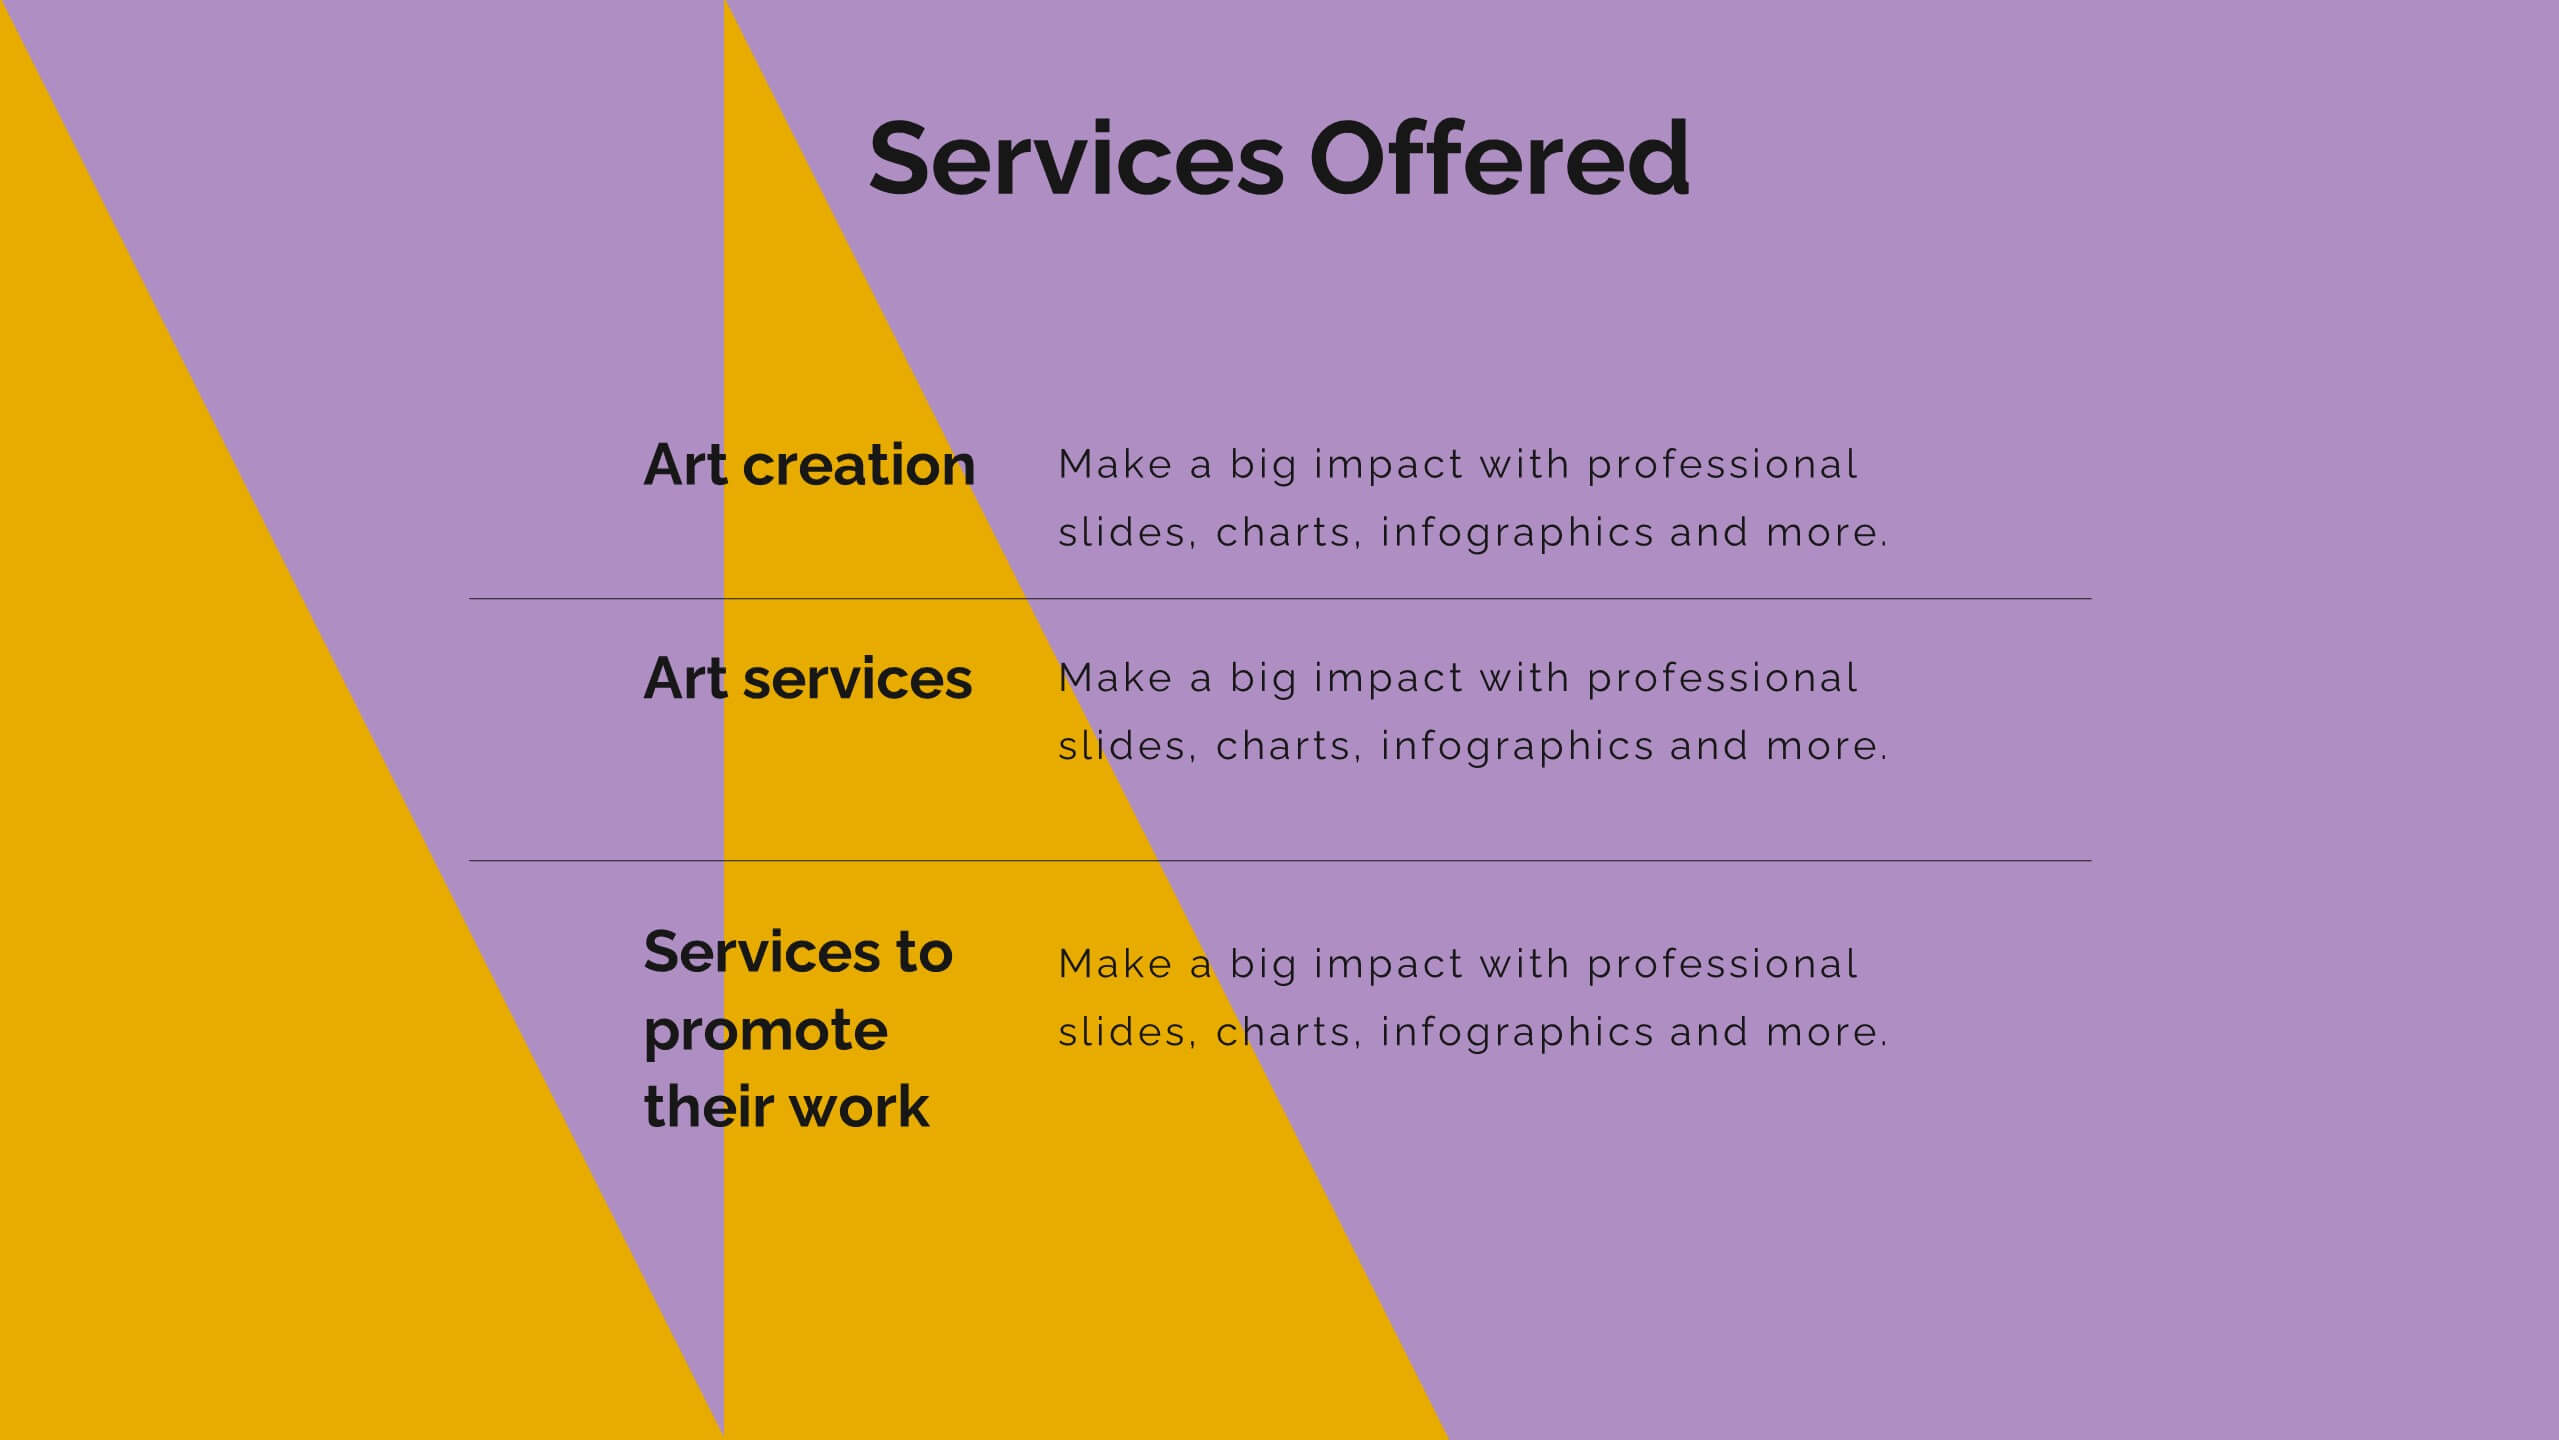
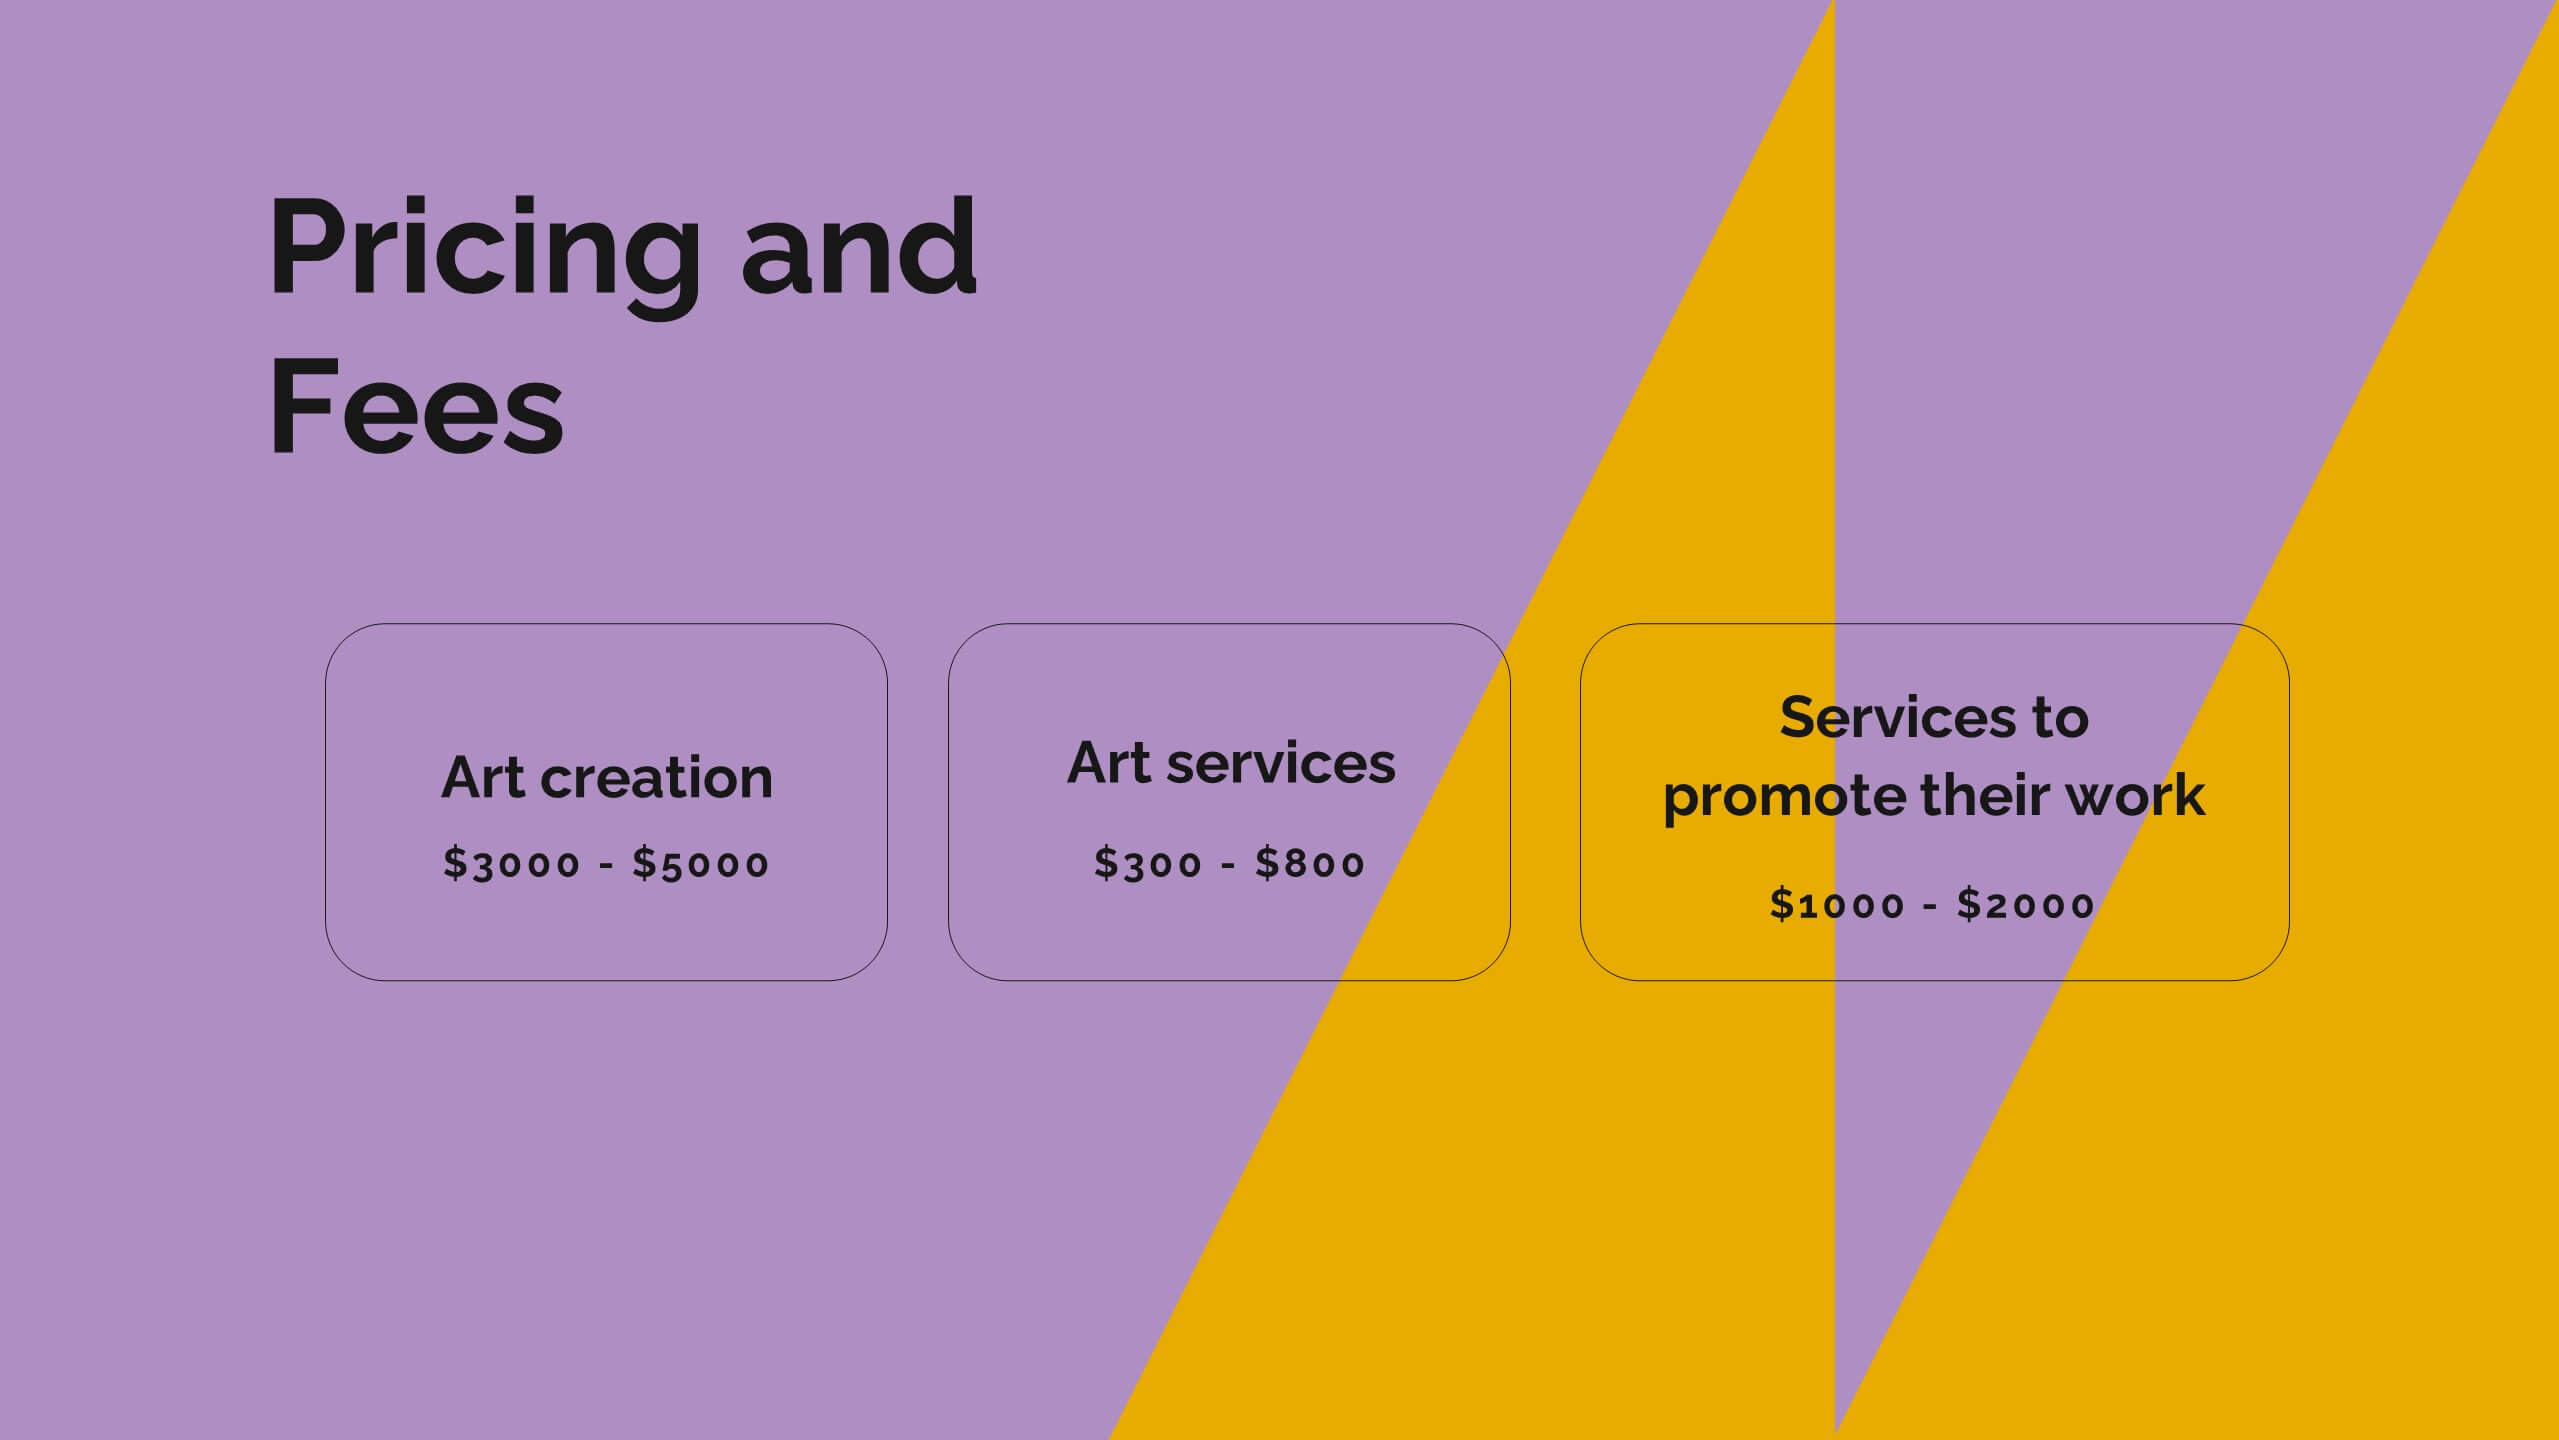
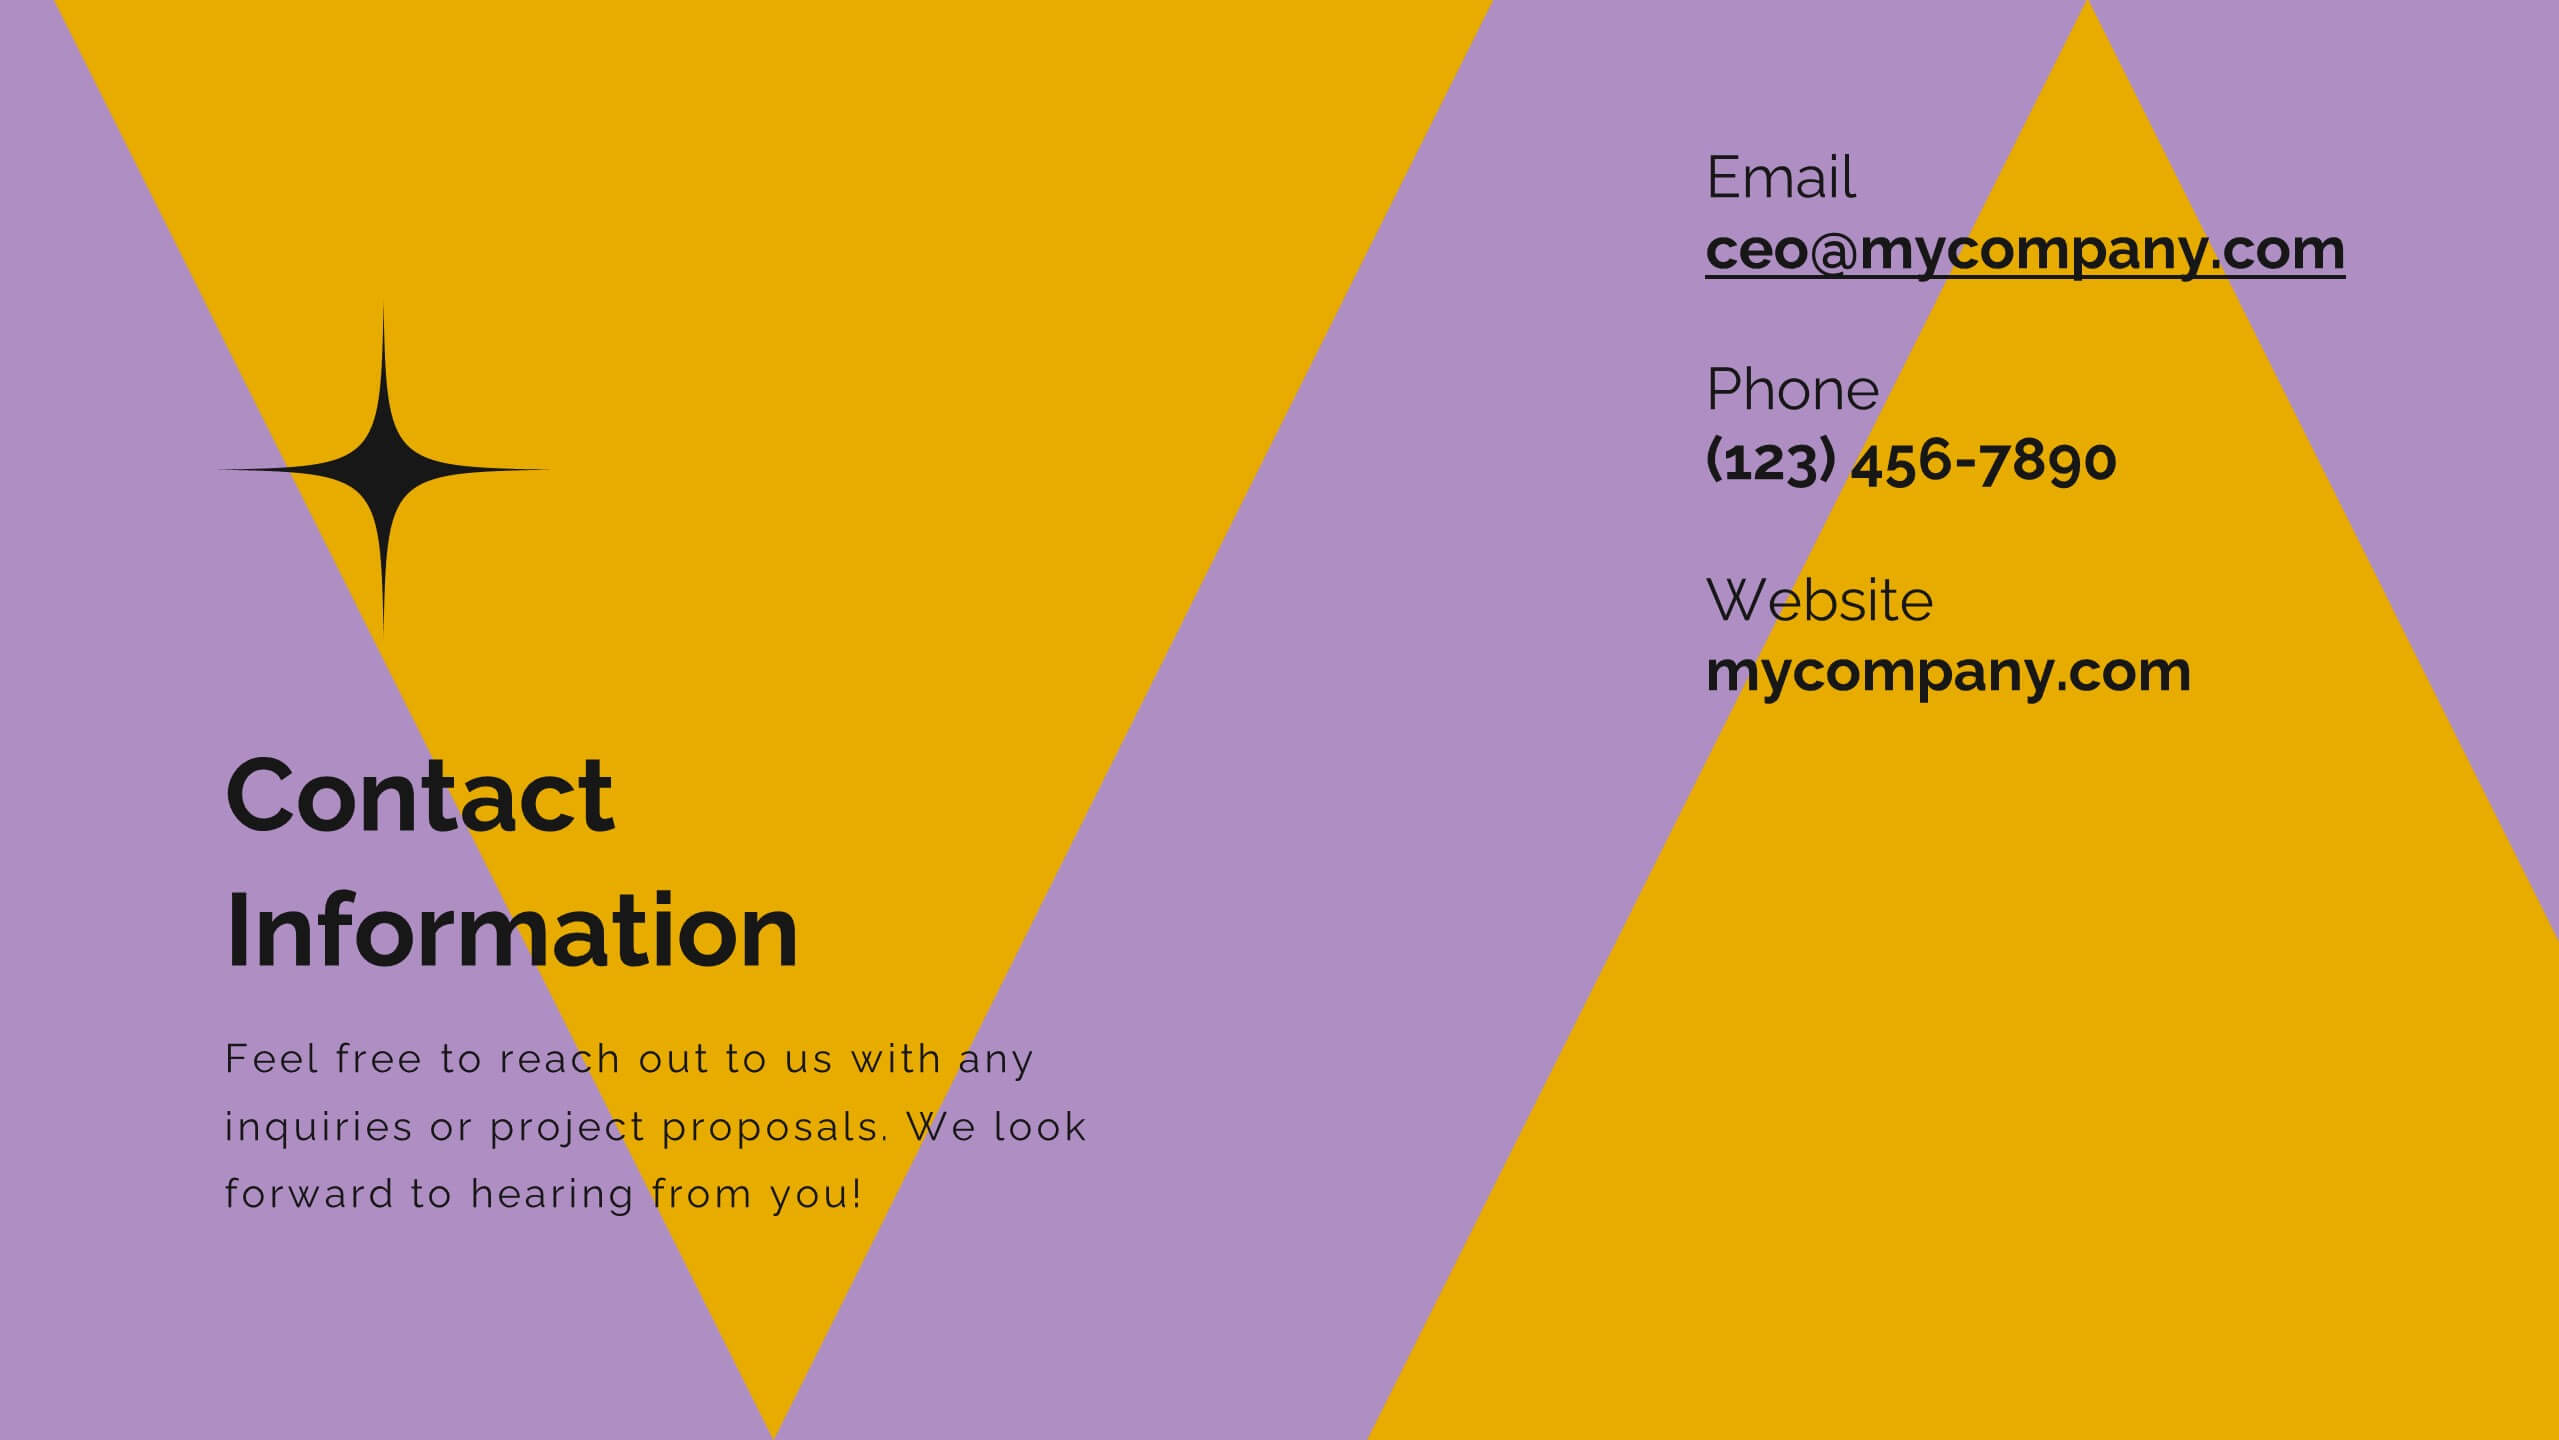
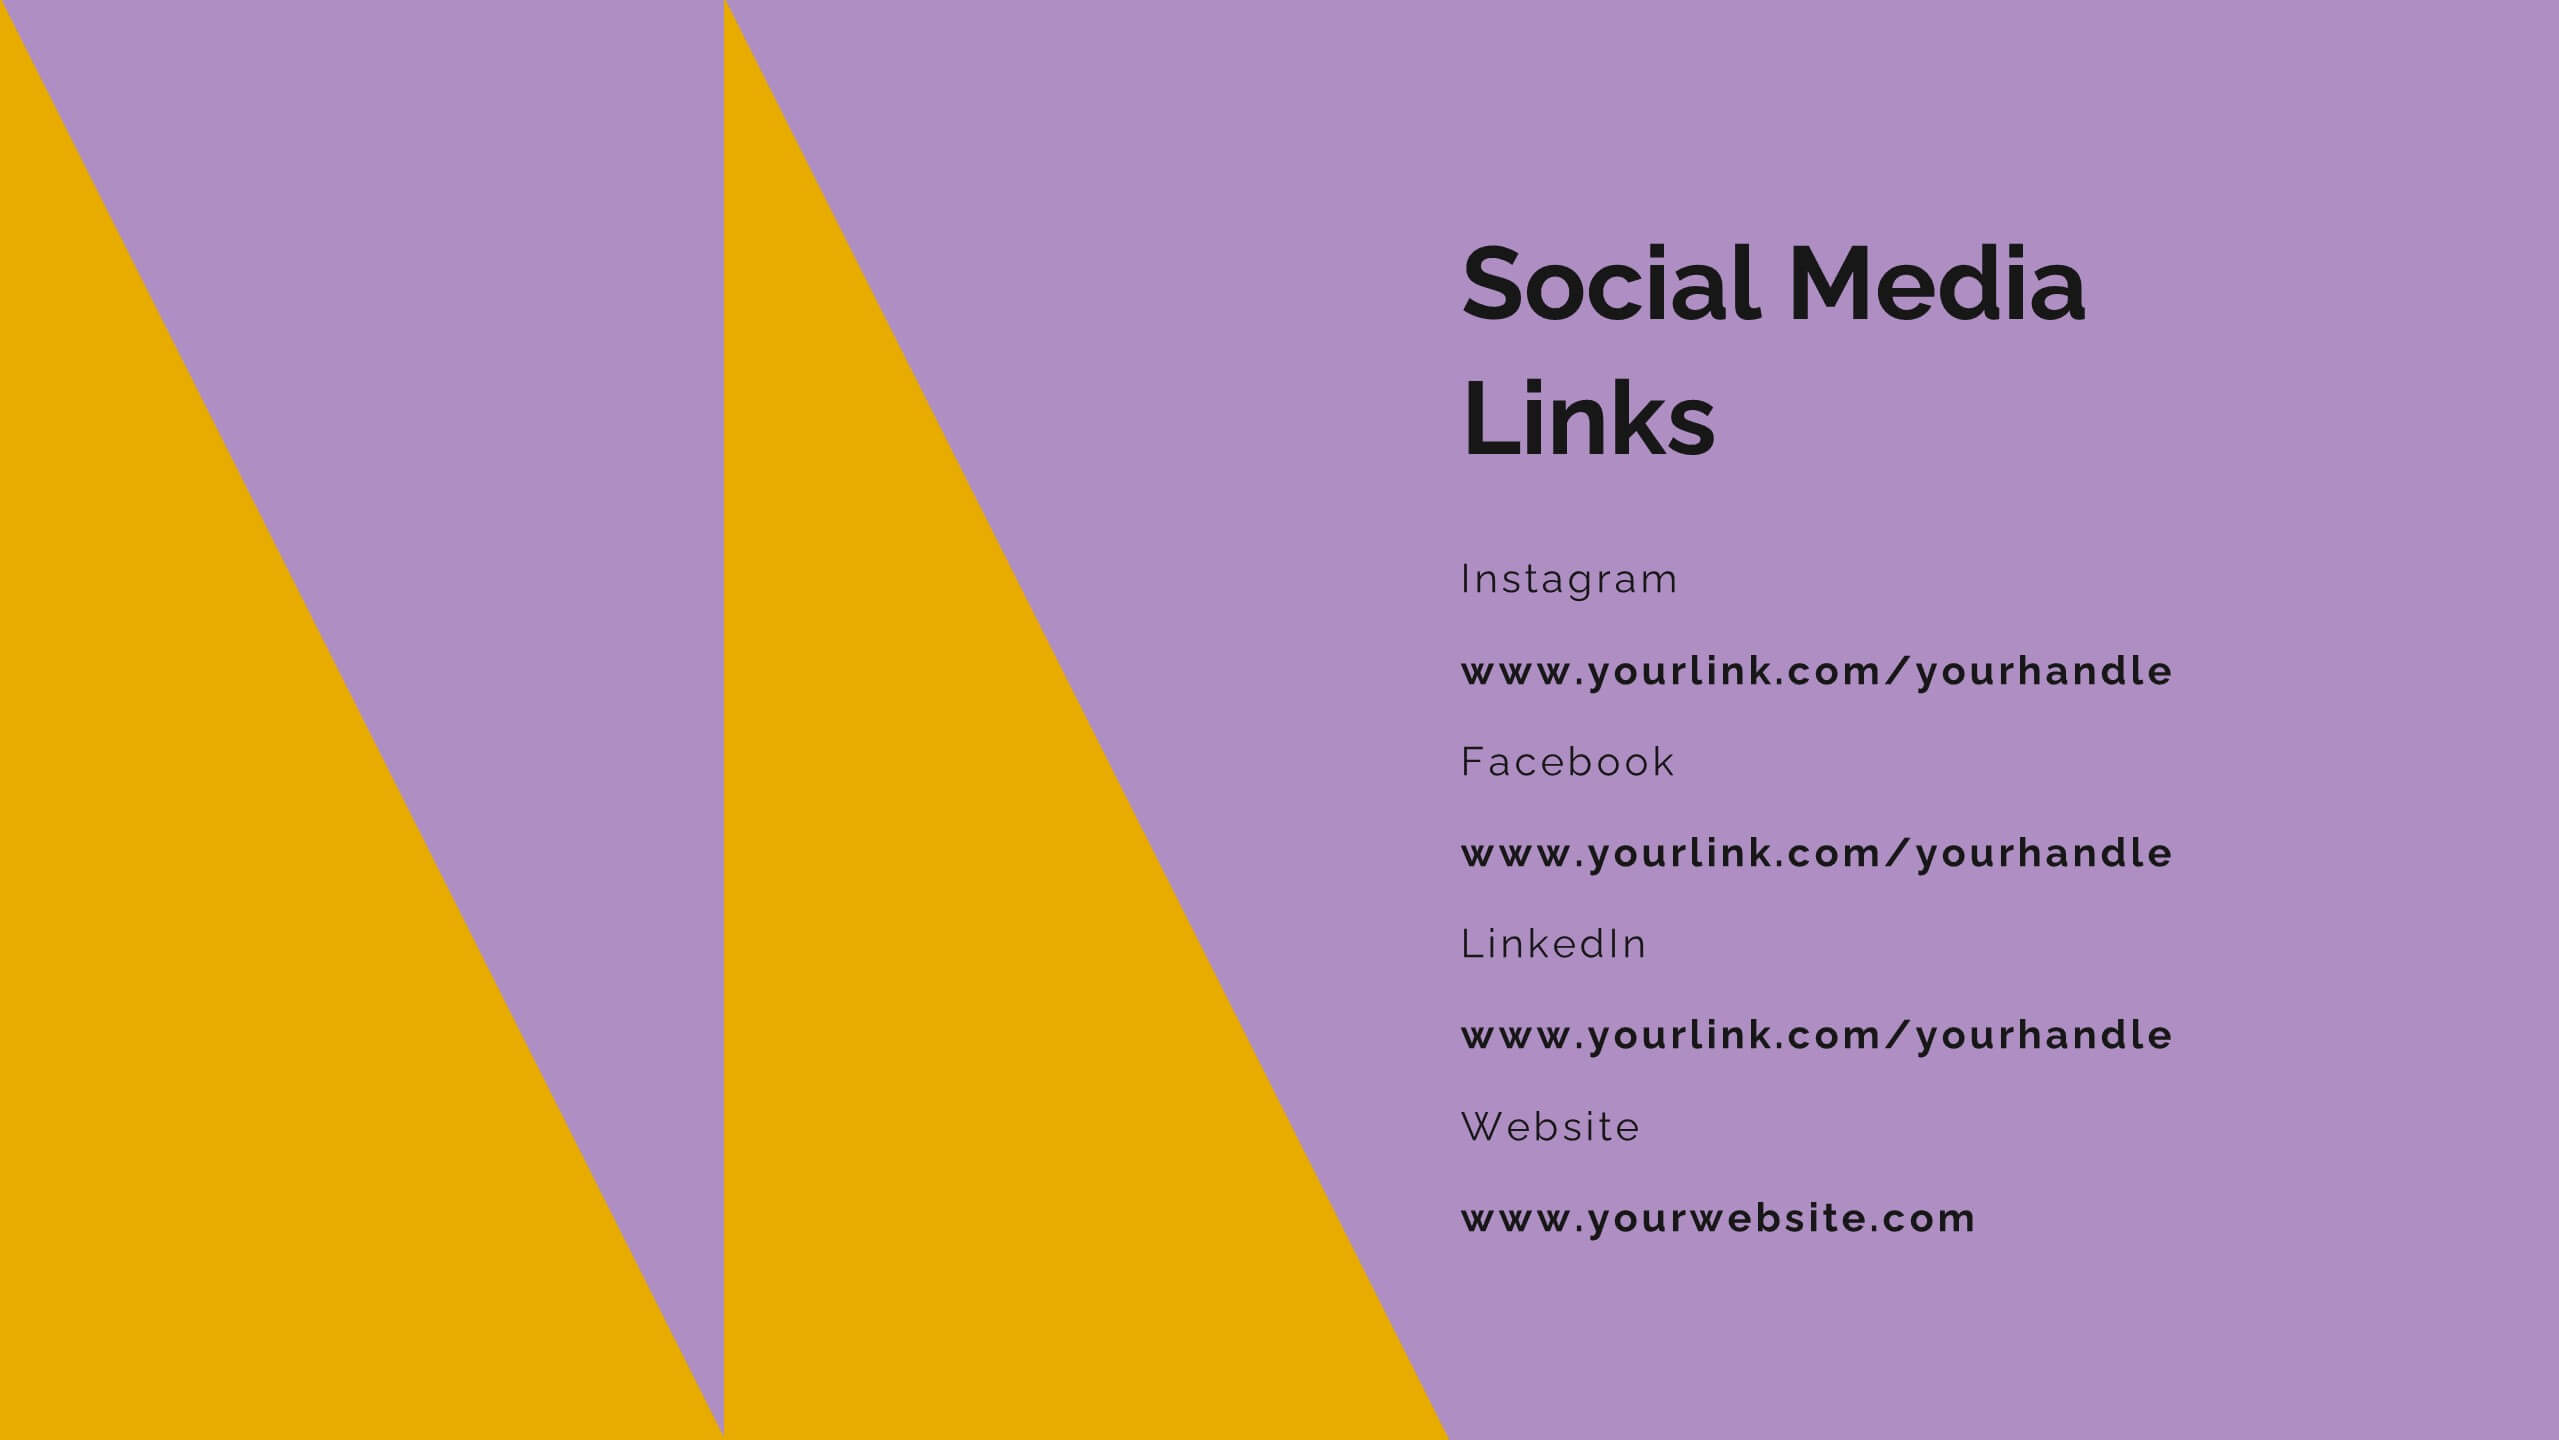
Vortex Artist Portfolio Template Presentation
Showcase your artistic brilliance with this eye-catching portfolio presentation template! Perfect for highlighting your projects, creative process, and awards, it features vibrant slides for your philosophy, collaborations, and client testimonials. Impress potential clients and collaborators with a stunning, well-organized portfolio. Compatible with PowerPoint, Keynote, and Google Slides for seamless presentations on any platform.


6 diapositivas
Problem Statement Infographic
Unleash the potential of your strategic presentations with our Infographic Templates, specifically designed to clarify and emphasize core challenges within any project or discussion. This collection features a versatile array of templates, from minimalistic single-point layouts to more detailed multi-section designs. Each template is crafted to help you articulate critical issues effectively, ensuring your audience grasps the essence of the discussion quickly. Customization is a breeze with options to adjust colors, fonts, and text, allowing you to align each slide with your corporate identity seamlessly. Ideal for use in PowerPoint, Google Slides, and Keynote, these templates are perfect for consultants, project managers, and business strategists looking to present problem statements in a clear, impactful manner. Equip yourself with these tools to drive understanding and foster problem-solving discussions in any professional setting.


6 diapositivas
Employee Feedback Survey Results Presentation
Showcase Employee Feedback Survey Results with a data-driven and professional layout designed for clear visualization and analysis. This PowerPoint, Keynote, and Google Slides-compatible template features stacked bar charts for easy trend comparison, helping you present workplace insights effectively. Fully customizable with editable text, colors, and labels, this template ensures a seamless and engaging presentation of employee feedback metrics.


6 diapositivas
Risk Management in Insurance Presentation
Ensure Stability and Security with this Risk Management in Insurance Presentation template. Featuring a shield-themed layout, this slide effectively communicates key risk assessment strategies, mitigation plans, and compliance measures in the insurance sector. Ideal for insurance professionals, financial risk analysts, and compliance teams, this fully editable template is compatible with PowerPoint, Keynote, and Google Slides, allowing you to tailor the content to your specific risk management needs.


3 diapositivas
Company Mission and Core Values Presentation
Present your brand’s purpose with clarity using this streamlined infographic slide. Divided into three distinct sections—Mission, Vision, and Values—each with icon support and editable text, this layout offers a clean and professional structure for showcasing your company’s guiding principles. Ideal for pitch decks, onboarding, and strategic planning presentations. Fully compatible with PowerPoint, Keynote, and Google Slides.


6 diapositivas
Next-Gen Wireless Solutions Overview Presentation
Give your wireless solutions pitch a sleek, professional edge with this futuristic globe-style layout. Perfect for tech-driven topics, this infographic highlights six key areas in a clear, visually engaging format. Fully customizable and easy to use in PowerPoint, Keynote, and Google Slides—ideal for product overviews, innovation briefings, or strategy updates.


12 diapositivas
SMART Goal Setting Presentation
Achieve clarity and focus with this SMART Goal Setting Presentation template. Featuring a visually engaging target and color-coded SMART framework, this slide helps break down objectives into Specific, Measurable, Attainable, Relevant, and Timely components. Perfect for business planning, project management, and personal development. Compatible with PowerPoint, Keynote, and Google Slides.


6 diapositivas
Creating Effective Buyer Persona Strategies Presentation
Present your audience research with clarity using this buyer persona strategy slide. Designed with a radial layout of five icons leading to a central profile, this template helps communicate key traits, behaviors, and preferences. Ideal for marketing teams, branding workshops, and product strategy sessions. Easily customizable in PowerPoint, Keynote, and Google Slides.


6 diapositivas
SEO Consulting Infographics
The "SEO Consulting" infographic template is designed for PowerPoint, Keynote, and Google Slides, making it a valuable resource for SEO consultants, digital marketing professionals, and business owners. This template is crafted to effectively communicate the essentials of SEO in a professional and engaging manner. Featuring key elements of SEO such as optimization strategies, keyword research, and website traffic analysis, the template is structured to simplify the complex aspects of SEO. This makes it an ideal tool for presentations aimed at educating clients or team members about the nuances of search engine optimization and its impact on digital marketing. The design of the template is modern and business-oriented, with a color scheme that includes shades of blue, green, and gray. This professional yet engaging aesthetic ensures that the presentation is not only informative but also visually appealing. Whether used in client meetings, training sessions, or marketing seminars, this template is sure to enhance the understanding and appeal of SEO consulting services.


7 diapositivas
Customer Journey Stages Infographic Presentation
A Customer Journey consists of a series of interactions that occur over time between your company and the customer. Our template uses a colorful color scheme and style to present a customer journey. This communicates how the customer moves through their process. The layout allows you to customize each text box with your own text. The stages are color coded, making it easy for you to identify them. This template is designed to provide the most up-to-date research and analytical data so you can effectively engage and connect with your audience. Capture your customer's journey with this template!


4 diapositivas
Performance Gap Analysis Diagram Presentation
Bridge the gap between current and desired performance with this strategic diagram. Featuring a split-path layout and central bridge graphic, this template helps visualize obstacles, goals, and solutions. Ideal for strategy teams, consultants, and analysts. Fully editable in PowerPoint, Keynote, and Google Slides—clear, impactful, and easy to customize.