


Características


¿Tienes alguna pregunta?
Recomendar


7 diapositivas
Pricing Infographic Presentation Template
Featuring our Pricing Table template it is easy to use and has a design that will grab your visitors attention. This template includes a variety of elements such as data-driven charts and tables, product images, icons and text. This template is a simple yet very effective tool for making your resources, goods or services more sellable, made to present any number of topics or products. Present your numbers like a pro with this fully customizable template, and display your pricing table. This will help you create a great looking pricing table template, which will be perfect for any business!


5 diapositivas
Big Data Infrastructure Planning Presentation
Build your big data strategy step-by-step with this clean and visual planning template. Designed to map out the key gears of infrastructure—from hardware to storage and cloud integration—it’s a powerful tool for IT leaders and tech teams. Fully editable and works with PowerPoint, Keynote, and Google Slides.


6 diapositivas
Budget Allocation Strategy Presentation
Break down your budget plan with this clear and modern 6-point layout. Featuring a central money bag icon and segmented categories, this slide is perfect for financial strategy, departmental budgeting, or resource distribution. Fully editable in Canva, PowerPoint, or Google Slides for easy customization to match your brand.


4 diapositivas
Data Analytics Heat Map Presentation
Turn complex data into clear insights with this dynamic heat map template! Ideal for visualizing trends, risks, or performance metrics, this design enhances decision-making at a glance. With fully customizable elements, it simplifies data analysis for business, finance, or research. Compatible with PowerPoint, Keynote, and Google Slides for seamless use.


20 diapositivas
Waterfall Project Proposal Presentation
Get ready to impress with the Waterfall Project Proposal template! This visually striking and highly organized template is designed to help you communicate your project plan with clarity and impact. Start with an engaging introduction and company overview, then seamlessly guide your audience through the project summary, problem statement, and your proposed solutions. This template covers all essential aspects, including objectives, goals, scope of work, methodology, and a detailed timeline of milestones. With dedicated sections for pricing structure, team expertise, and client testimonials, you can showcase the strengths and reliability of your proposal. The template also includes slides for risk management, terms and conditions, and a clear next steps action plan. Perfect for any professional setting, this template is fully customizable and compatible with PowerPoint, Keynote, and Google Slides, ensuring that your proposal looks polished and professional every time.


6 diapositivas
Tiered Pricing Plan Layout Presentation
Clearly compare features across your service levels with this Tiered Pricing Plan Layout Presentation. Ideal for showcasing Basic, Regular, and Premium options in a side-by-side table with checkmarks and pricing. Great for SaaS, product subscriptions, or membership tiers. Fully editable in Canva, PowerPoint, Google Slides, and Keynote.


5 diapositivas
Role Assignment Matrix Framework Presentation
Simplify task delegation with the Role Assignment Matrix Framework Presentation. Ideal for defining roles and responsibilities in a clear, table-based layout, this matrix helps organize who does what across departments or project phases. Perfect for RACI charts or team alignment. Fully editable in PowerPoint, Google Slides, Keynote, and Canva.


5 diapositivas
Business Activity Rotation Cycle Presentation
Showcase continuous workflows with the Business Activity Rotation Cycle Presentation. Ideal for operations, planning, and strategy meetings, this template visualizes multi-phase cycles with clean, editable layouts. Use it to outline repeated business functions, processes, or initiatives. Compatible with PowerPoint, Keynote, and Google Slides—perfect for consultants, teams, and business professionals.


2 diapositivas
Stylish Title Cover Presentation for Reports Presentation
Set the tone with a title slide that means business—without being boring. This stylish cover layout gives your report presentations a polished, modern look while keeping the focus clear and professional. Ideal for executive updates or client-facing decks, it’s fully editable and works perfectly in PowerPoint, Keynote, and Google Slides.


6 diapositivas
Natural Food Infographics
The "Natural Food" infographic template is a fresh and appealing visual tool, meticulously designed for PowerPoint, Keynote, and Google Slides. This template is an excellent resource for nutritionists, food bloggers, and organic food marketers looking to present the benefits, sources, and variety of natural foods in an engaging manner. This template vividly showcases the spectrum of natural foods, including fruits, vegetables, grains, and proteins, emphasizing their health benefits, nutritional values, and sustainable sourcing. Its layout is perfect for educating audiences about healthy eating habits, organic farming, and the positive environmental impact of choosing natural foods. The design is as refreshing as the topic it represents, with a color scheme that is vibrant and earthy. This not only makes the presentation visually enticing but also resonates with the themes of health, vitality, and environmental consciousness. Whether used in a workshop, a marketing campaign, or an educational seminar, this template ensures that the wholesome goodness of "Natural Food" is presented in a visually stunning, informative, and appetizing manner.


7 diapositivas
Work From Home Jobs Infographic Presentation
Working from home provides businesses with increased flexibility and can help ensure continuity of operations during times of disruption. This template is a great way to create a infographic about work from home jobs, or if you want to market your own work at home business. This template is easy to customize and full of useful design elements and tools that make it very easy to create stunning presentations. It includes a title slide with vibrant background colors for each section and a clean layout design. This template will help you make your own unique presentation in just minutes!


5 diapositivas
Medical Anatomy Chart Slide Presentation
Present body systems or organ-related topics with this anatomy chart slide. Designed with pinpoint callouts linked to a human silhouette, it helps explain up to four body parts or functions. Ideal for health, biology, or patient education presentations. Fully editable in PowerPoint, Keynote, or Google Slides for clean, visual storytelling.


4 diapositivas
3-Level Tree Chart Presentation
Grow your ideas from concept to execution with this beautifully designed visual layout. Perfect for showcasing layered strategies, hierarchical processes, or business development stages, it balances clarity and creativity through a clean, tree-inspired design. Fully editable and compatible with PowerPoint, Keynote, and Google Slides for seamless professional use.


20 diapositivas
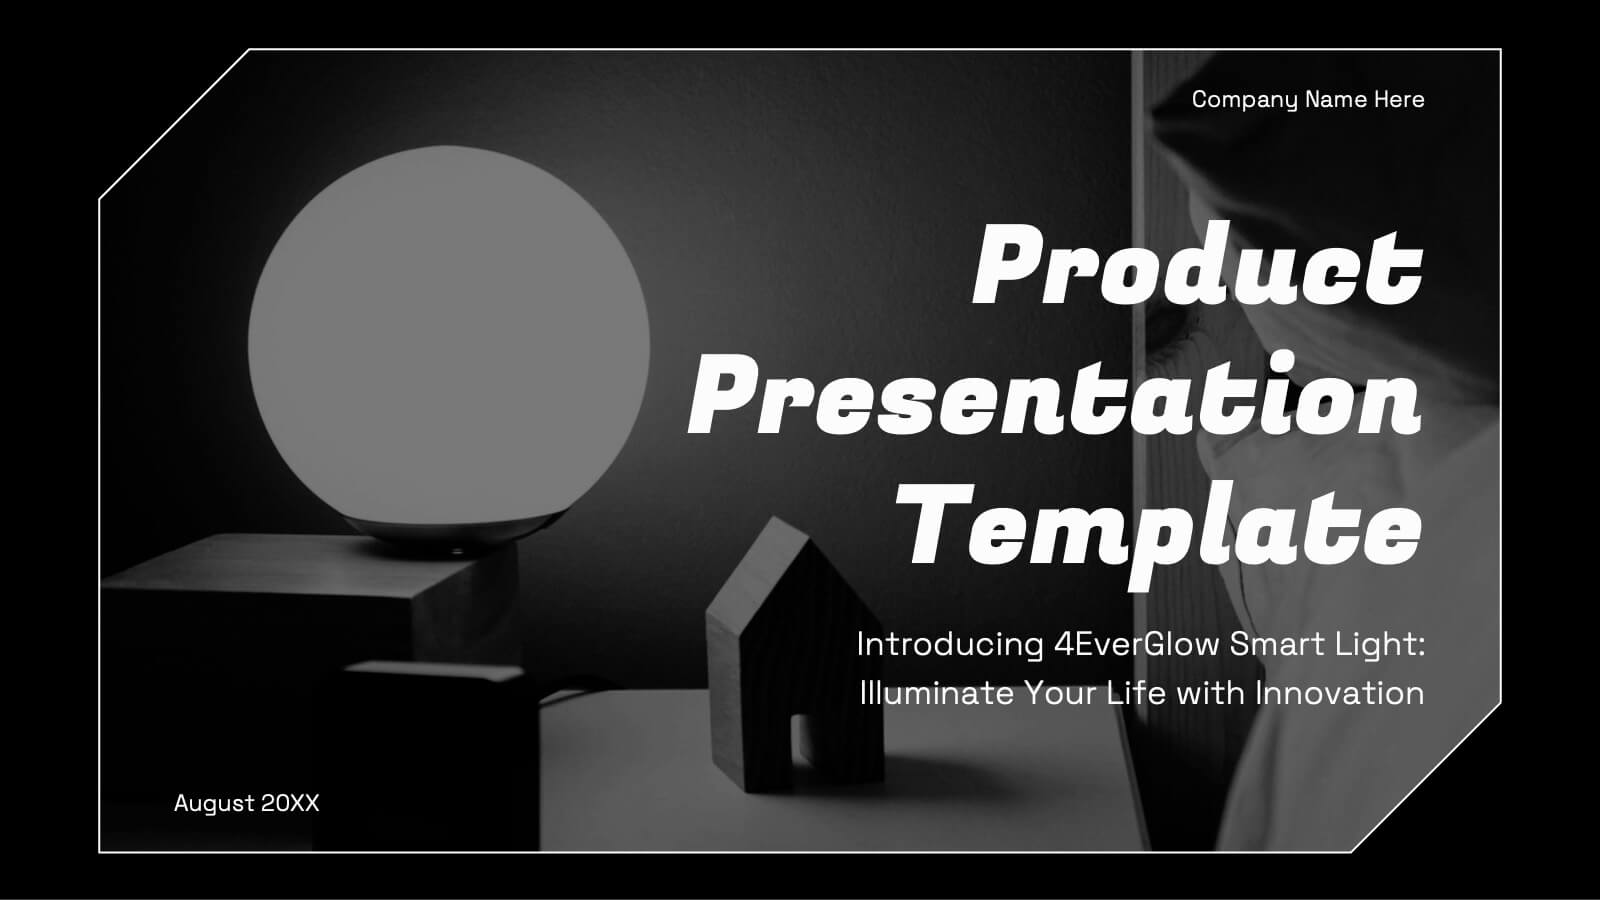
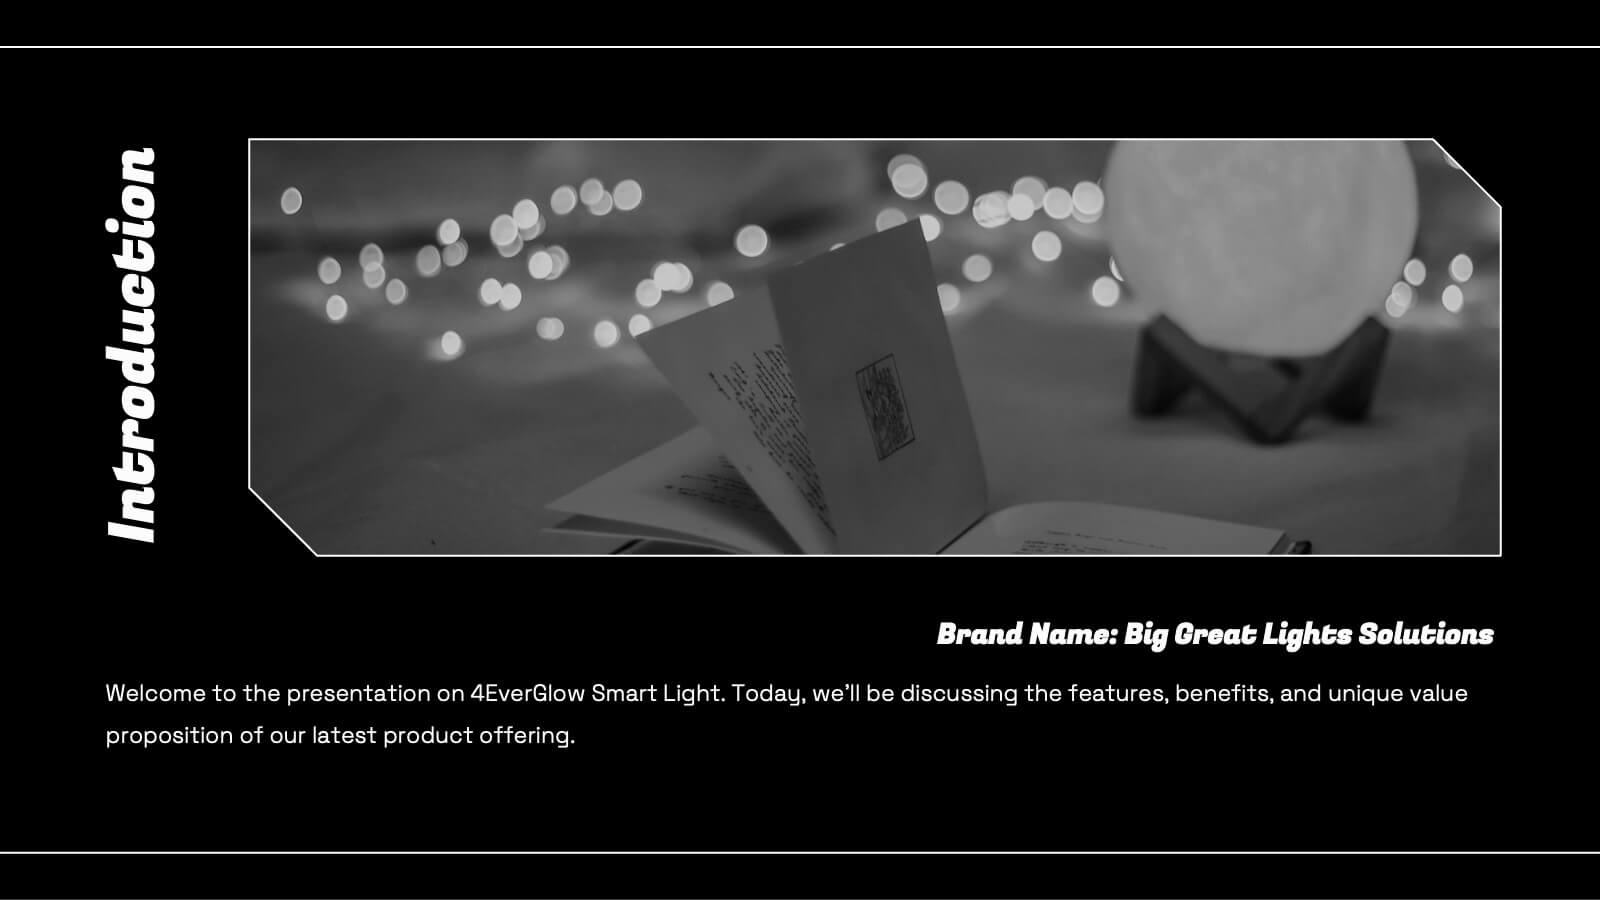
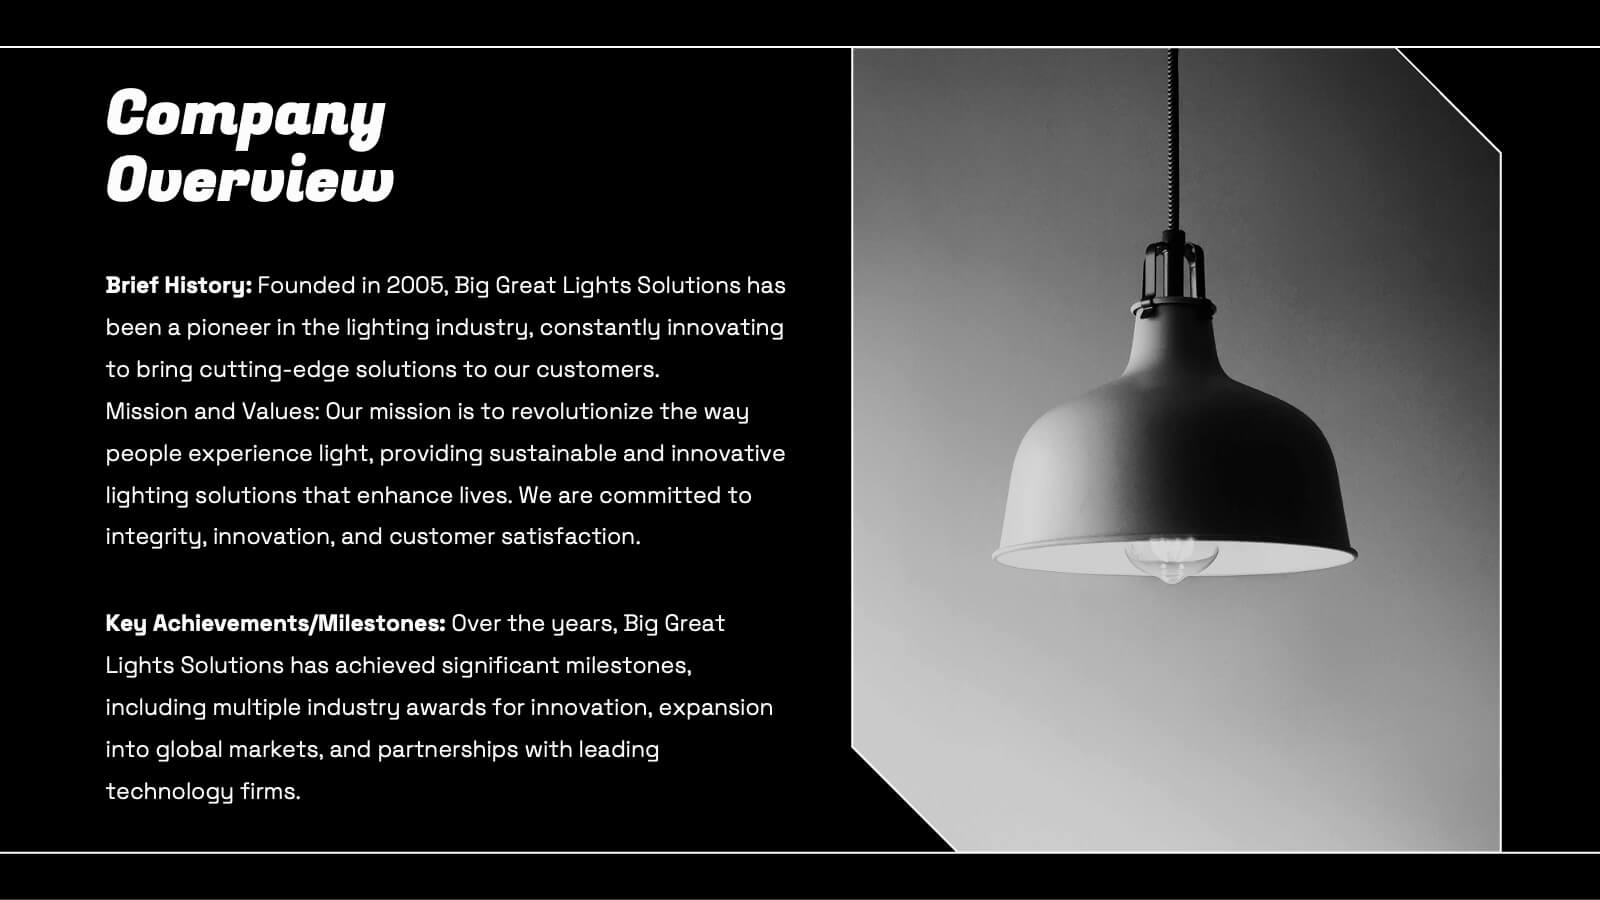
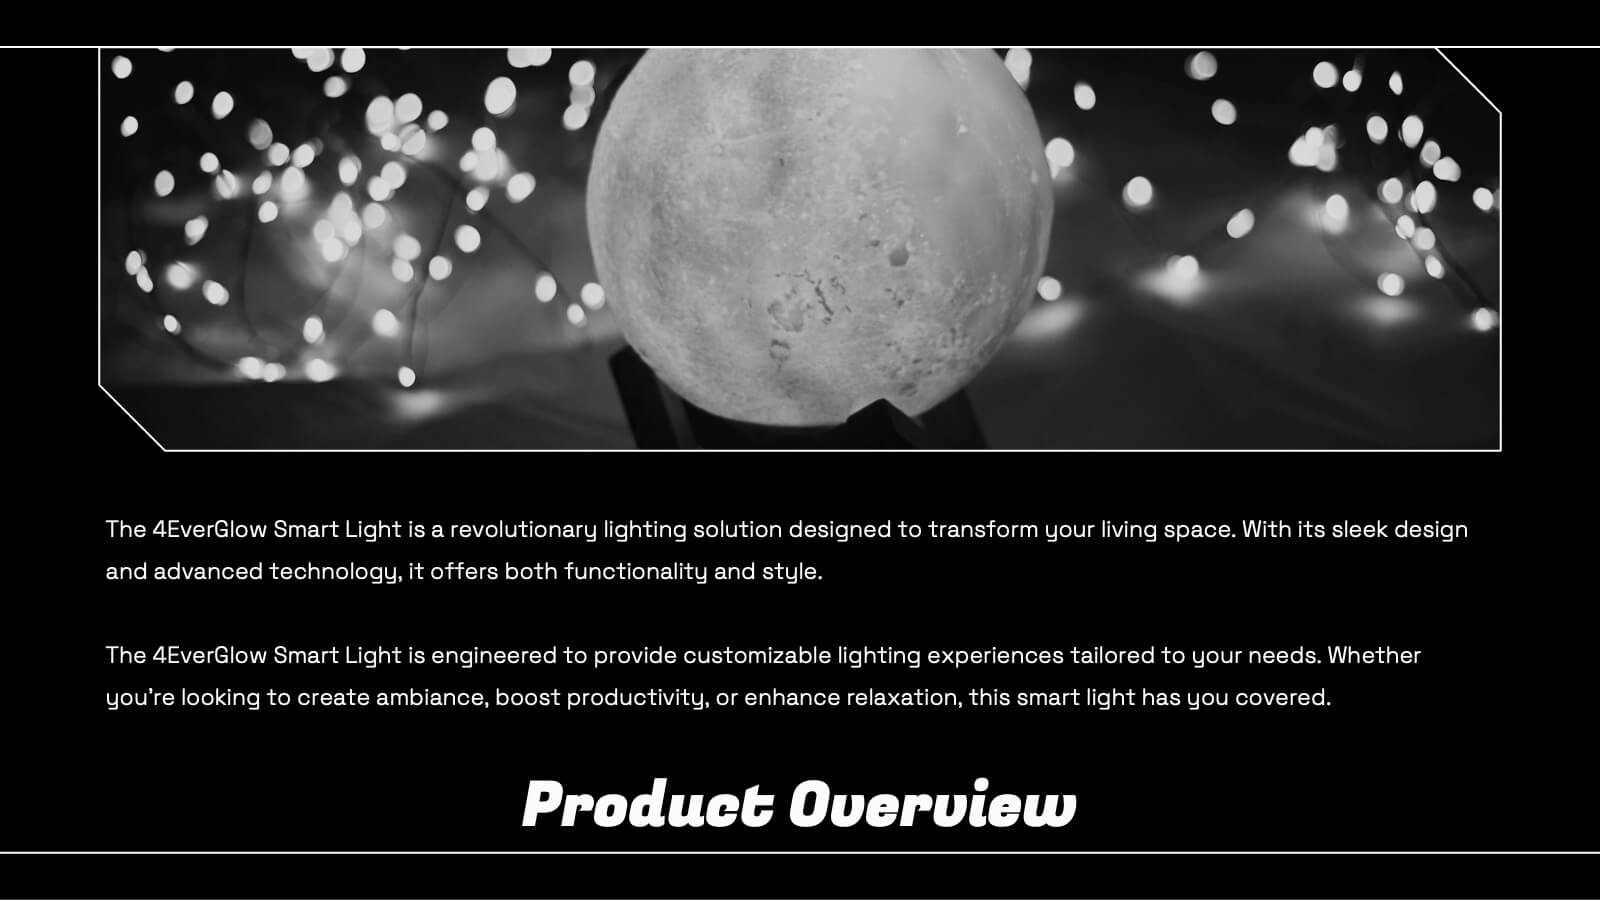
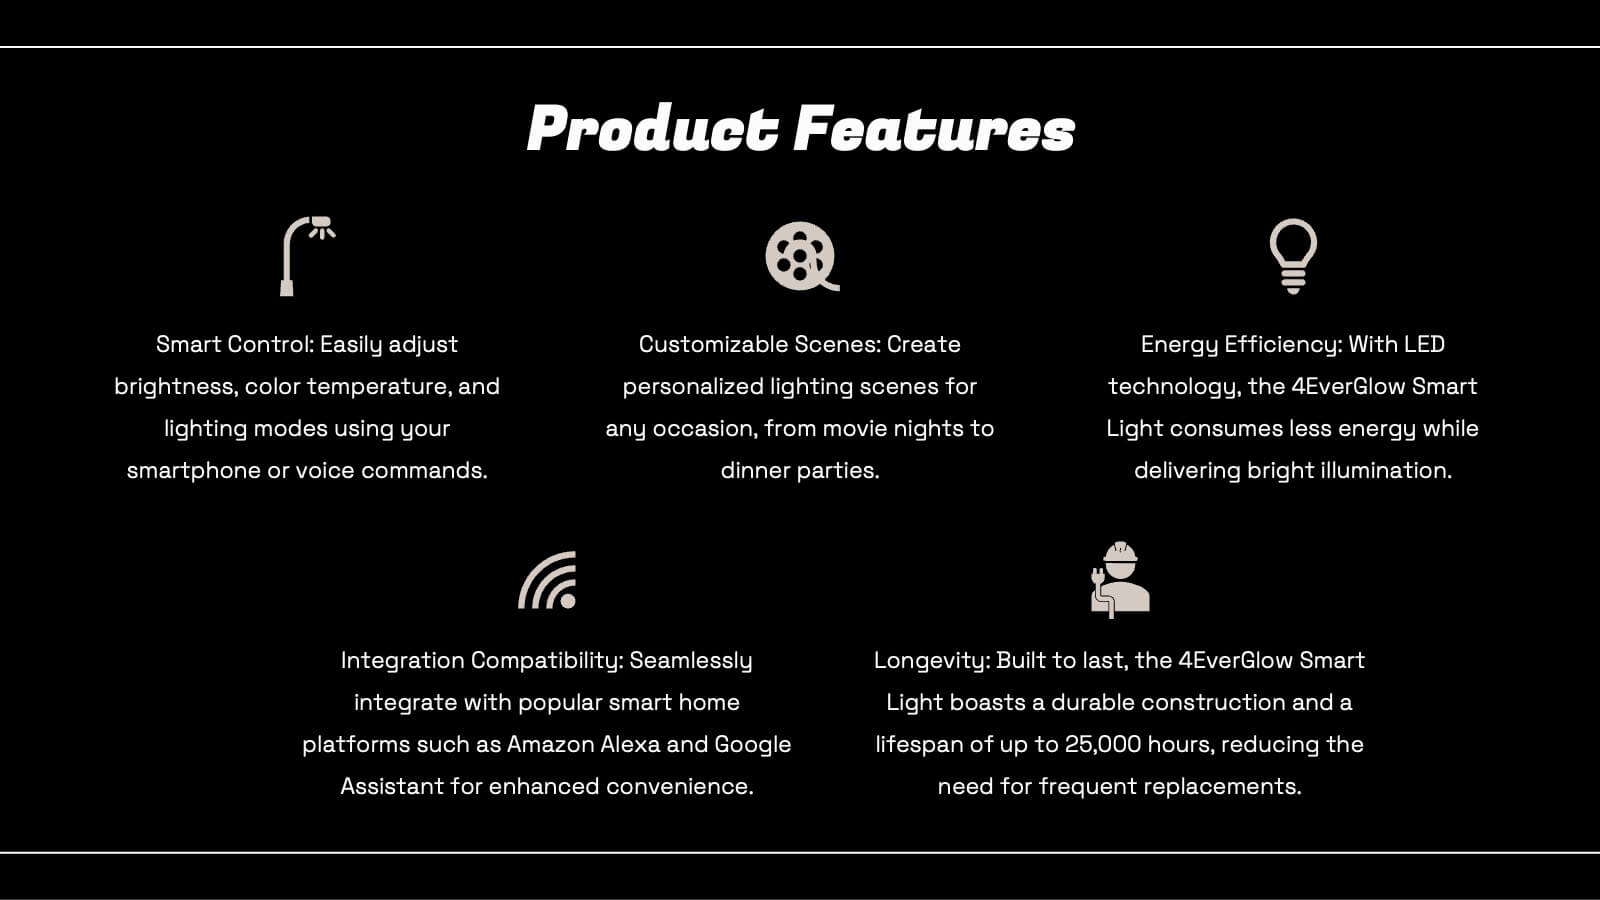
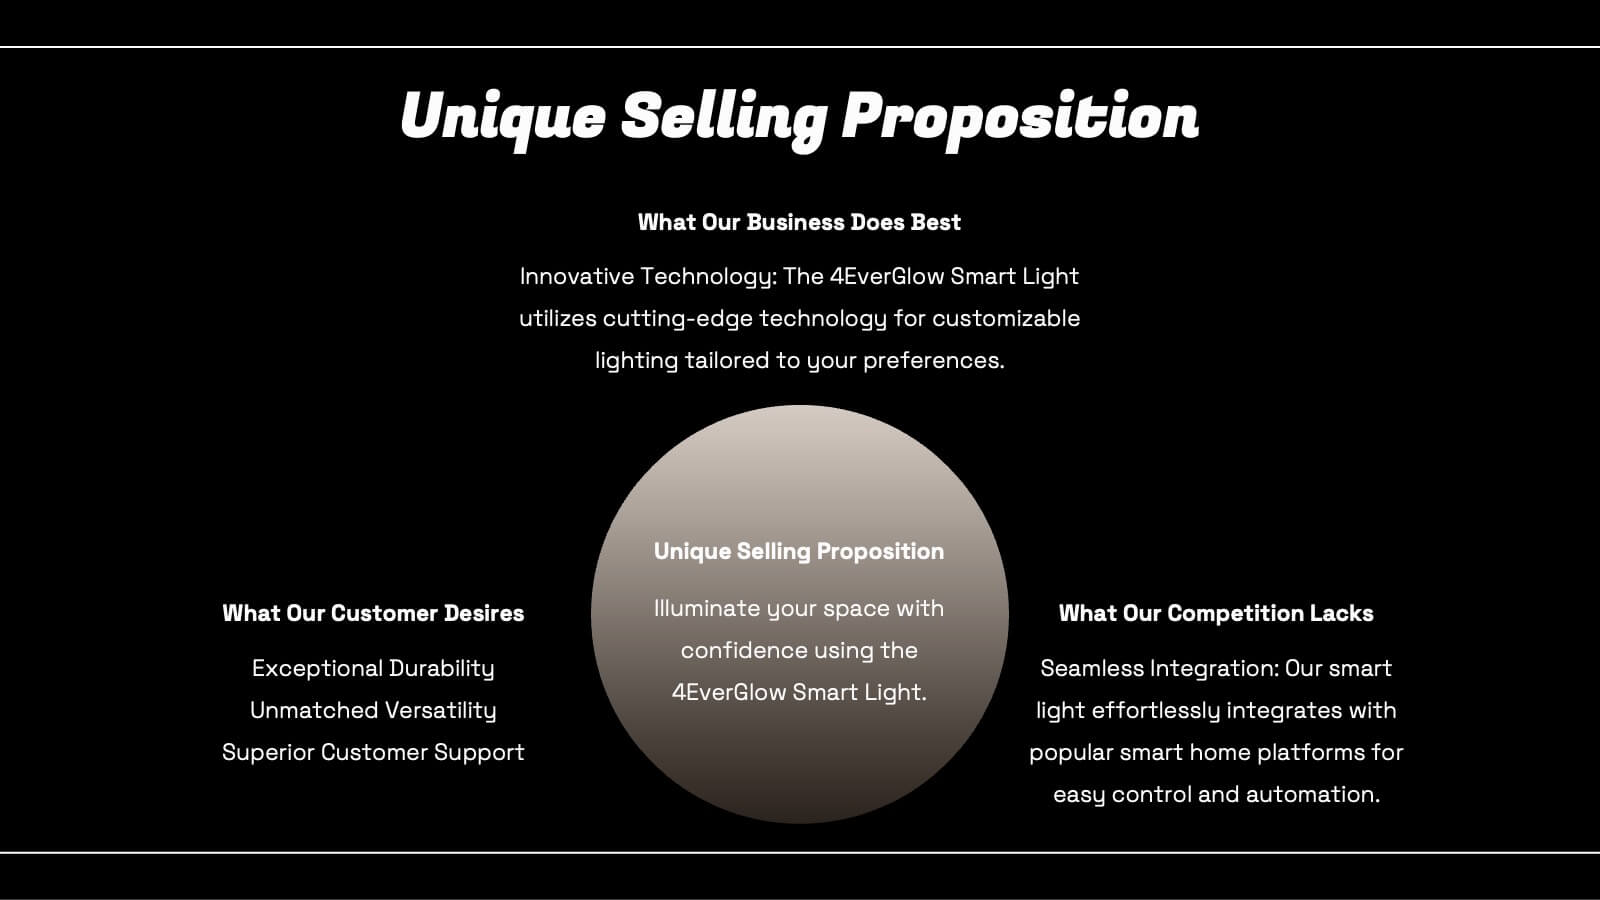
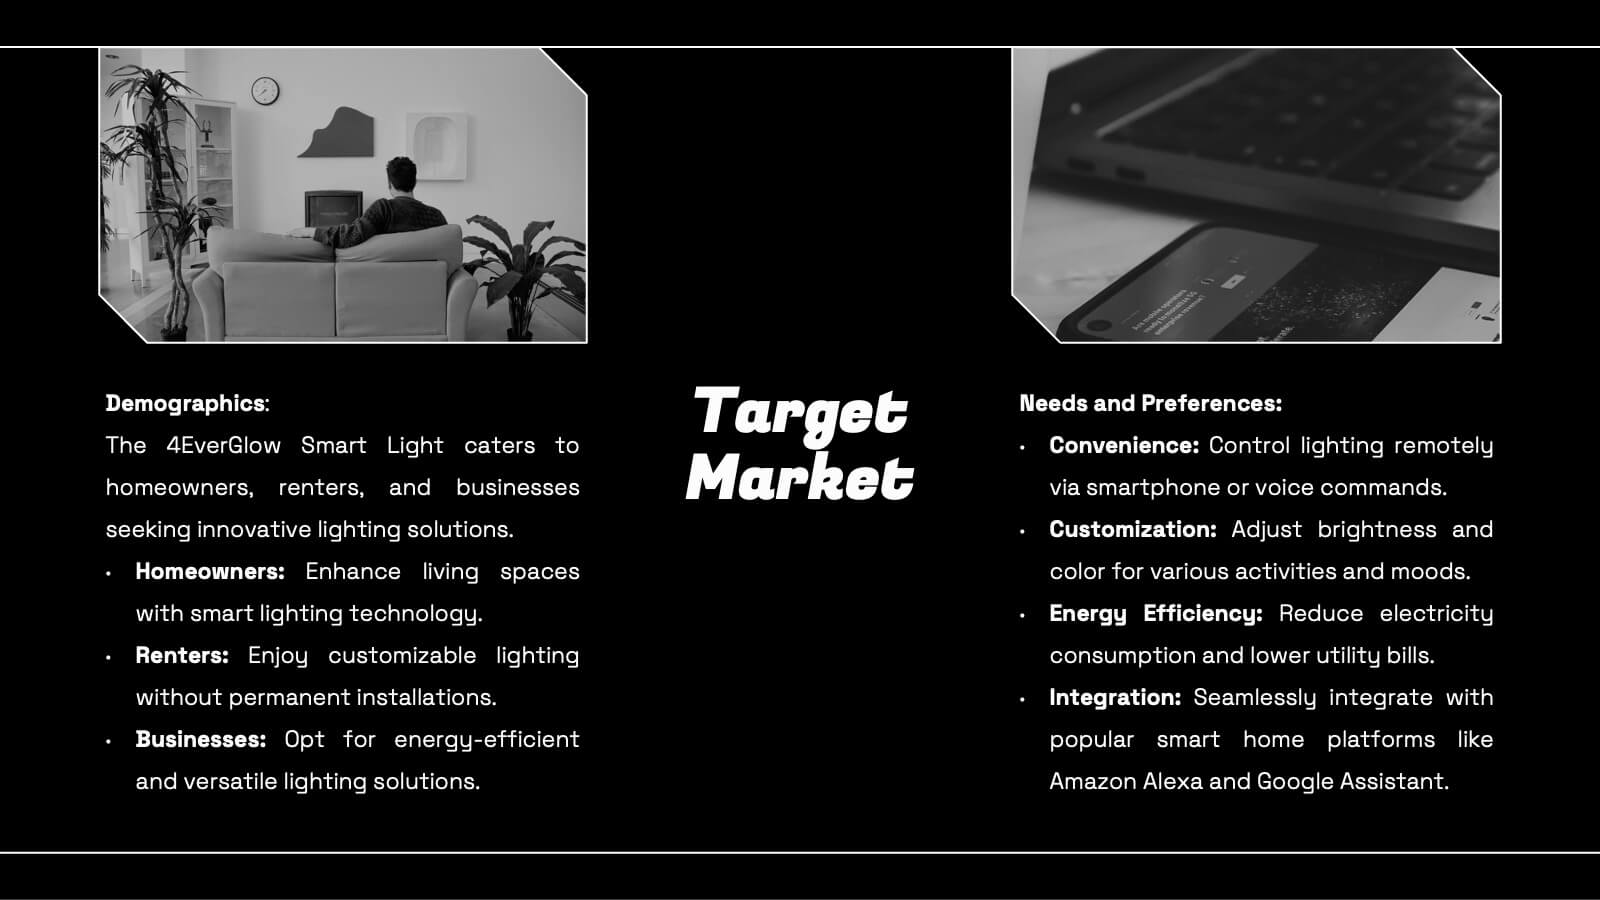
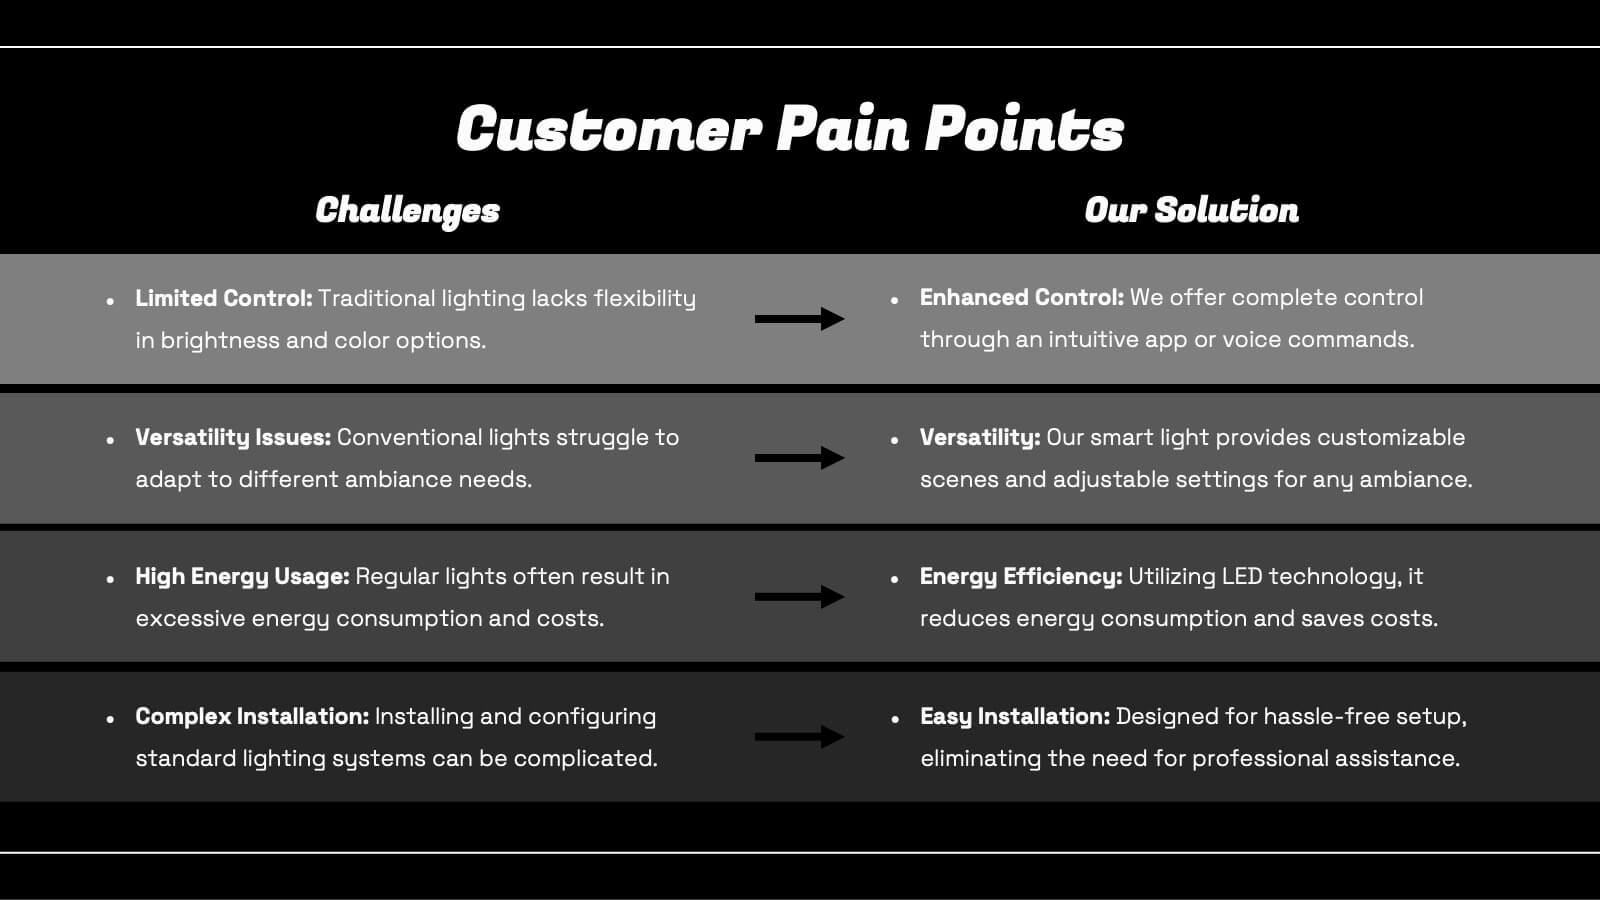
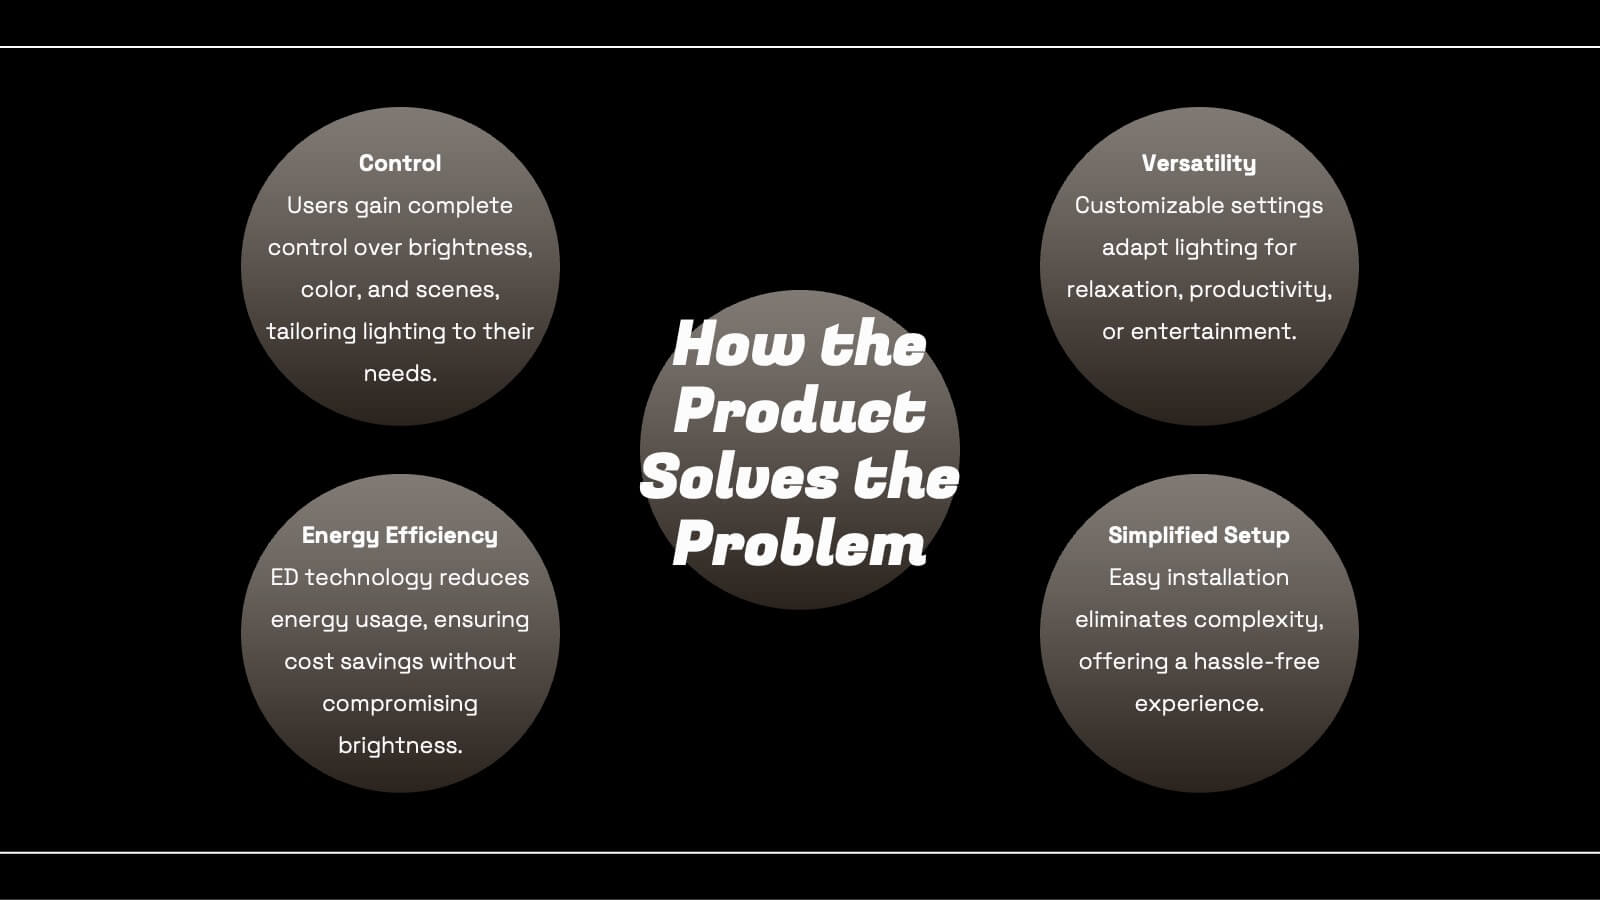
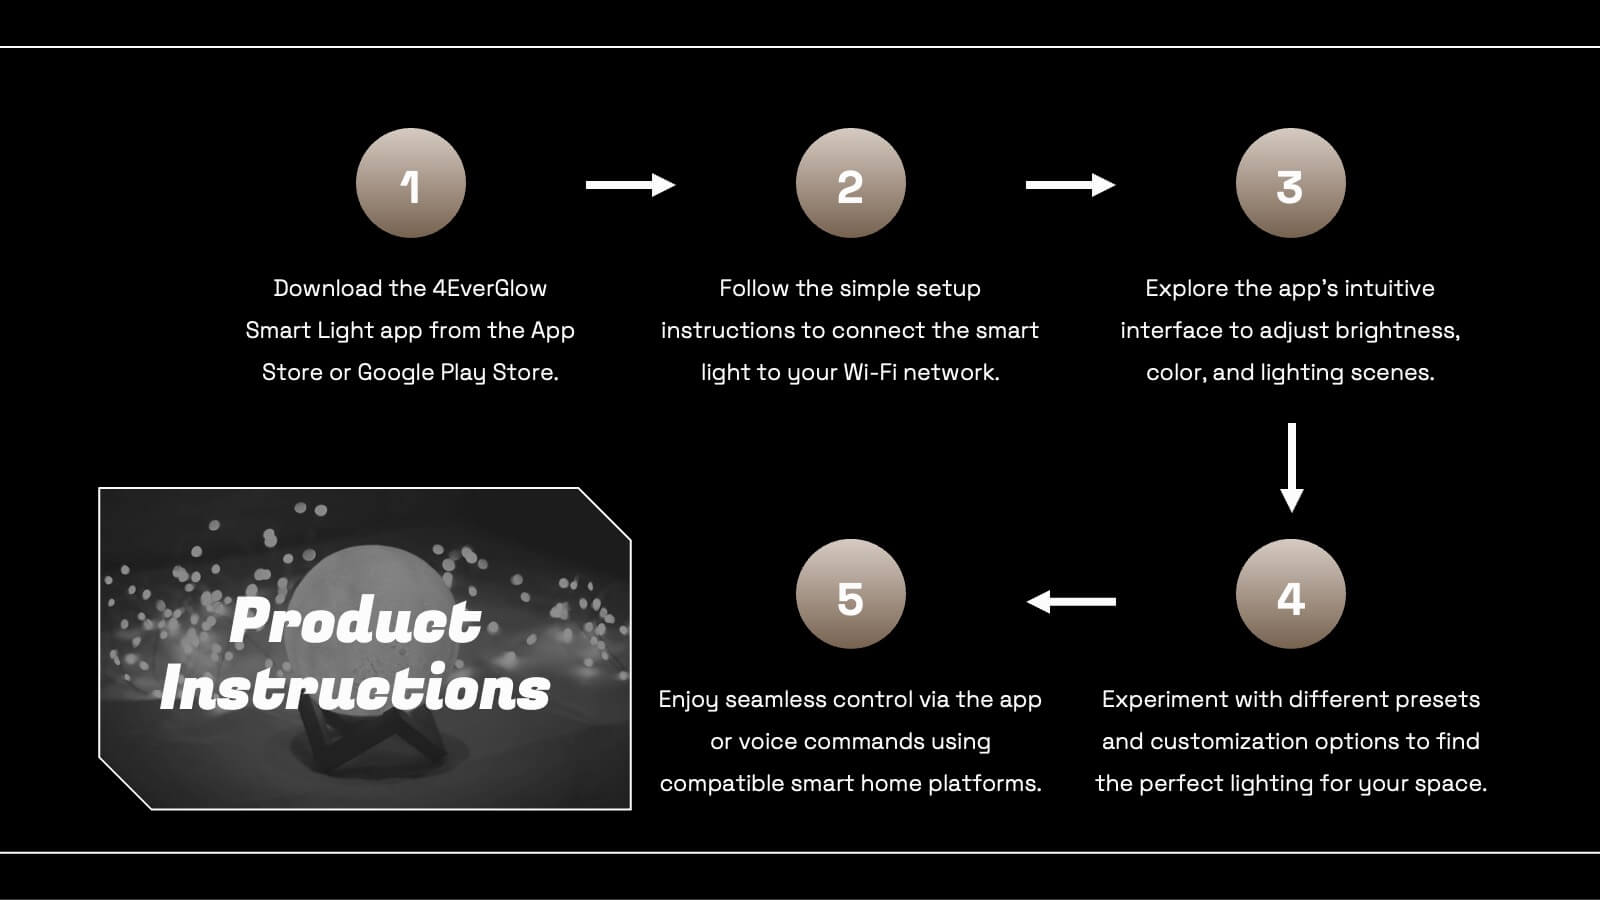
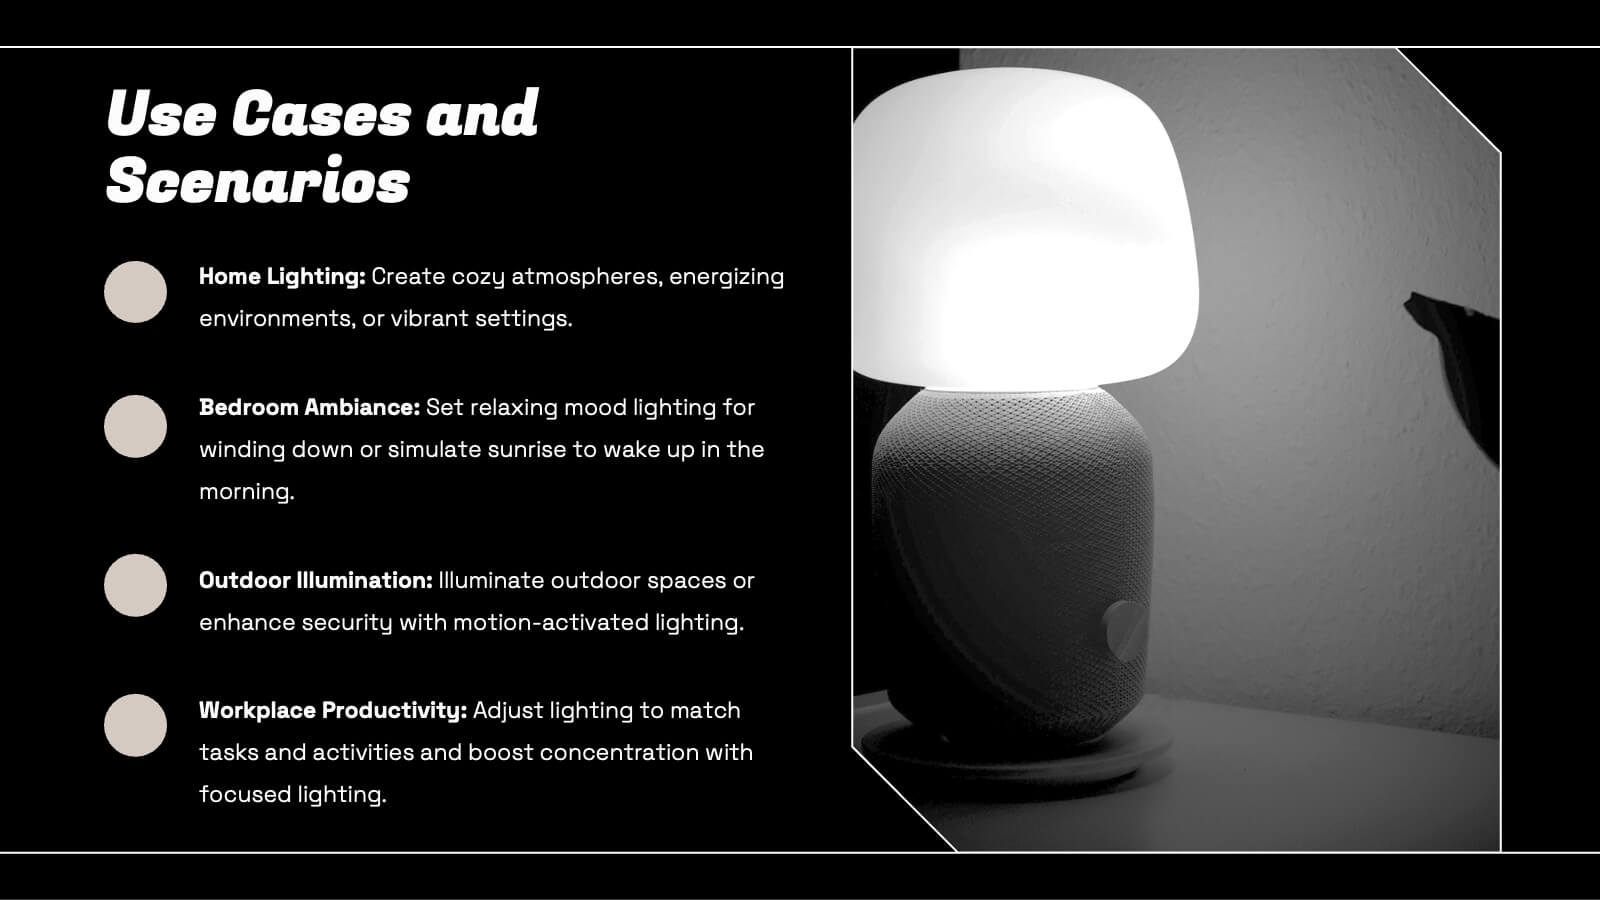
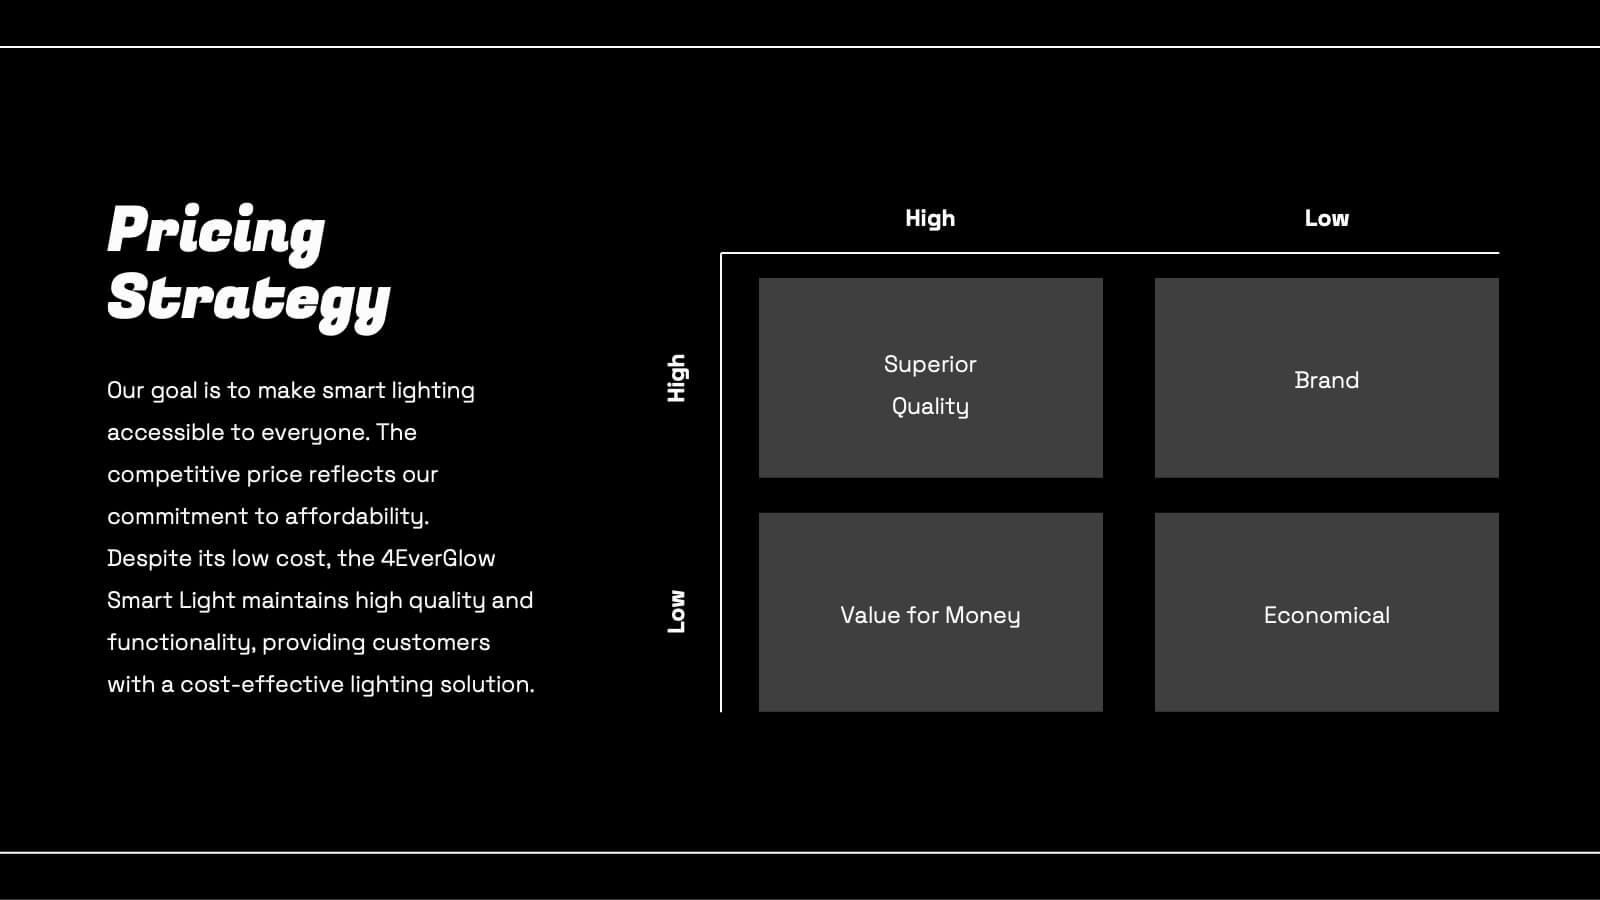
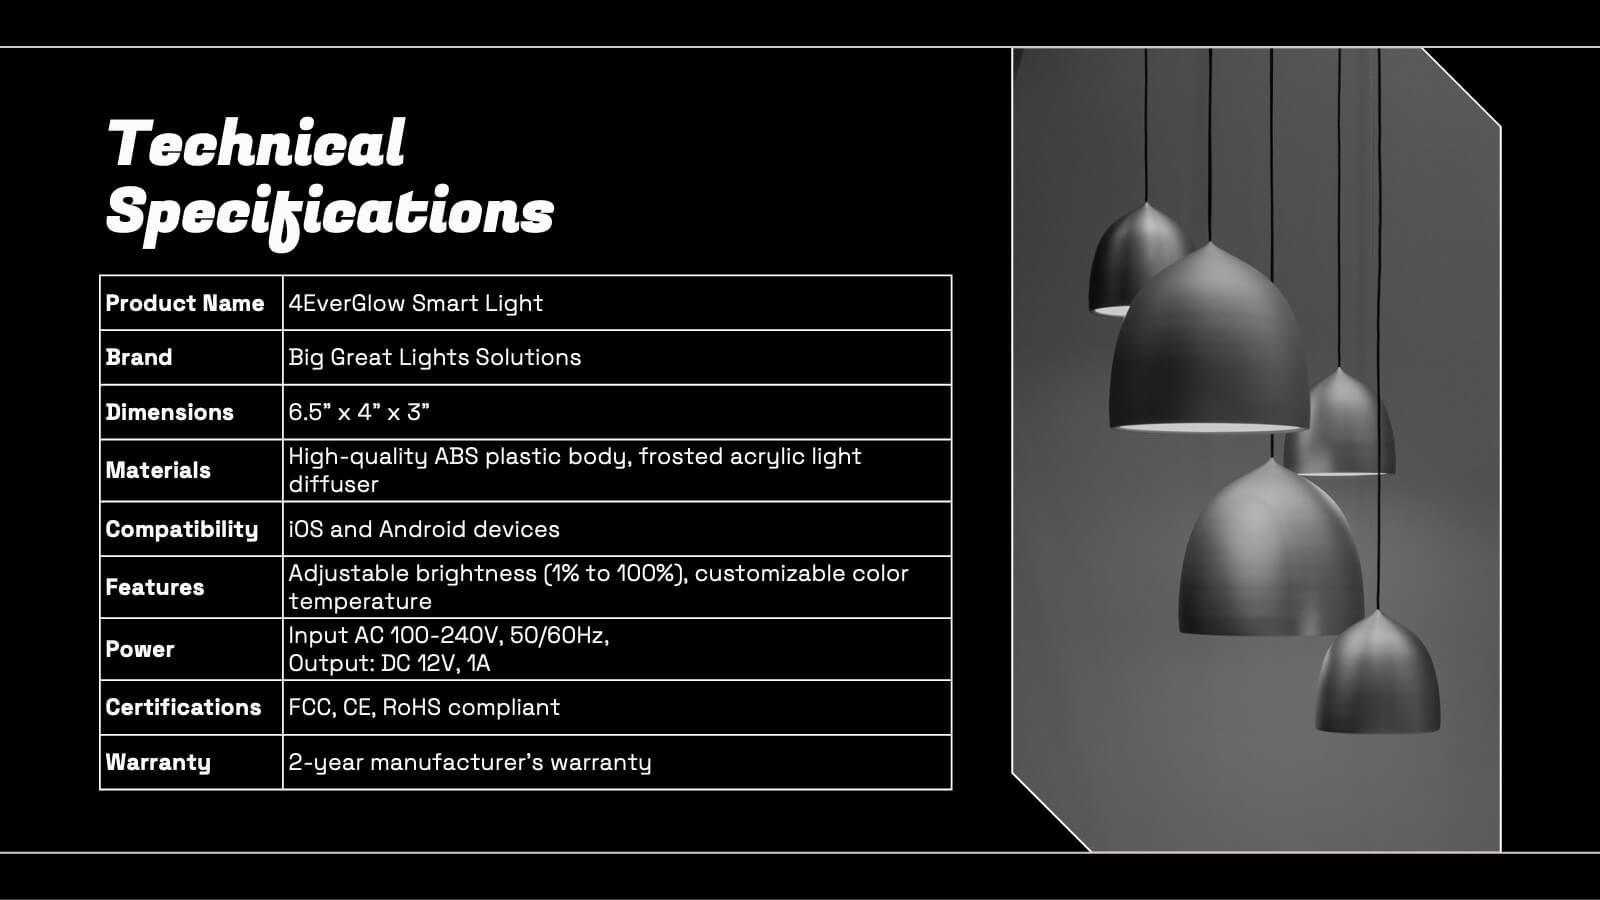
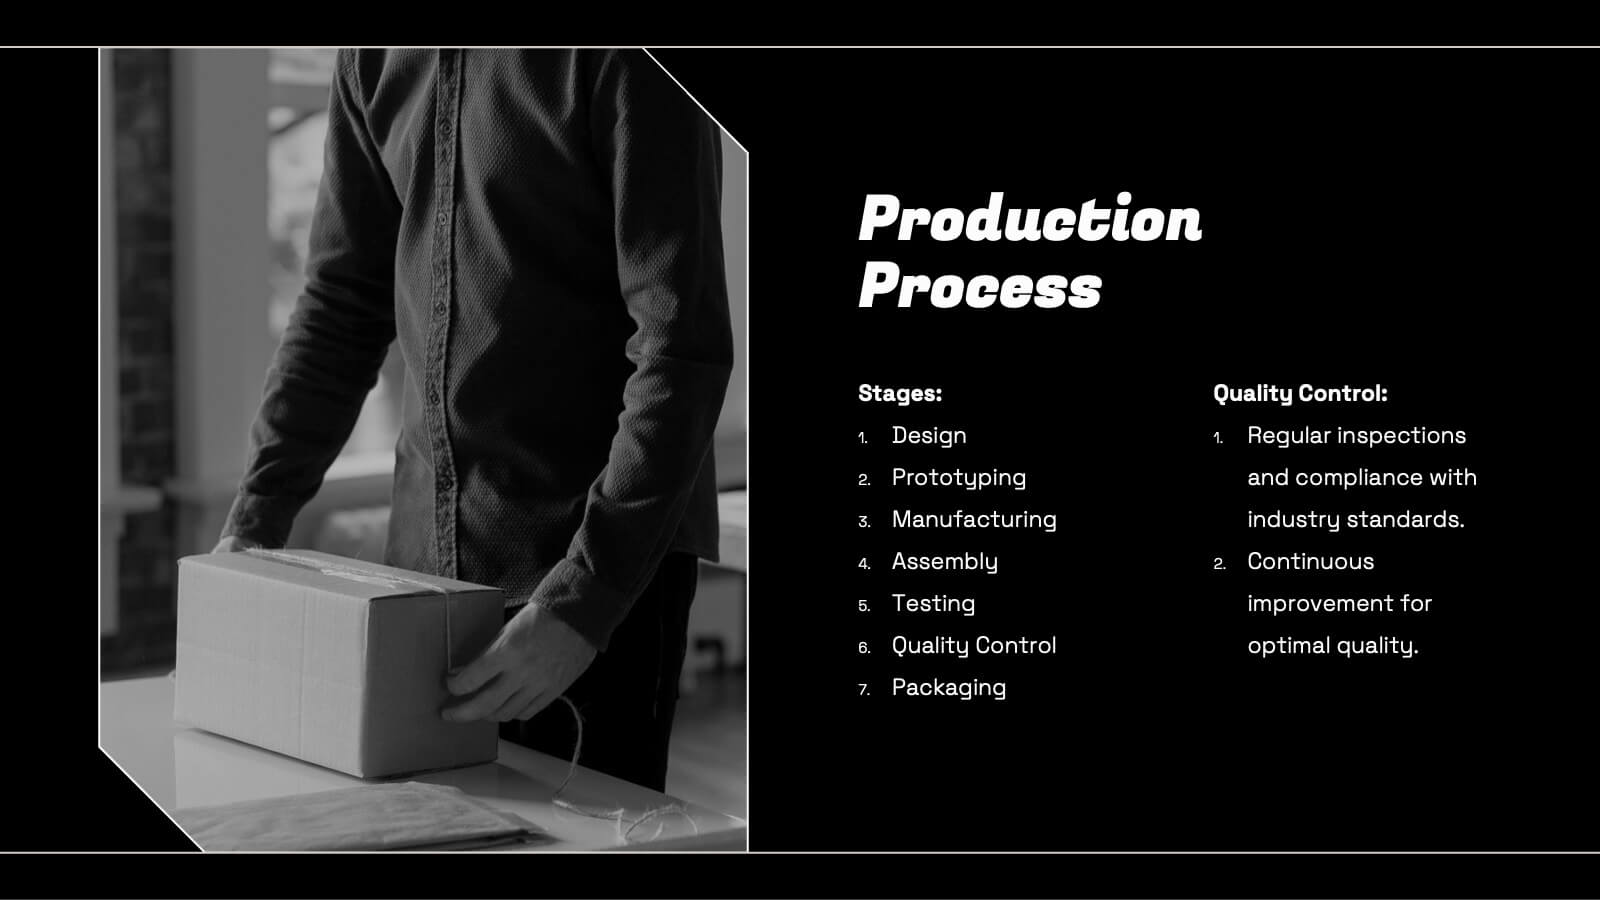
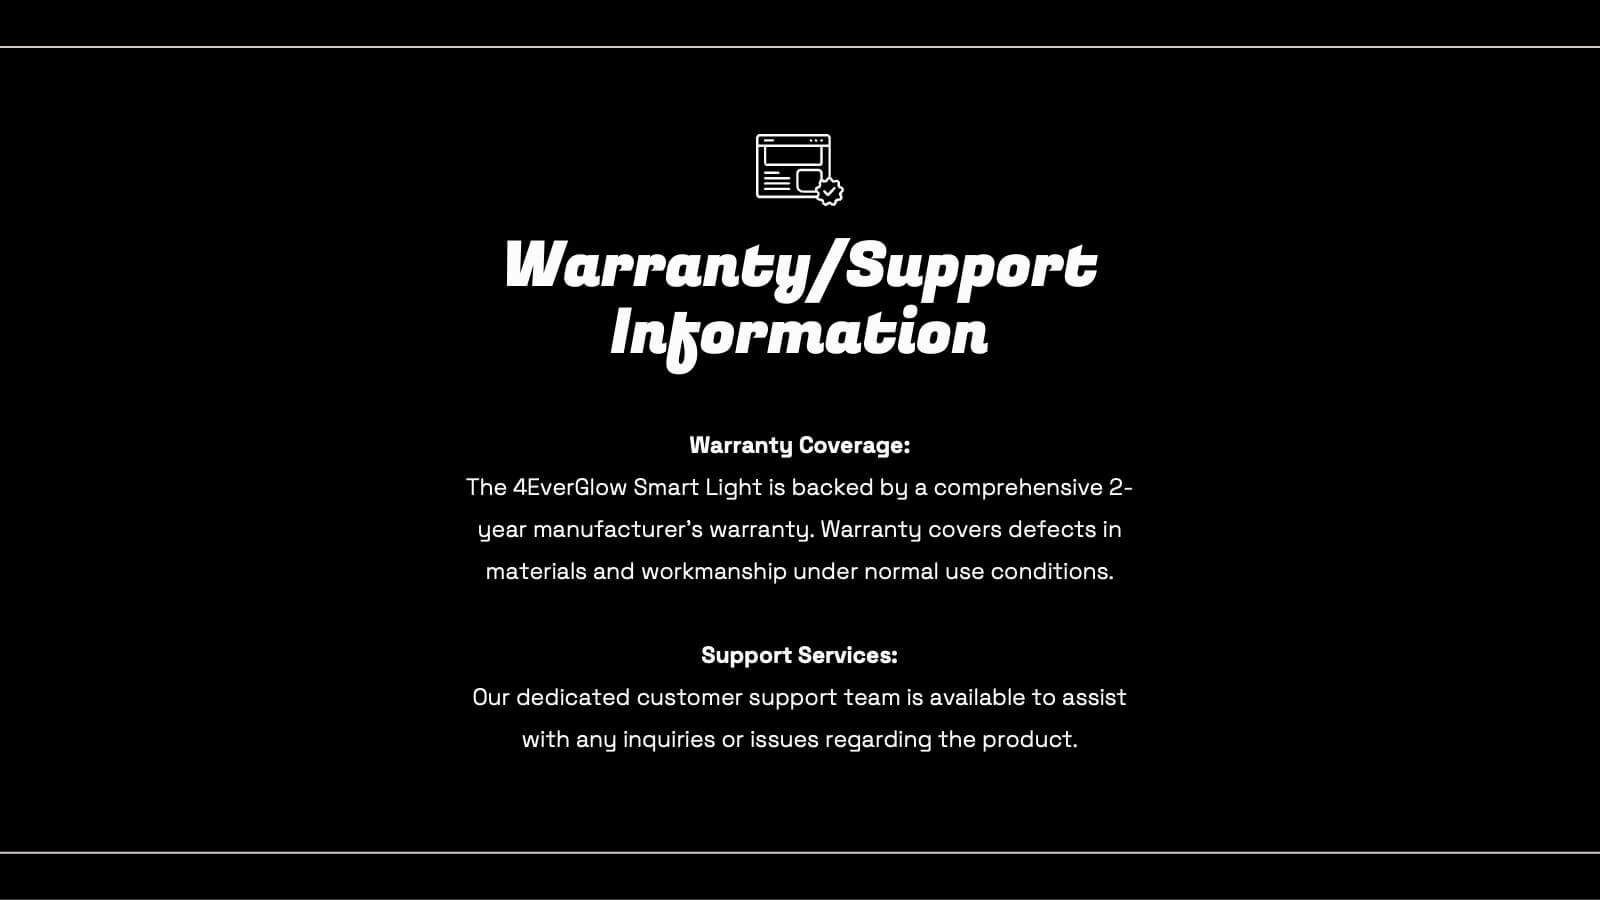
Smart Light Product Presentation
Enhance your product presentations with this Smart Lighting template. Designed for clarity and aesthetic appeal, it includes slides detailing product features, market analysis, technical specifications, and pricing strategies. Ideal for tech products, it's compatible with PowerPoint, Keynote, and Google Slides, ensuring broad accessibility and ease of use.


22 diapositivas
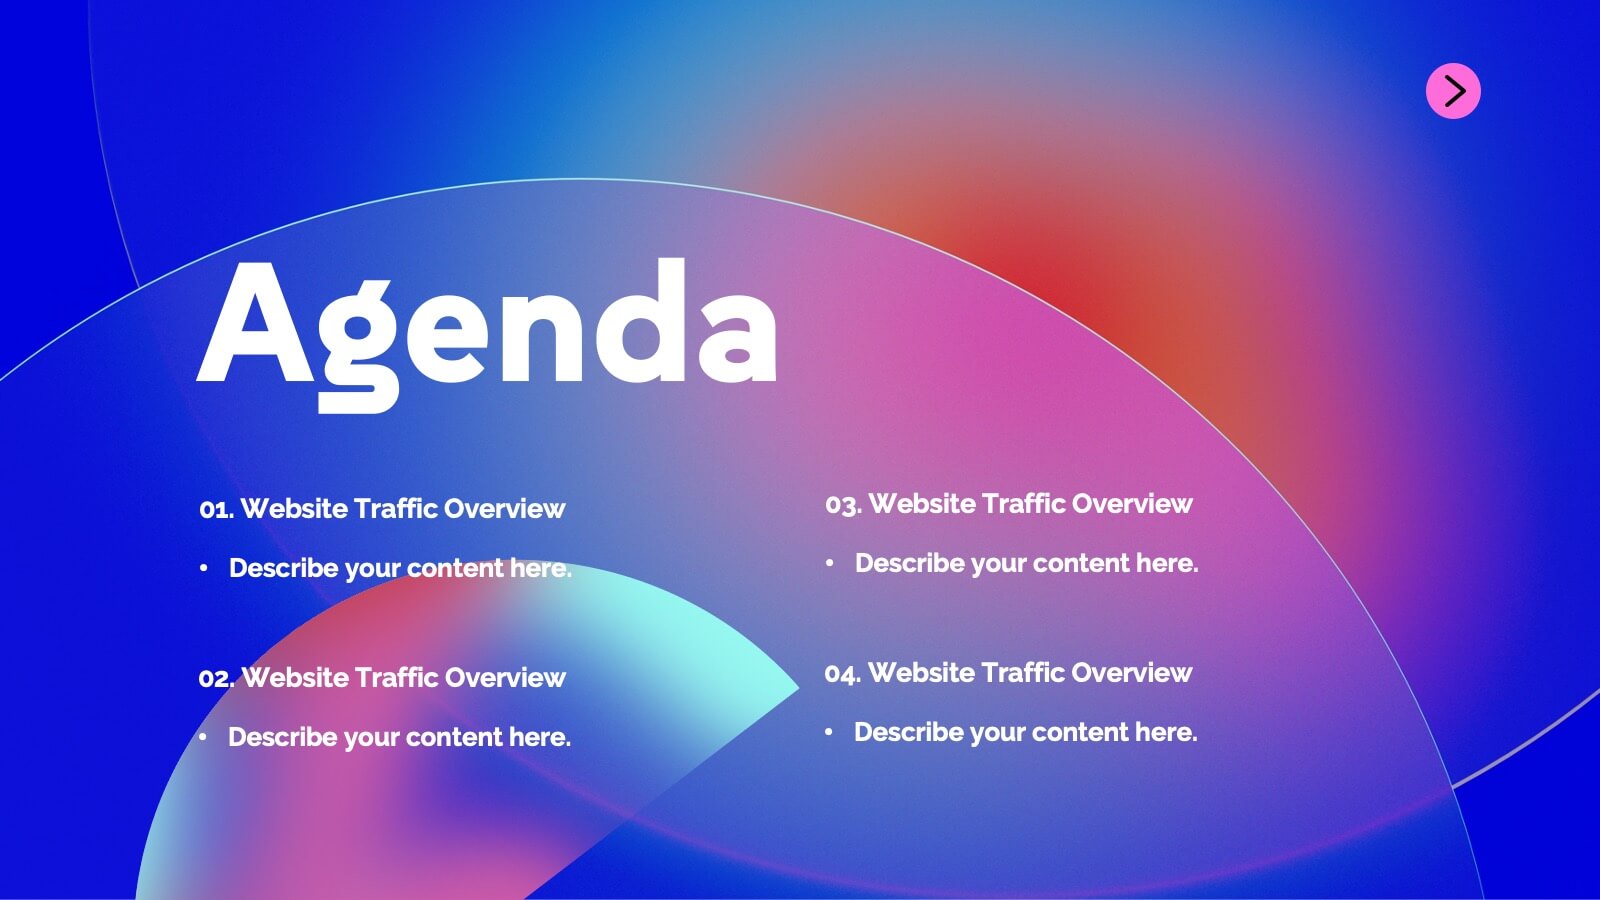
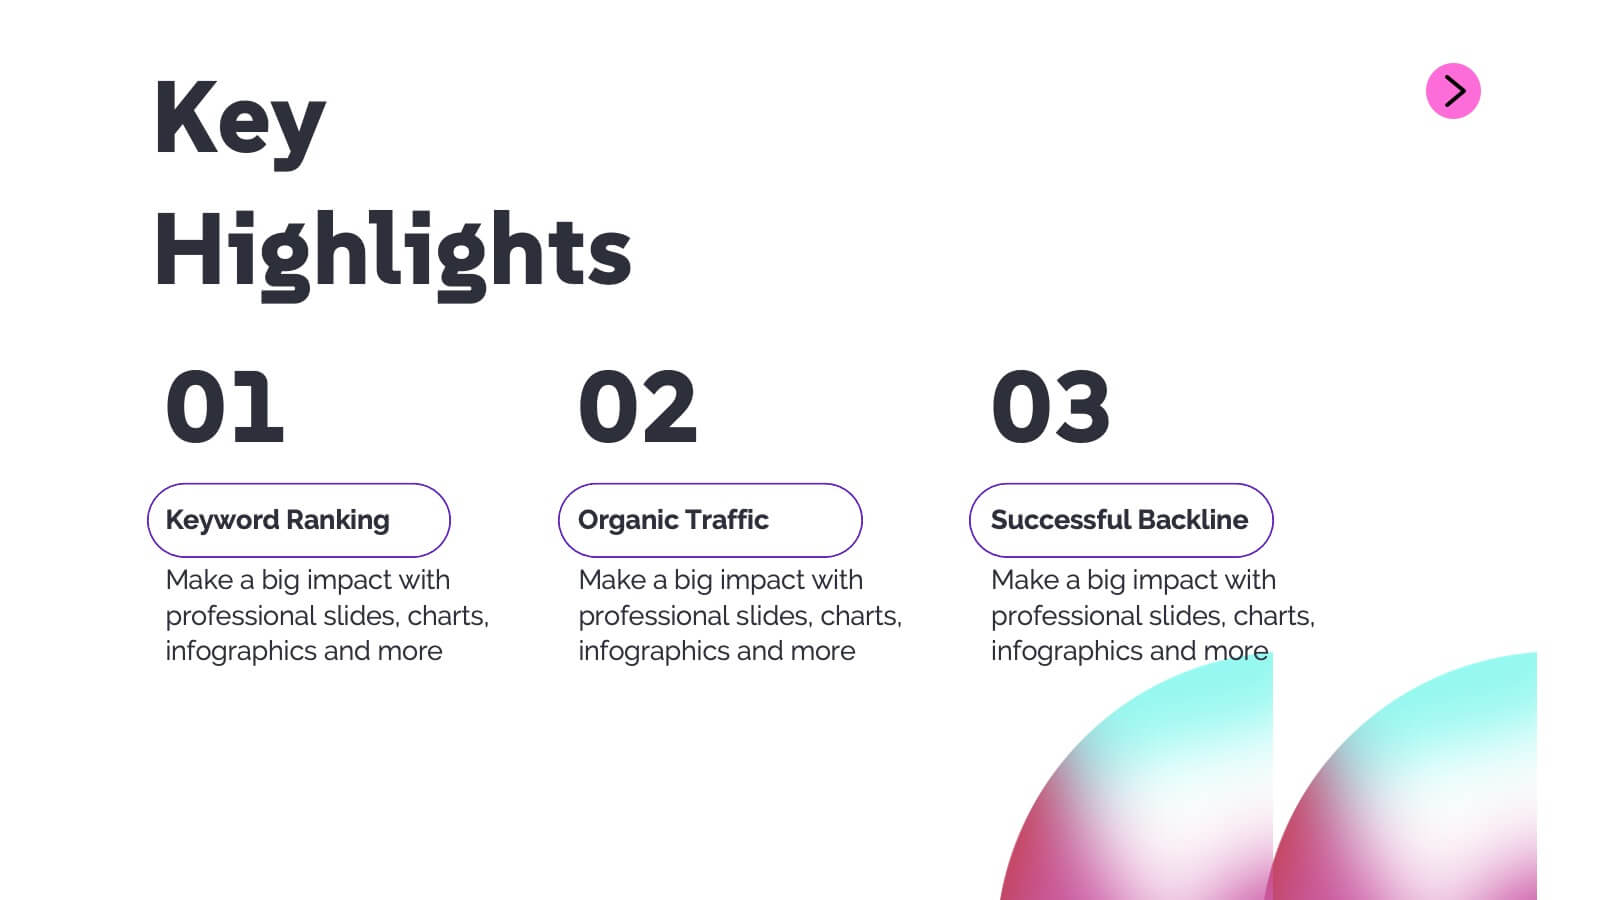
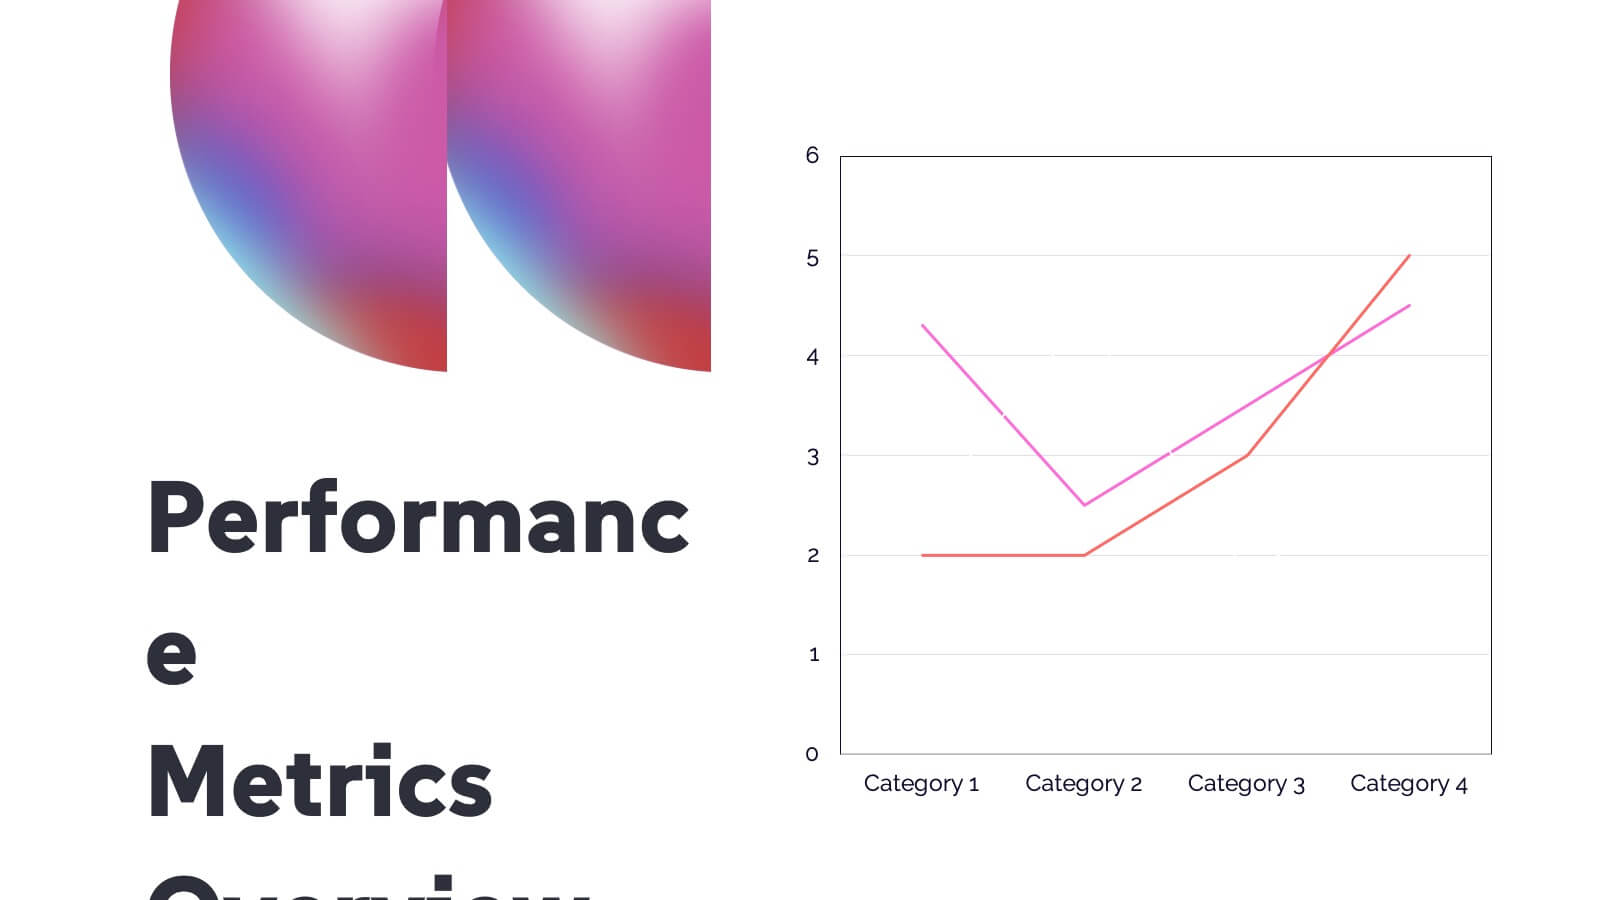
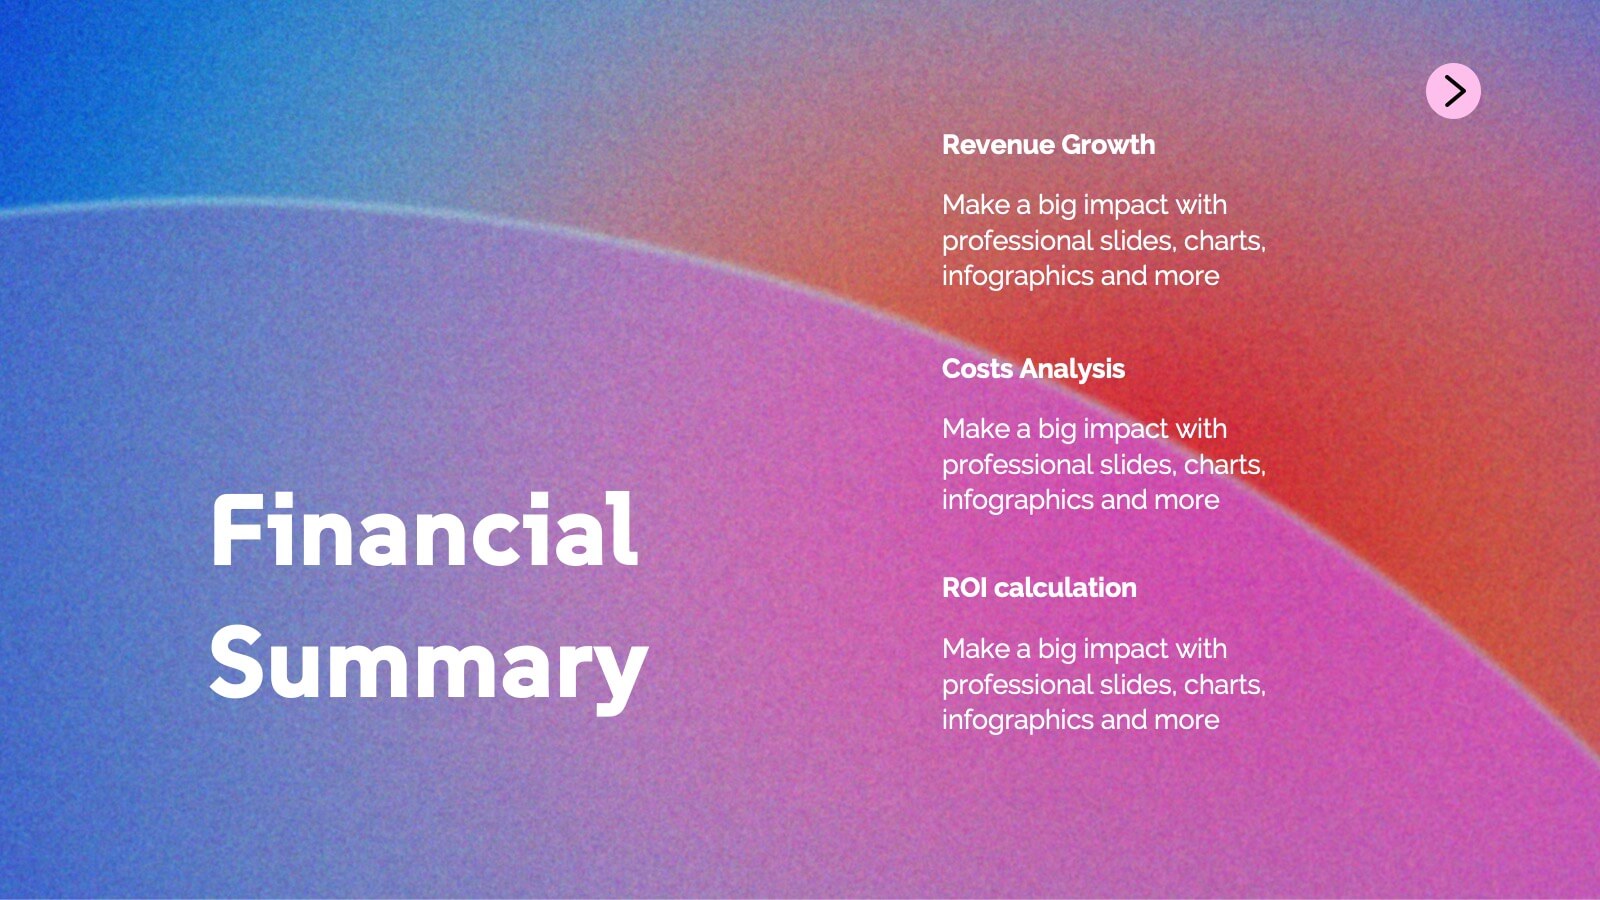
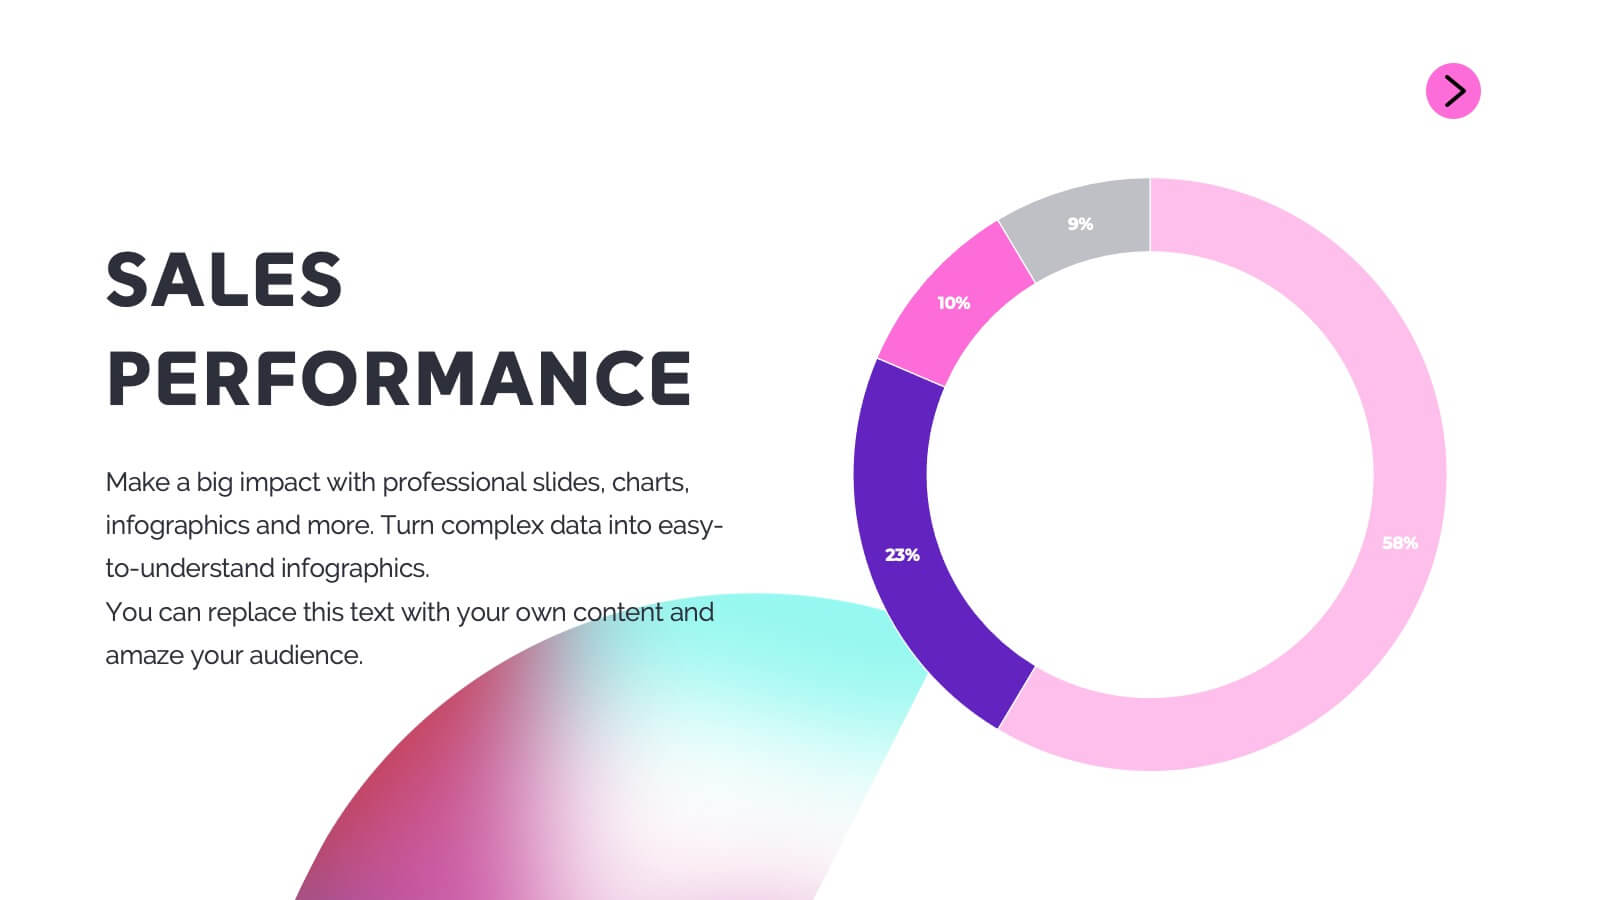
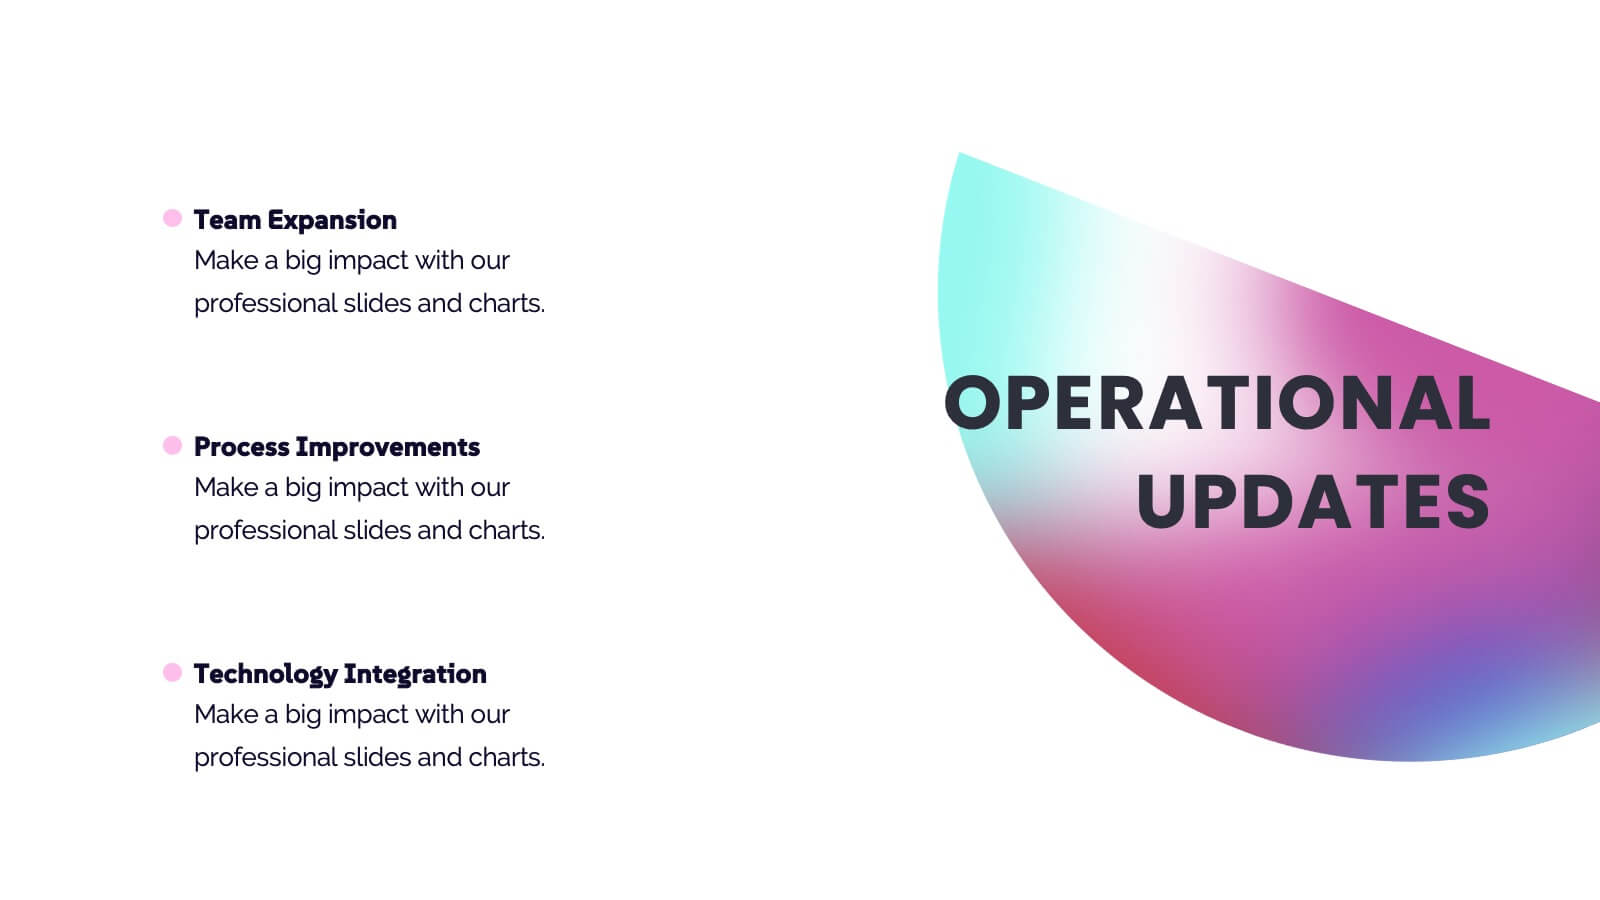
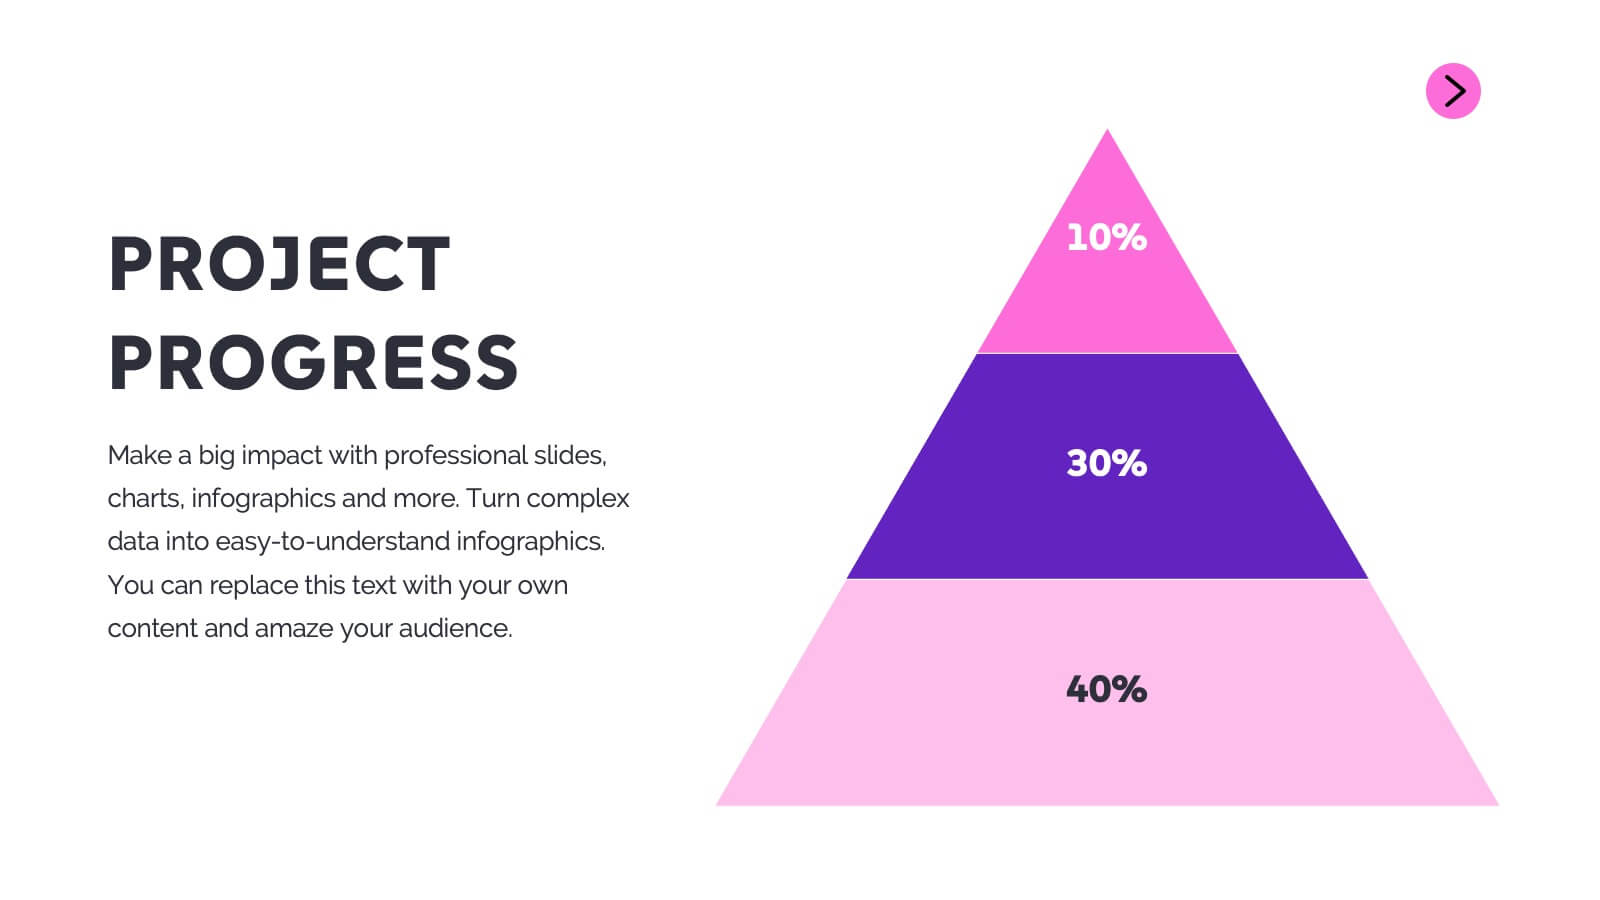
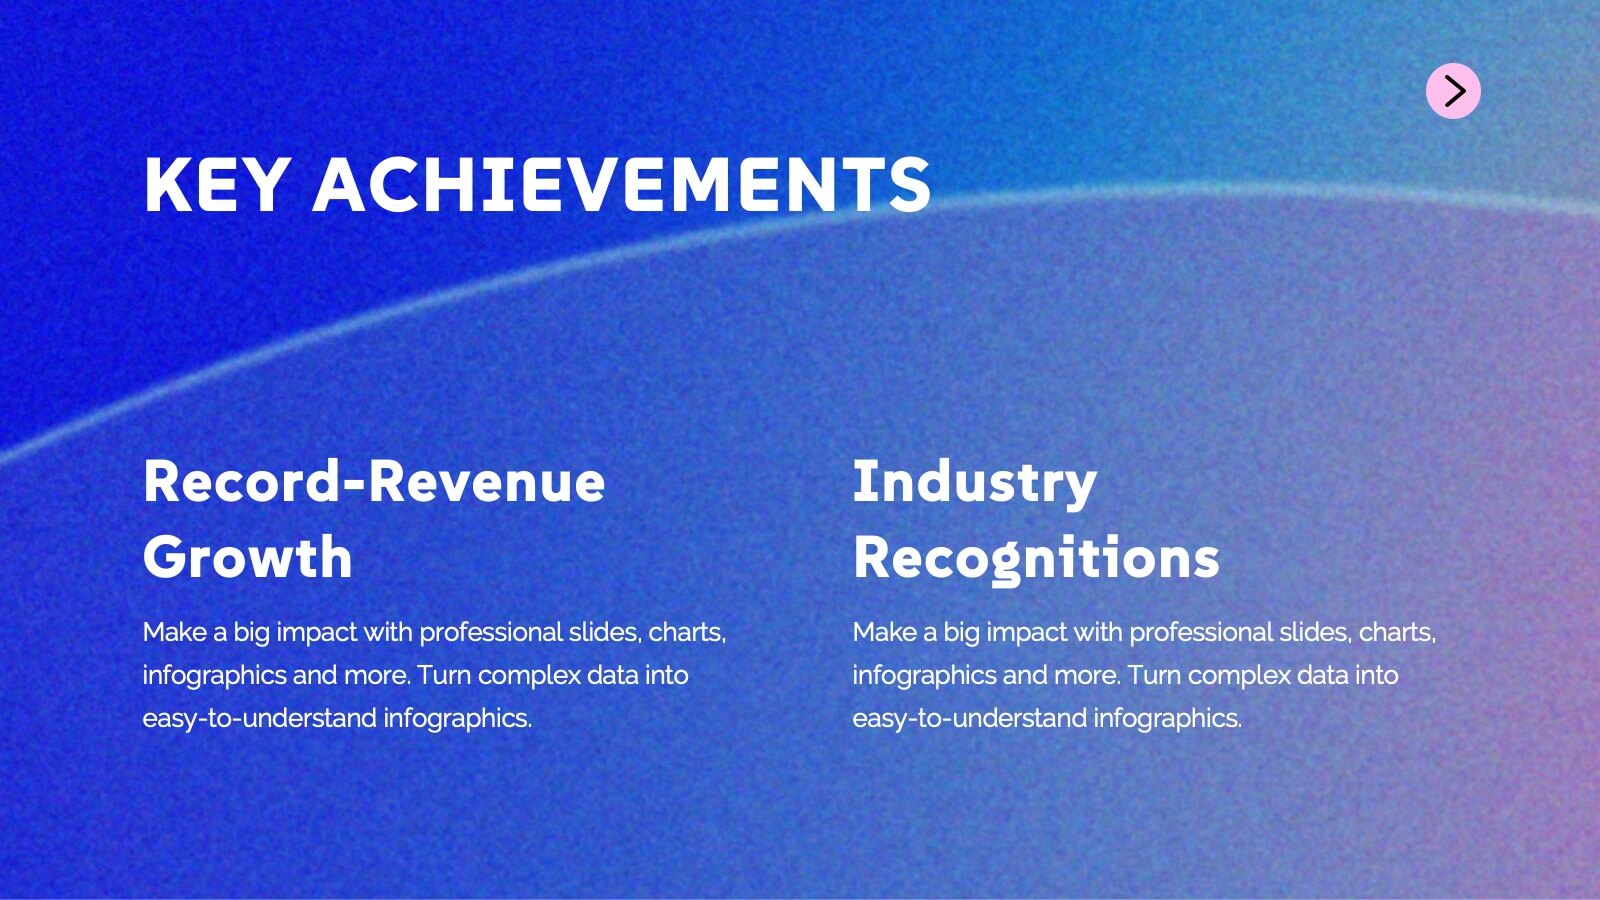
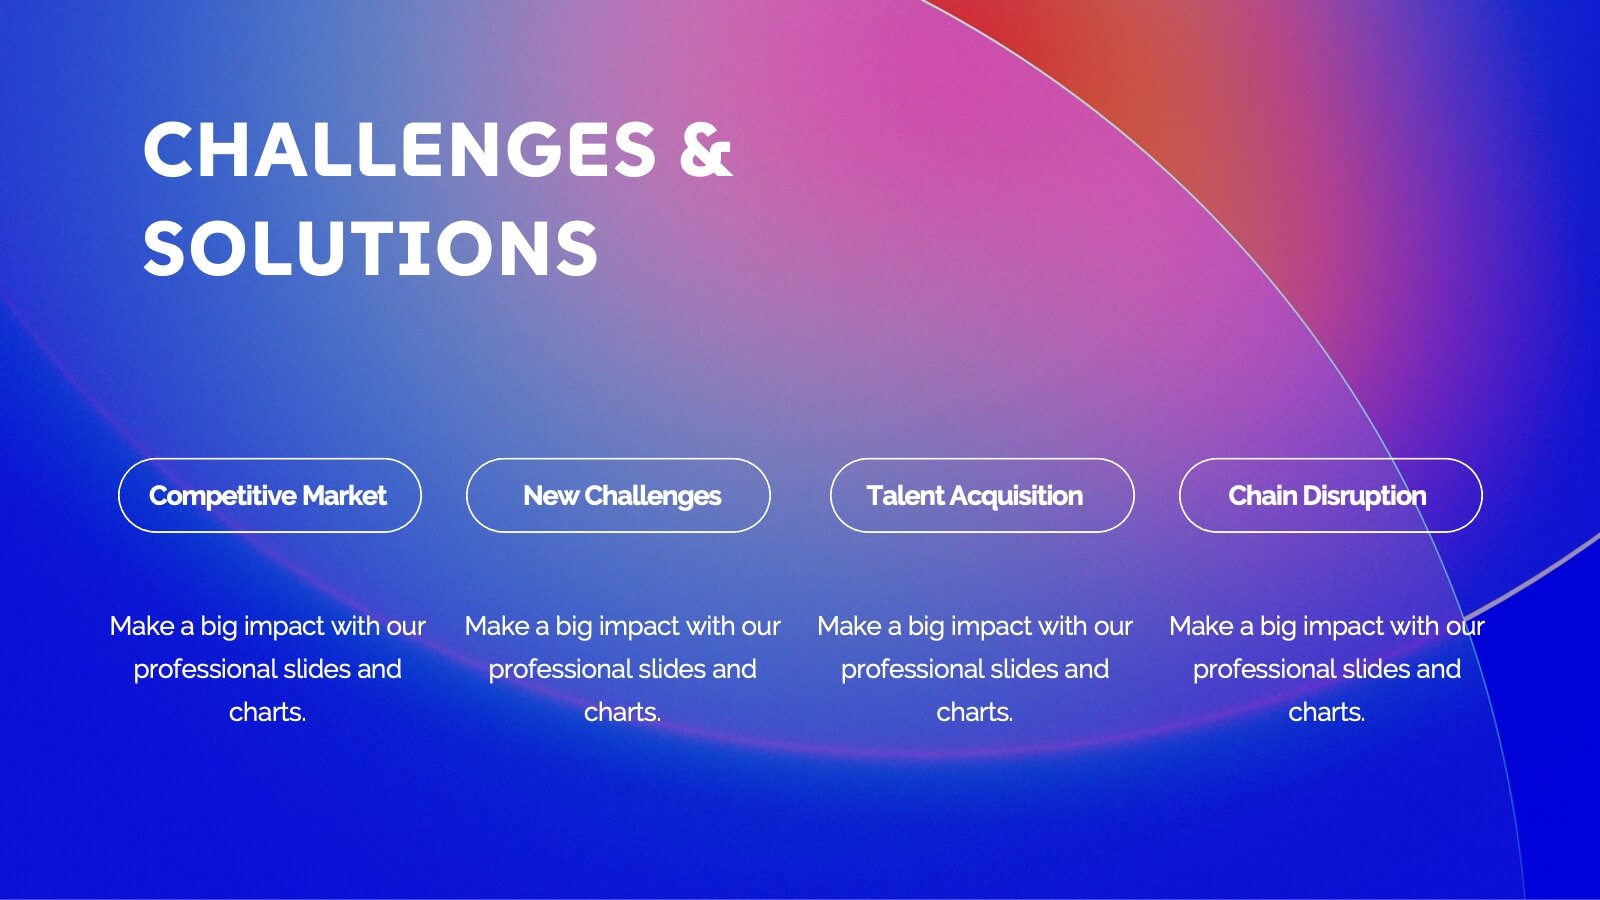
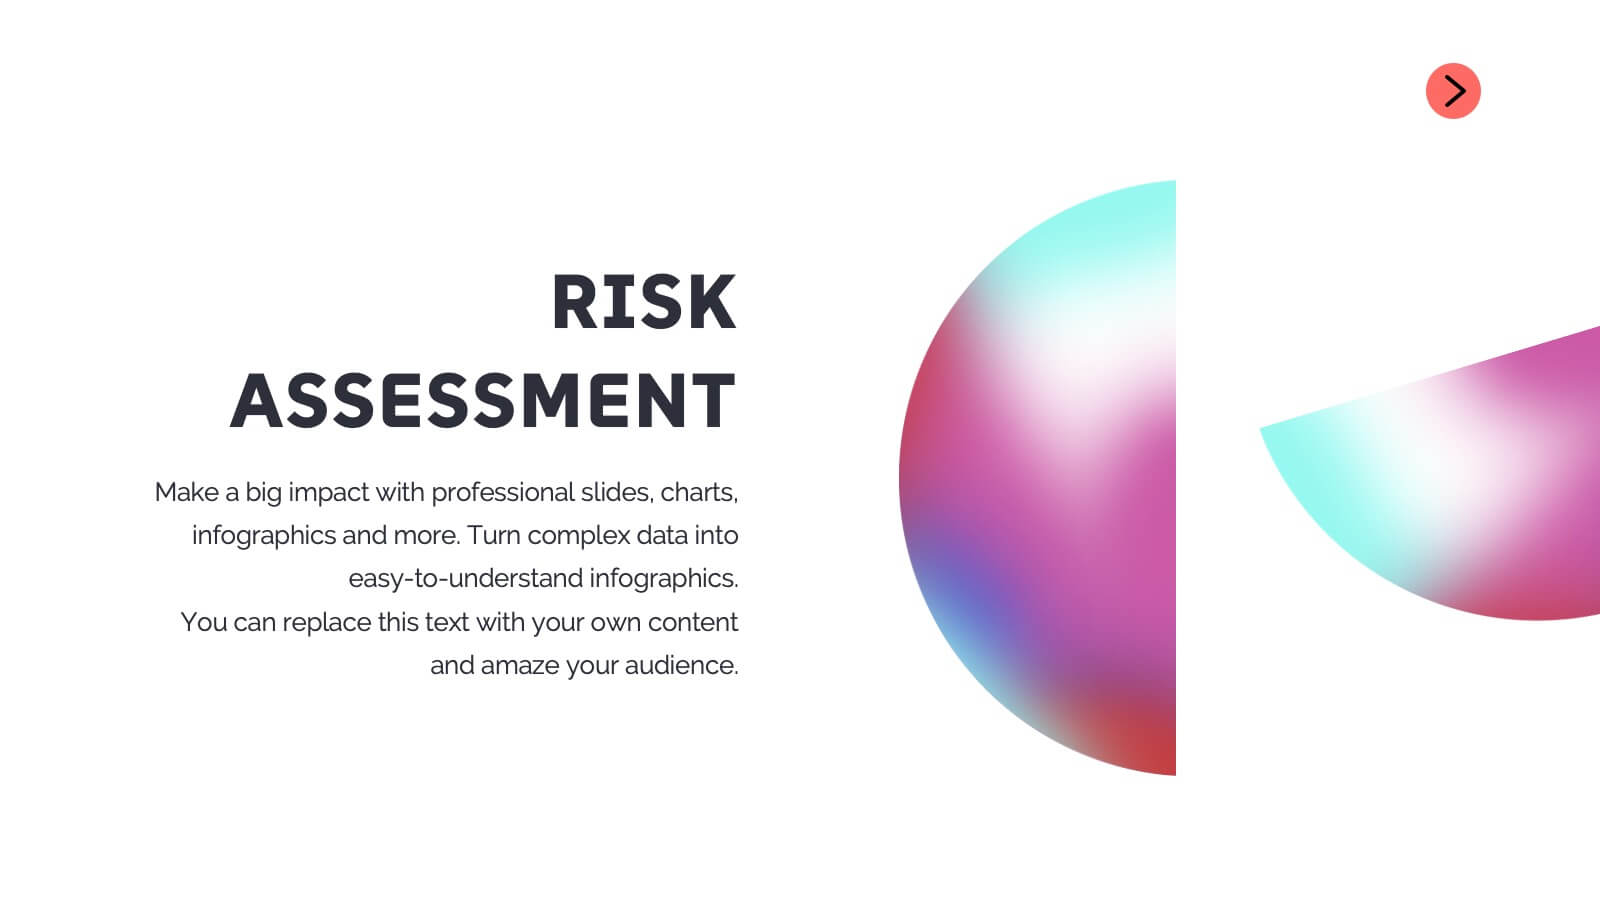
Sphinx Project Status Report Presentation
This modern project status report template is perfect for tracking progress and highlighting key achievements. It includes sections for performance metrics, financial summaries, challenges, and strategic initiatives. Keep stakeholders informed with clear, concise updates. Compatible with PowerPoint, Keynote, and Google Slides for easy customization and presentation.


6 diapositivas
Execution Strategy and Action Plan Breakdown Presentation
Clarify your business roadmap with the Execution Strategy and Action Plan Breakdown Presentation. This template helps visualize each strategic step using a clean, linear layout with colorful icons. Perfect for outlining processes, task flows, or operational plans. Easily editable in Canva, PowerPoint, and Google Slides for maximum flexibility.


6 diapositivas
Experience-Based Smile Indicator Slide
Visualize customer sentiment with the Experience-Based Smile Indicator Slide Presentation. Featuring a clean horizontal scale of five emotive icons—from delighted to dissatisfied—this slide is ideal for summarizing user experience, support ratings, or service feedback. Fully customizable in PowerPoint, Keynote, and Google Slides, it's a smart, visual way to display satisfaction levels.