


Características


¿Tienes alguna pregunta?
Recomendar

22 diapositivas
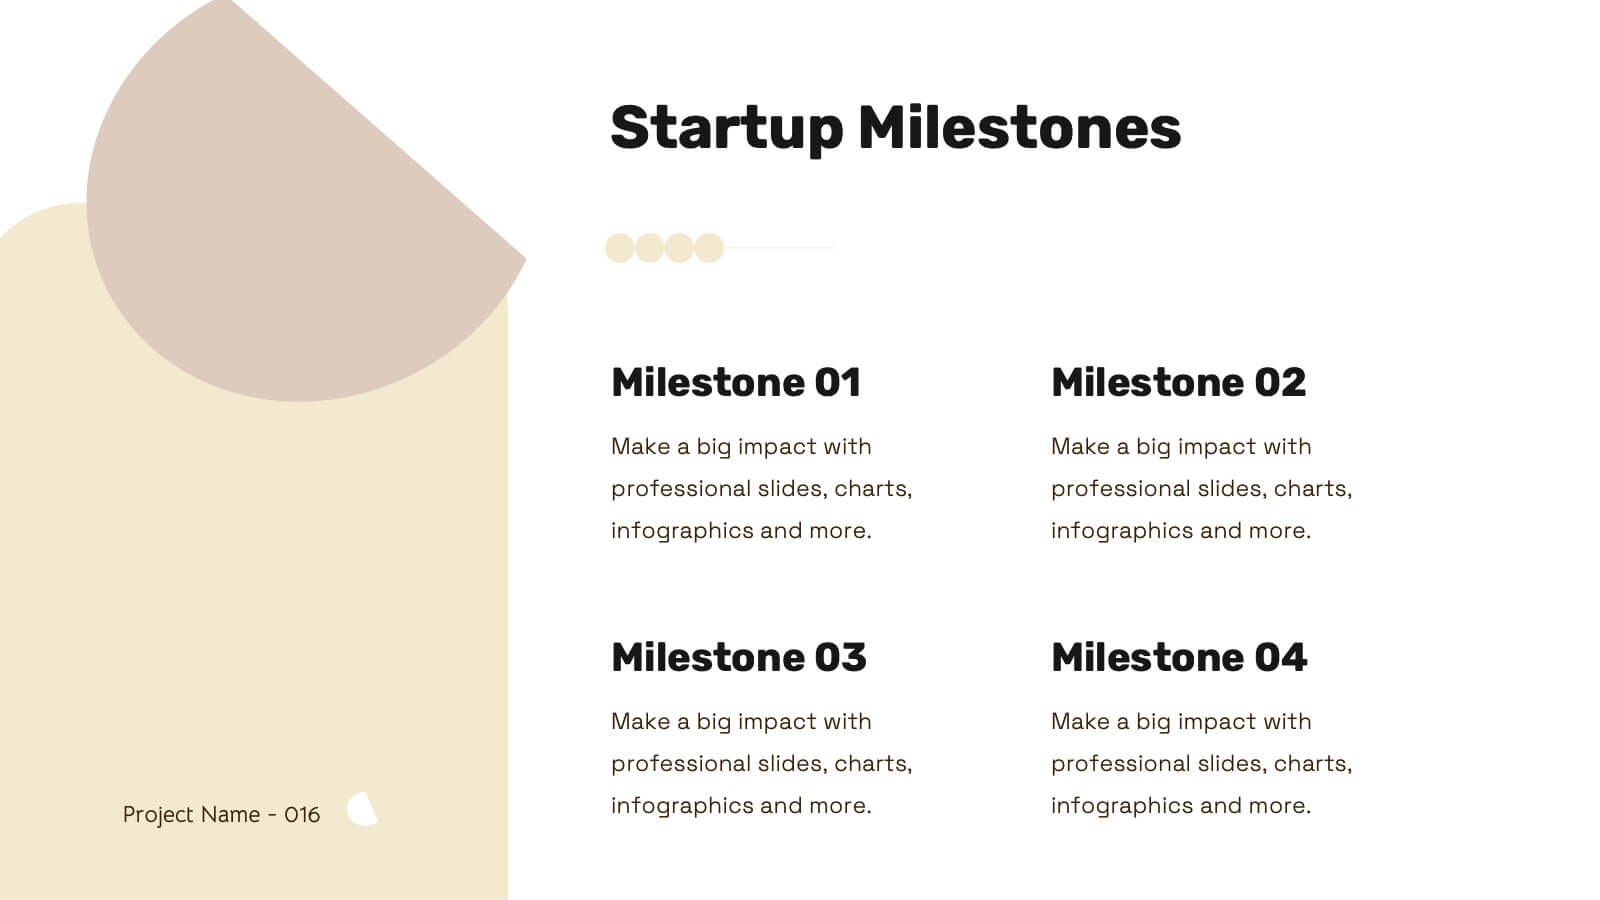
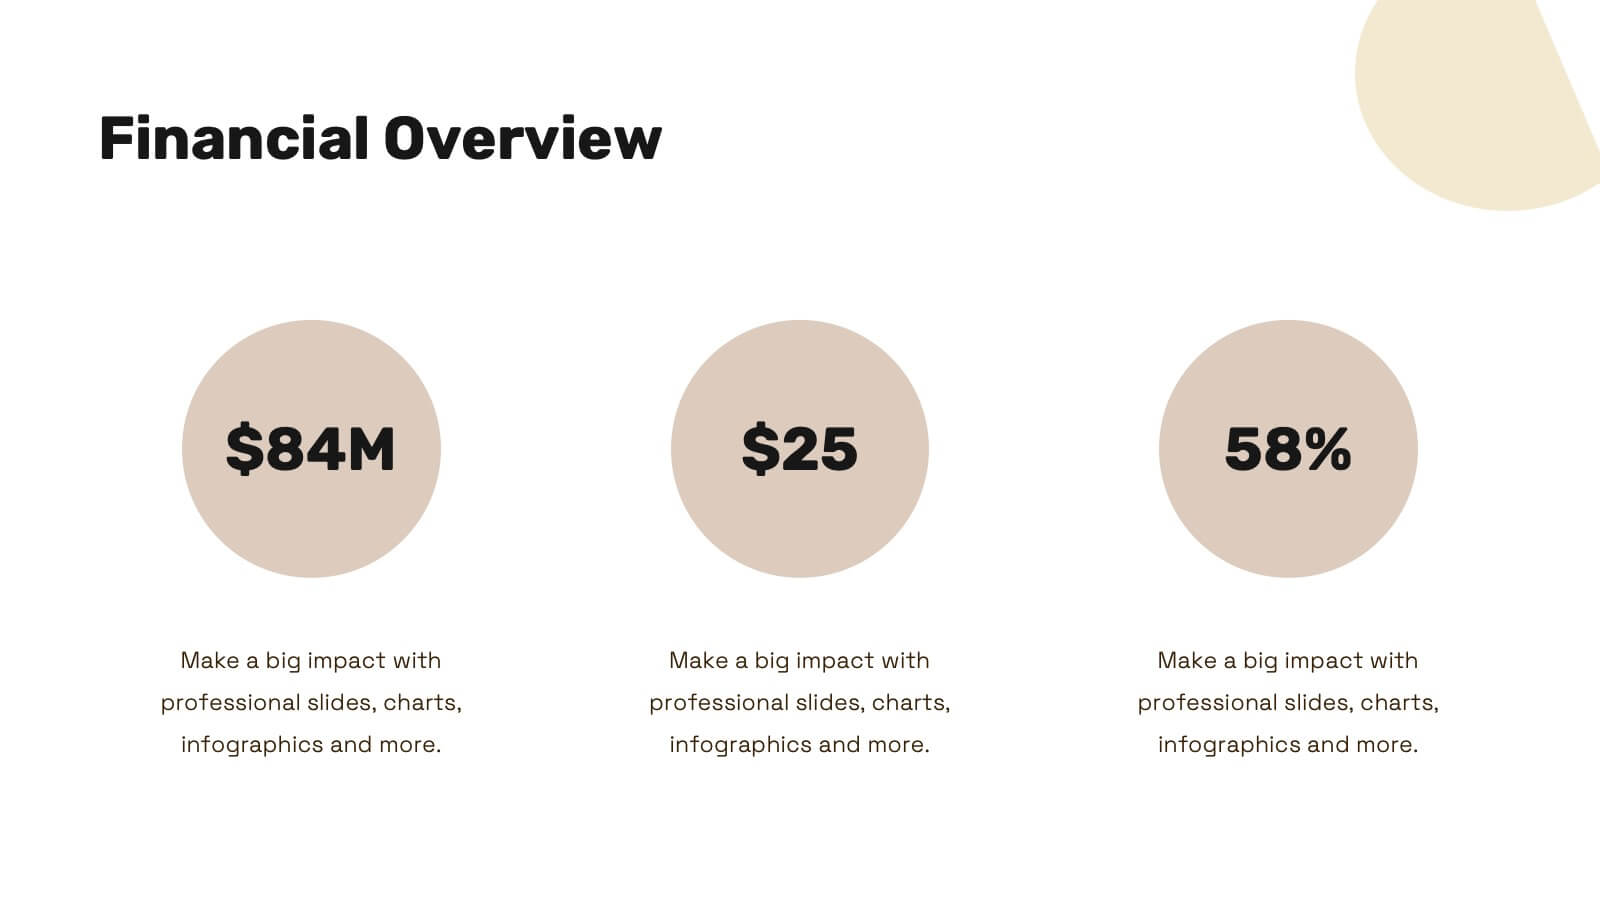
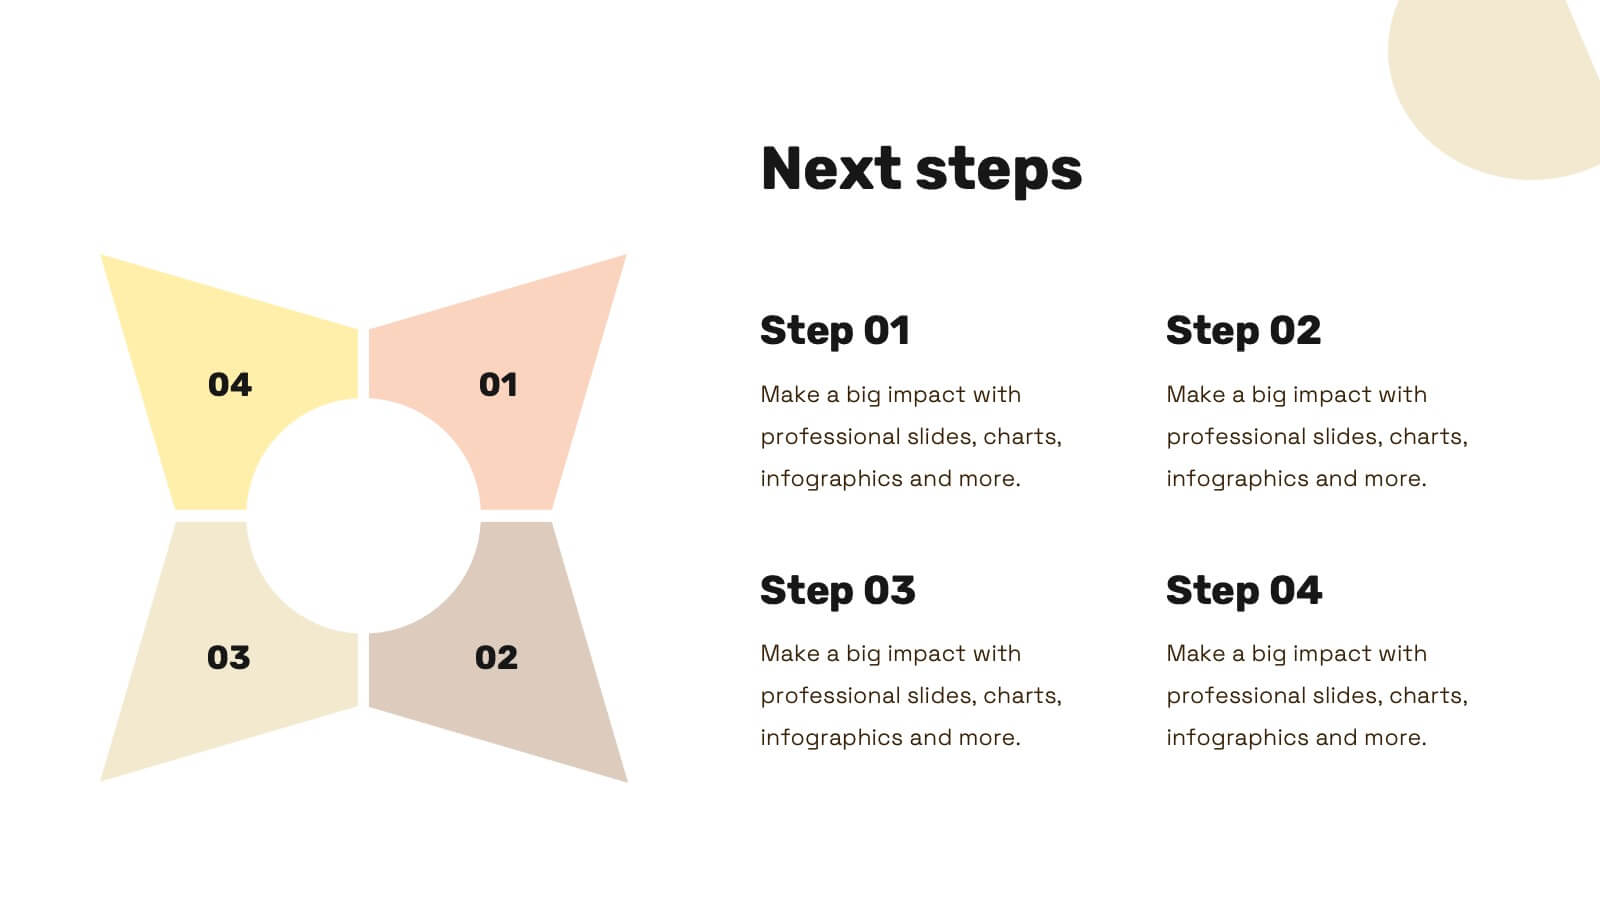
Nova Startup Funding Proposal Presentation
Craft an impressive startup funding proposal with this elegant template. It includes sections for mission, vision, market analysis, business model, and financial overview. Ideal for clear and professional presentations. Fully compatible with PowerPoint, Keynote, and Google Slides for easy customization.


6 diapositivas
Business Benefits Highlights Presentation
Bring your business advantages to life with a vibrant, structured layout that captures attention instantly. This professional design helps you showcase key strengths, achievements, or milestones with clarity and impact. Ideal for company overviews or reports, it’s fully compatible with PowerPoint, Keynote, and Google Slides for easy customization and presentation.


5 diapositivas
Business Innovations Strategy Presentation
Bring your next big idea to life with this modern, visually engaging presentation. Perfect for showcasing creative strategies, innovation frameworks, and growth opportunities, it helps you present your concepts with clarity and flow. Fully customizable and compatible with PowerPoint, Keynote, and Google Slides for a smooth professional experience.


5 diapositivas
Pandemic Prevention and Treatment Options Infographics
Pandemic Prevention is the proactive measures taken to reduce the risk of the spread and impact of infectious diseases on a global scale. These infographic templates are designed to communicate the essential information about pandemic prevention and treatment options. It provides a visually appealing and easy-to-understand overview of key concepts, preventive measures, and treatment options. Use this template to educate and empower your audience with the knowledge needed to navigate pandemics effectively and contribute to public health and safety. This template is perfect for healthcare professionals, educators, and organizations looking to share valuable information.


20 diapositivas
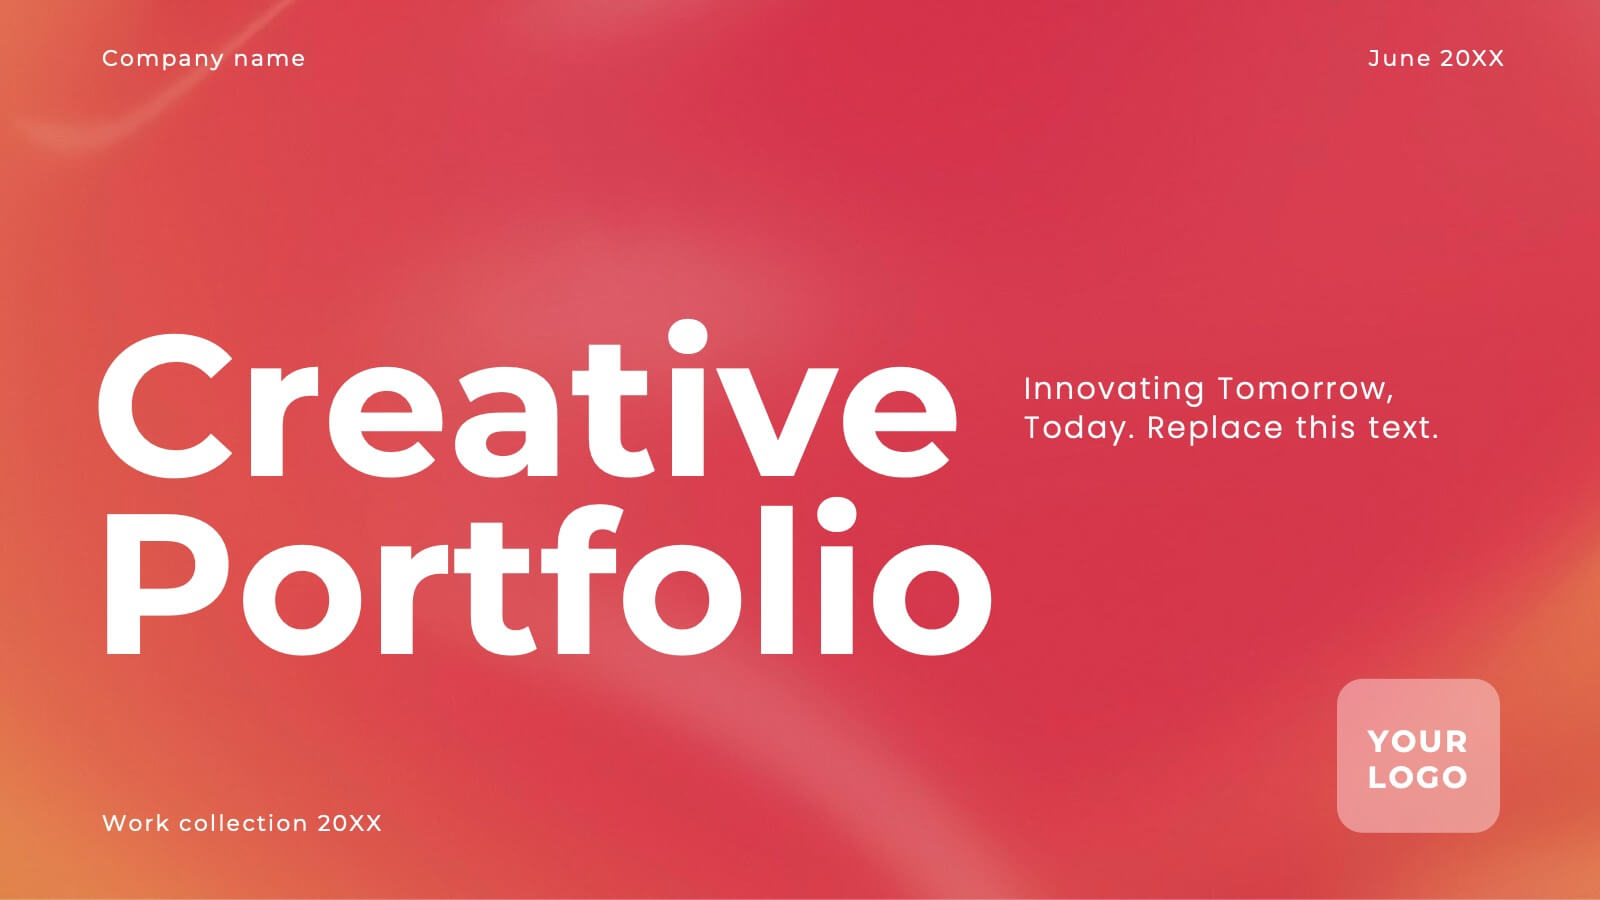
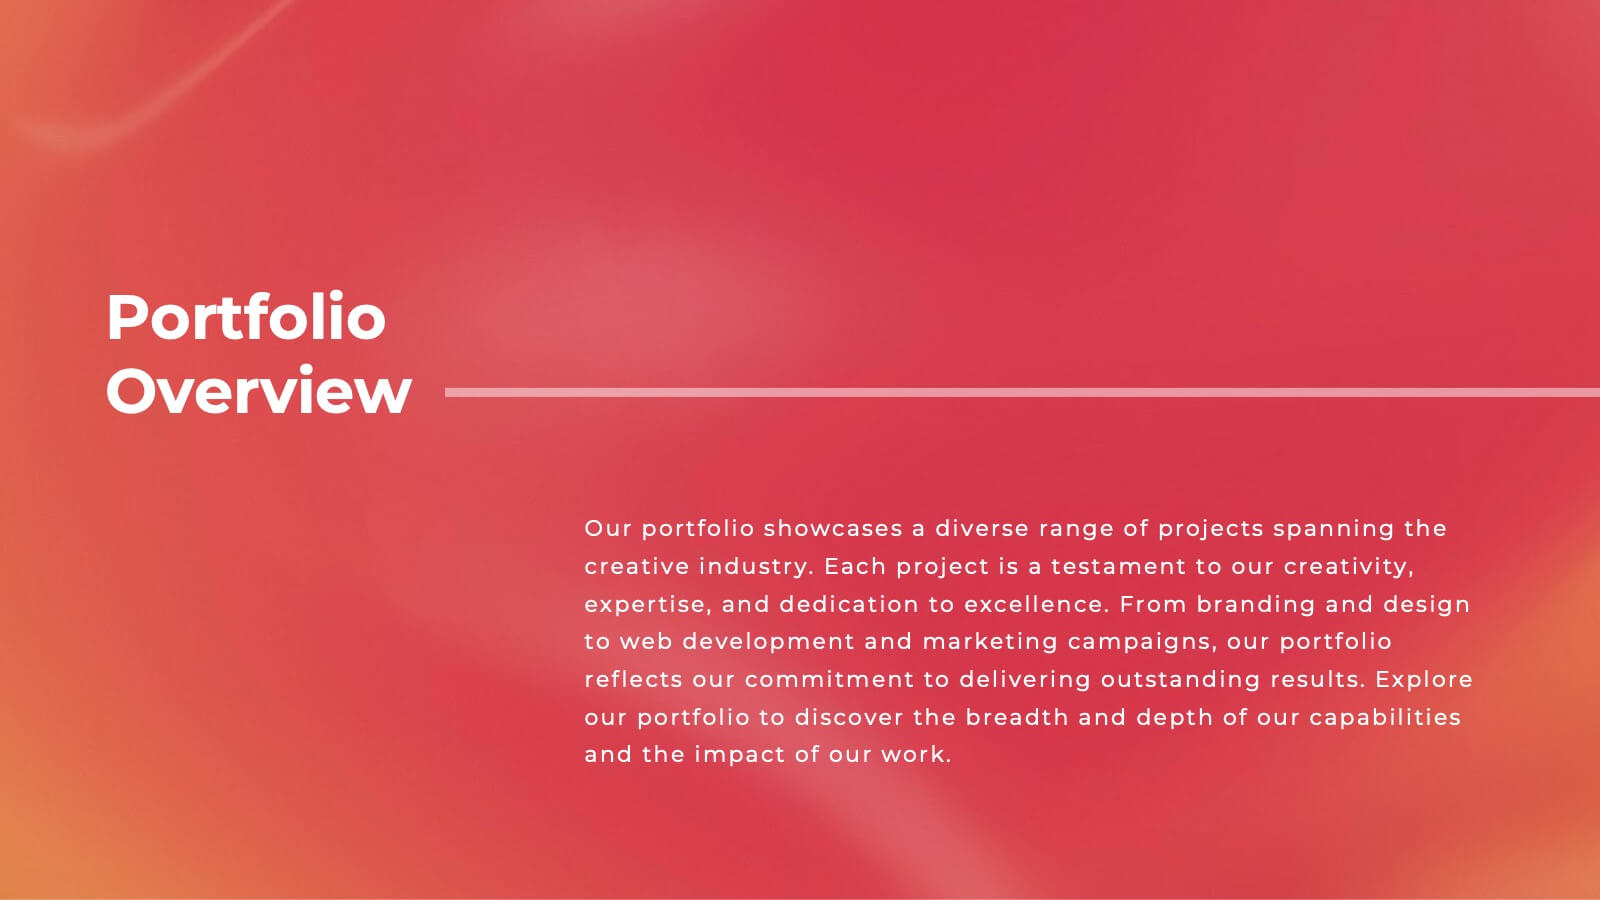
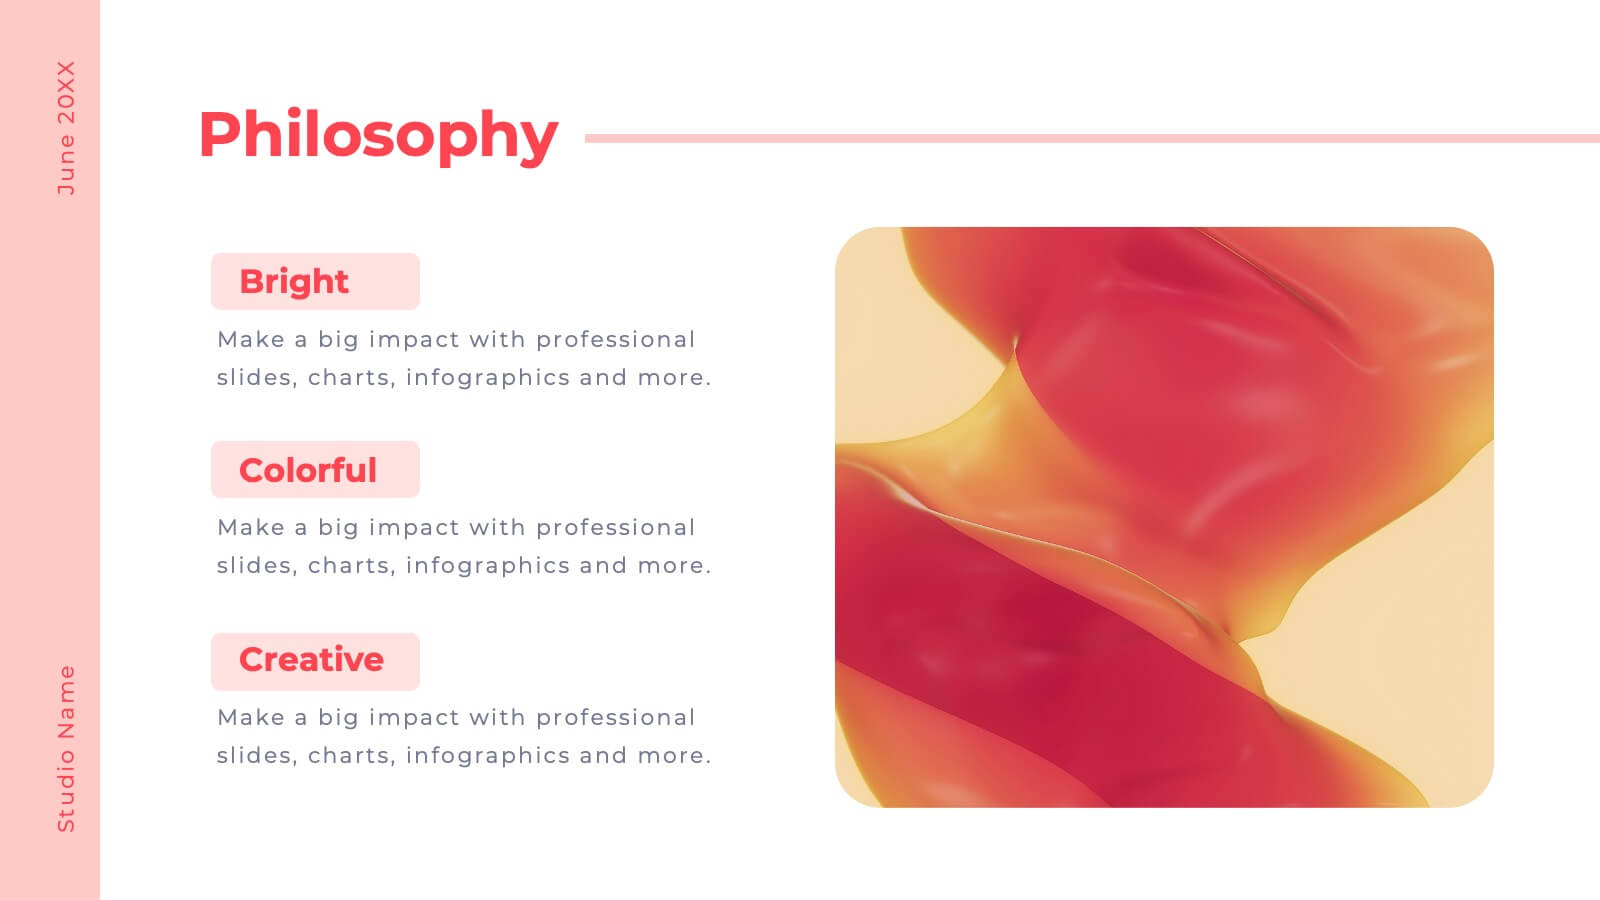
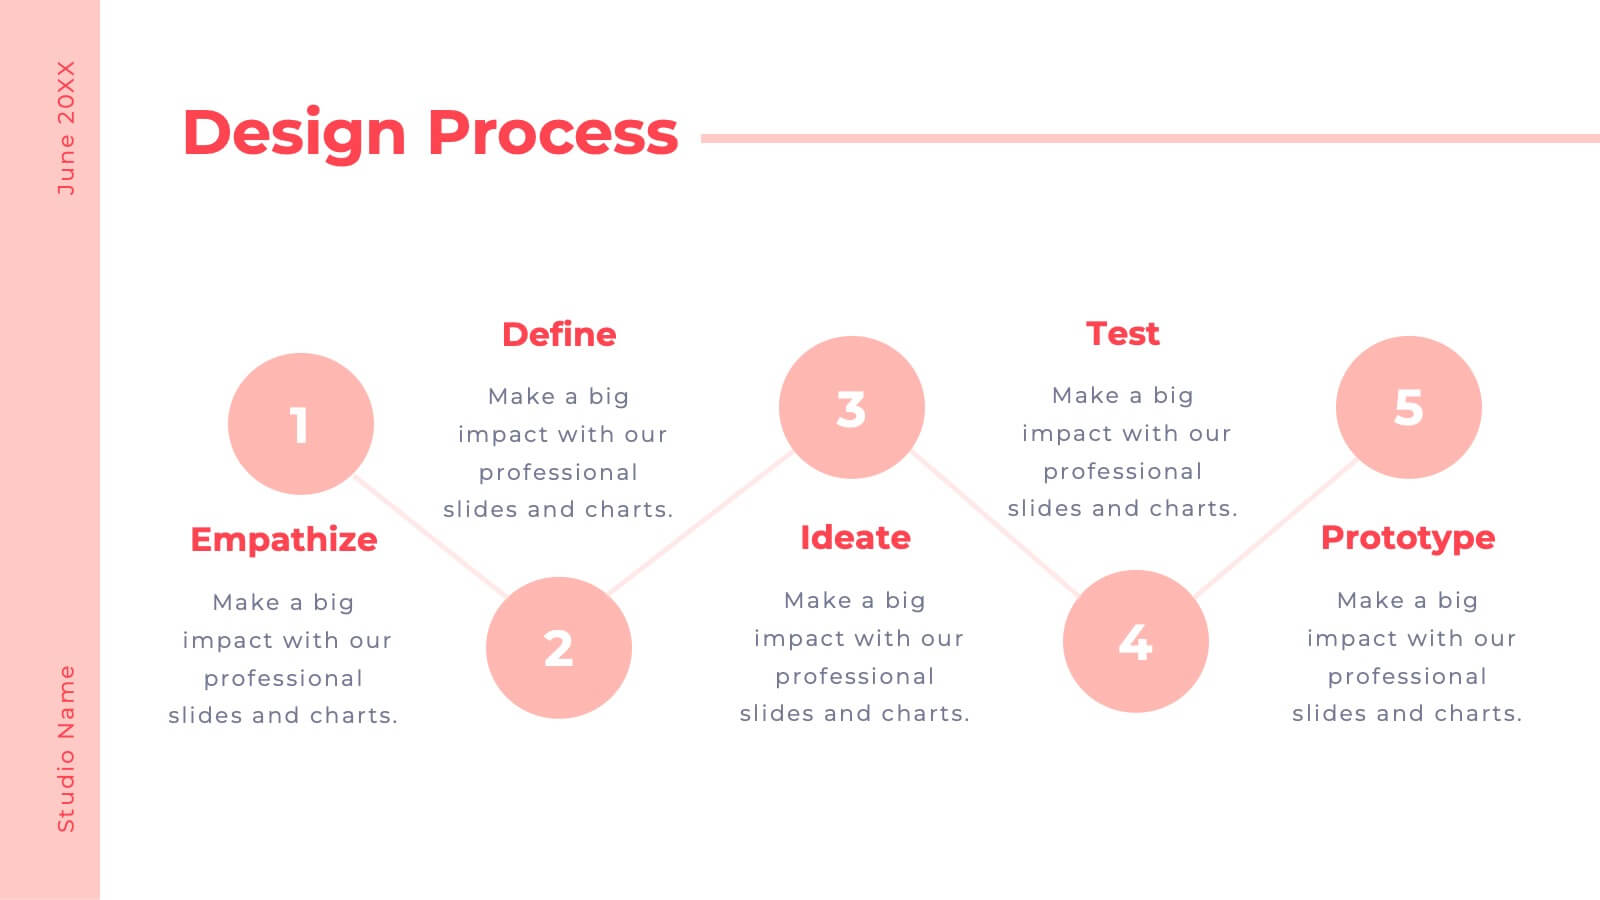
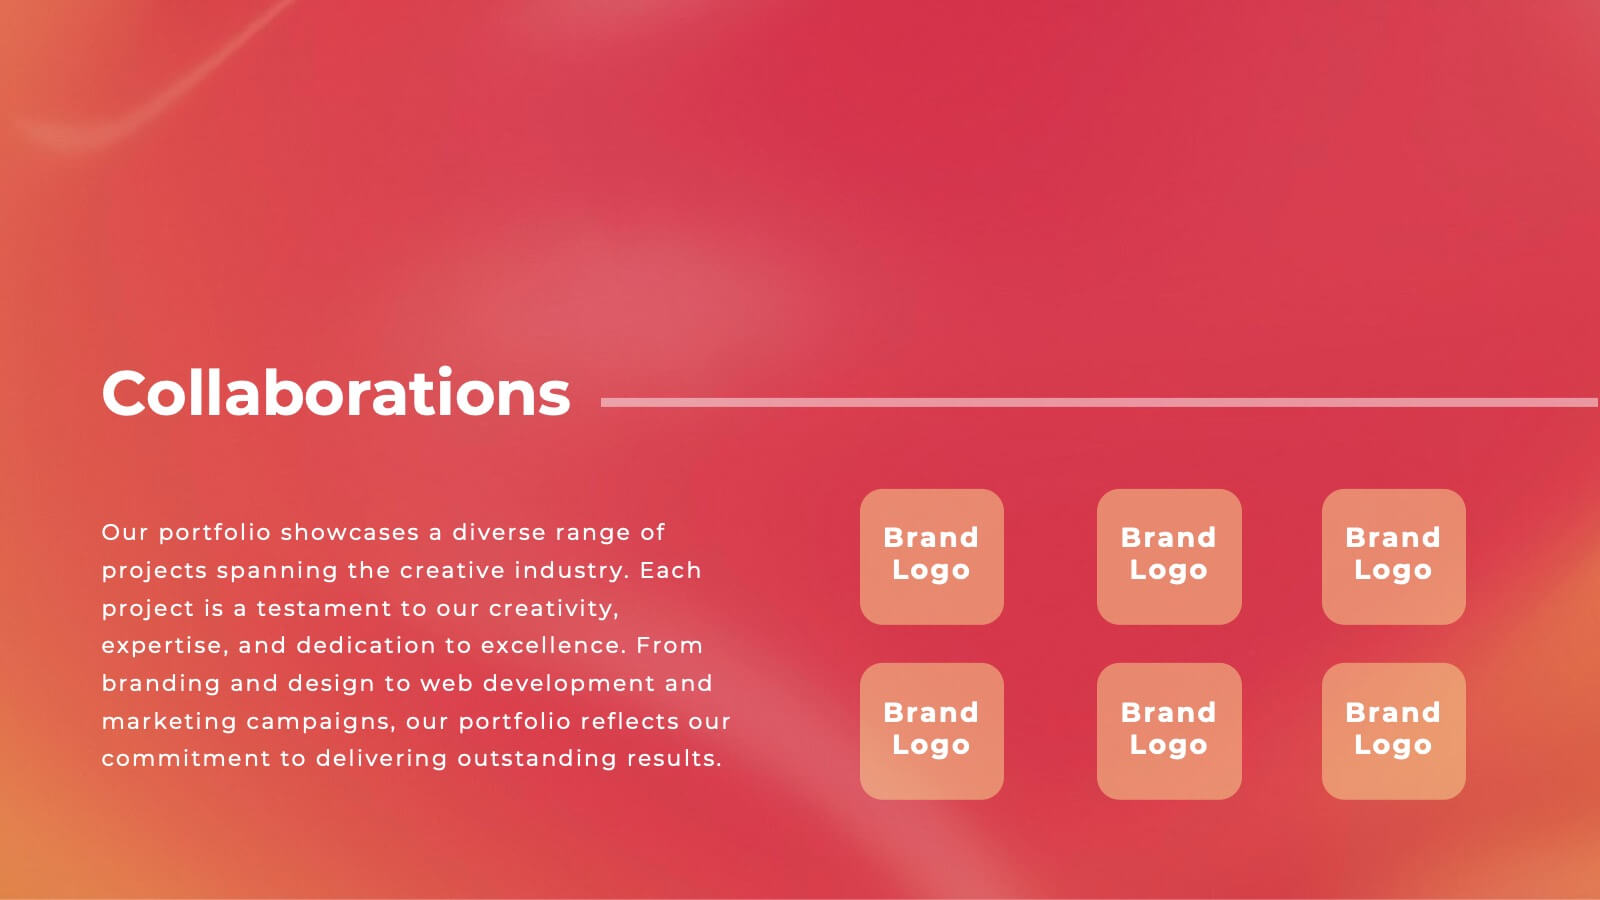
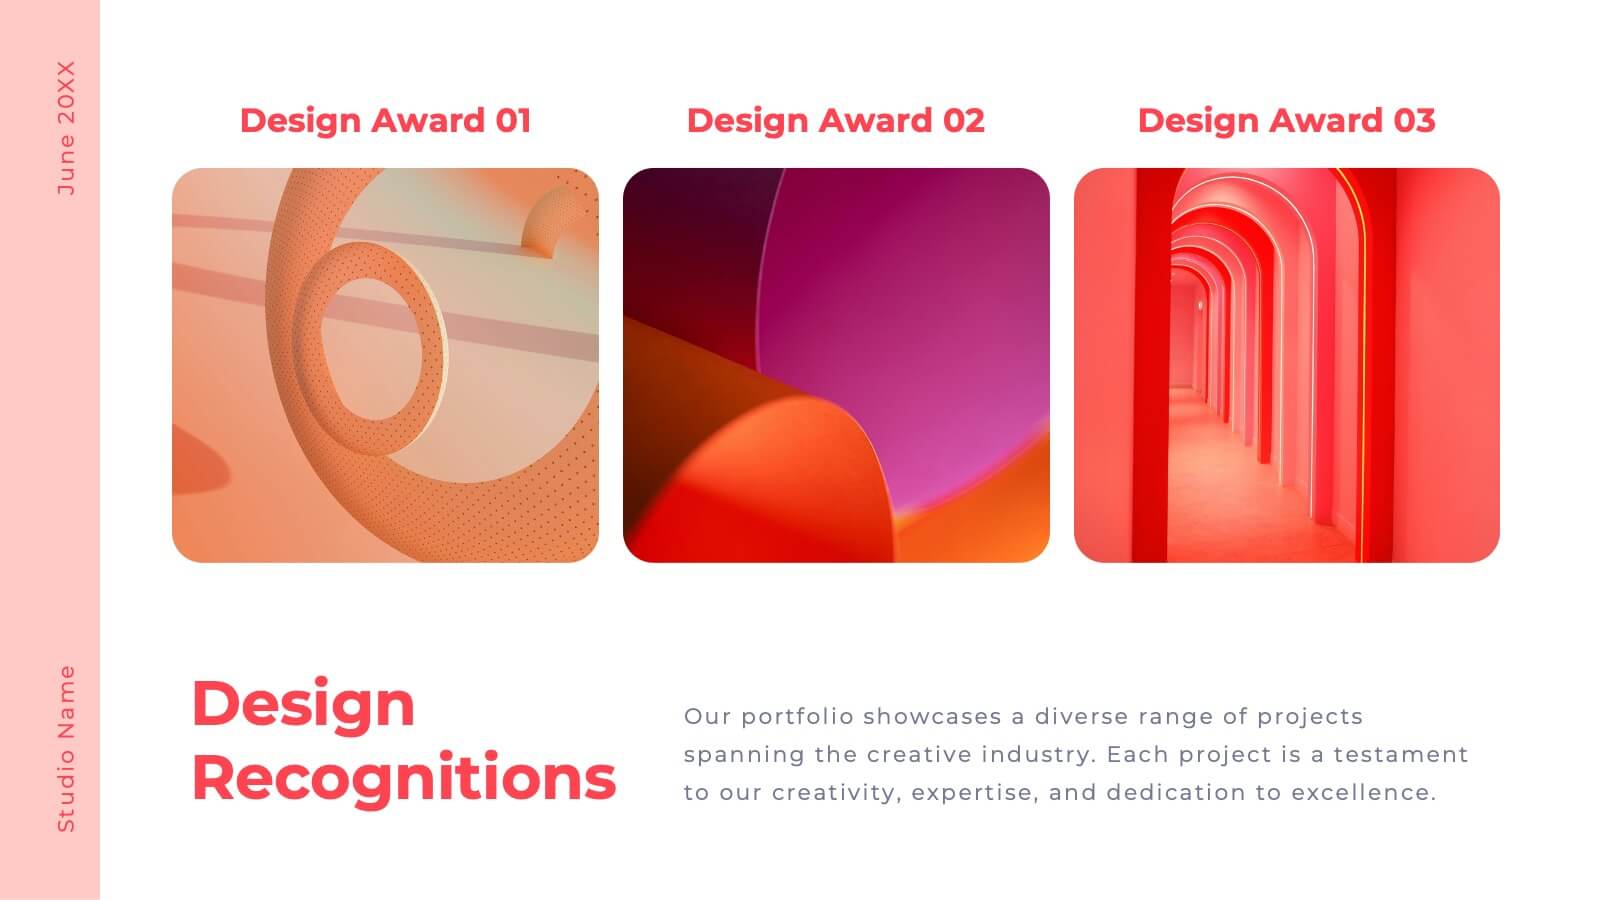
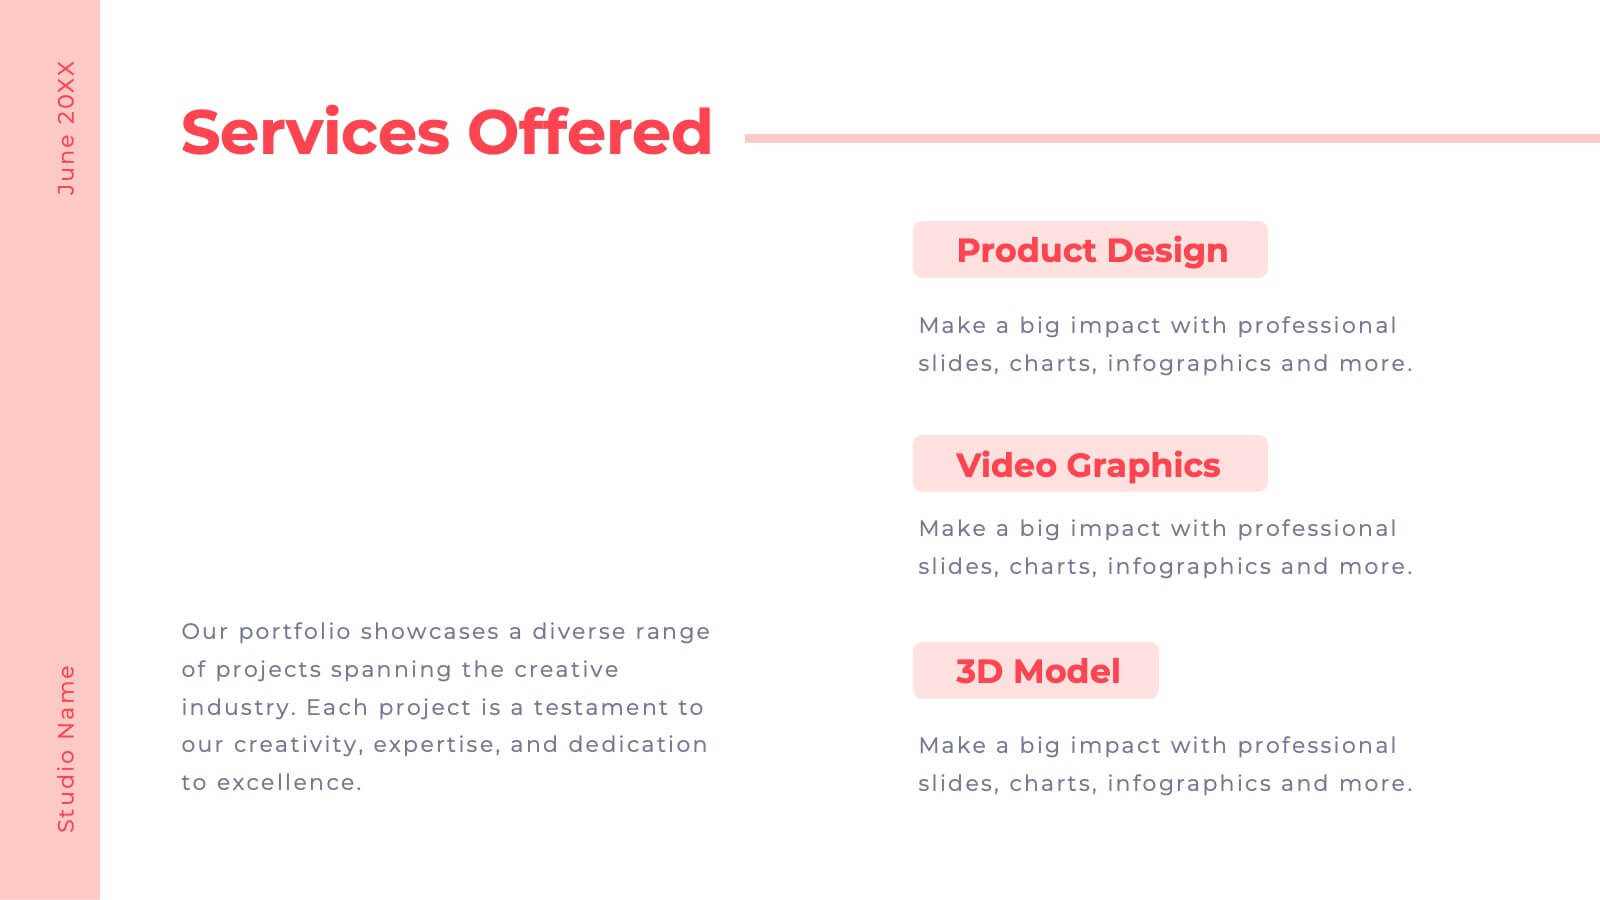
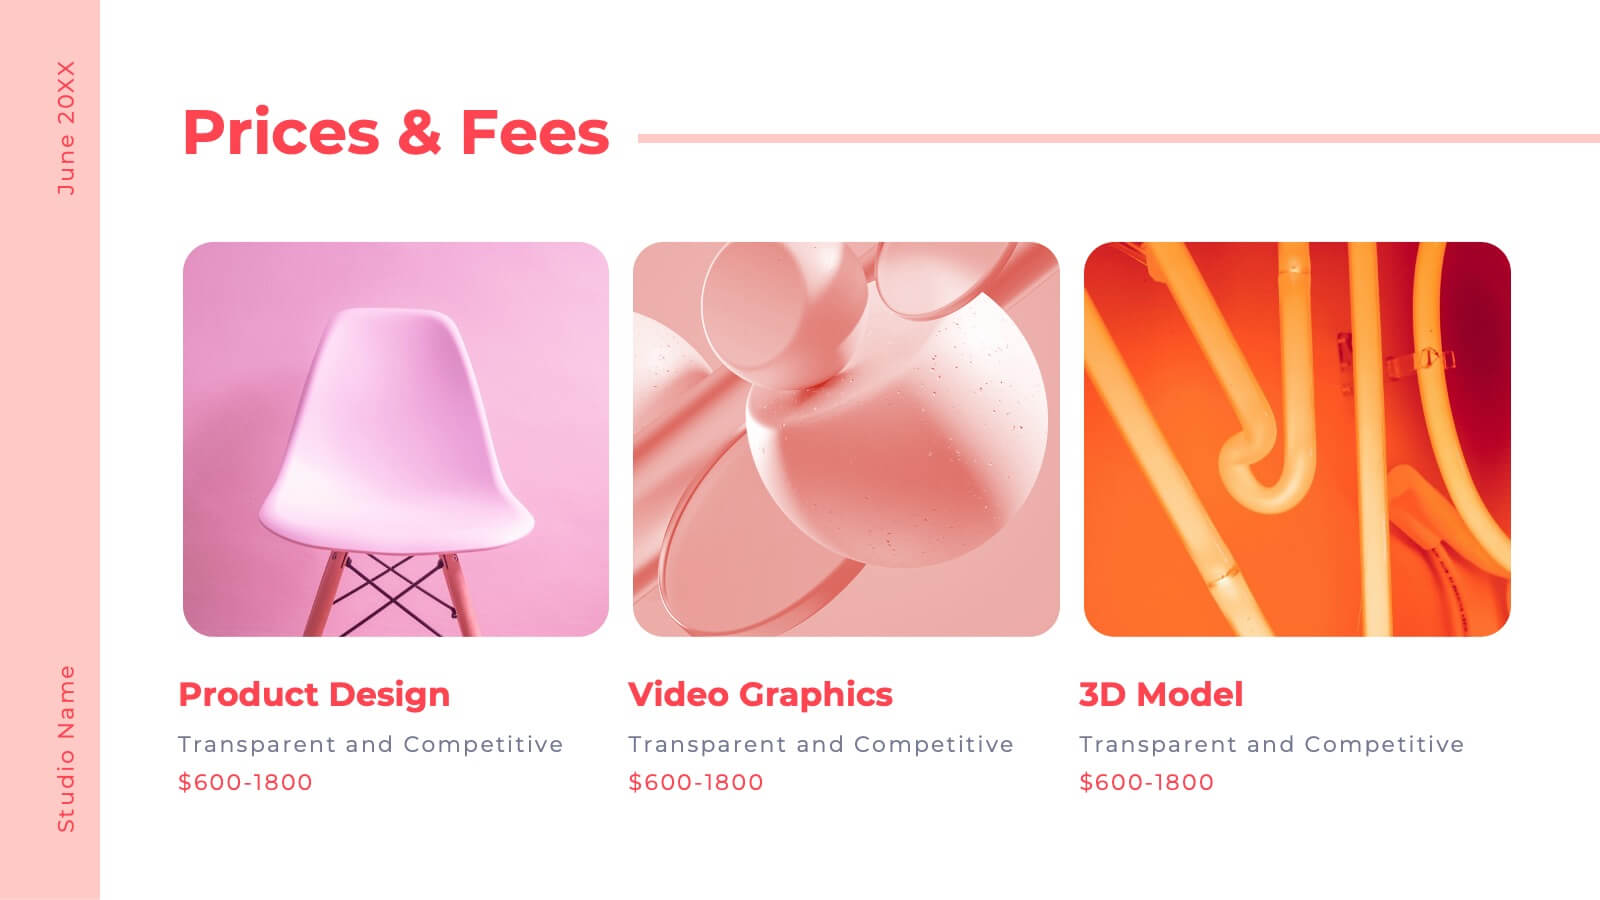
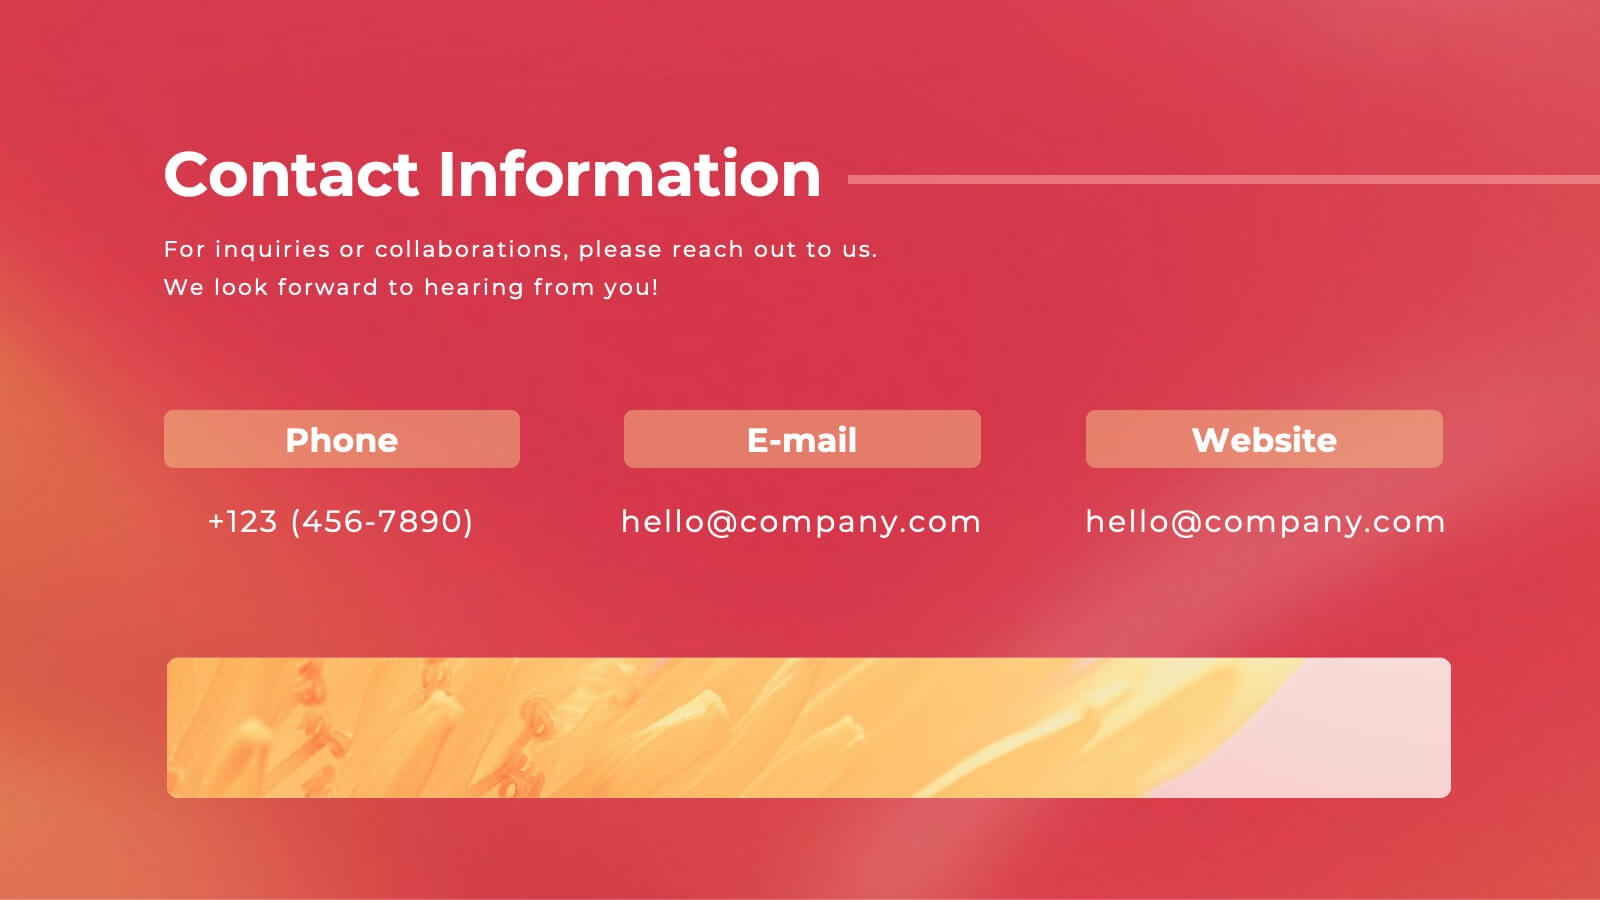
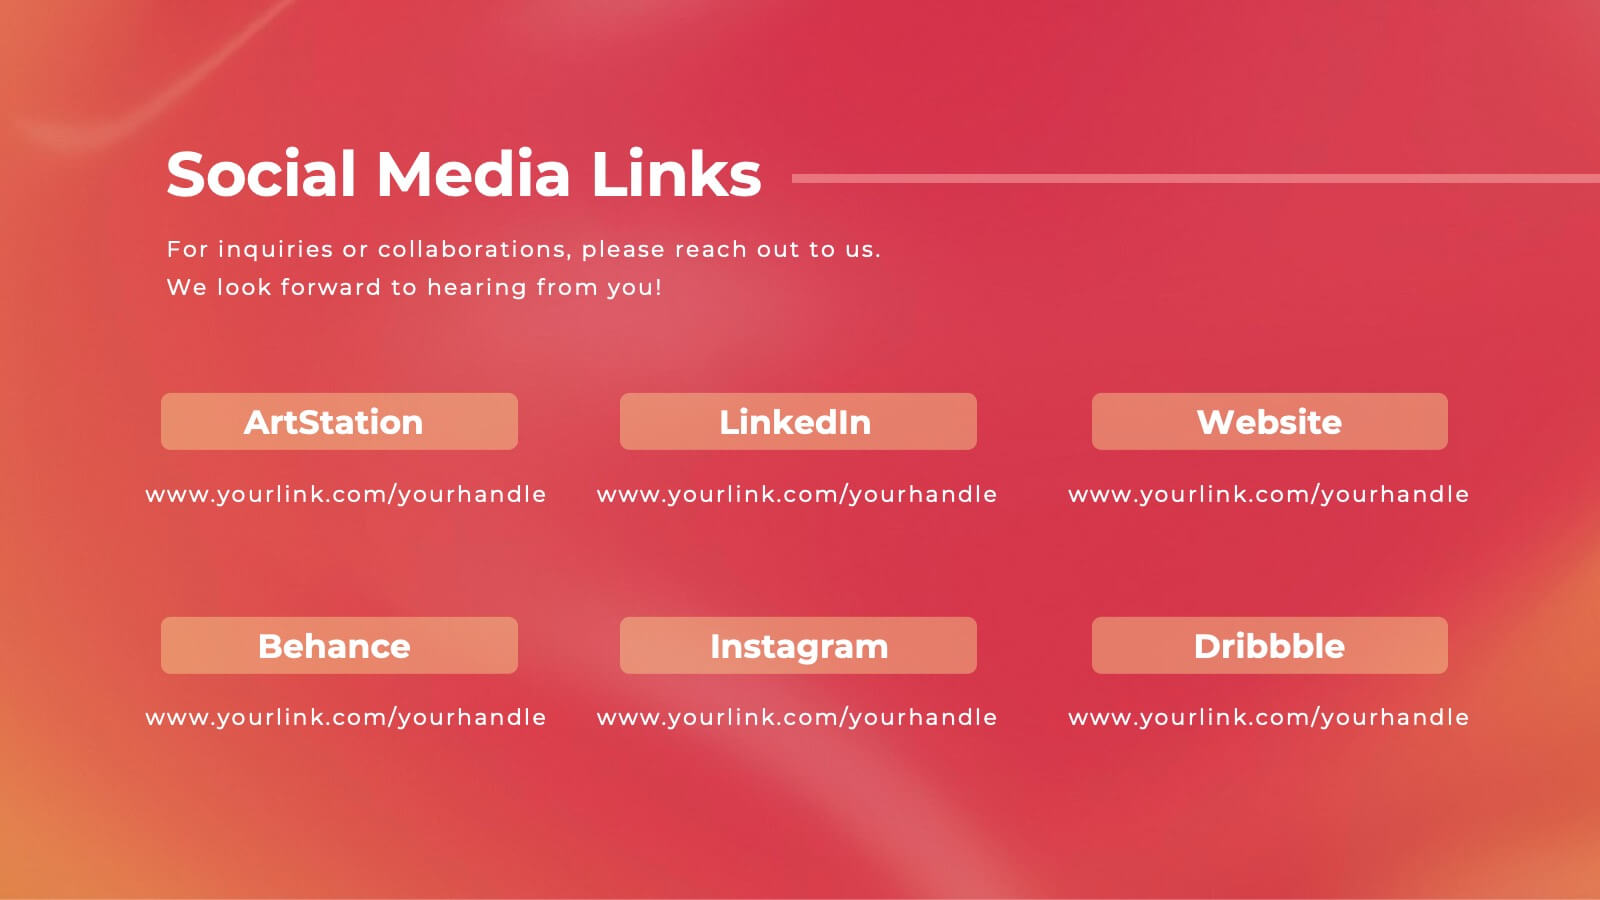
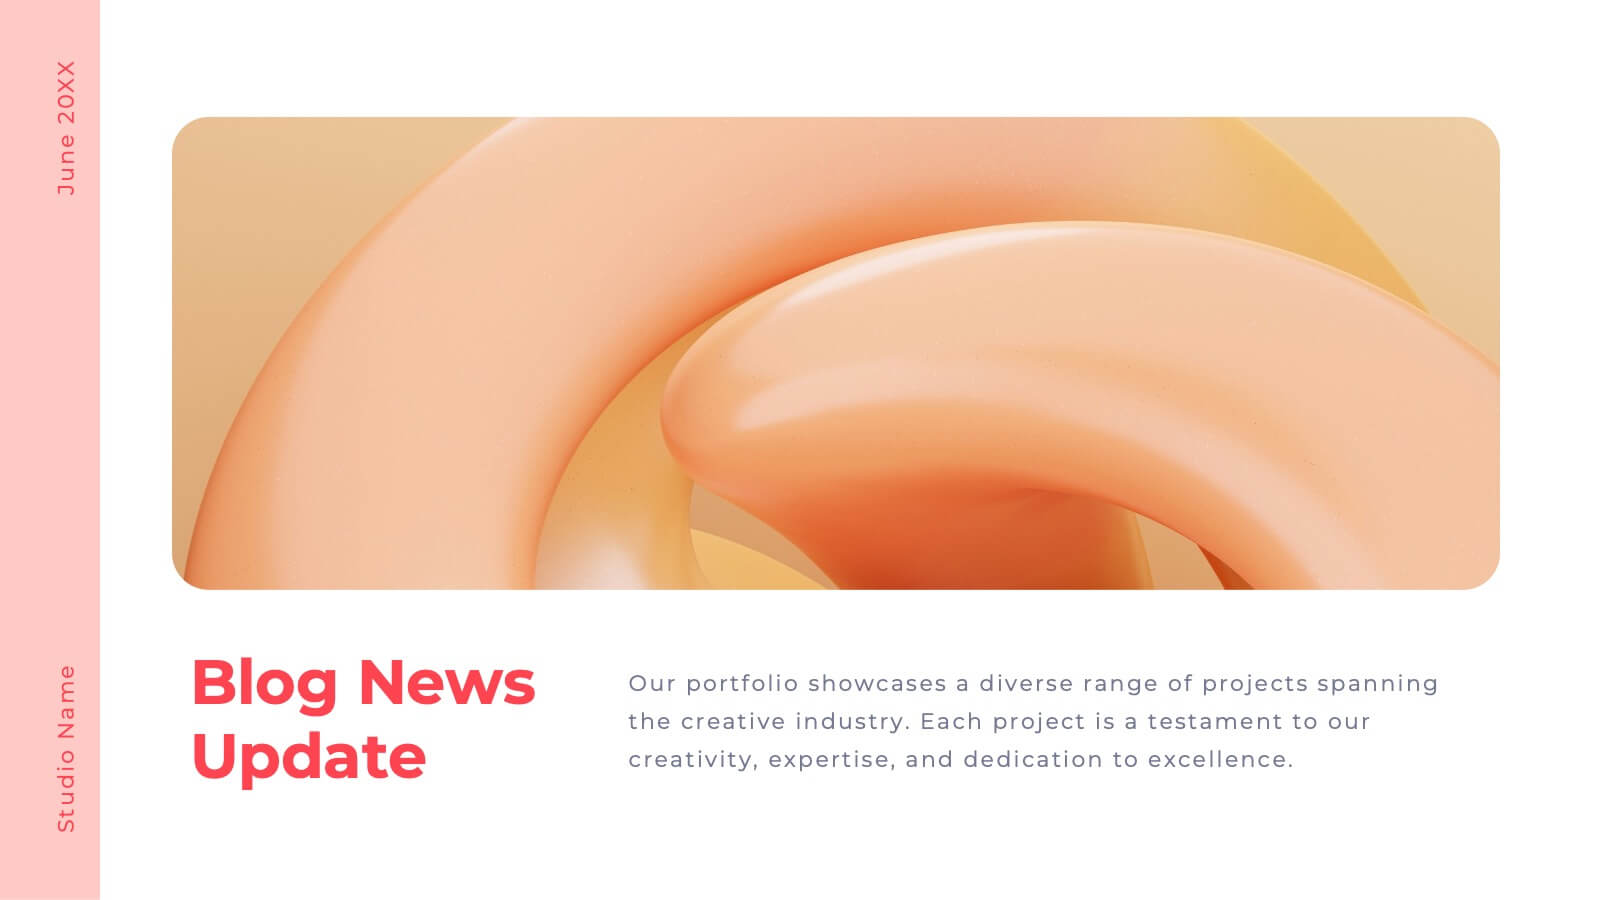
Valor Creative Portfolio Presentation
Step into creativity with this stunning portfolio template! Showcase your projects, design philosophy, and client testimonials with style and flair. Ideal for designers, artists, and creatives wanting to impress. Compatible with PowerPoint, Keynote, and Google Slides, this template elevates every portfolio to new heights. Perfect for making a lasting impact.


5 diapositivas
Risk and Return Investment Presentation
Navigate the high seas of finance with our captivating infographic presentation template, designed to visually break down the complex relationship between risk and return in investments. This template simplifies presenting key data points, making it ideal for financiers and investors looking to make informed decisions. Each slide is meticulously crafted to ensure clarity and impact, highlighting the balance of potential rewards against possible risks. Perfect for use in PowerPoint, Keynote, and Google Slides, this template is a must-have tool for anyone in the financial sector aiming to convey their strategy with precision and flair.


4 diapositivas
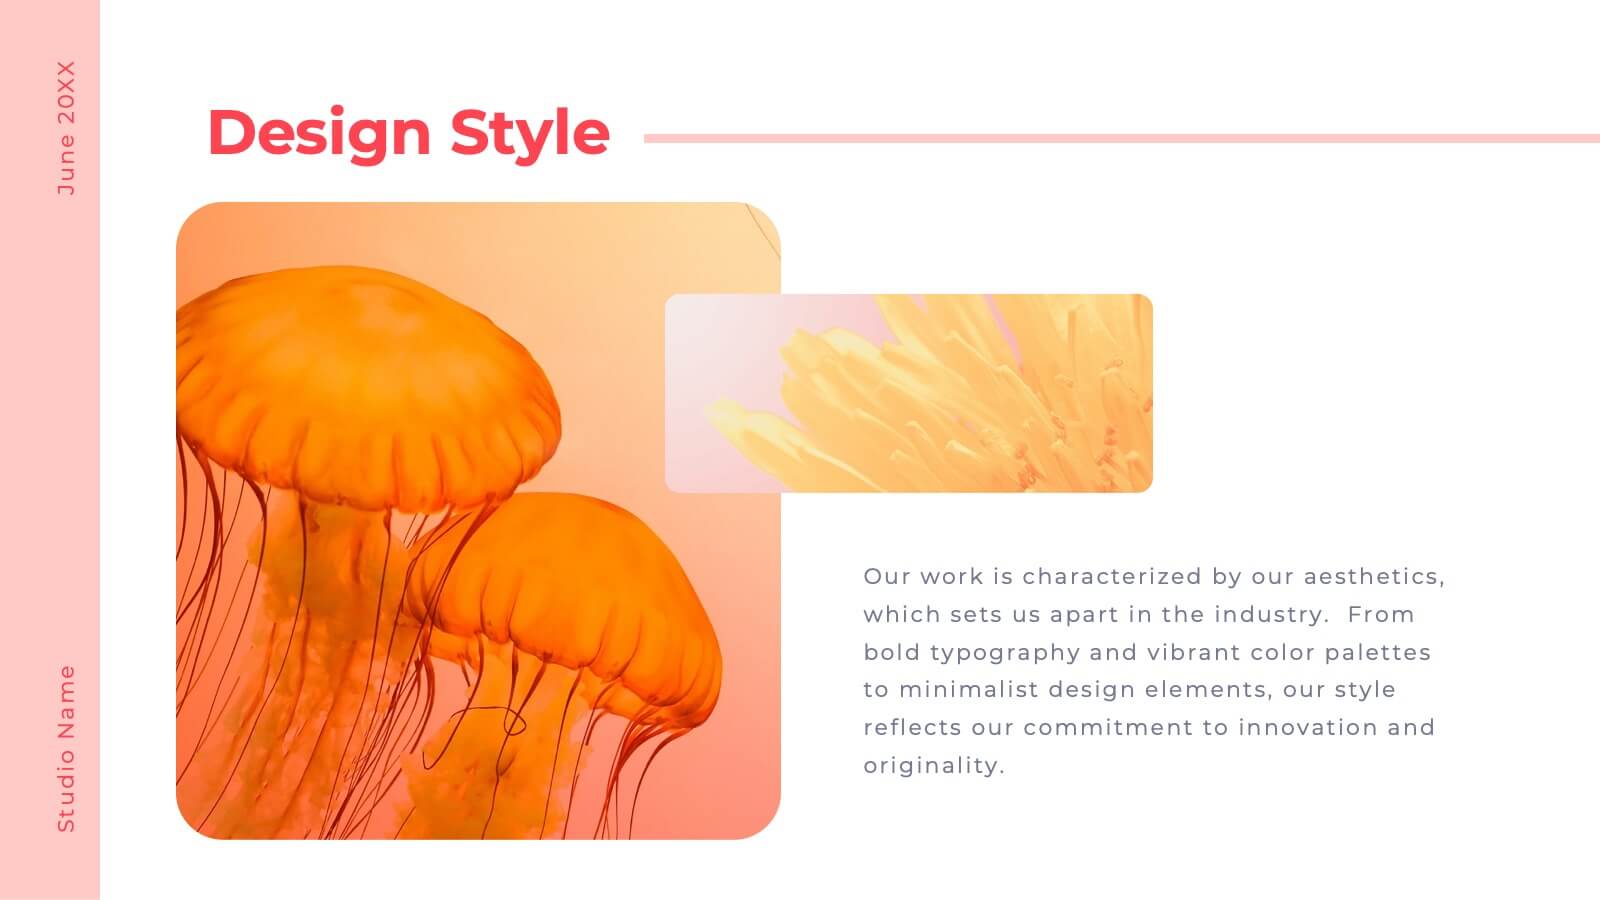
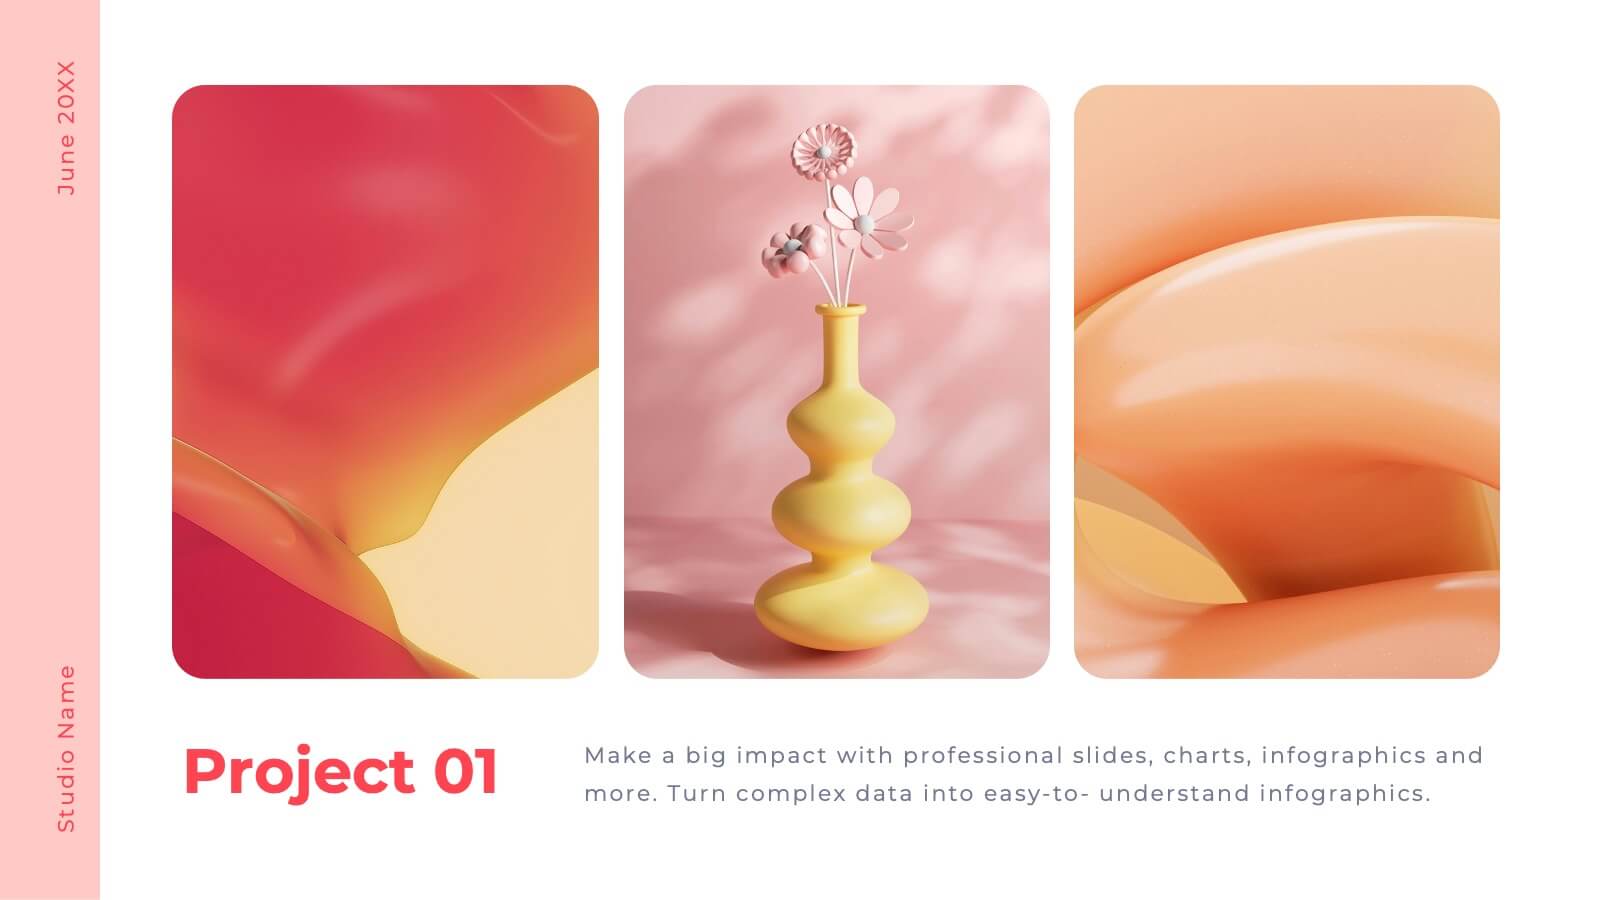
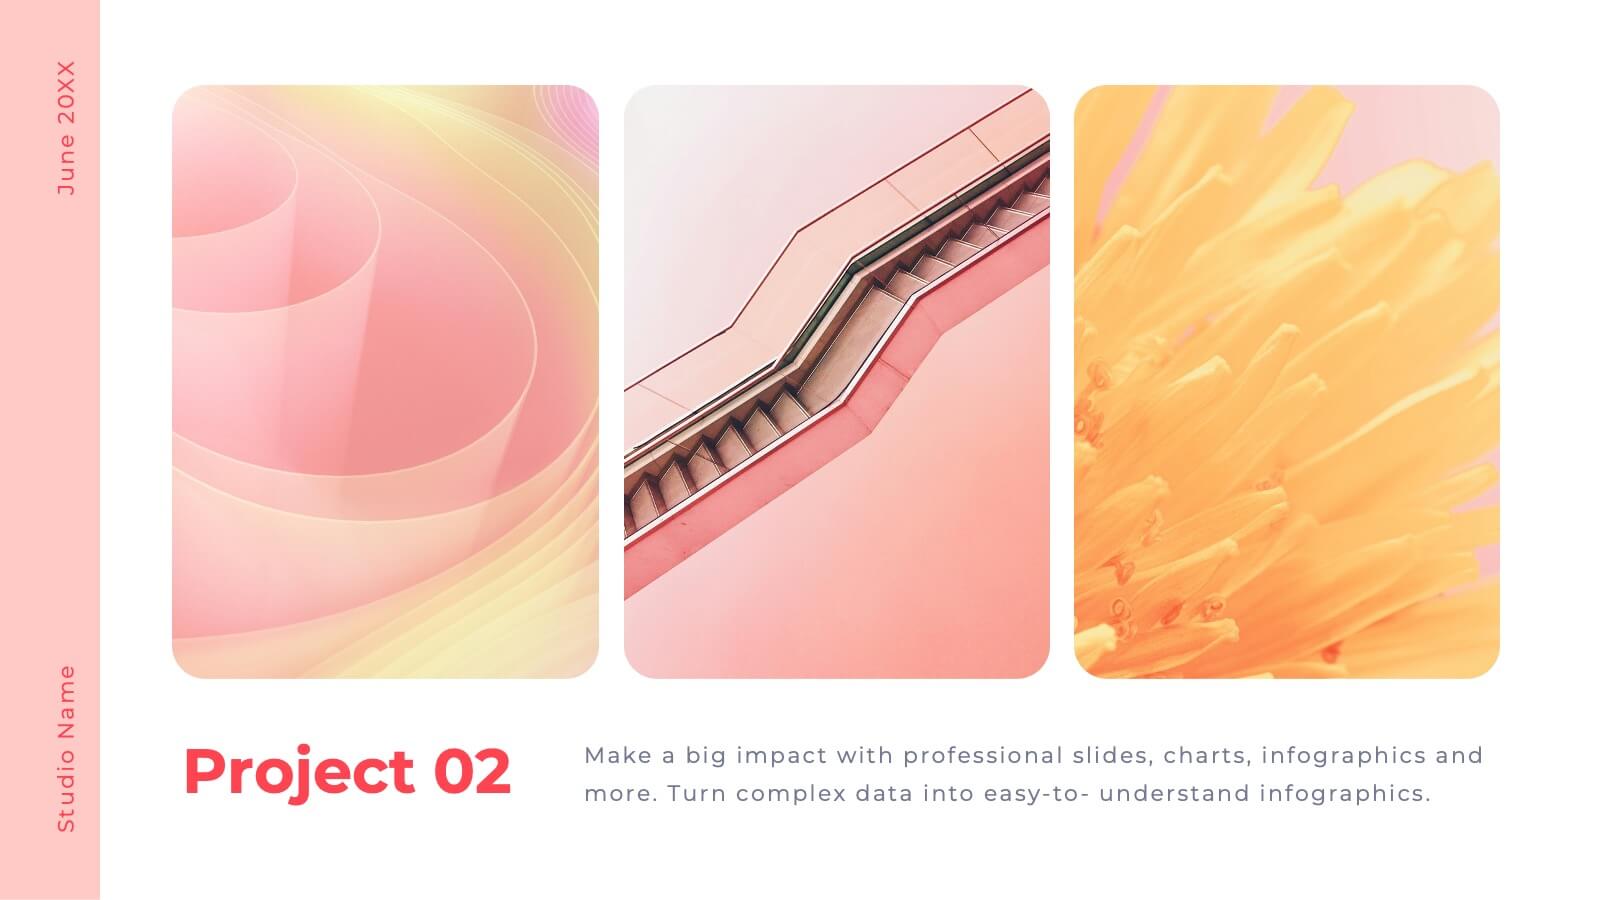
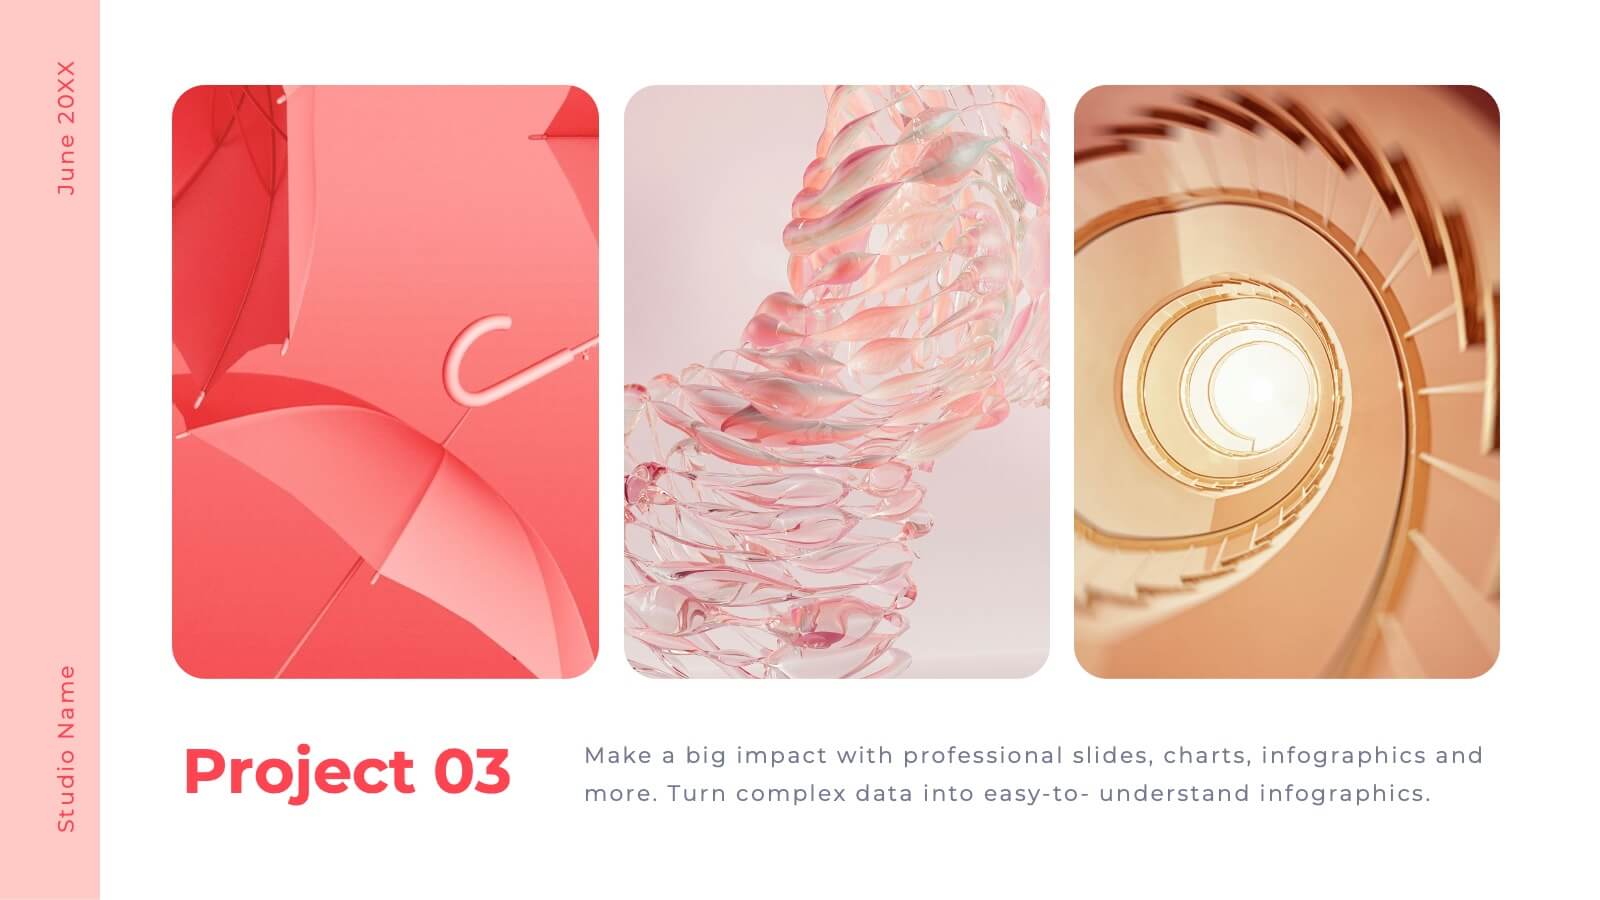
Artistic Watercolor Background Presentation
Add a creative flair to your slides with this Artistic Watercolor Background template. Featuring soft gradients and fluid brushstroke visuals, it's perfect for showcasing concepts in a stylish, modern way. Fully editable in PowerPoint, Keynote, and Google Slides—ideal for design-driven pitches, personal projects, or creative business storytelling.


6 diapositivas
Scientific Experiment Presentation Template Presentation
Showcase your research with clarity using this Scientific Experiment Presentation Template. Featuring lab-themed visuals like microscopes and molecular diagrams, it’s perfect for sharing hypotheses, procedures, and results. Ideal for science professionals and students, this editable deck works seamlessly with PowerPoint, Keynote, and Google Slides for compelling, educational presentations.


5 diapositivas
Customer Behavior Pathway Visualization Presentation
Illustrate each step in the decision-making journey with this Customer Behavior Pathway Visualization presentation. Designed with directional arrows and dotted flow markers, this slide helps you map behavioral patterns across key stages—from awareness to loyalty. Ideal for sales, marketing, or UX teams. Fully editable in PowerPoint, Canva, and Google Slides.


6 diapositivas
Mission and Values Overview Presentation
Your company's purpose deserves a visually stunning story! This infographic presentation template helps you clearly outline core values and mission statements with an engaging, structured design. Ideal for business strategy meetings, corporate presentations, and branding discussions, it keeps your content professional and impactful. Fully customizable and compatible with PowerPoint, Keynote, and Google Slides.


7 diapositivas
Strategy Investment Wheel Infographic
The Strategy Wheel is a visual tool and framework used in strategic management to help organizations align their strategies, goals, and initiatives. This infographic template is designed to act as your compass, guiding you through the intricate pathways of investment strategies. This template brings forth the core concepts and strategic directions, ensuring you're well-equipped to steer your investment journey effectively. Compatible with Powerpoint, Keynote, and Google Slides. This infographic is depicted as a circular diagram divided into segments, each representing a key aspect of the organization's strategy.


5 diapositivas
Sales and Revenue KPI Snapshot Presentation
Present your top metrics with this clean Sales and Revenue KPI Snapshot slide. Display up to four key performance indicators using icons, percentage bars, and customizable labels. Ideal for business reviews, marketing updates, and executive dashboards. Fully editable in PowerPoint, Keynote, and Google Slides for seamless integration.


4 diapositivas
Patient Care Plan and Metrics Presentation
Turn healthcare data into meaningful stories with this modern and professional presentation. Perfect for highlighting patient progress, clinical outcomes, and care efficiency, it balances visuals and data for clarity and impact. Easy to edit and fully compatible with PowerPoint, Keynote, and Google Slides for smooth customization.


6 diapositivas
Responsive Design Display with Devices Presentation
Highlight your multi-device experience with the Responsive Design Display with Devices Presentation. This clean and modern layout features a central monitor and mobile phone illustration, surrounded by five customizable text points—ideal for showing key features or compatibility. Fully editable in Canva, PowerPoint, Keynote, and Google Slides.


13 diapositivas
Key Performance Indicators (KPI) Presentation
Track success with the Key Performance Indicators (KPI) Presentation template. This data-driven layout showcases essential metrics, from social media engagement to financial performance, helping you visualize progress and optimize strategies. Perfect for business reports, marketing analysis, and executive dashboards. Fully customizable in PowerPoint, Keynote, and Google Slides for seamless integration into your workflow.


5 diapositivas
Infographic Business Charts Presentation
Bring your data to life with a bold, visual storytelling layout designed to make insights instantly clear and impossible to ignore. This presentation highlights key metrics using clean, modern business charts that simplify comparisons and trends for any audience. Fully compatible with PowerPoint, Keynote, and Google Slides.


5 diapositivas
Athletic Performance Stats Presentation
Experience a dynamic way to showcase progress with this clean, athlete-inspired presentation design. It helps simplify performance insights, highlight key metrics, and communicate training results with clarity and impact. Ideal for sports reports, fitness reviews, or coaching updates, this professional presentation is fully compatible with PowerPoint, Keynote, and Google Slides.