


Características


¿Tienes alguna pregunta?
Recomendar


6 diapositivas
5-Year Financial Forecast Slide Presentation
Show your long-term growth with a clean, visual touch that makes numbers easy to follow and goals clear to everyone. This modern layout highlights yearly progress using engaging icons and percentage indicators, perfect for financial reports or investor decks. Fully compatible with PowerPoint, Keynote, and Google Slides for seamless editing.


5 diapositivas
Comprehensive Sex Education Infographics
Navigate the sensitive landscape of human sexuality education with our comprehensive sex education infographics. Cast on a canvas of bold colors like black, yellow, and red, these infographics delicately handle the topics inherent to sex education. This tool is invaluable for educators, health professionals, advocacy groups, and policymakers who champion for informed, safe, and healthy choices. Compatible with Powerpoint, Keynote, and Google Slides. Ensuring the content resonates with audiences of diverse ages and backgrounds. The inclusion of compelling graphics and intuitive icons, fosters an environment of learning and openness, essential for impactful discussions.


7 diapositivas
Team Leadership and Management Presentation
Unlock the secrets of effective team leadership and management with our detailed presentation template. Designed for training sessions and workshops, it provides clear guidance on key leadership principles and team management tactics through engaging graphics and strategic layouts. Ideal for enhancing team dynamics and leadership skills.


4 diapositivas
New Hire Orientation Program Presentation
Set new hires up for success with a structured onboarding journey. This New Hire Orientation Program template visually represents key onboarding steps, ensuring clarity and consistency. Ideal for HR professionals and managers. Fully editable and compatible with PowerPoint, Keynote, and Google Slides for seamless customization.


8 diapositivas
30-60-90 Day Business Plan Presentation
Set clear goals and track progress effortlessly with this 30-60-90 day business plan template! Designed for professionals, managers, and entrepreneurs, this structured layout helps outline priorities, set milestones, and ensure a smooth transition from planning to execution. Fully customizable and compatible with PowerPoint, Keynote, and Google Slides for seamless presentations.


5 diapositivas
Risk and Return Investment Presentation
Navigate the high seas of finance with our captivating infographic presentation template, designed to visually break down the complex relationship between risk and return in investments. This template simplifies presenting key data points, making it ideal for financiers and investors looking to make informed decisions. Each slide is meticulously crafted to ensure clarity and impact, highlighting the balance of potential rewards against possible risks. Perfect for use in PowerPoint, Keynote, and Google Slides, this template is a must-have tool for anyone in the financial sector aiming to convey their strategy with precision and flair.


6 diapositivas
Cloud Computing Infographic
Cloud Computing refers to the delivery of computing services over the internet, allowing users to access and use resources such as storage, applications, and processing power on-demand. This infographic template is designed to provide an overview of cloud computing technology. It aims to explain the concept of cloud computing, its benefits, and its impact on various industries and everyday life. This can be used as valuable resource for individuals and organizations seeking to understand the fundamentals and benefits of cloud computing. Compatible with Powerpoint, Keynote, and Google Slide.


22 diapositivas
Quantum Scientific Research Presentation
Present your scientific research with this comprehensive and professional template! Perfect for detailing research objectives, methodology, and key findings. Ideal for researchers and academics aiming to share their work clearly and effectively. Compatible with PowerPoint, Keynote, and Google Slides, this template ensures your scientific presentations are thorough, engaging, and visually appealing.


6 diapositivas
Effective Leadership Skills Presentation
Build stronger teams with this effective leadership skills template, featuring a colorful building block design to represent key competencies. Ideal for leadership workshops, corporate training, and professional development, it visually organizes six core skills. Fully editable in Canva, PowerPoint, or Google Slides for easy customization to match your organization’s style.


21 diapositivas
Mystorin Market Analysis Report Presentation
Present your market analysis findings with this sleek and professional report presentation template. Covering essential sections such as key highlights, performance metrics, competitor insights, and strategic initiatives, it provides a comprehensive framework for data-driven decisions. Ideal for businesses and analysts. Compatible with PowerPoint, Keynote, and Google Slides for easy customization.


24 diapositivas
Blazewind User Experience Proposal Presentation
This UX Strategy Plan Presentation Template is a comprehensive and visually engaging solution for presenting user experience design strategies. Covering key elements such as research, wireframing, prototyping, user testing, and design principles, it ensures a structured approach to showcasing your UX process. Ideal for UX/UI designers, agencies, and businesses looking to communicate their design strategies effectively. Fully compatible with PowerPoint, Keynote, and Google Slides for seamless customization.


22 diapositivas
Shield Digital Agency Strategy Plan Presentation
Embark on a journey to elevate your digital agency with this comprehensive and sleek presentation template! Perfect for showcasing your agency’s strengths, strategies, and successes, this template covers everything from market analysis to client testimonials. It’s designed to make your agency’s strategy plan stand out. Compatible with PowerPoint, Keynote, and Google Slides for seamless use.


6 diapositivas
Project Proposal Goals Infographic
Maximize the impact of your project proposals with this professional collection of templates, designed to outline your project goals and strategies with precision. Each template facilitates clear communication of project objectives, timelines, and the desired outcomes, making them essential for project managers, consultants, and business analysts. These slides are crafted with a clean, corporate design that uses a harmonious blend of blue tones, engaging charts, and concise content layouts. This ensures that key points are easily digestible and effectively conveyed to stakeholders. The structured format of these templates is ideal for detailing the scope of work, expected milestones, and resource allocation, supporting a comprehensive overview of your project plan. Customize these templates to align with your organization's branding and project specifics, enhancing your presentation and strengthening the proposal's persuasive power. Whether for internal briefings or external pitches, these slides are tailored to help you present a coherent and compelling case for your projects.


10 diapositivas
Customer Market Segmentation Strategy Presentation
Define and visualize your audience with the Customer Market Segmentation Strategy Presentation. This slide layout helps you categorize customer types using clean iconography and a central persona model. Ideal for marketing teams, sales strategists, or startup pitches. Customize easily in Canva, PowerPoint, Google Slides, or Keynote.


5 diapositivas
Dual Axis Butterfly Diagram Presentation
Give your data the spotlight it deserves with a modern layout designed for clarity and balance. This presentation is perfect for comparing two perspectives, processes, or variables side by side in a visually appealing way. Fully customizable and compatible with PowerPoint, Keynote, and Google Slides.


6 diapositivas
Managing Transition in Business Presentation
Make your next strategy session visually unforgettable with this clean, step-by-step layout. Designed to help explain transitional phases in business, this infographic template simplifies complex change processes into digestible segments. Ideal for professionals presenting transformation strategies. Fully editable and compatible with PowerPoint, Keynote, and Google Slides for easy use.


21 diapositivas
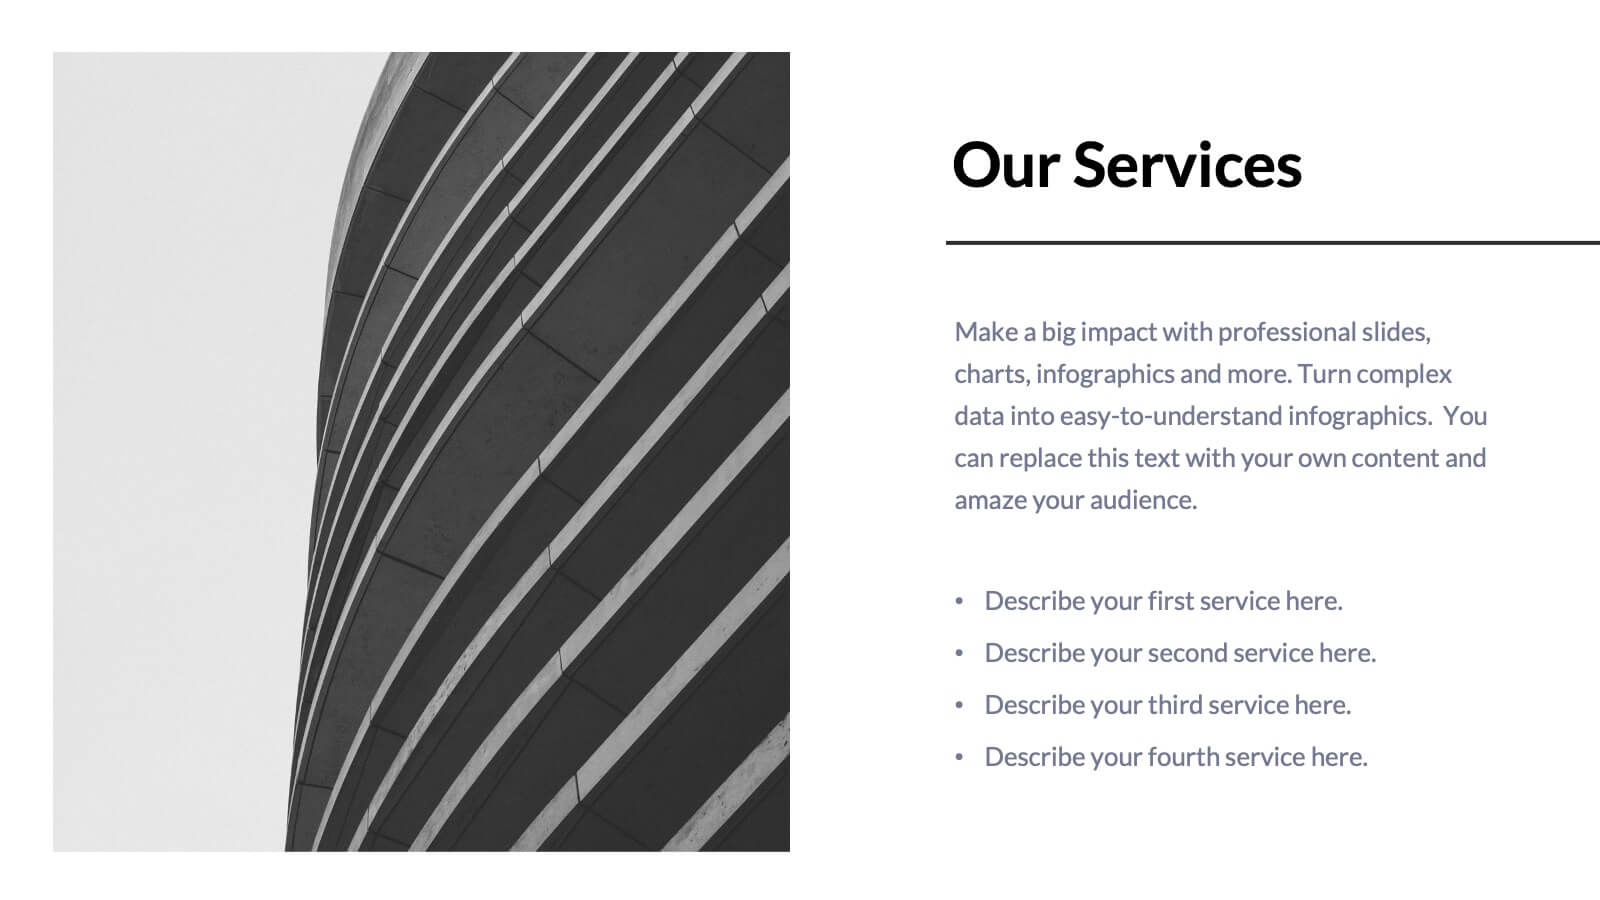
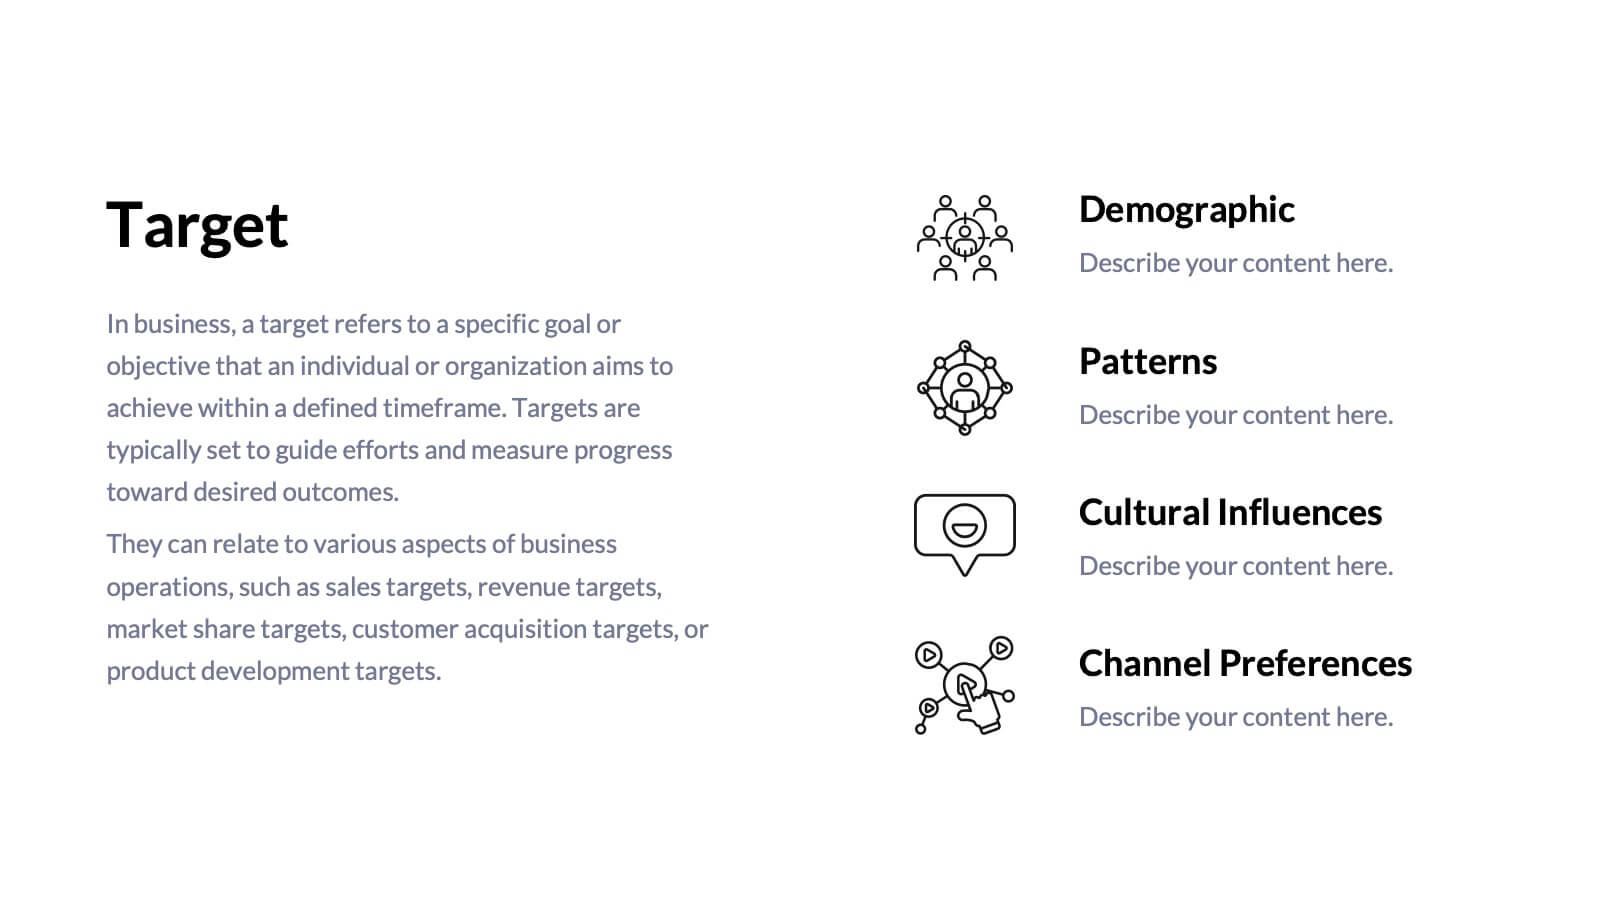
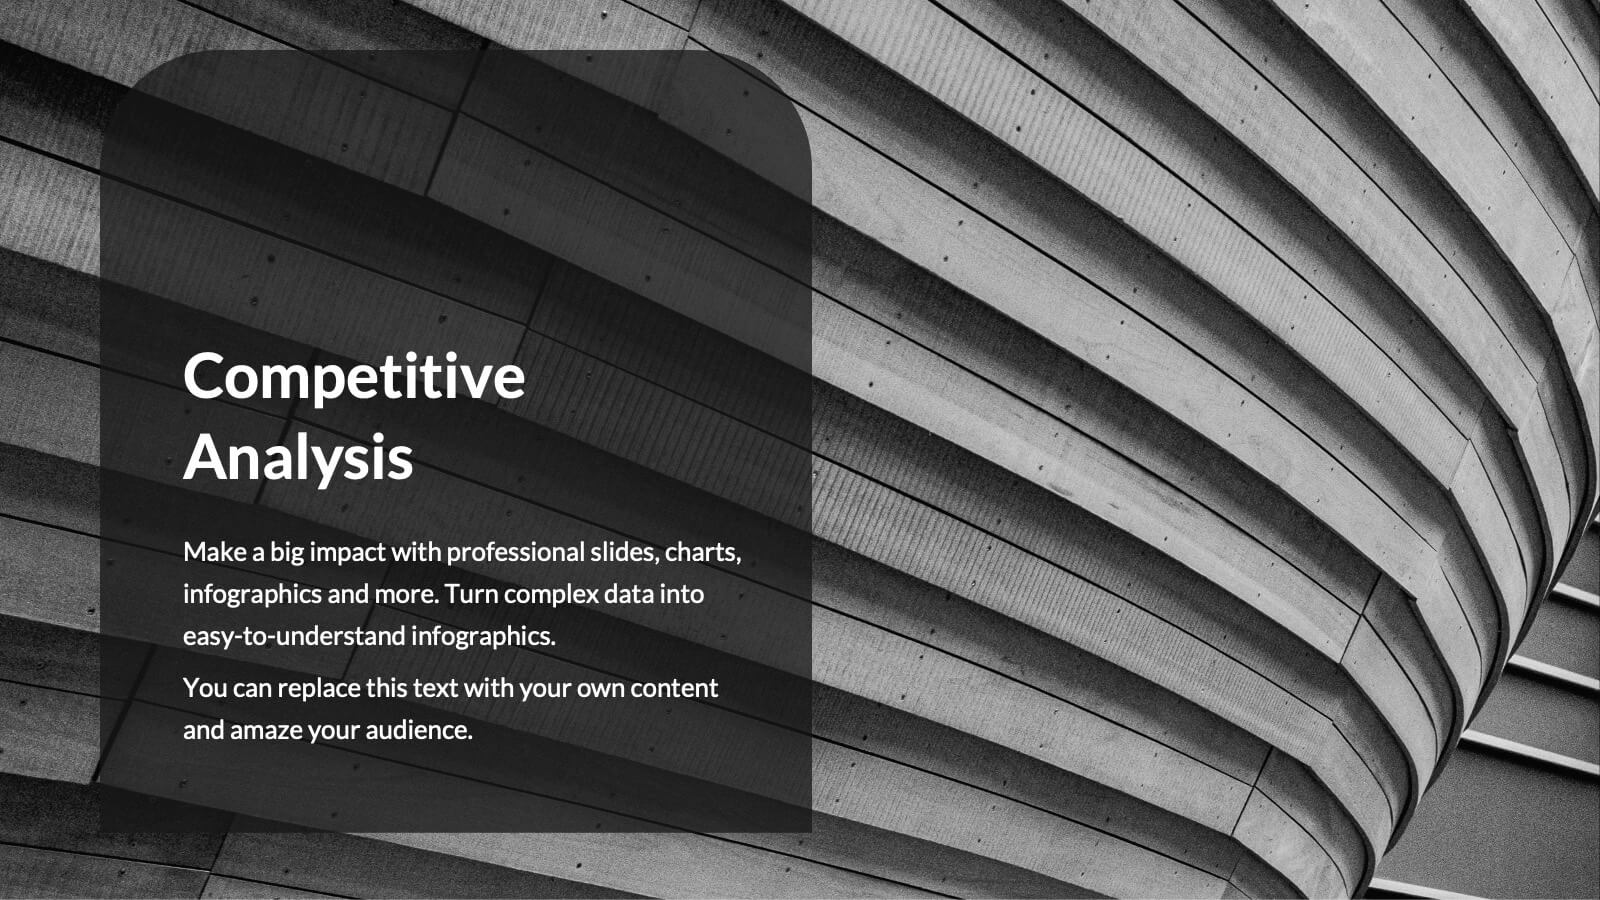
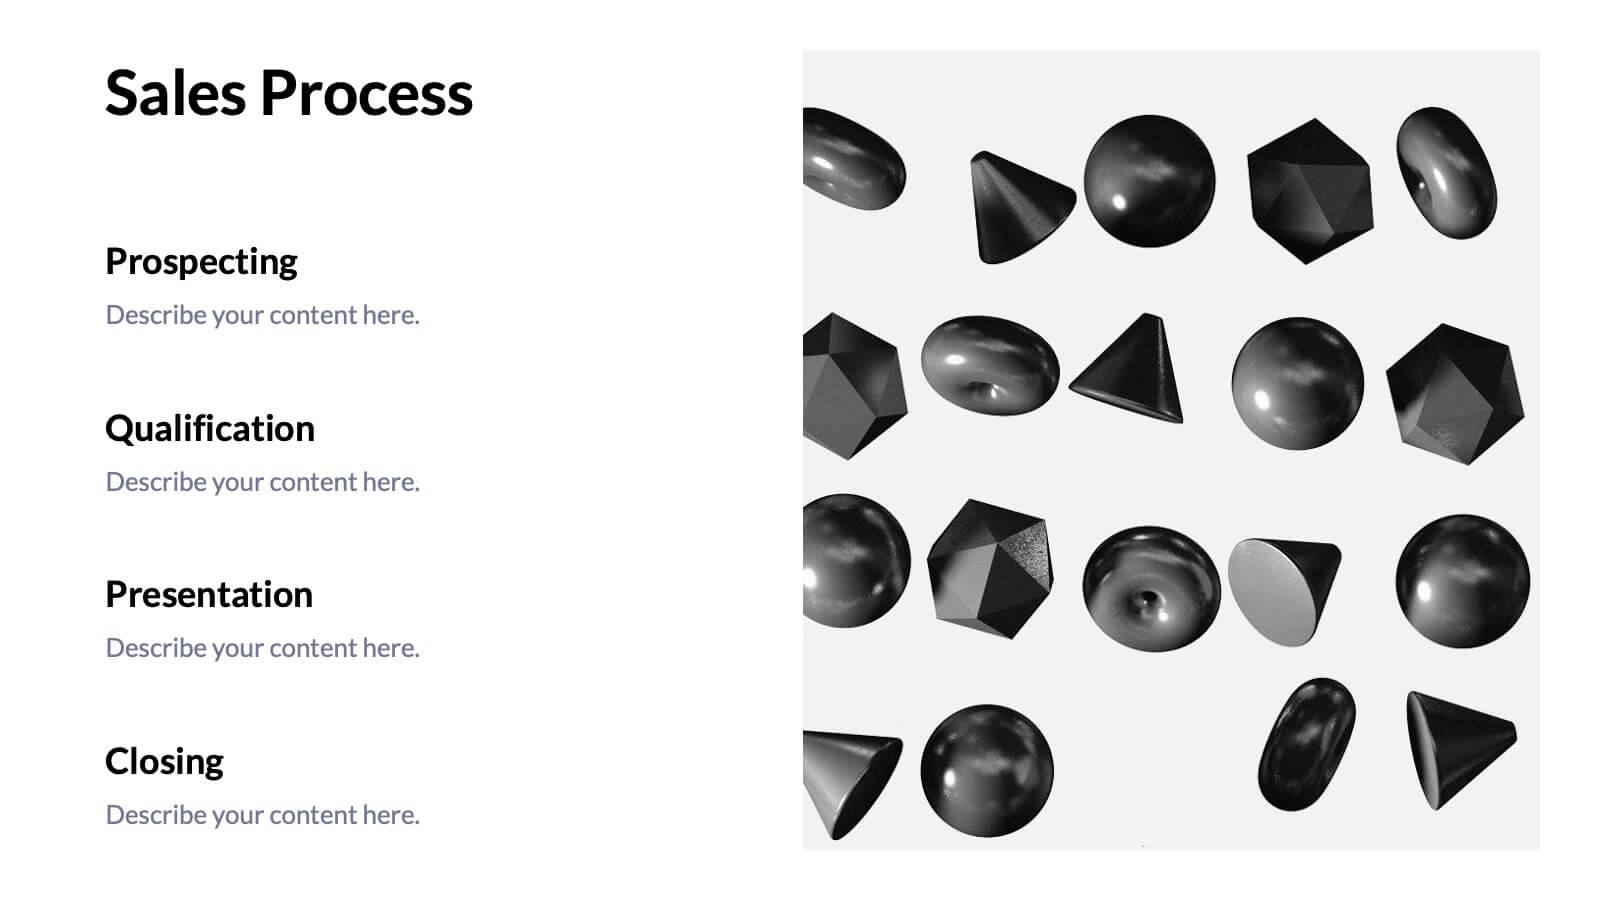
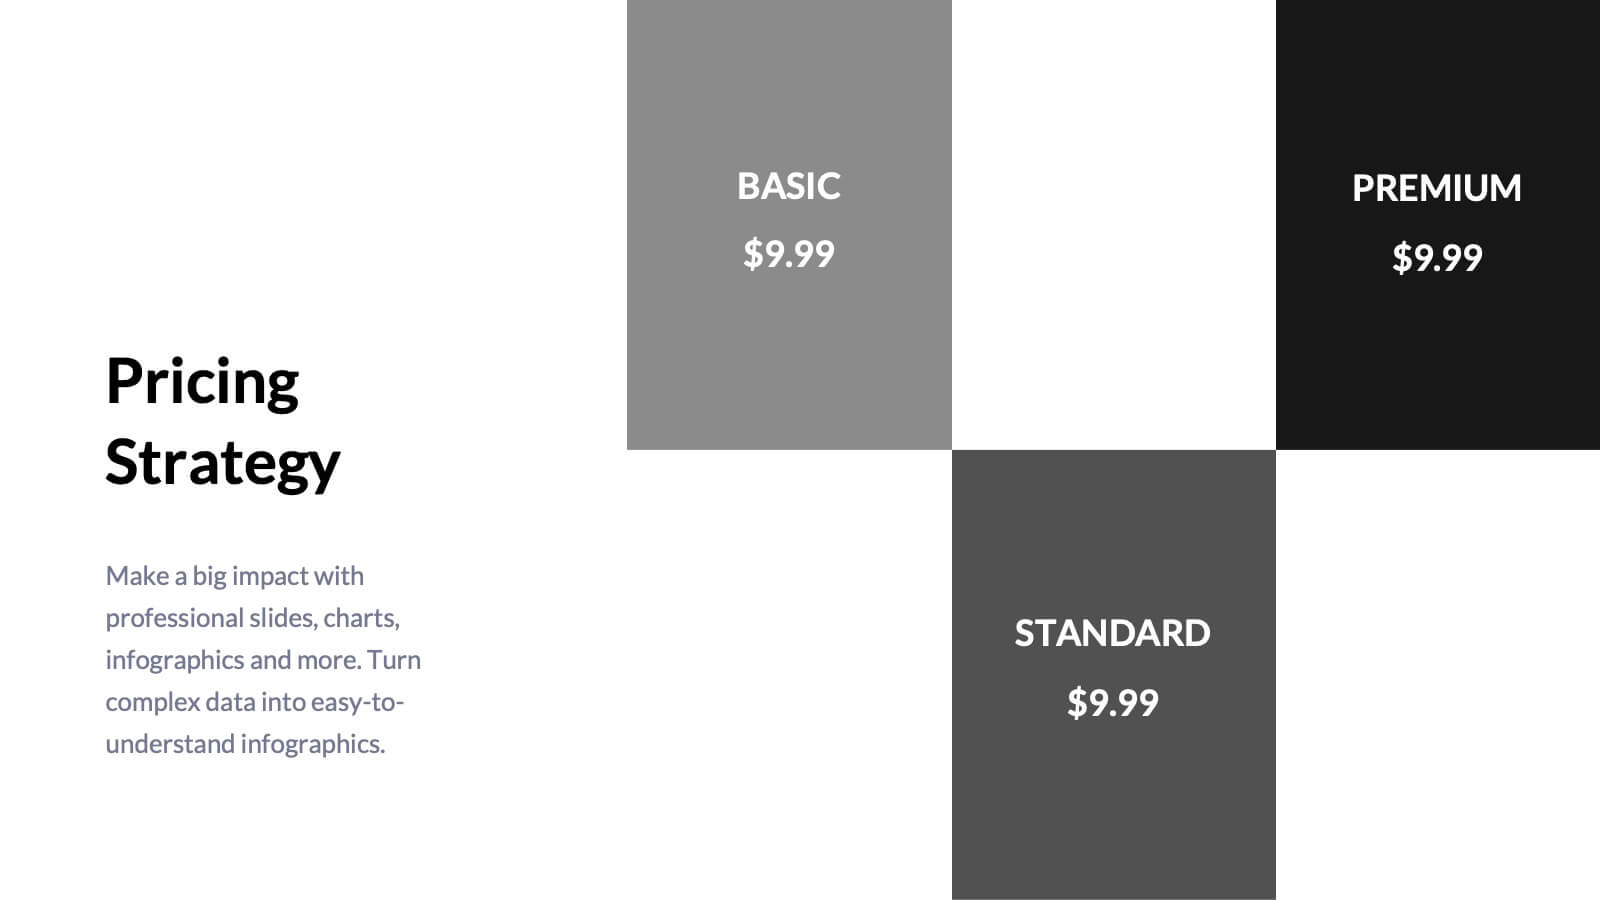
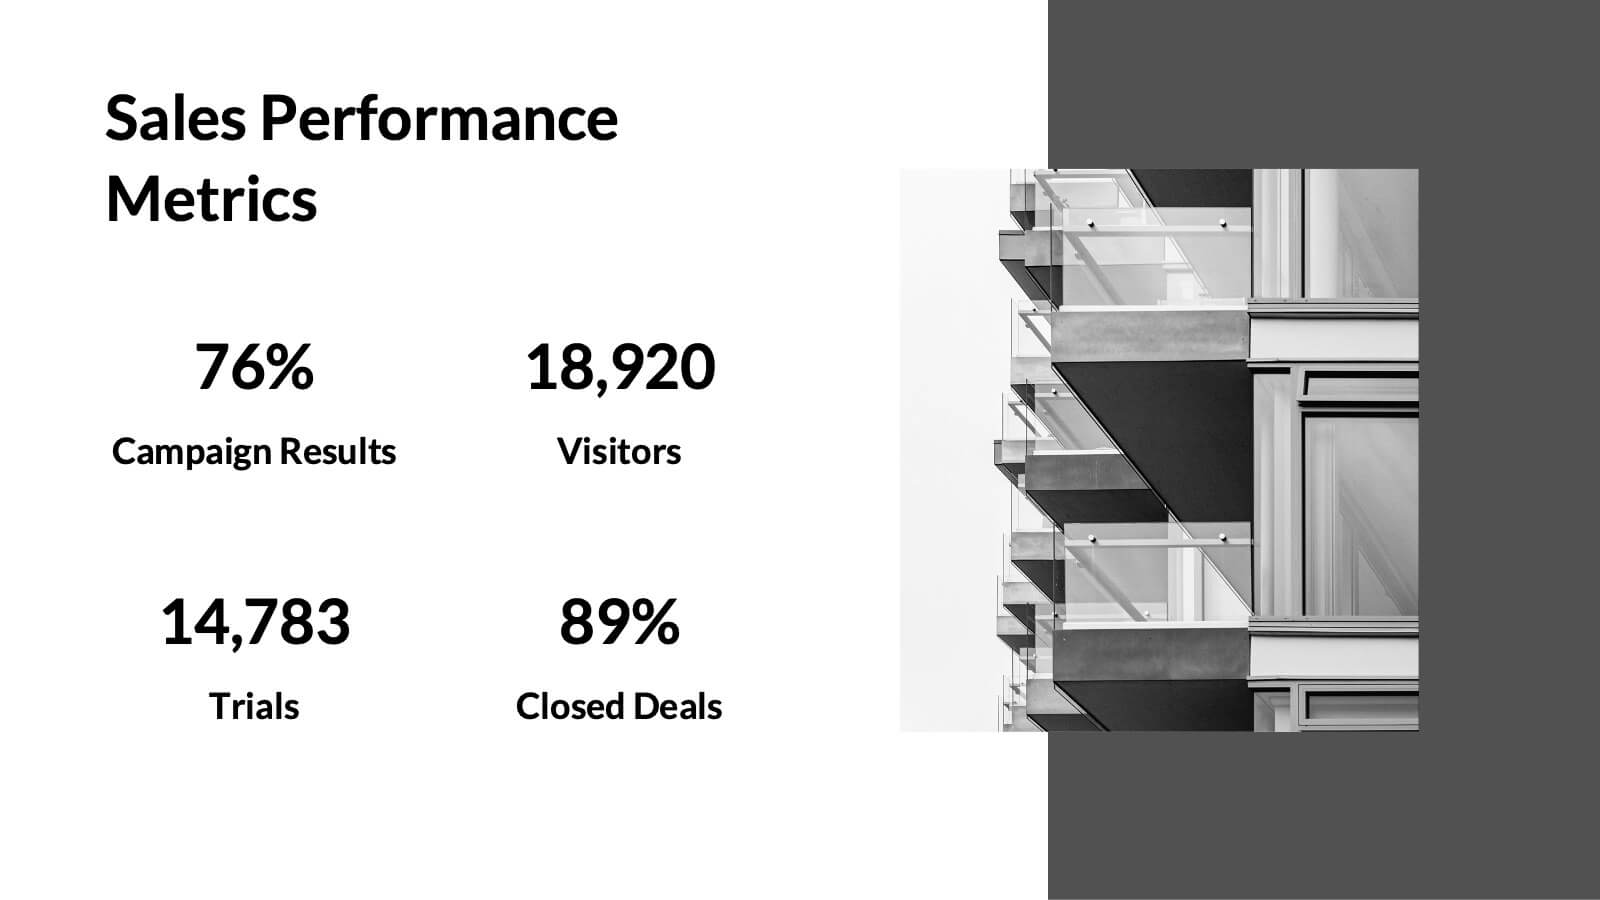
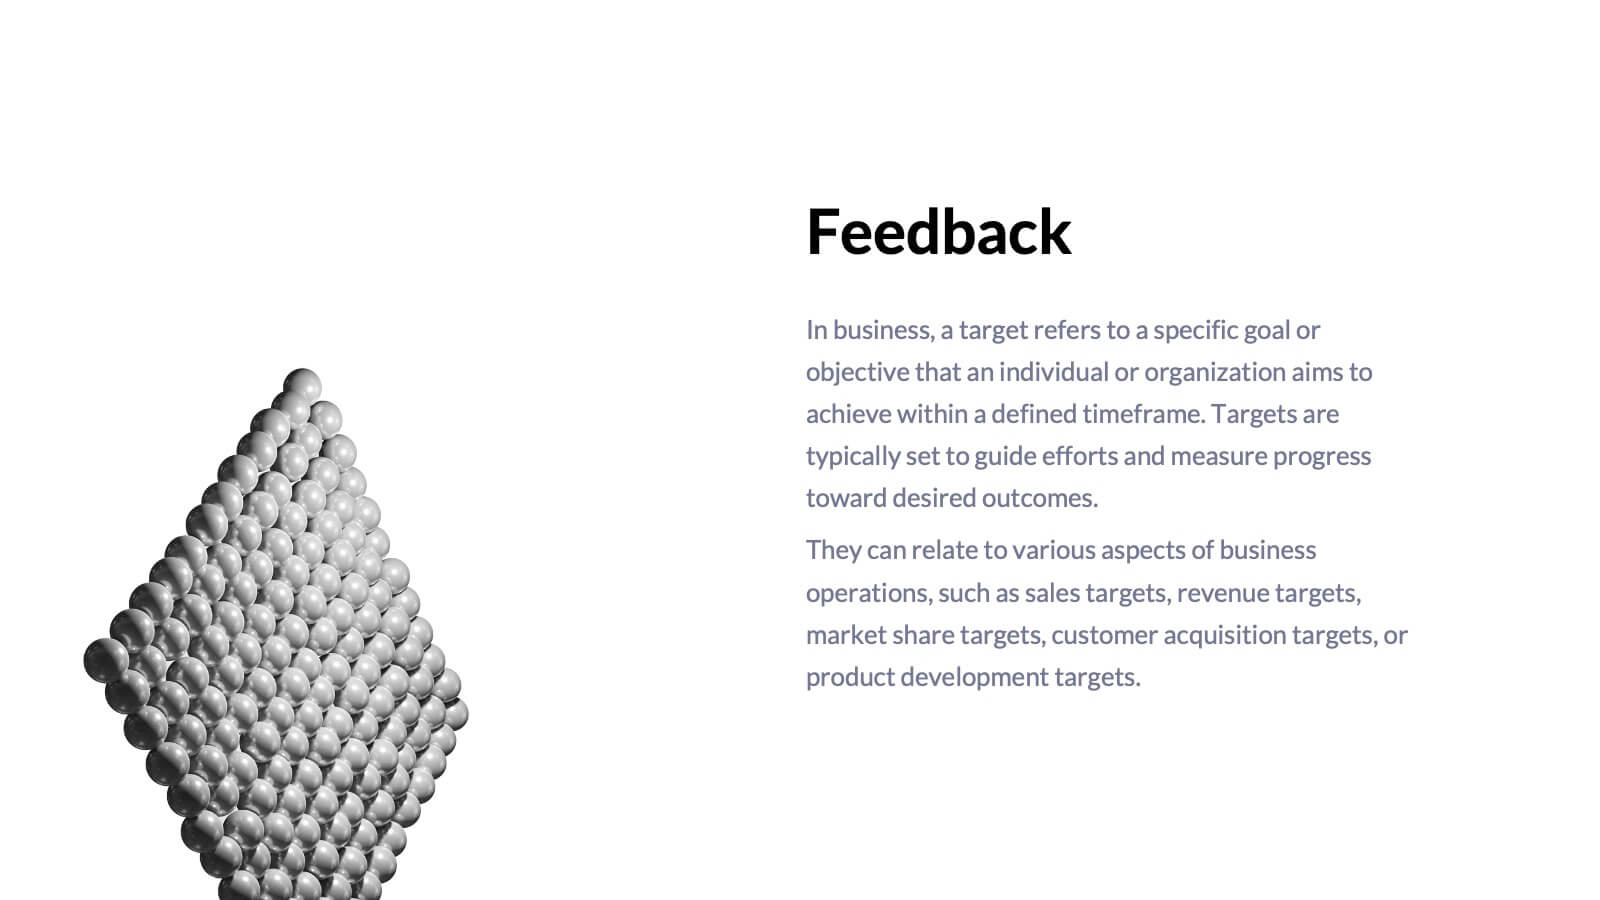
Tempest Sales Performance Report Presentation
Supercharge your sales presentations with this sleek, professional template. Perfect for outlining sales objectives, processes, and performance metrics, it features a clean, minimalist design that enhances clarity and impact. Highlight key elements like competitive analysis, pricing strategy, and future opportunities to captivate your audience. Compatible with PowerPoint, Keynote, and Google Slides, it ensures seamless presentations on any platform.