


Características


¿Tienes alguna pregunta?
Recomendar


6 diapositivas
Social Media Advertising Infographic
Boost your online presence with our Social Media Advertising Infographic, compatible with PowerPoint, Google Slides, and Keynote. This dynamic template is crafted for marketers and businesses to showcase their social media strategies and ad campaigns. It includes diverse slide layouts to detail different aspects such as audience targeting, platform choice, content planning, and budget allocation. Each slide provides a clear structure to display comparative analyses, timelines, and the impact of your social media efforts. It's an ideal tool for presenting to teams, clients, or during workshops to explain the intricacies of social media marketing effectively.


5 diapositivas
Cloud Computing Services Overview Presentation
Simplify cloud service explanations with this Cloud Computing Services Overview template. Perfect for IT professionals, business leaders, and tech strategists, this slide visually breaks down key cloud services and infrastructure using an intuitive, easy-to-understand layout. Featuring color-coded icons and modern design, this template helps showcase essential cloud computing components effectively. Fully compatible with PowerPoint, Keynote, and Google Slides for seamless integration into your presentations.


7 diapositivas
Aviation Terms Infographic
Take flight with our aviation terms infographic, designed with a serene palette of white, blue, and hints of orange that echo the hues of the sky. This meticulously crafted infographic decodes the intricate jargon of the aviation world, making it a breeze for enthusiasts, trainees, and even seasoned aviators to grasp. Ideal for flight schools, airline training programs, and aviation seminars, this infographic simplifies complex terminologies with ease. With full compatibility across PowerPoint, Keynote, and Google Slides, sharing your knowledge of the skies has never been more accessible or visually appealing.


5 diapositivas
Building Timeline Presentation
Bring structure and progress to your ideas with this visually engaging presentation design. Ideal for showcasing project milestones, construction phases, or business growth timelines, it helps you communicate progress clearly and professionally. Fully customizable and compatible with PowerPoint, Keynote, and Google Slides for seamless presentation editing and delivery.


7 diapositivas
Finance Dashboard Infographic
A finance dashboard is a visual representation of financial data and key performance indicators (KPIs) that provides an overview of an organization's financial health and performance. This infographic template is a tool that allows users to monitor and analyze financial data in a clear and concise manner. This offers a comprehensive overview of financial performance, budgeting, and forecasting for individuals or businesses. The template features a clean and modern design with a professional color scheme, easy-to-read fonts, and intuitive layout. The visuals are thoughtfully organized to convey financial information effectively and engage the audience.


3 diapositivas
Break Even Financial Model Presentation
Bring your financial story to life with this sleek and professional presentation design. Ideal for illustrating profit margins, cost recovery, or growth potential, it helps visualize when investments start to pay off. Fully customizable and compatible with PowerPoint, Keynote, and Google Slides for effortless editing and impactful presentations.


6 diapositivas
Customer Empathy Map Infographics
Enhance your understanding of your customers' needs with our Customer Empathy Map infographic template. This template is fully compatible with popular presentation software like PowerPoint, Keynote, and Google Slides, allowing you to easily customize it to empathetically connect with your target audience. The Customer Empathy Map infographic template offers a visually engaging platform to explore and document your customers' thoughts, feelings, pains, and gains. Whether you're a marketer, product manager, or business owner, this template provides a user-friendly canvas to create customer profiles that drive better decision-making and customer-centric strategies. Elevate your customer relations with this SEO-optimized Customer Empathy Map infographic template, thoughtfully designed for clarity and ease of use. Customize it to gain insights into your customers' experiences, challenges, and aspirations, enabling you to tailor your products and services to their specific needs. Start crafting your personalized empathy map today to build stronger, more empathetic customer relationships.


5 diapositivas
Customer Relationship Strategy Presentation
Refine your approach to customer interactions with the "Customer Relationship Strategy" presentation templates. Perfect for delineating clear, actionable strategies to enhance client engagement and satisfaction, these templates are a must-have for businesses focused on building lasting customer relationships. Compatible with PowerPoint, Keynote, and Google Slides, they provide the tools to effectively communicate your customer relationship policies and goals.


3 diapositivas
Medical Report Summary and Review Deck Presentation
Present health data clearly with this Medical Report Summary and Review Deck. Designed for healthcare professionals, this layout features checklist icons, charts, and clinical visuals to highlight reports or patient insights. Fully editable in PowerPoint, Keynote, and Google Slides, it ensures your medical updates remain professional, concise, and easy to follow.


5 diapositivas
Key Business Question Breakdown Presentation
Present critical insights with this keyhole-themed layout, perfect for outlining strategic business questions or core decision points. The six-segment format allows you to break down complex topics into clear, actionable areas. Fully customizable in Canva, PowerPoint, or Google Slides—ideal for planning, workshops, or stakeholder presentations.
22 diapositivas
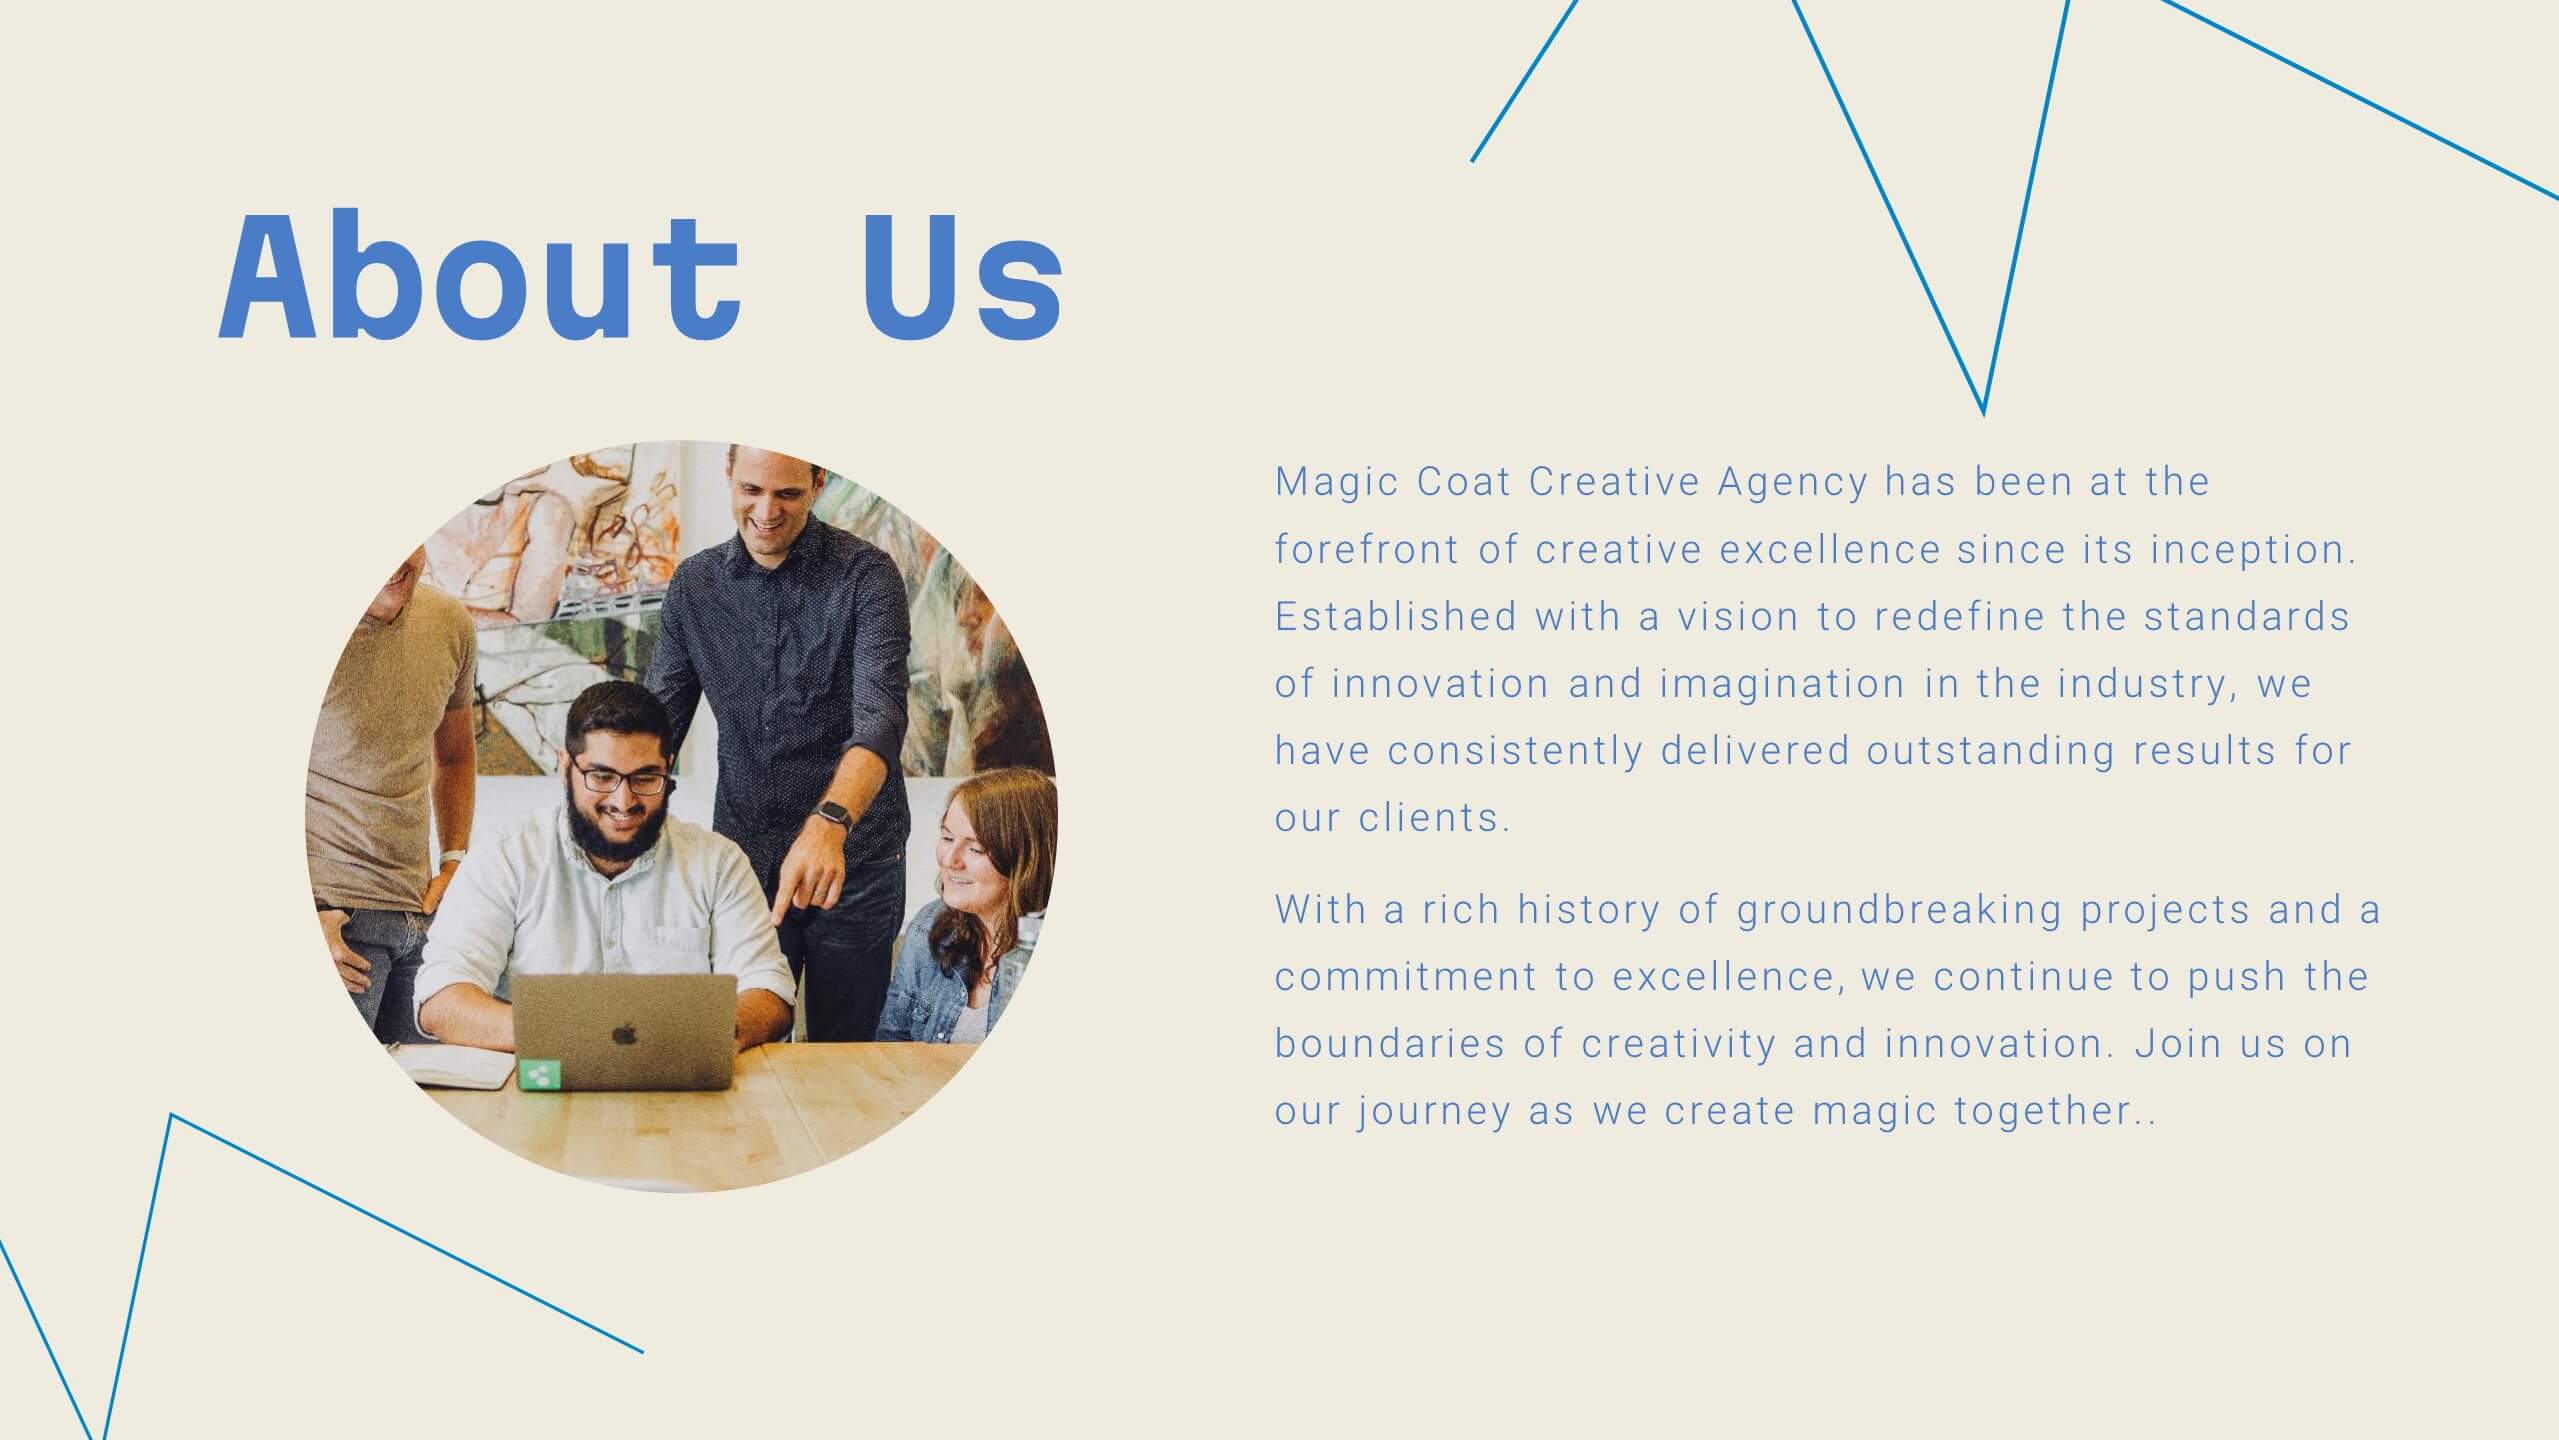
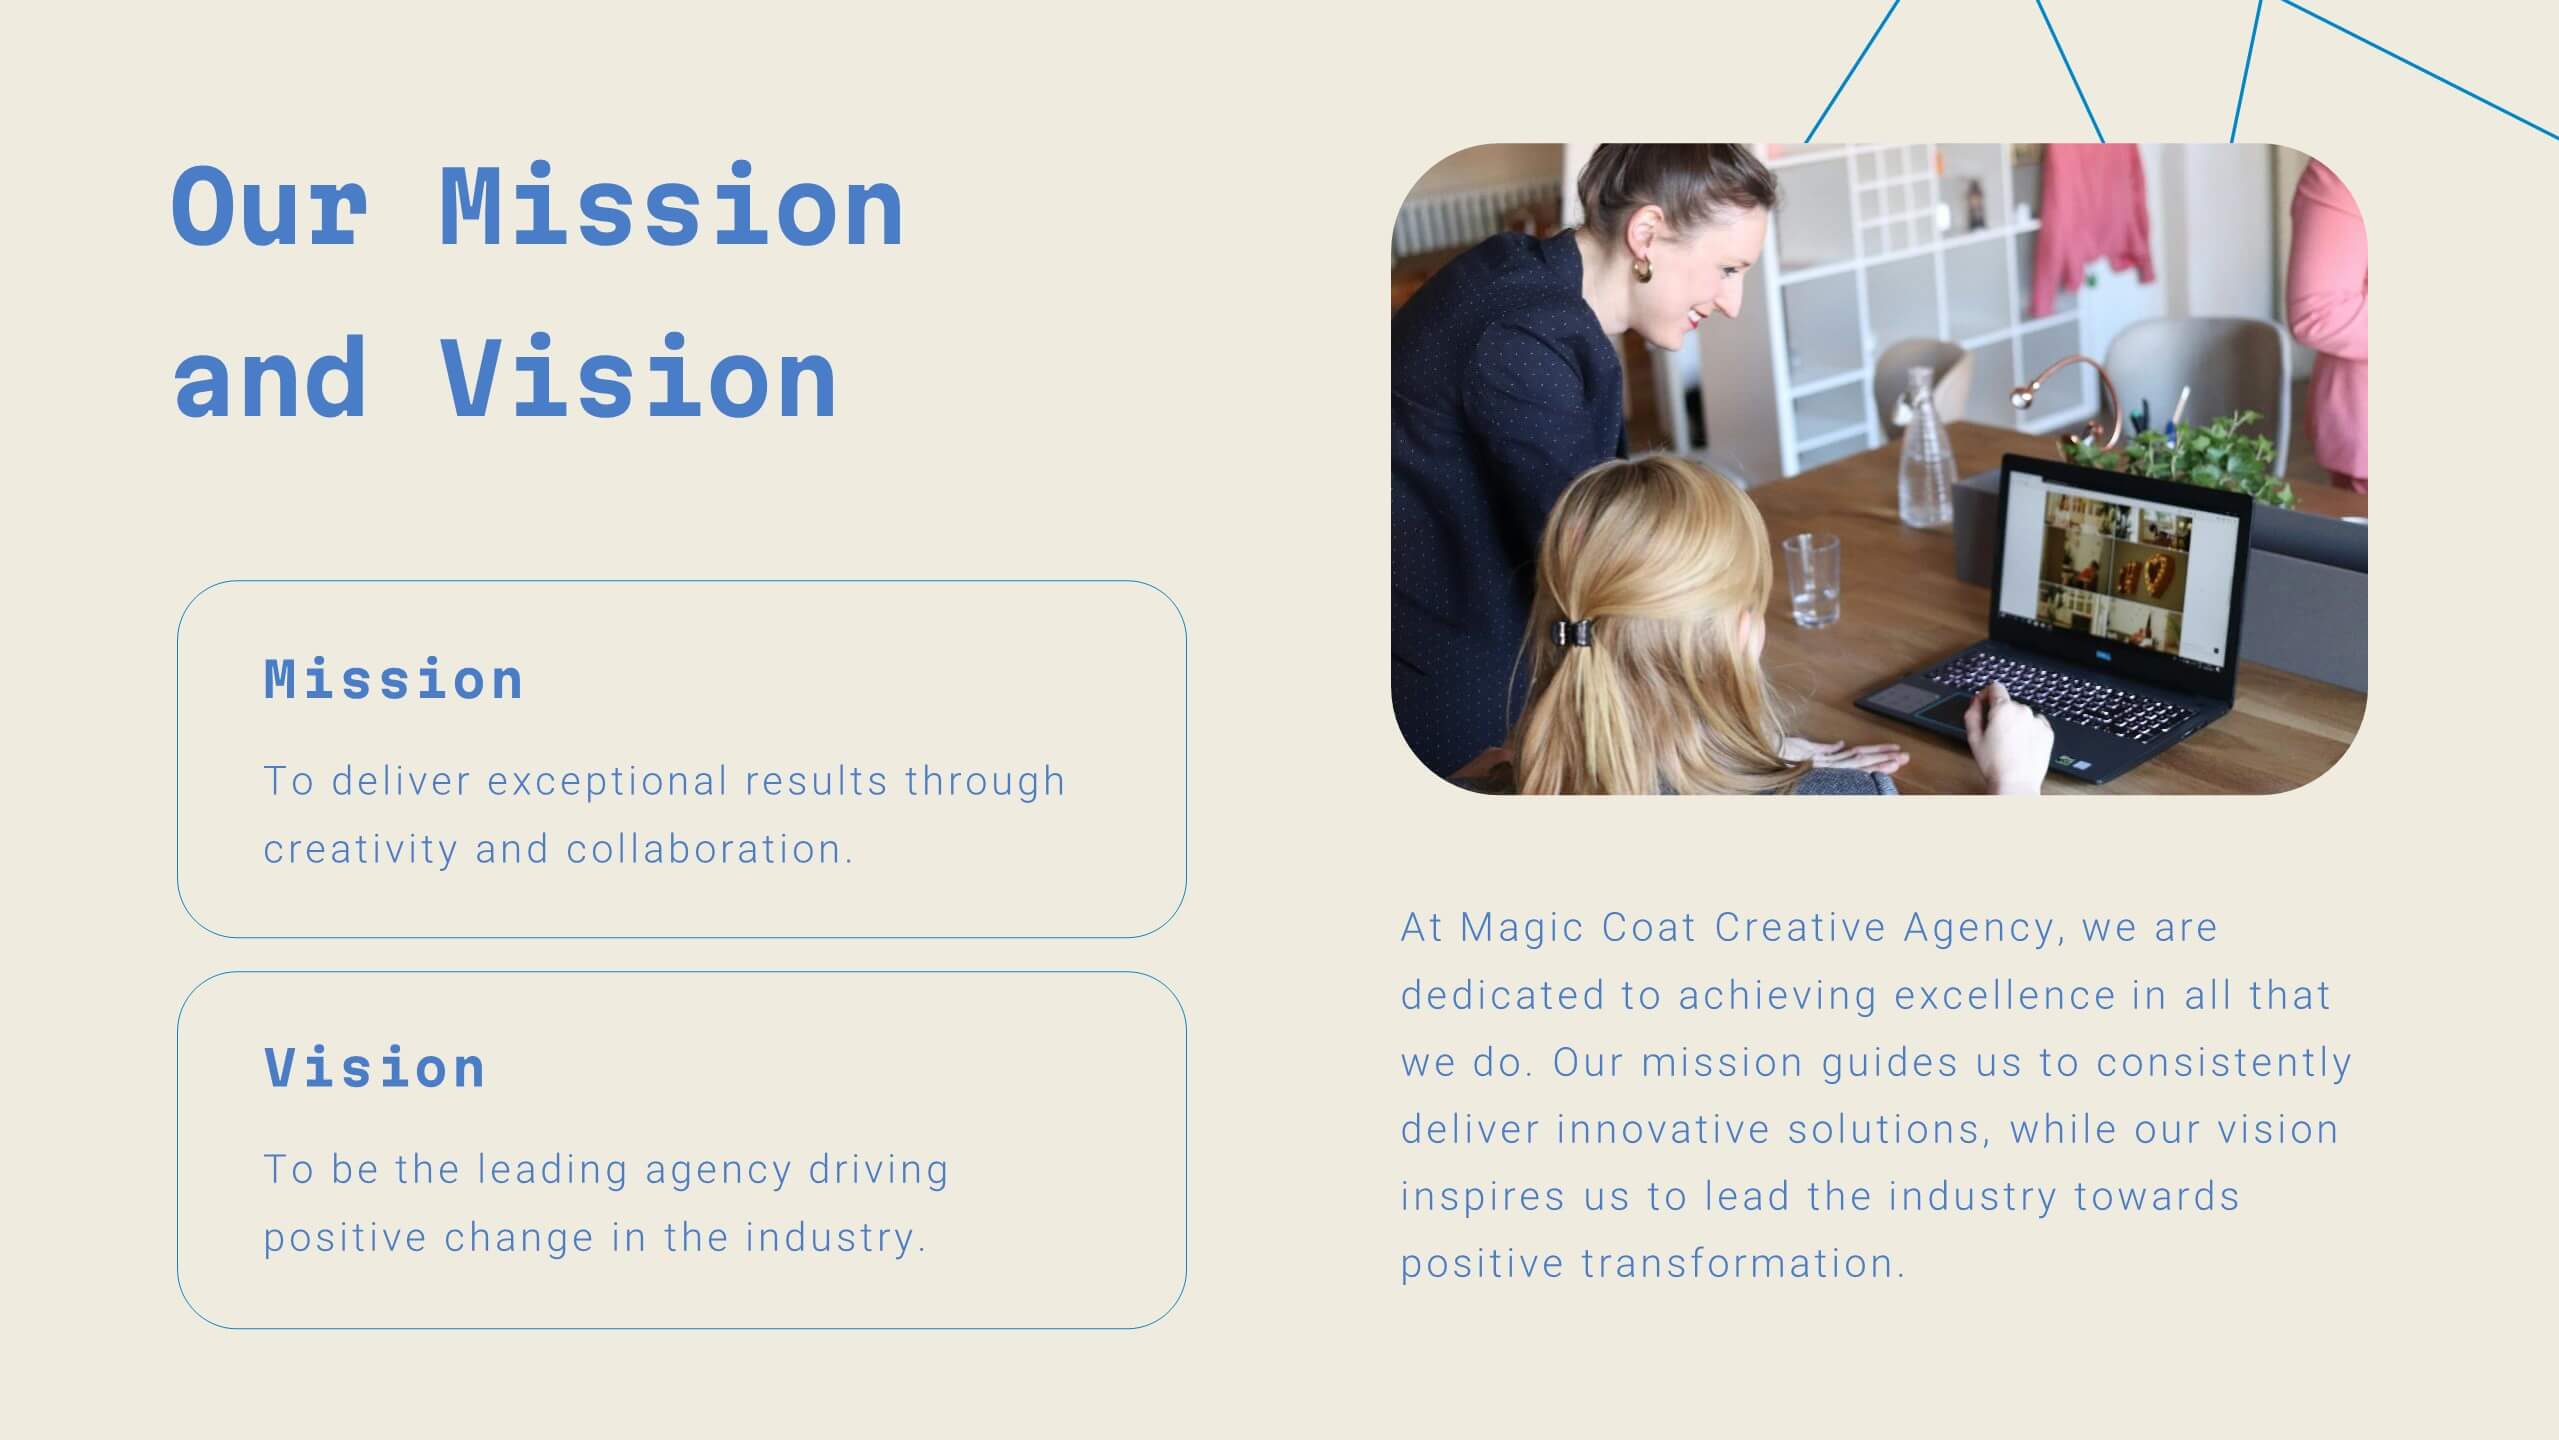
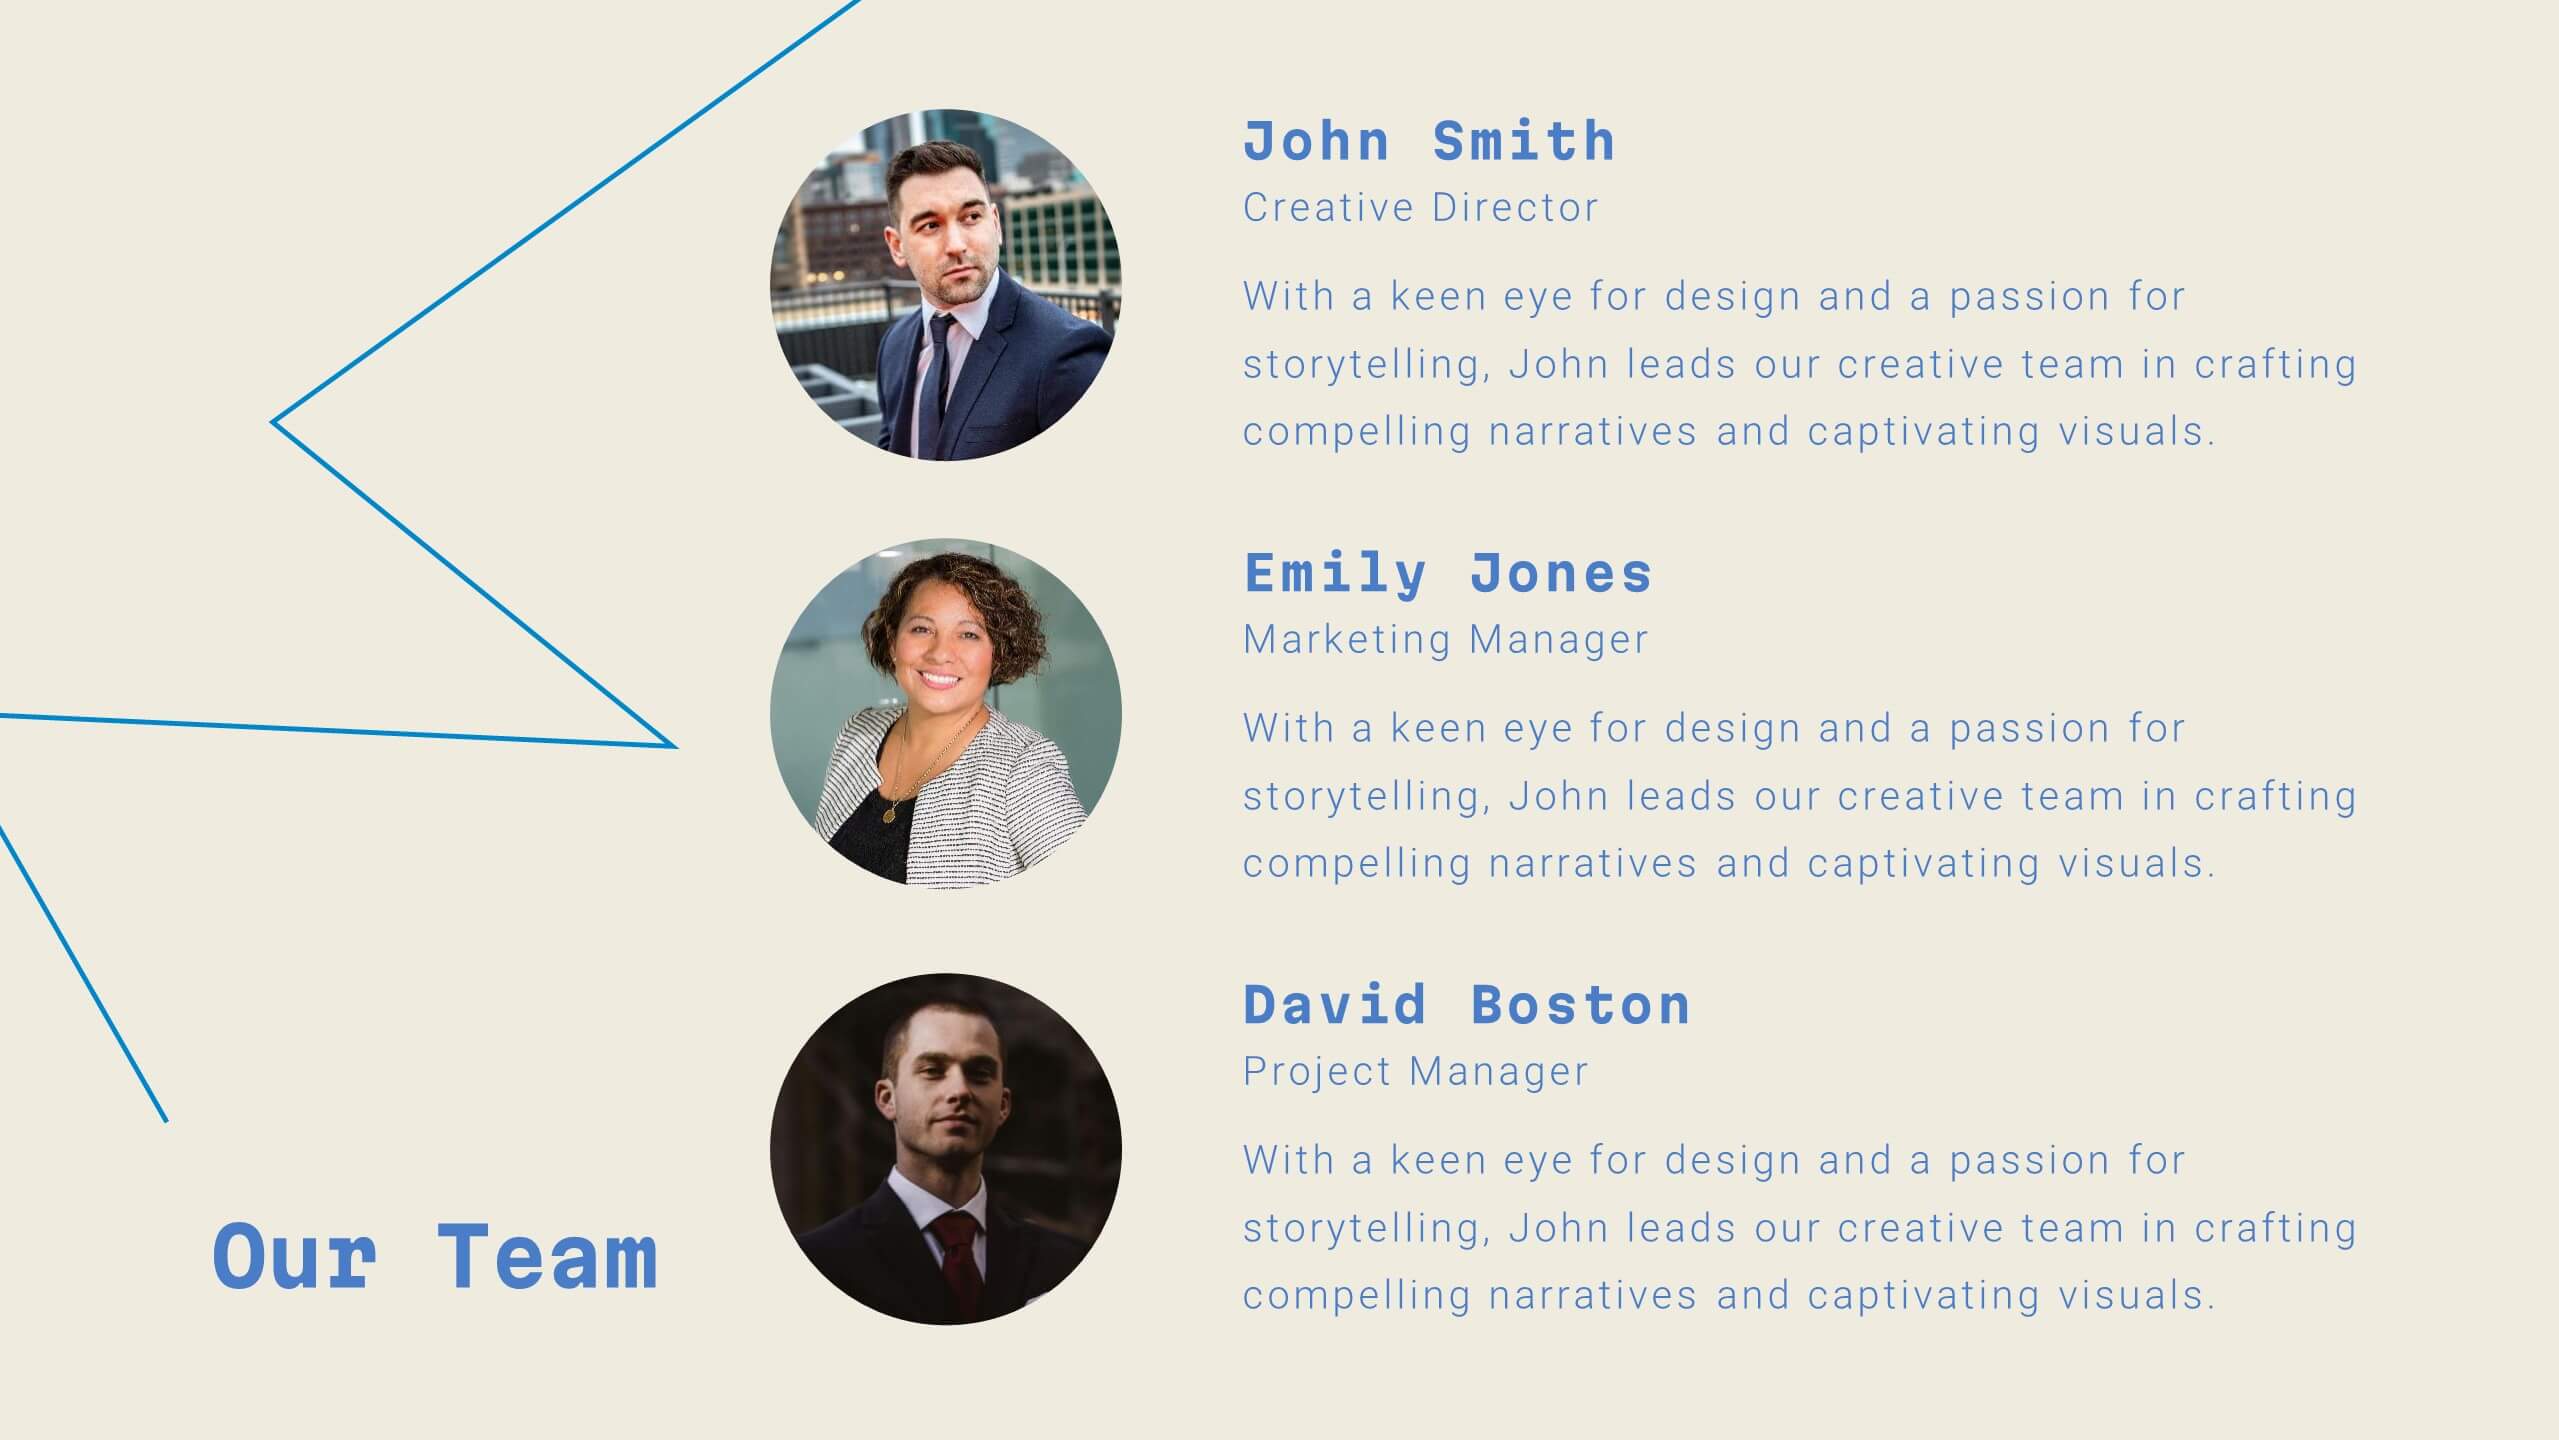
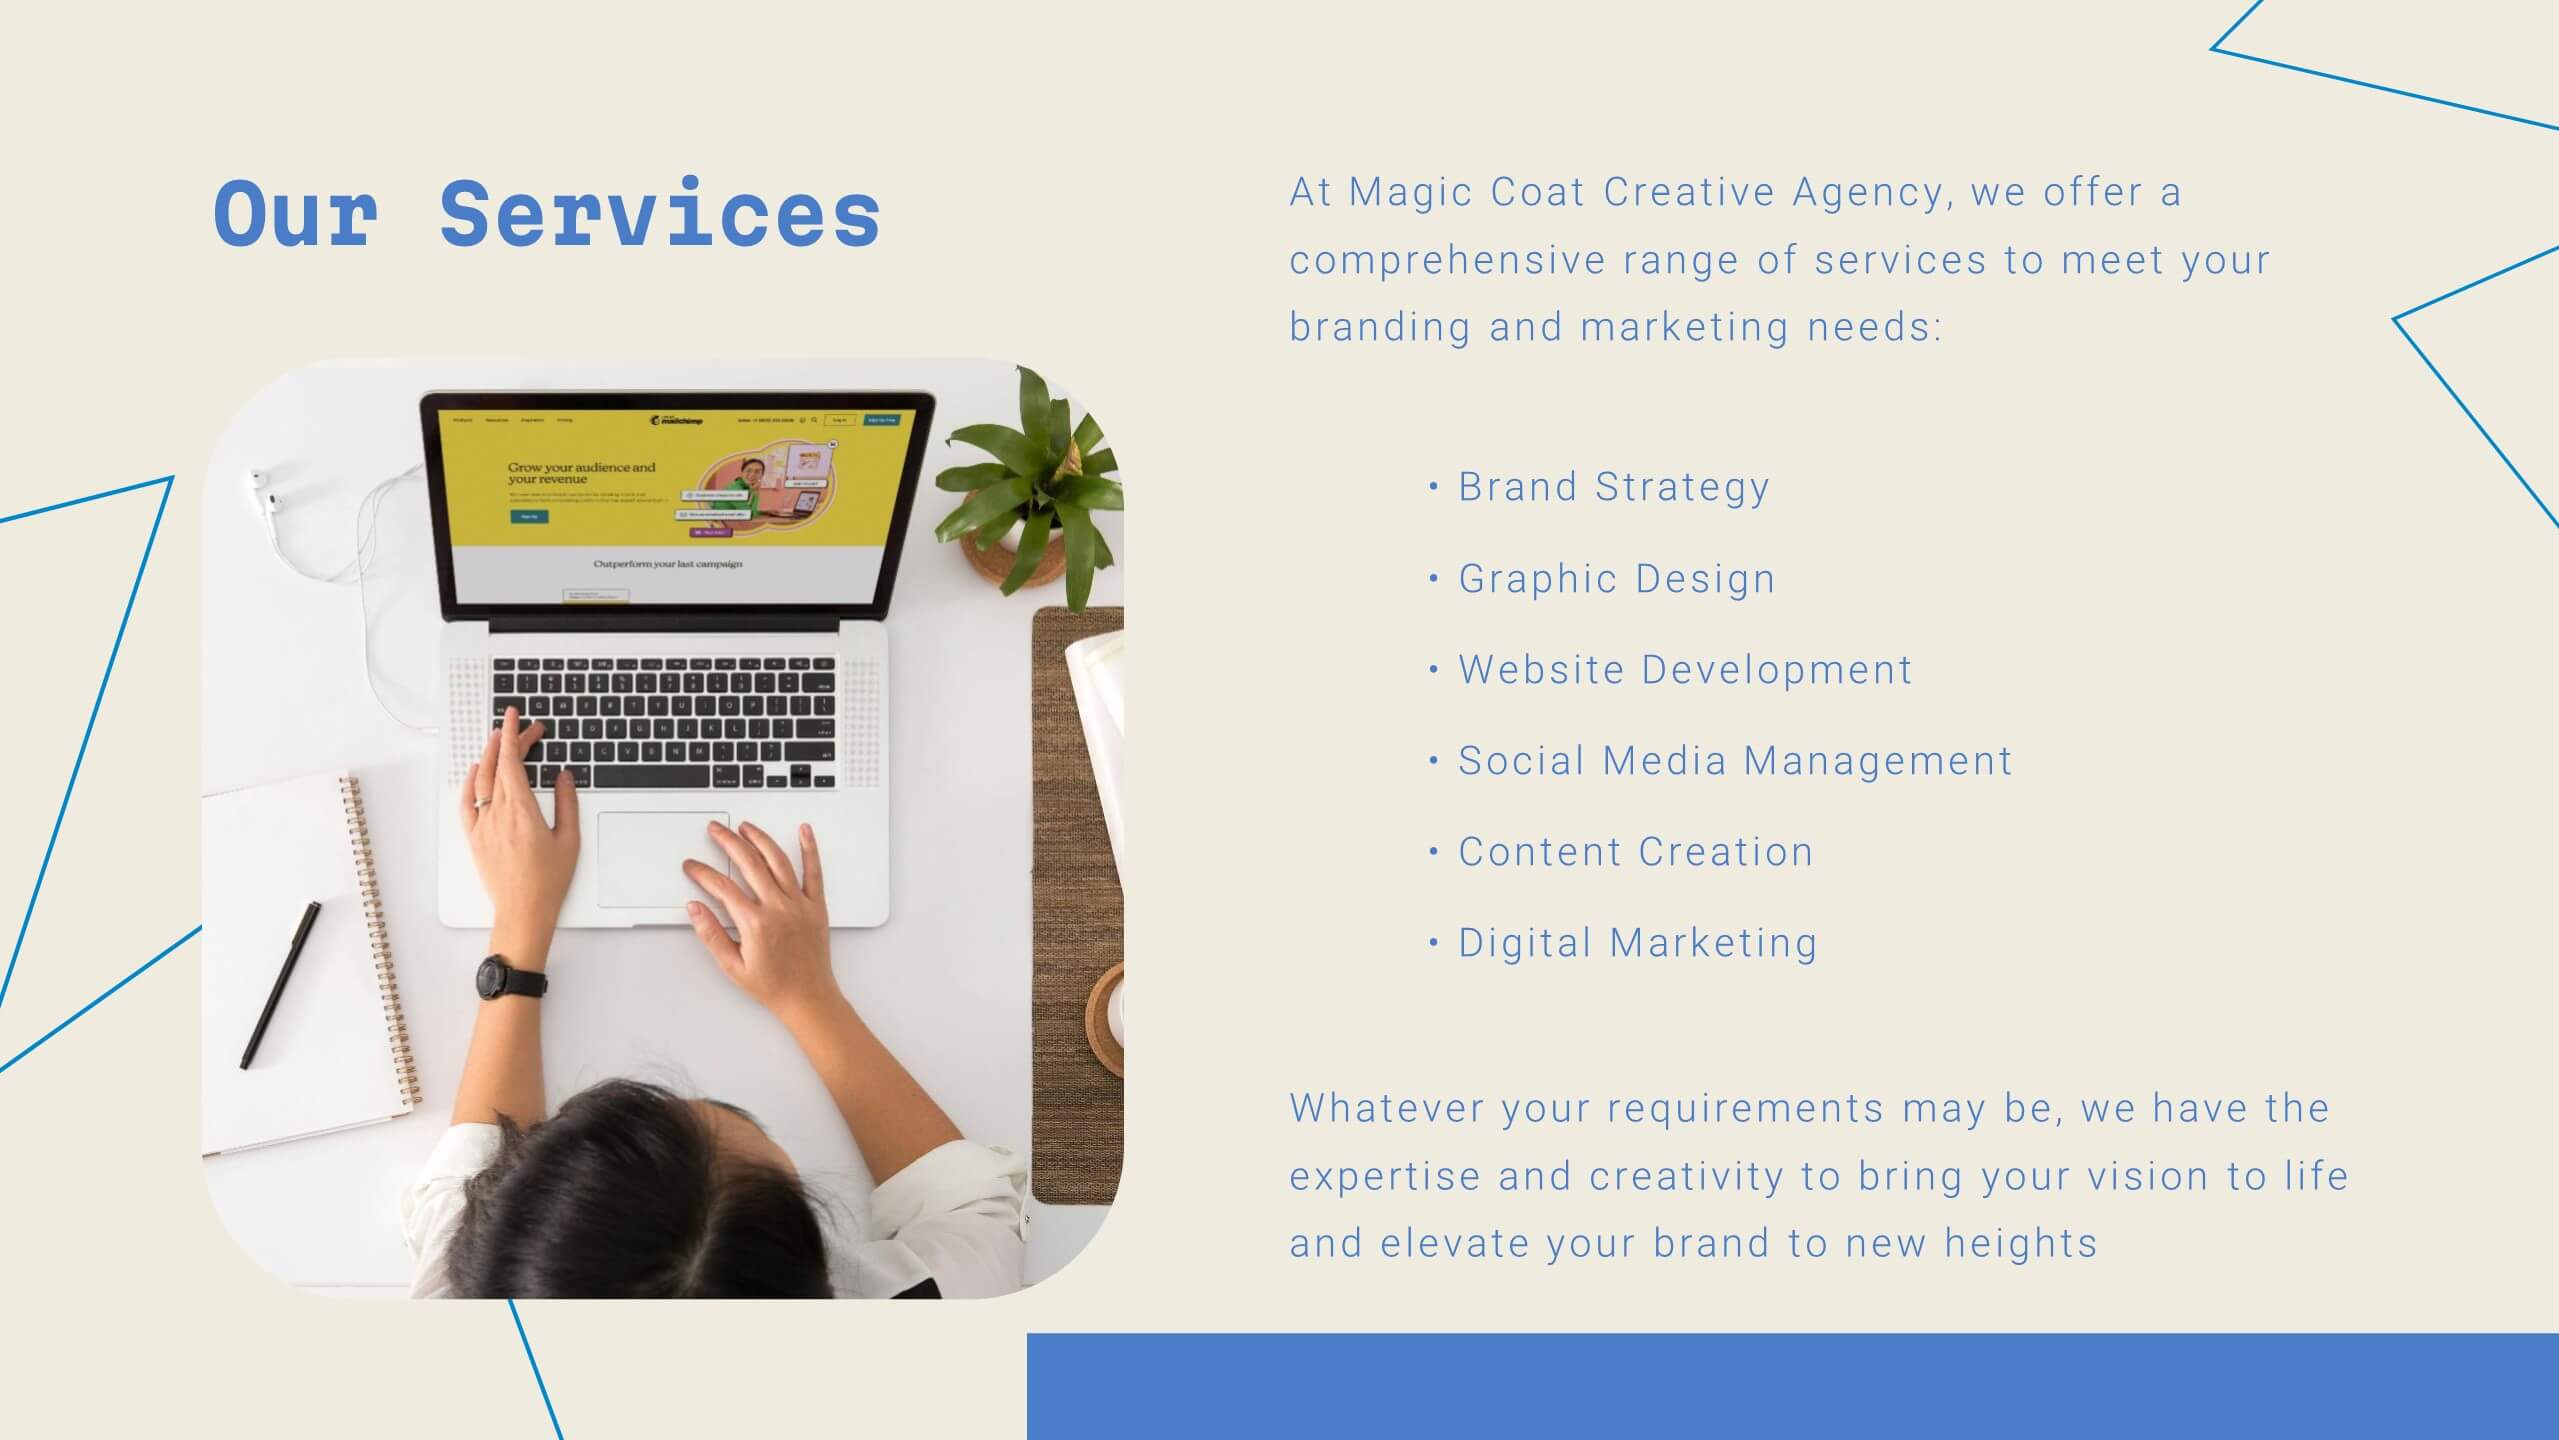
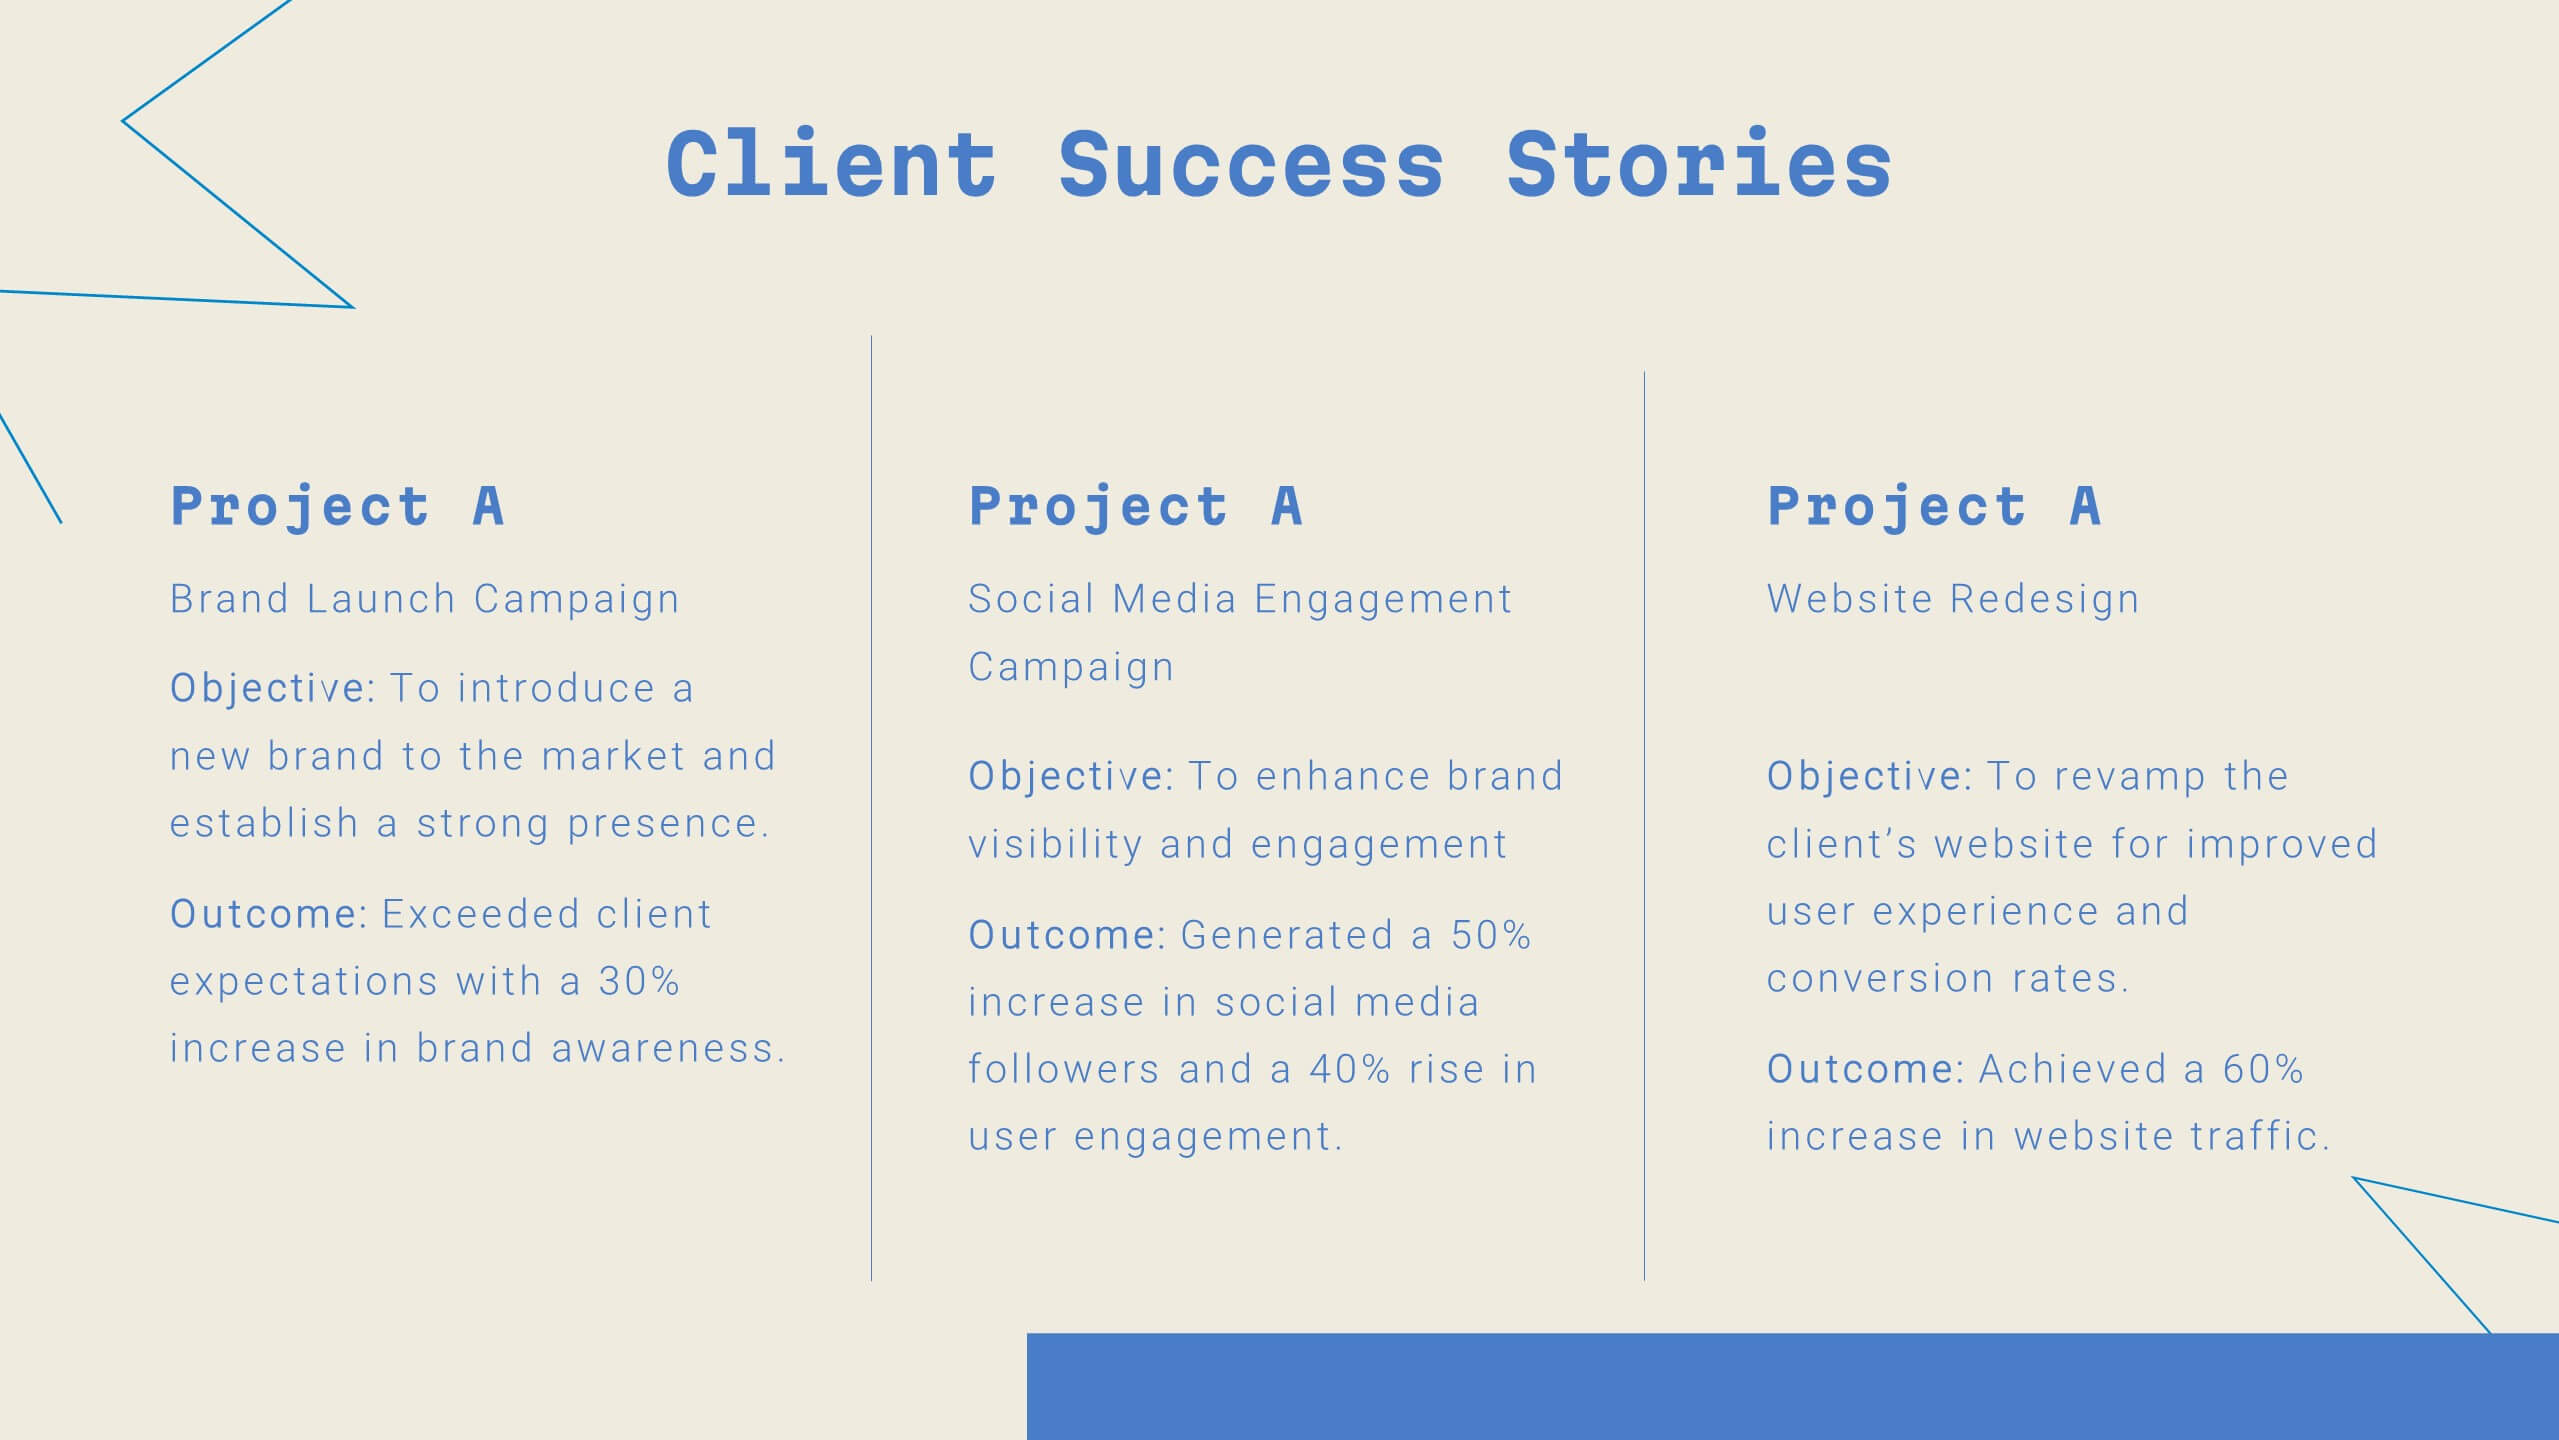
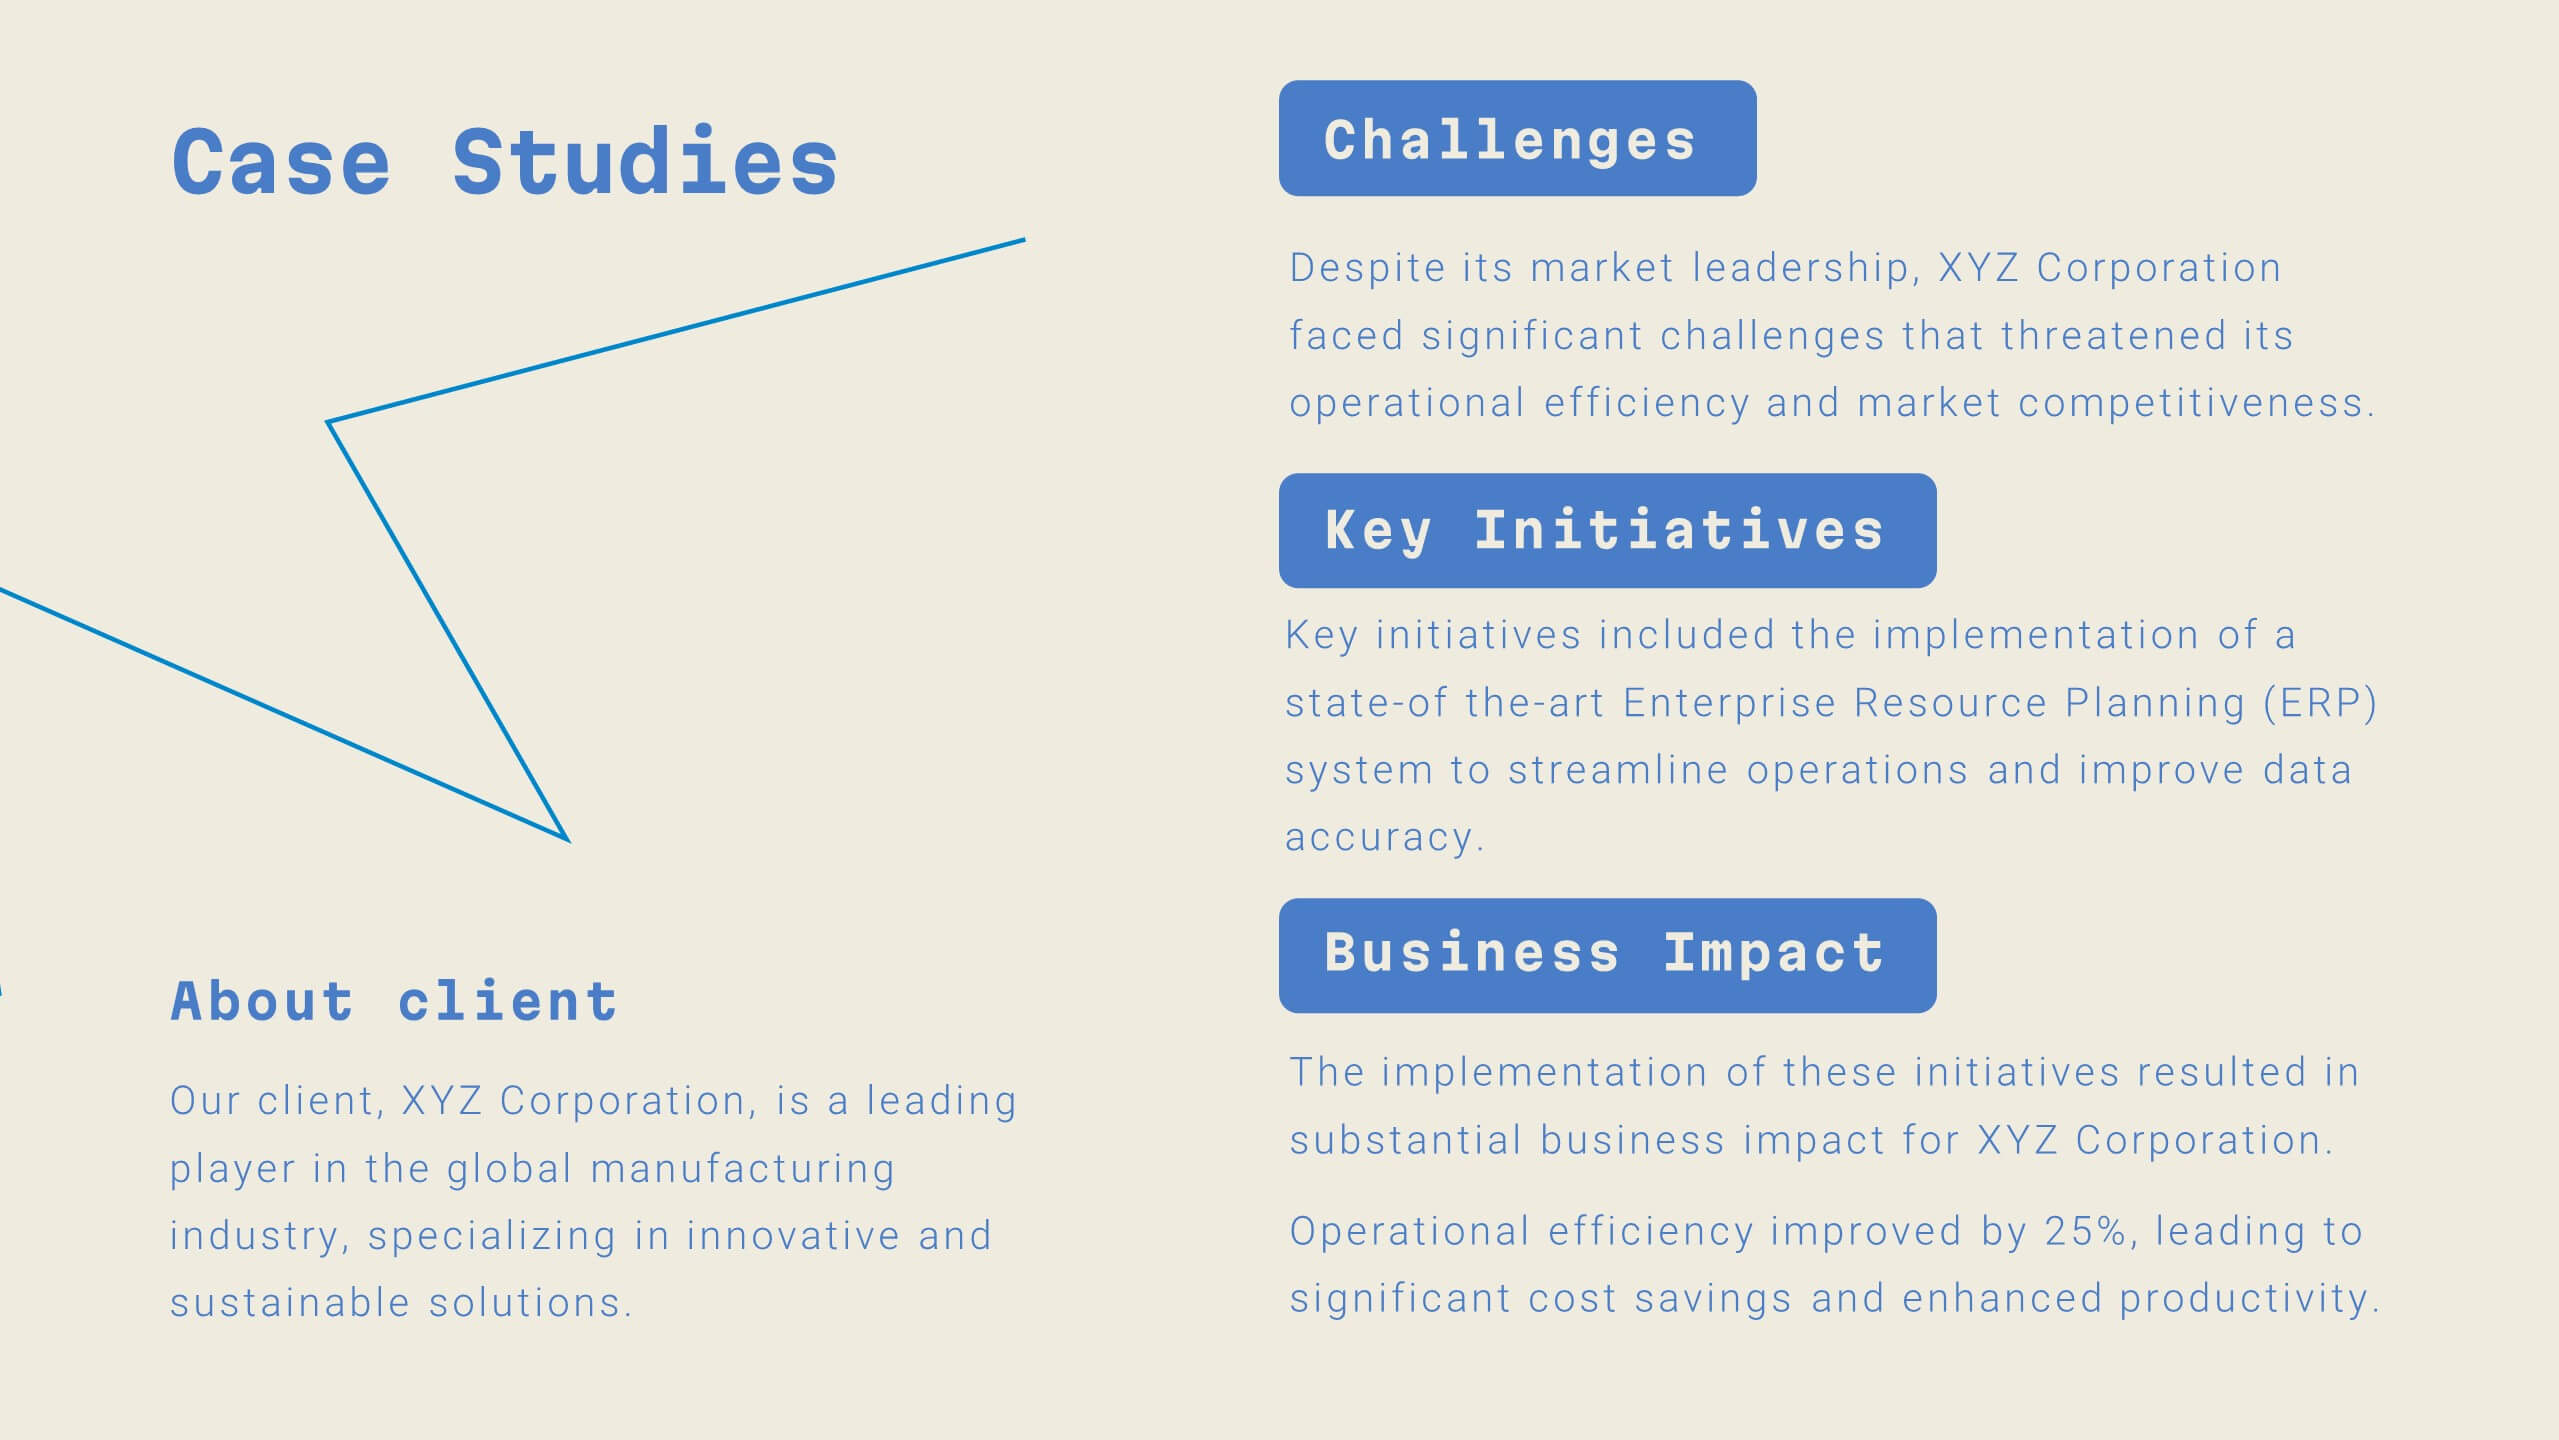
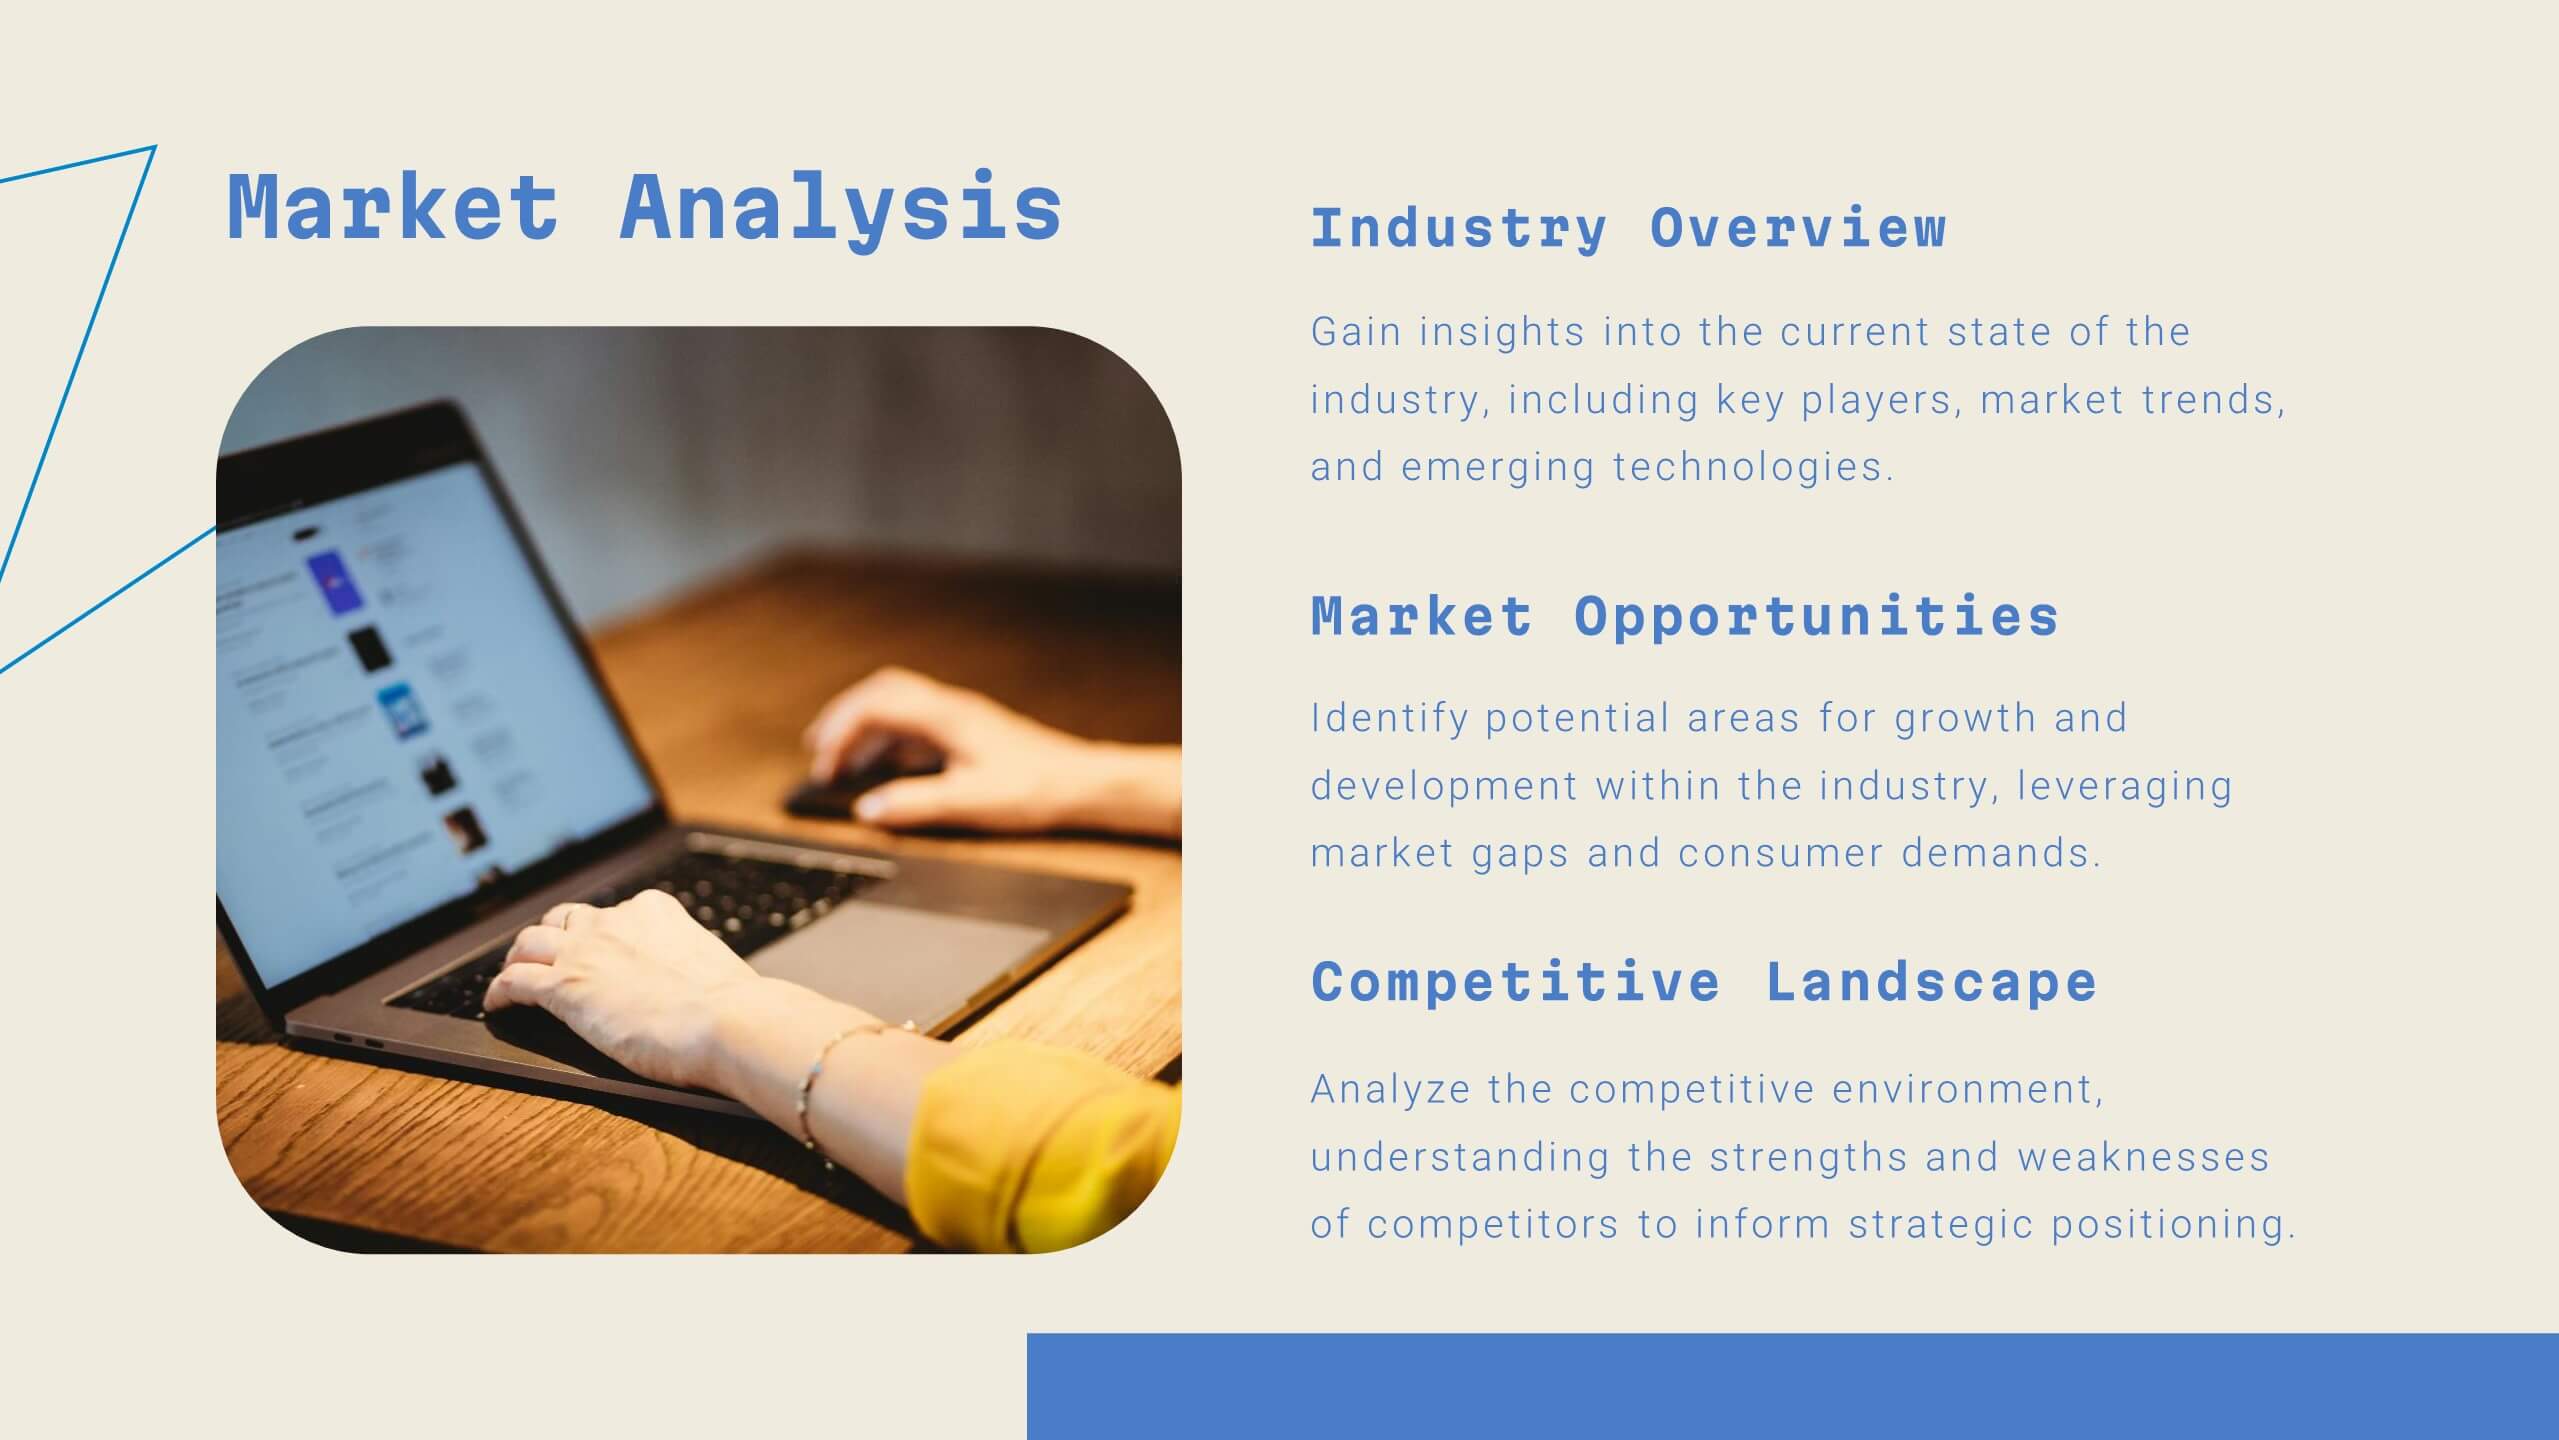
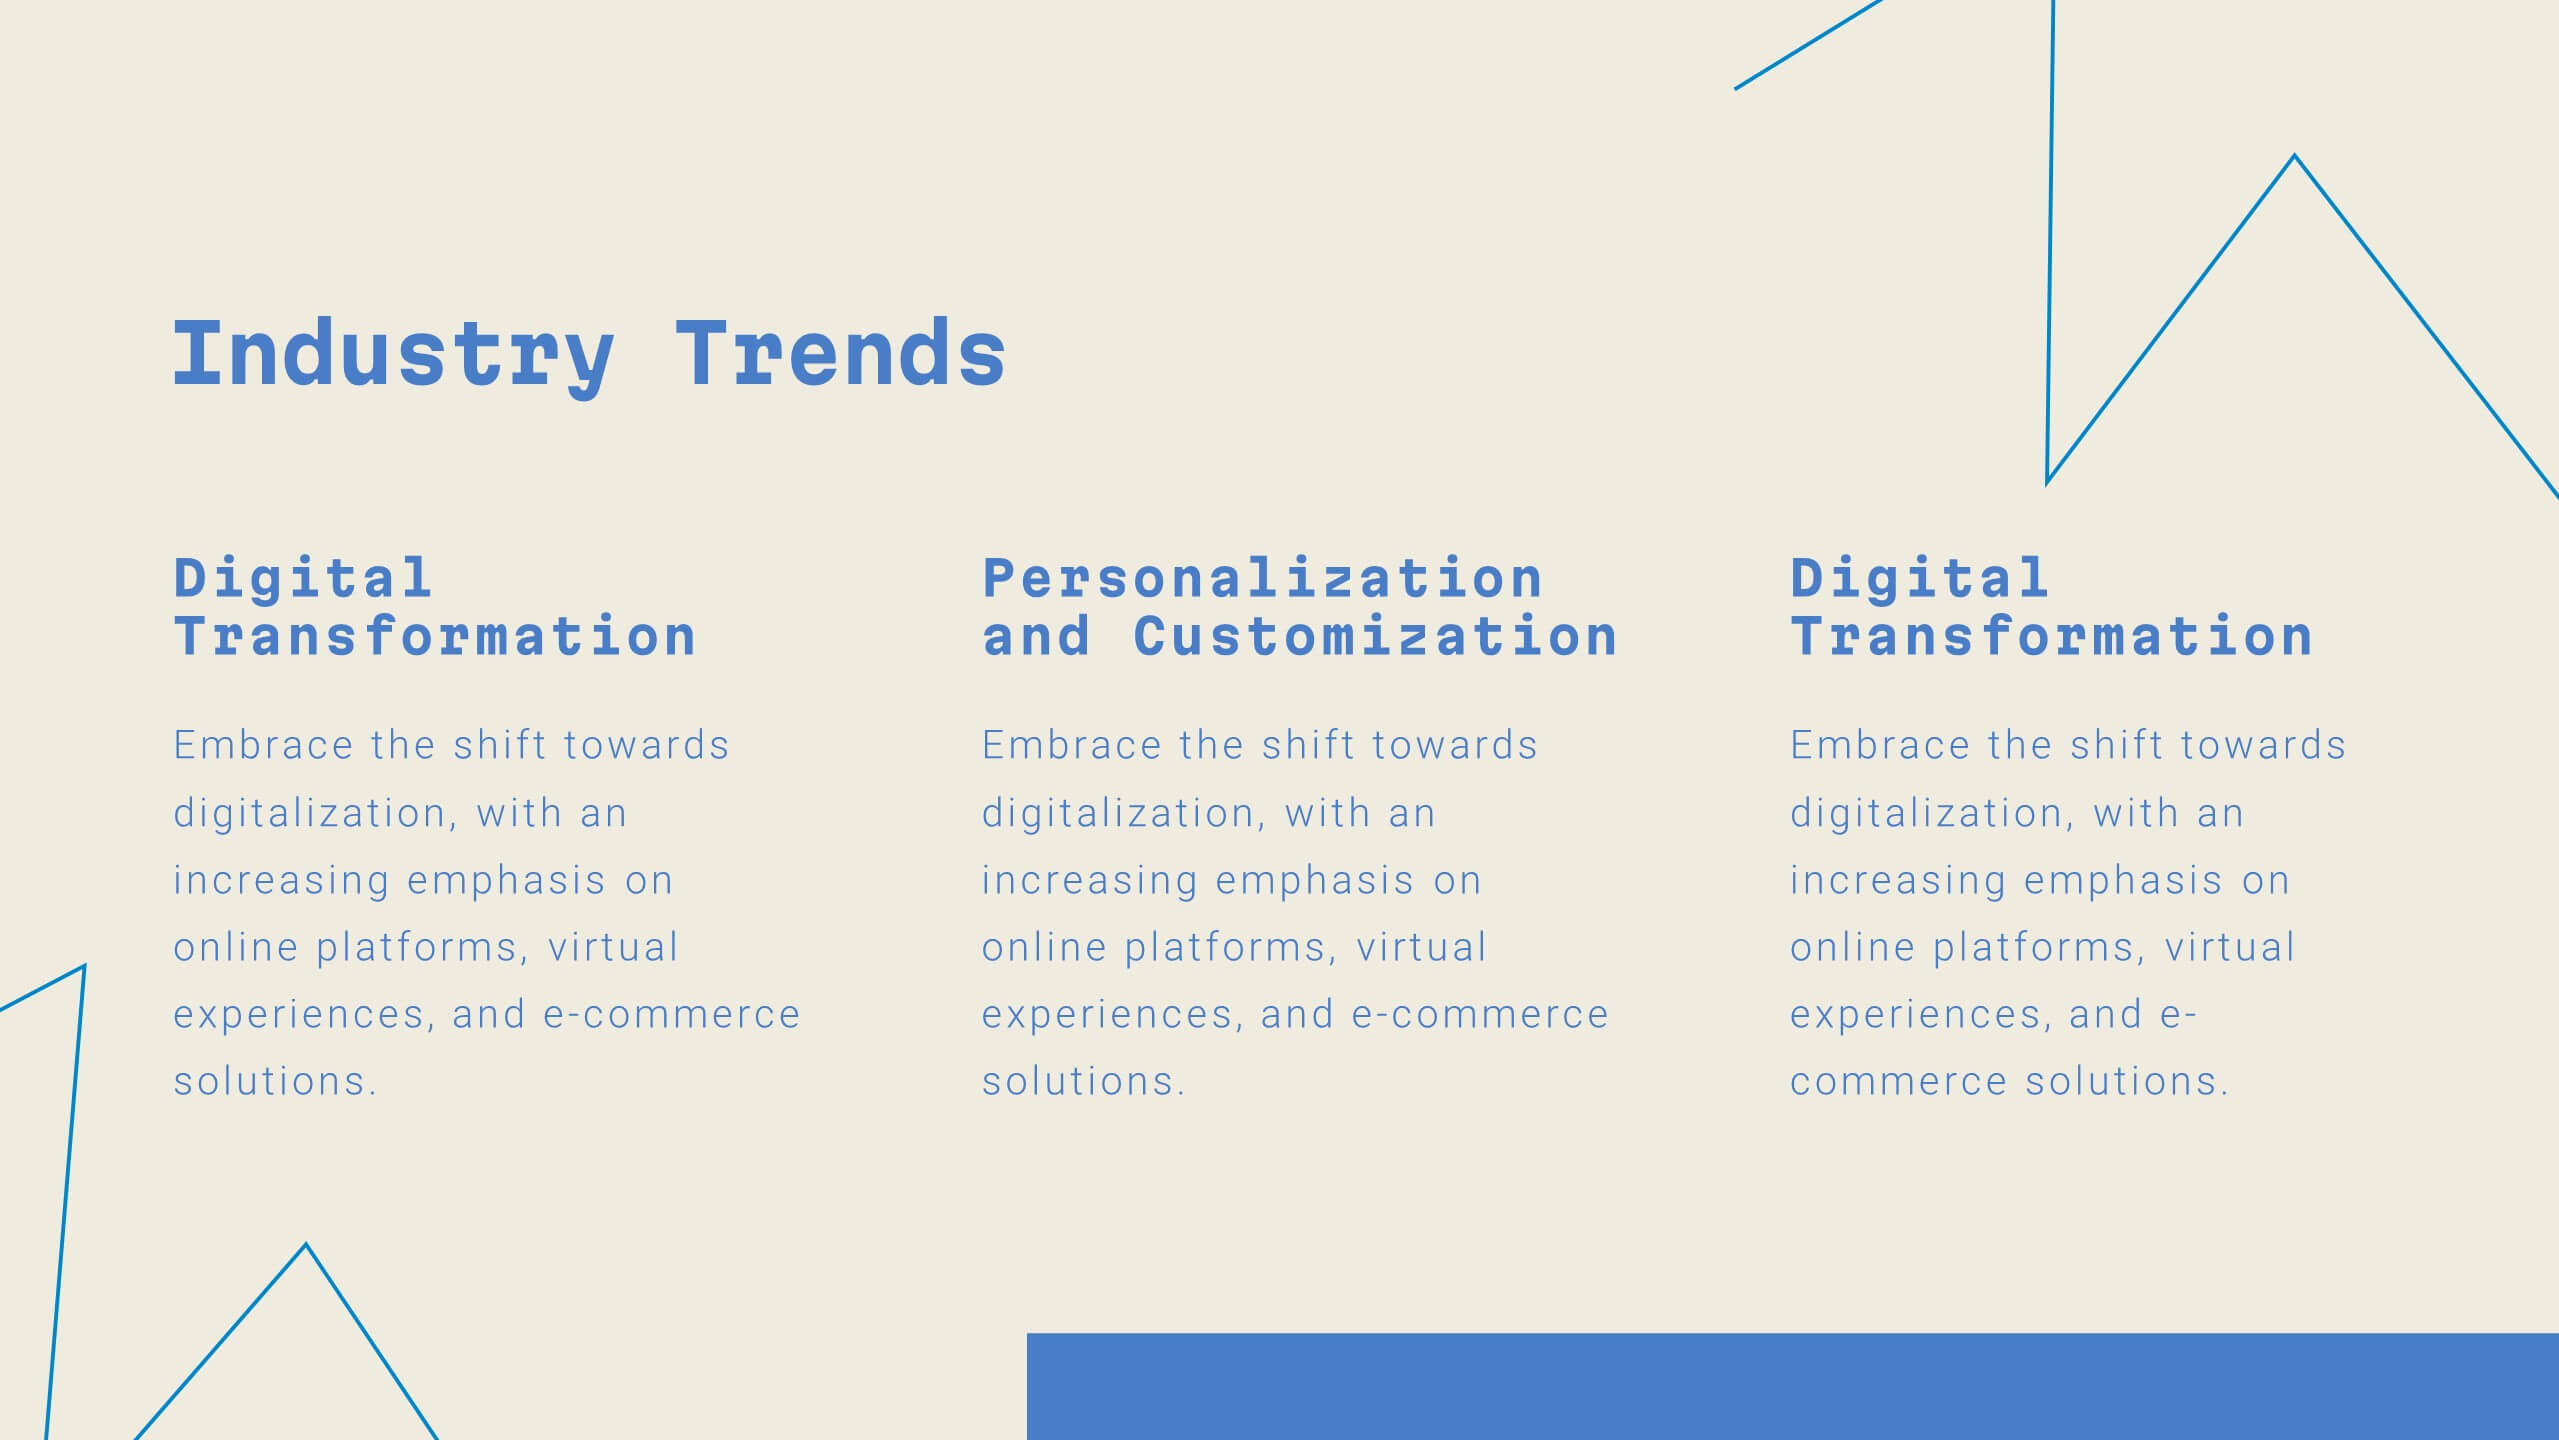
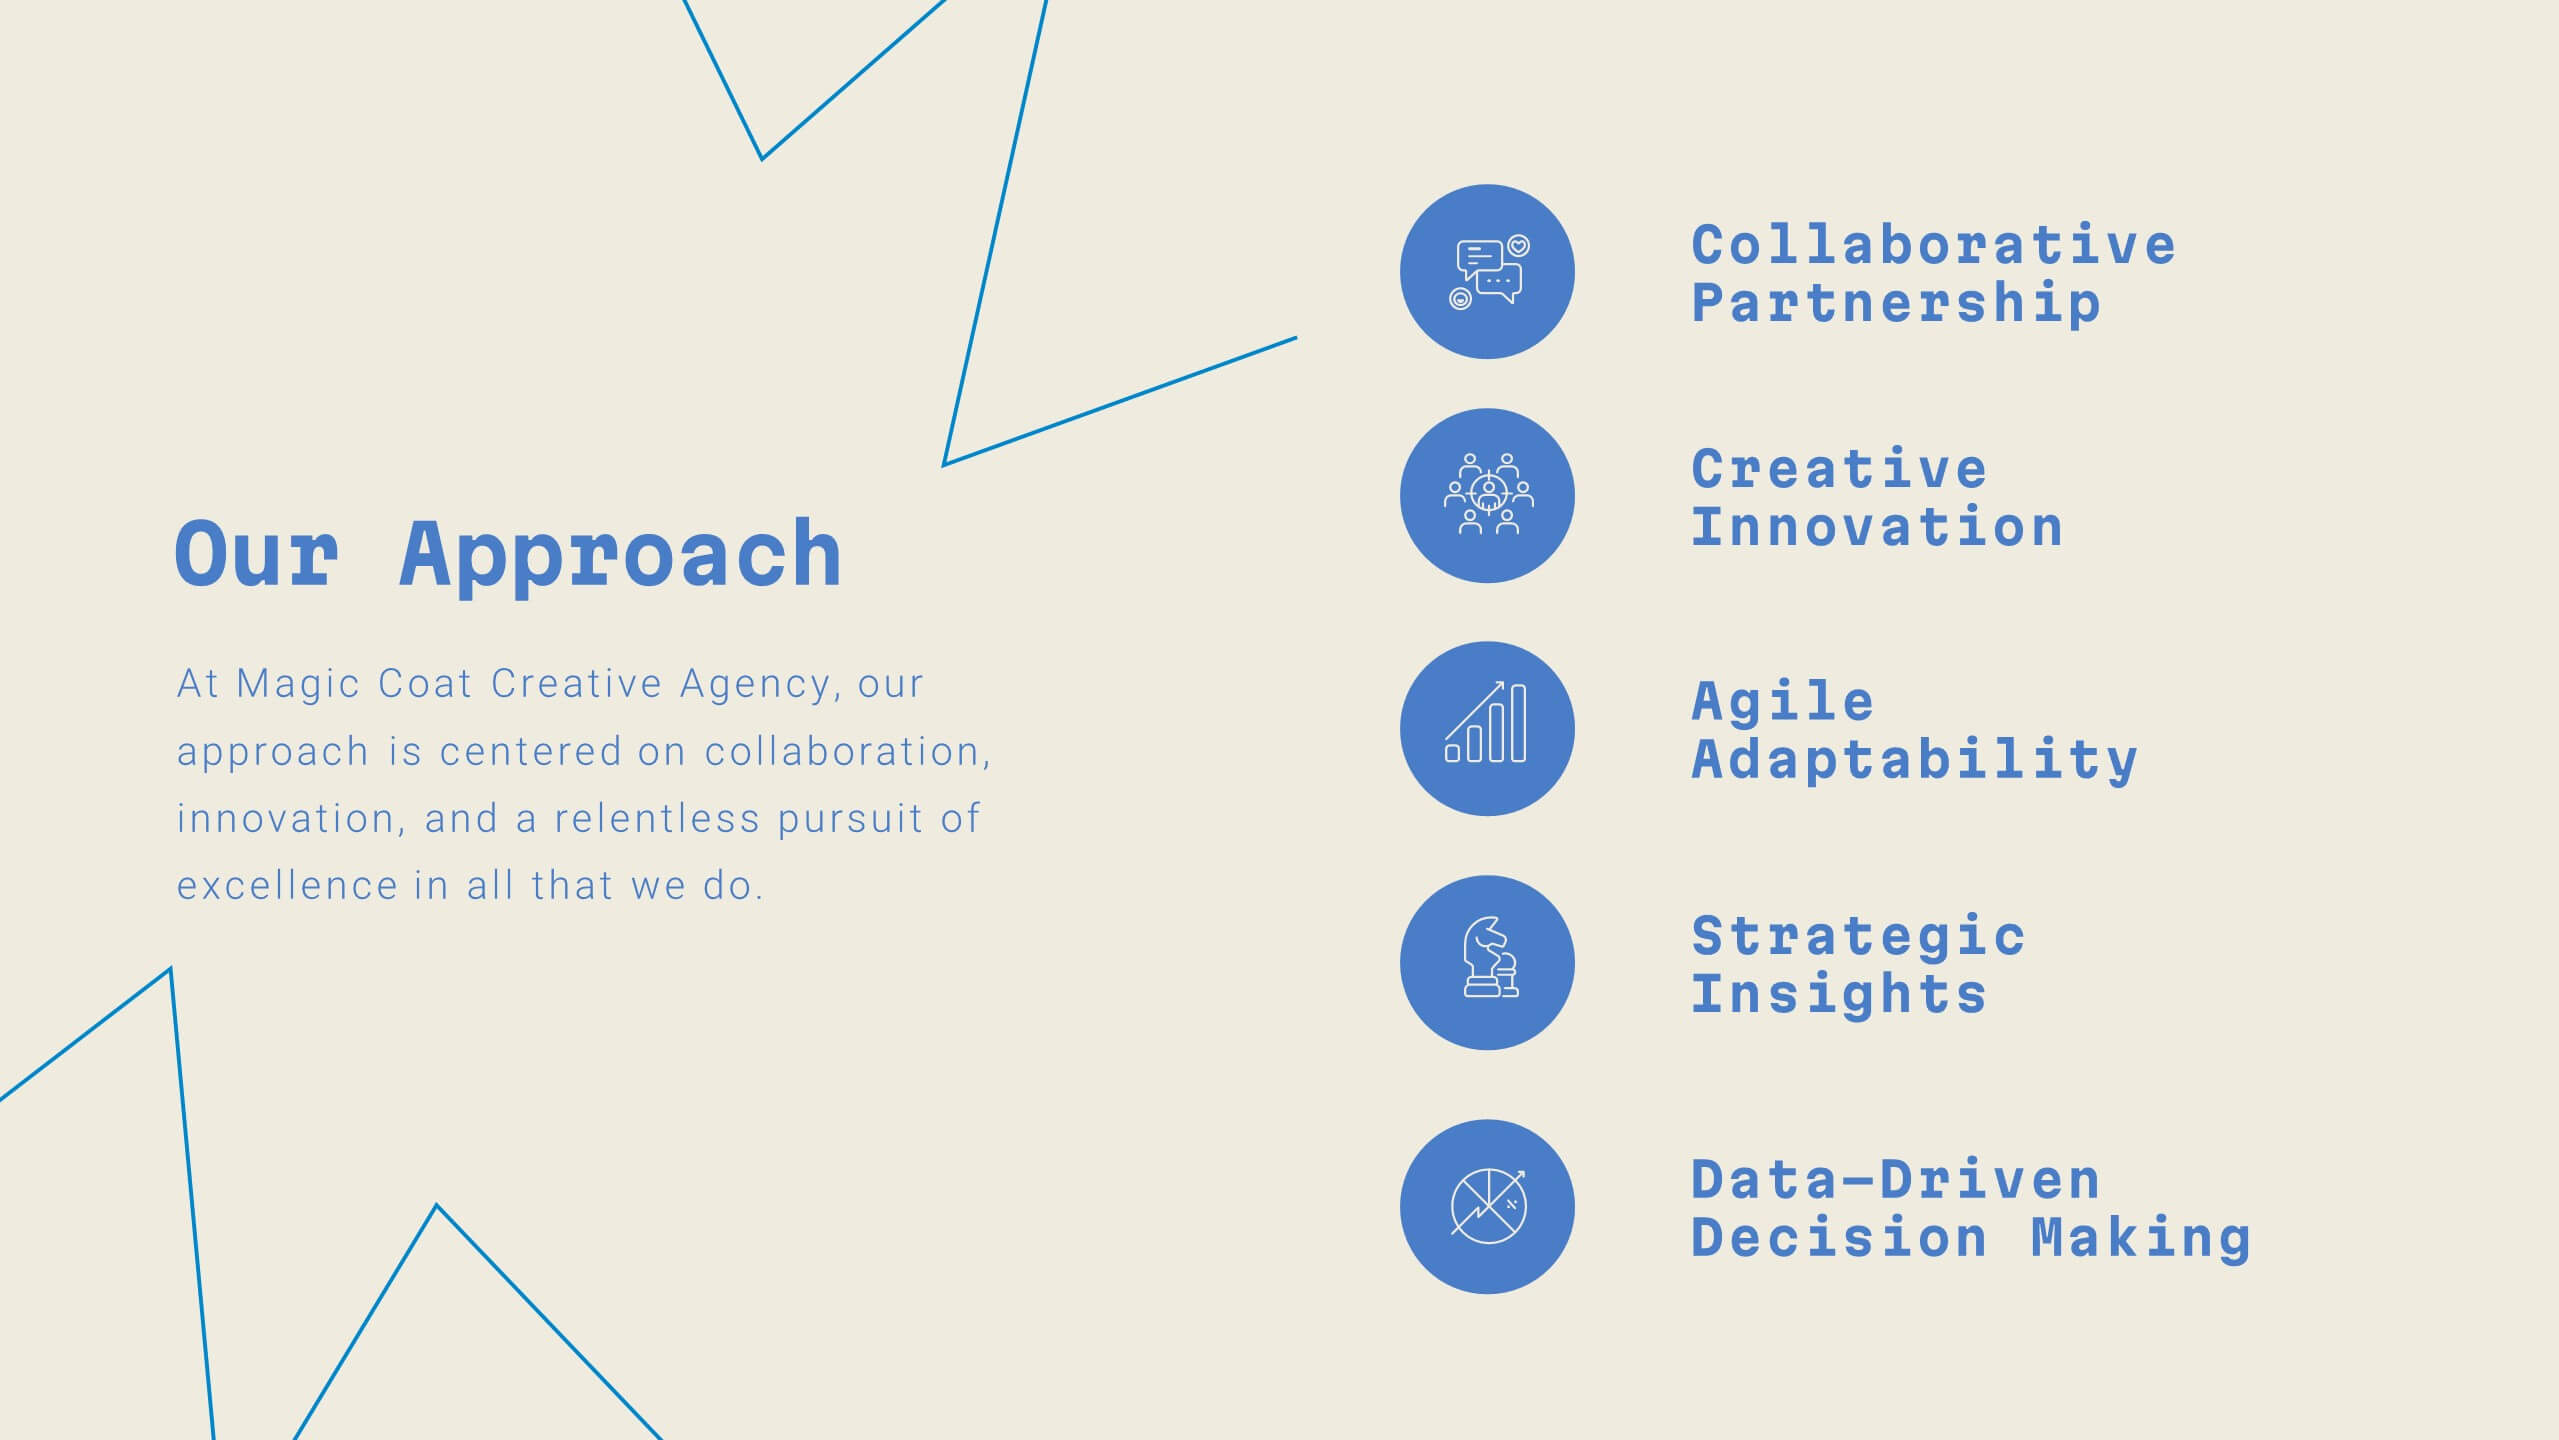
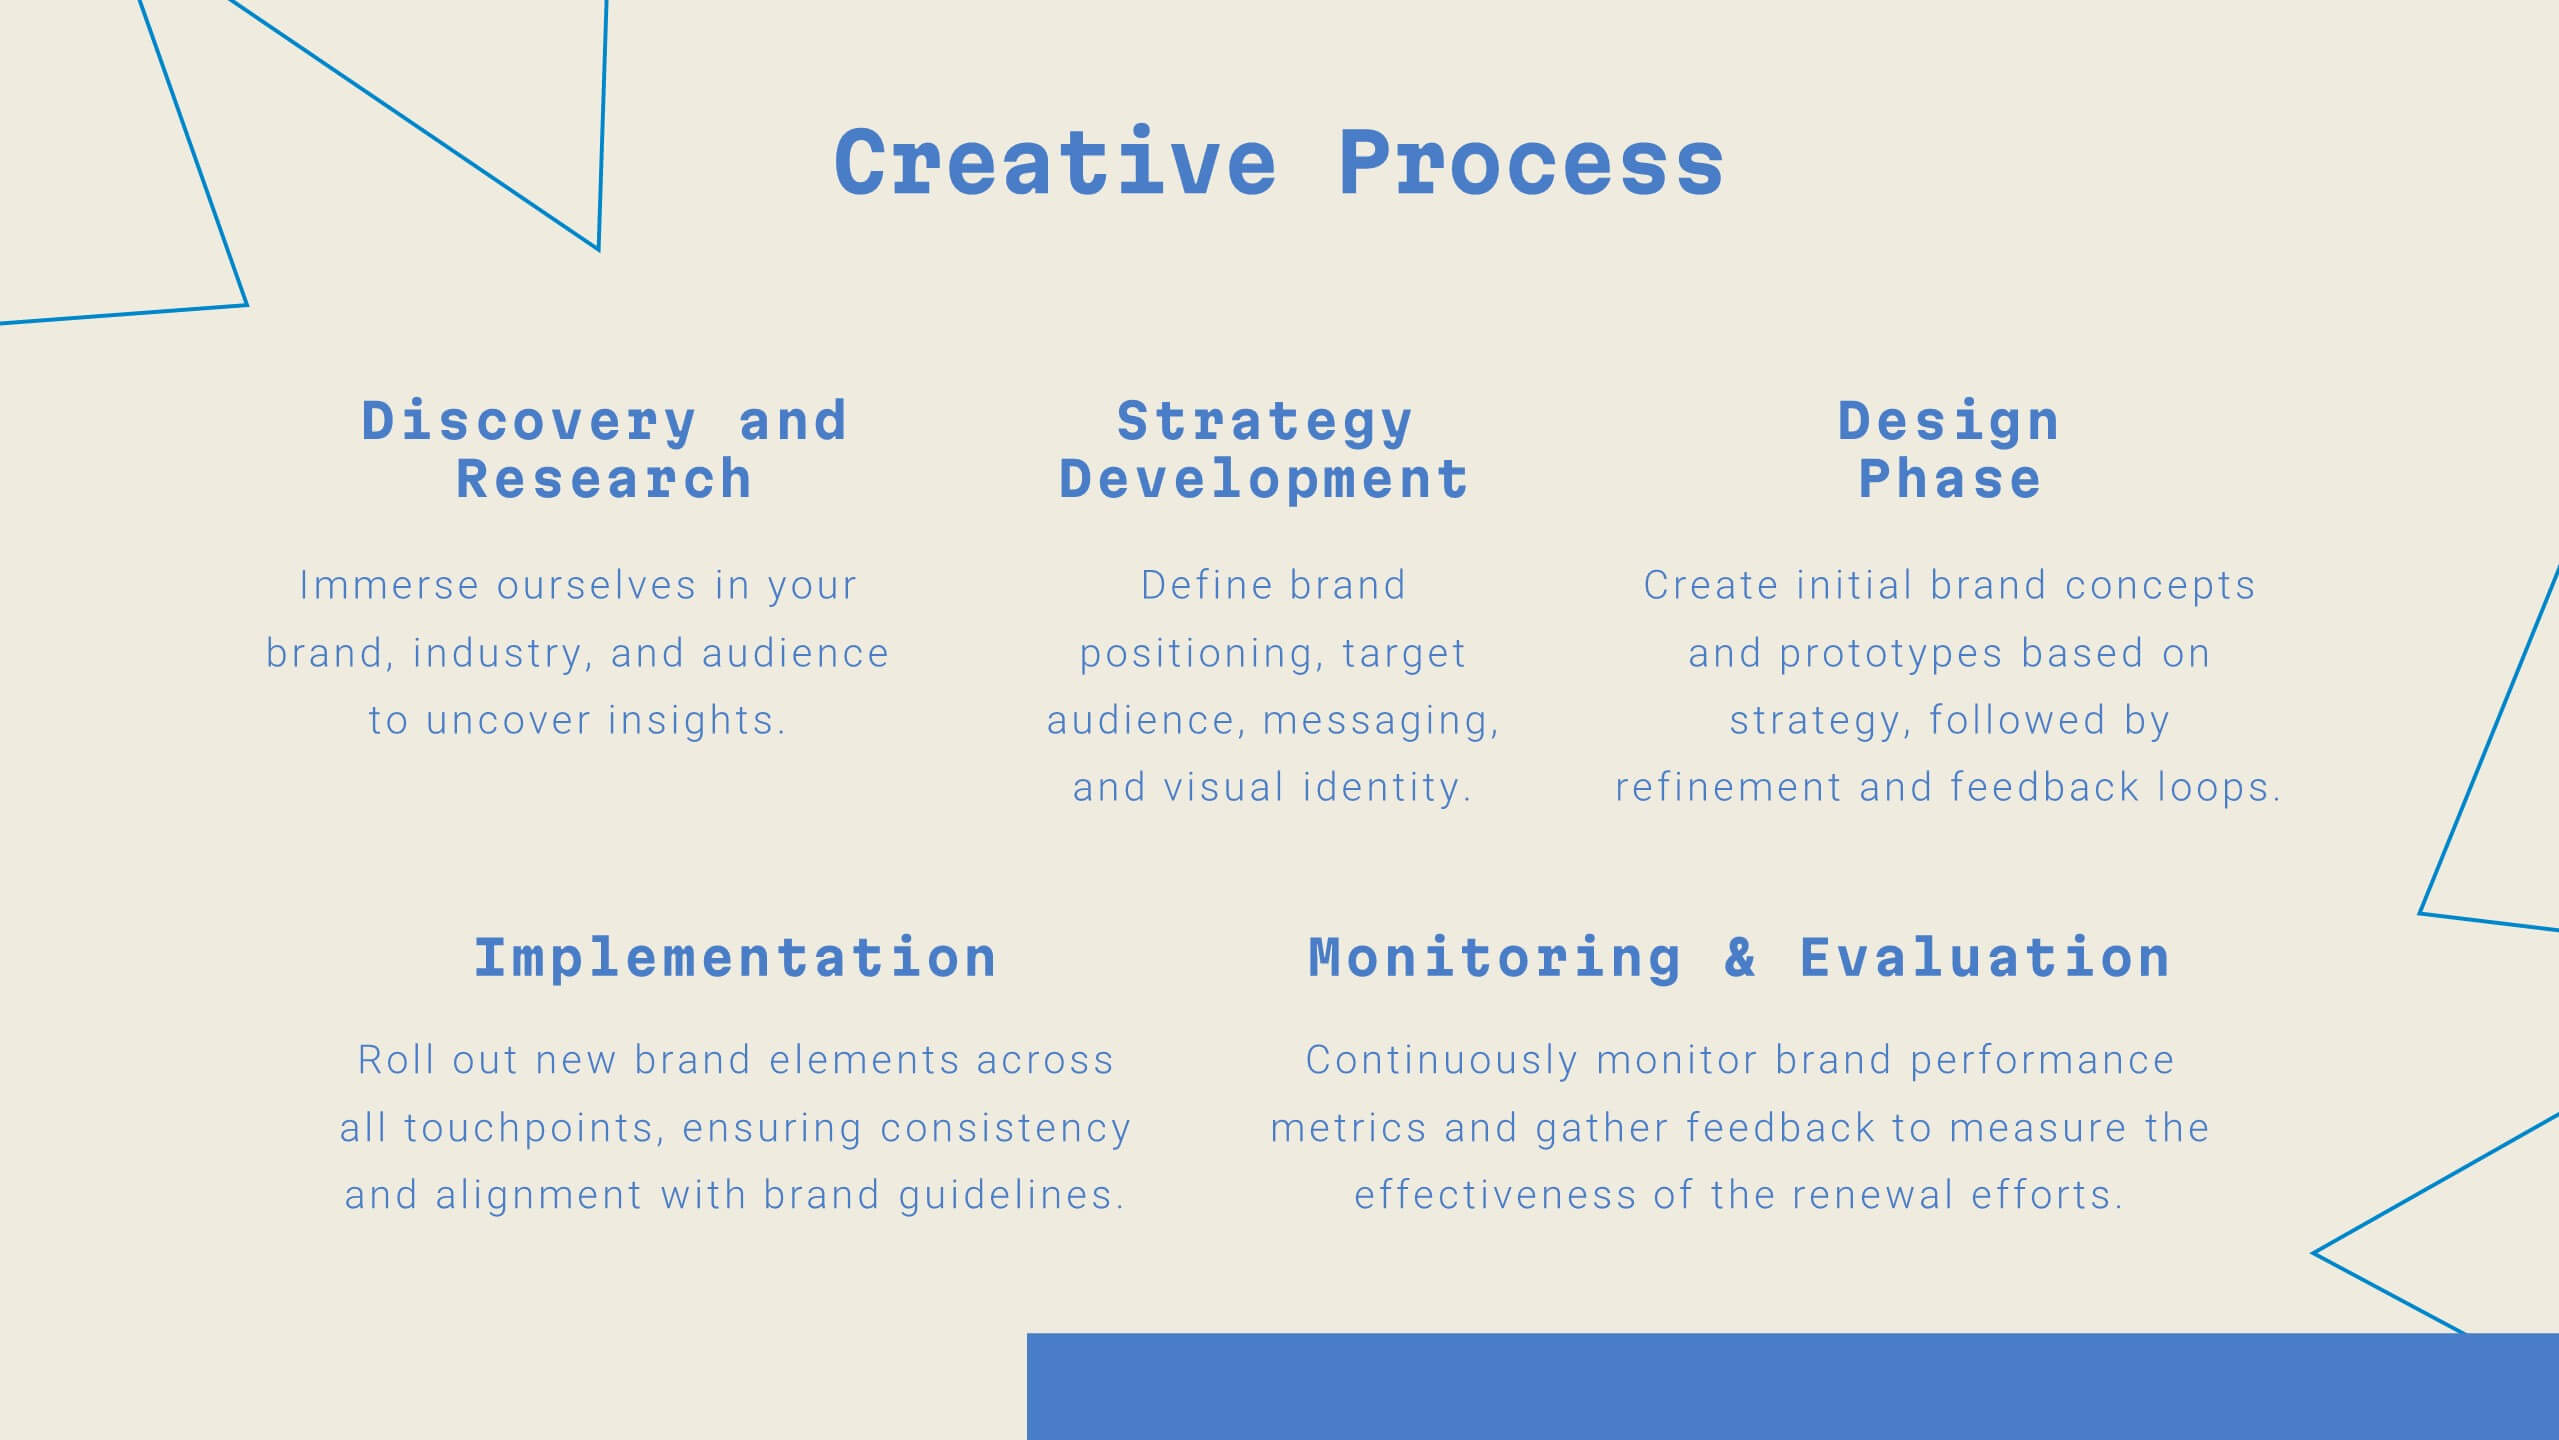
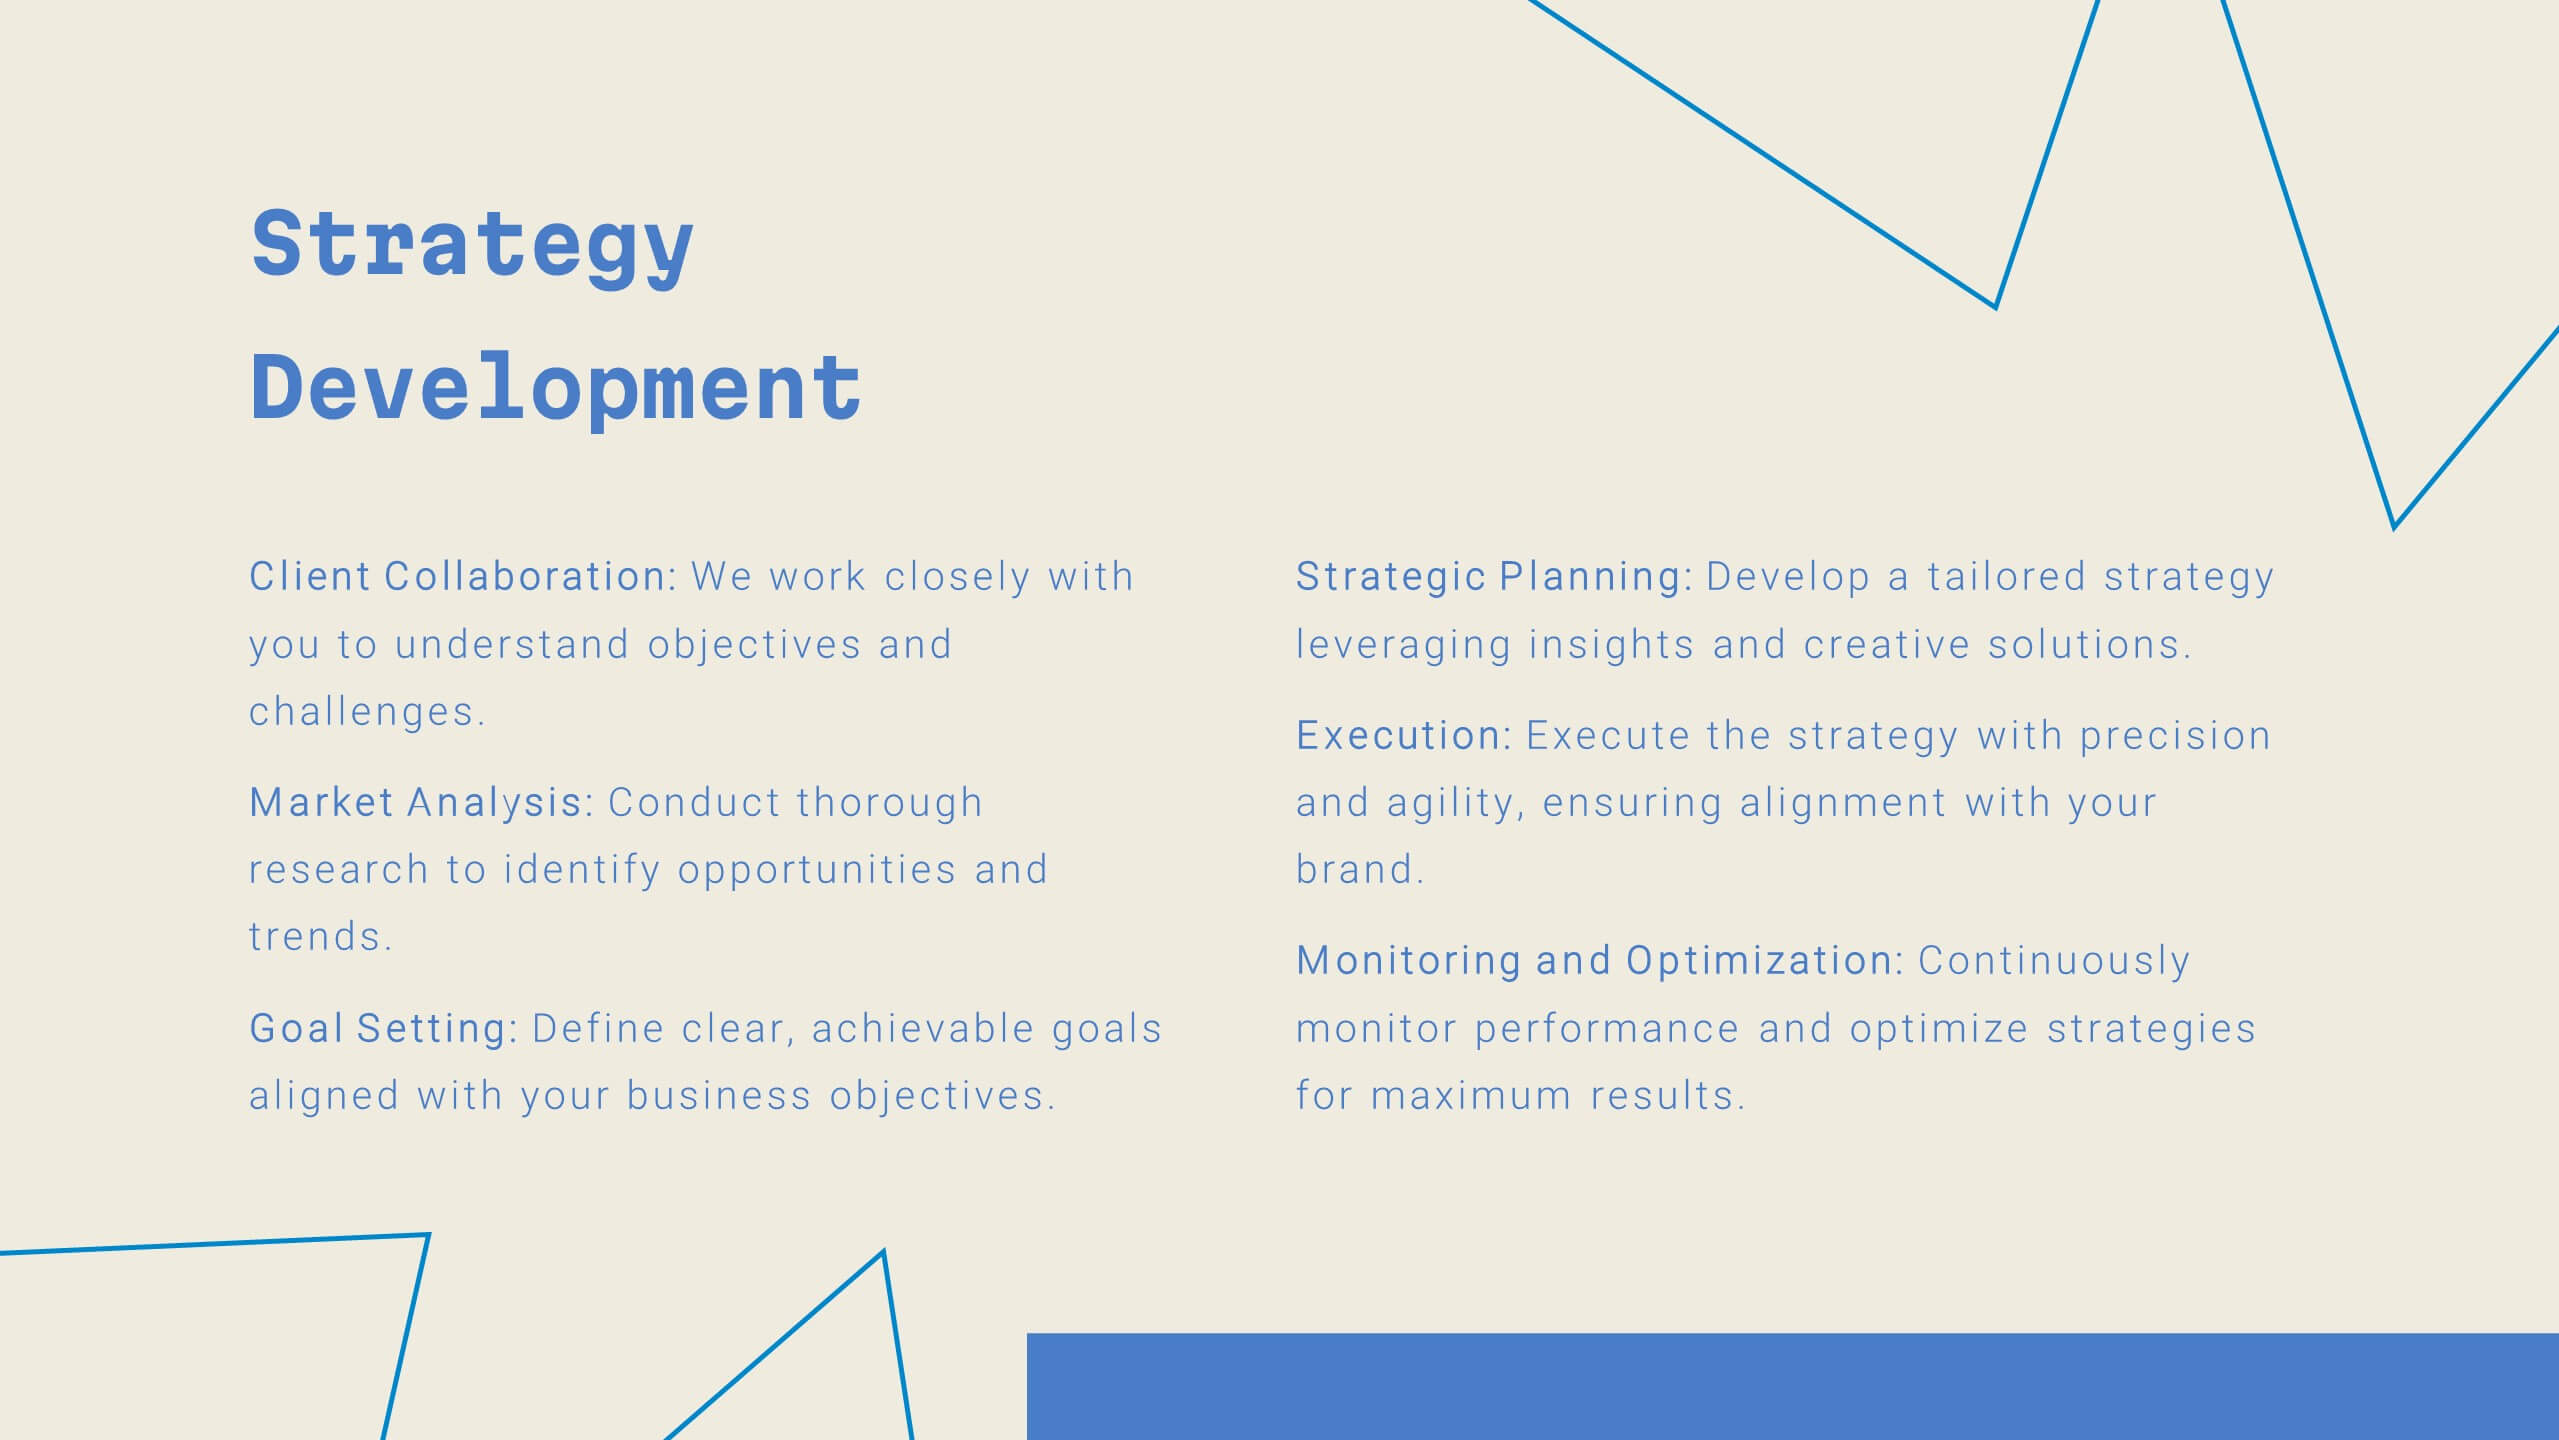
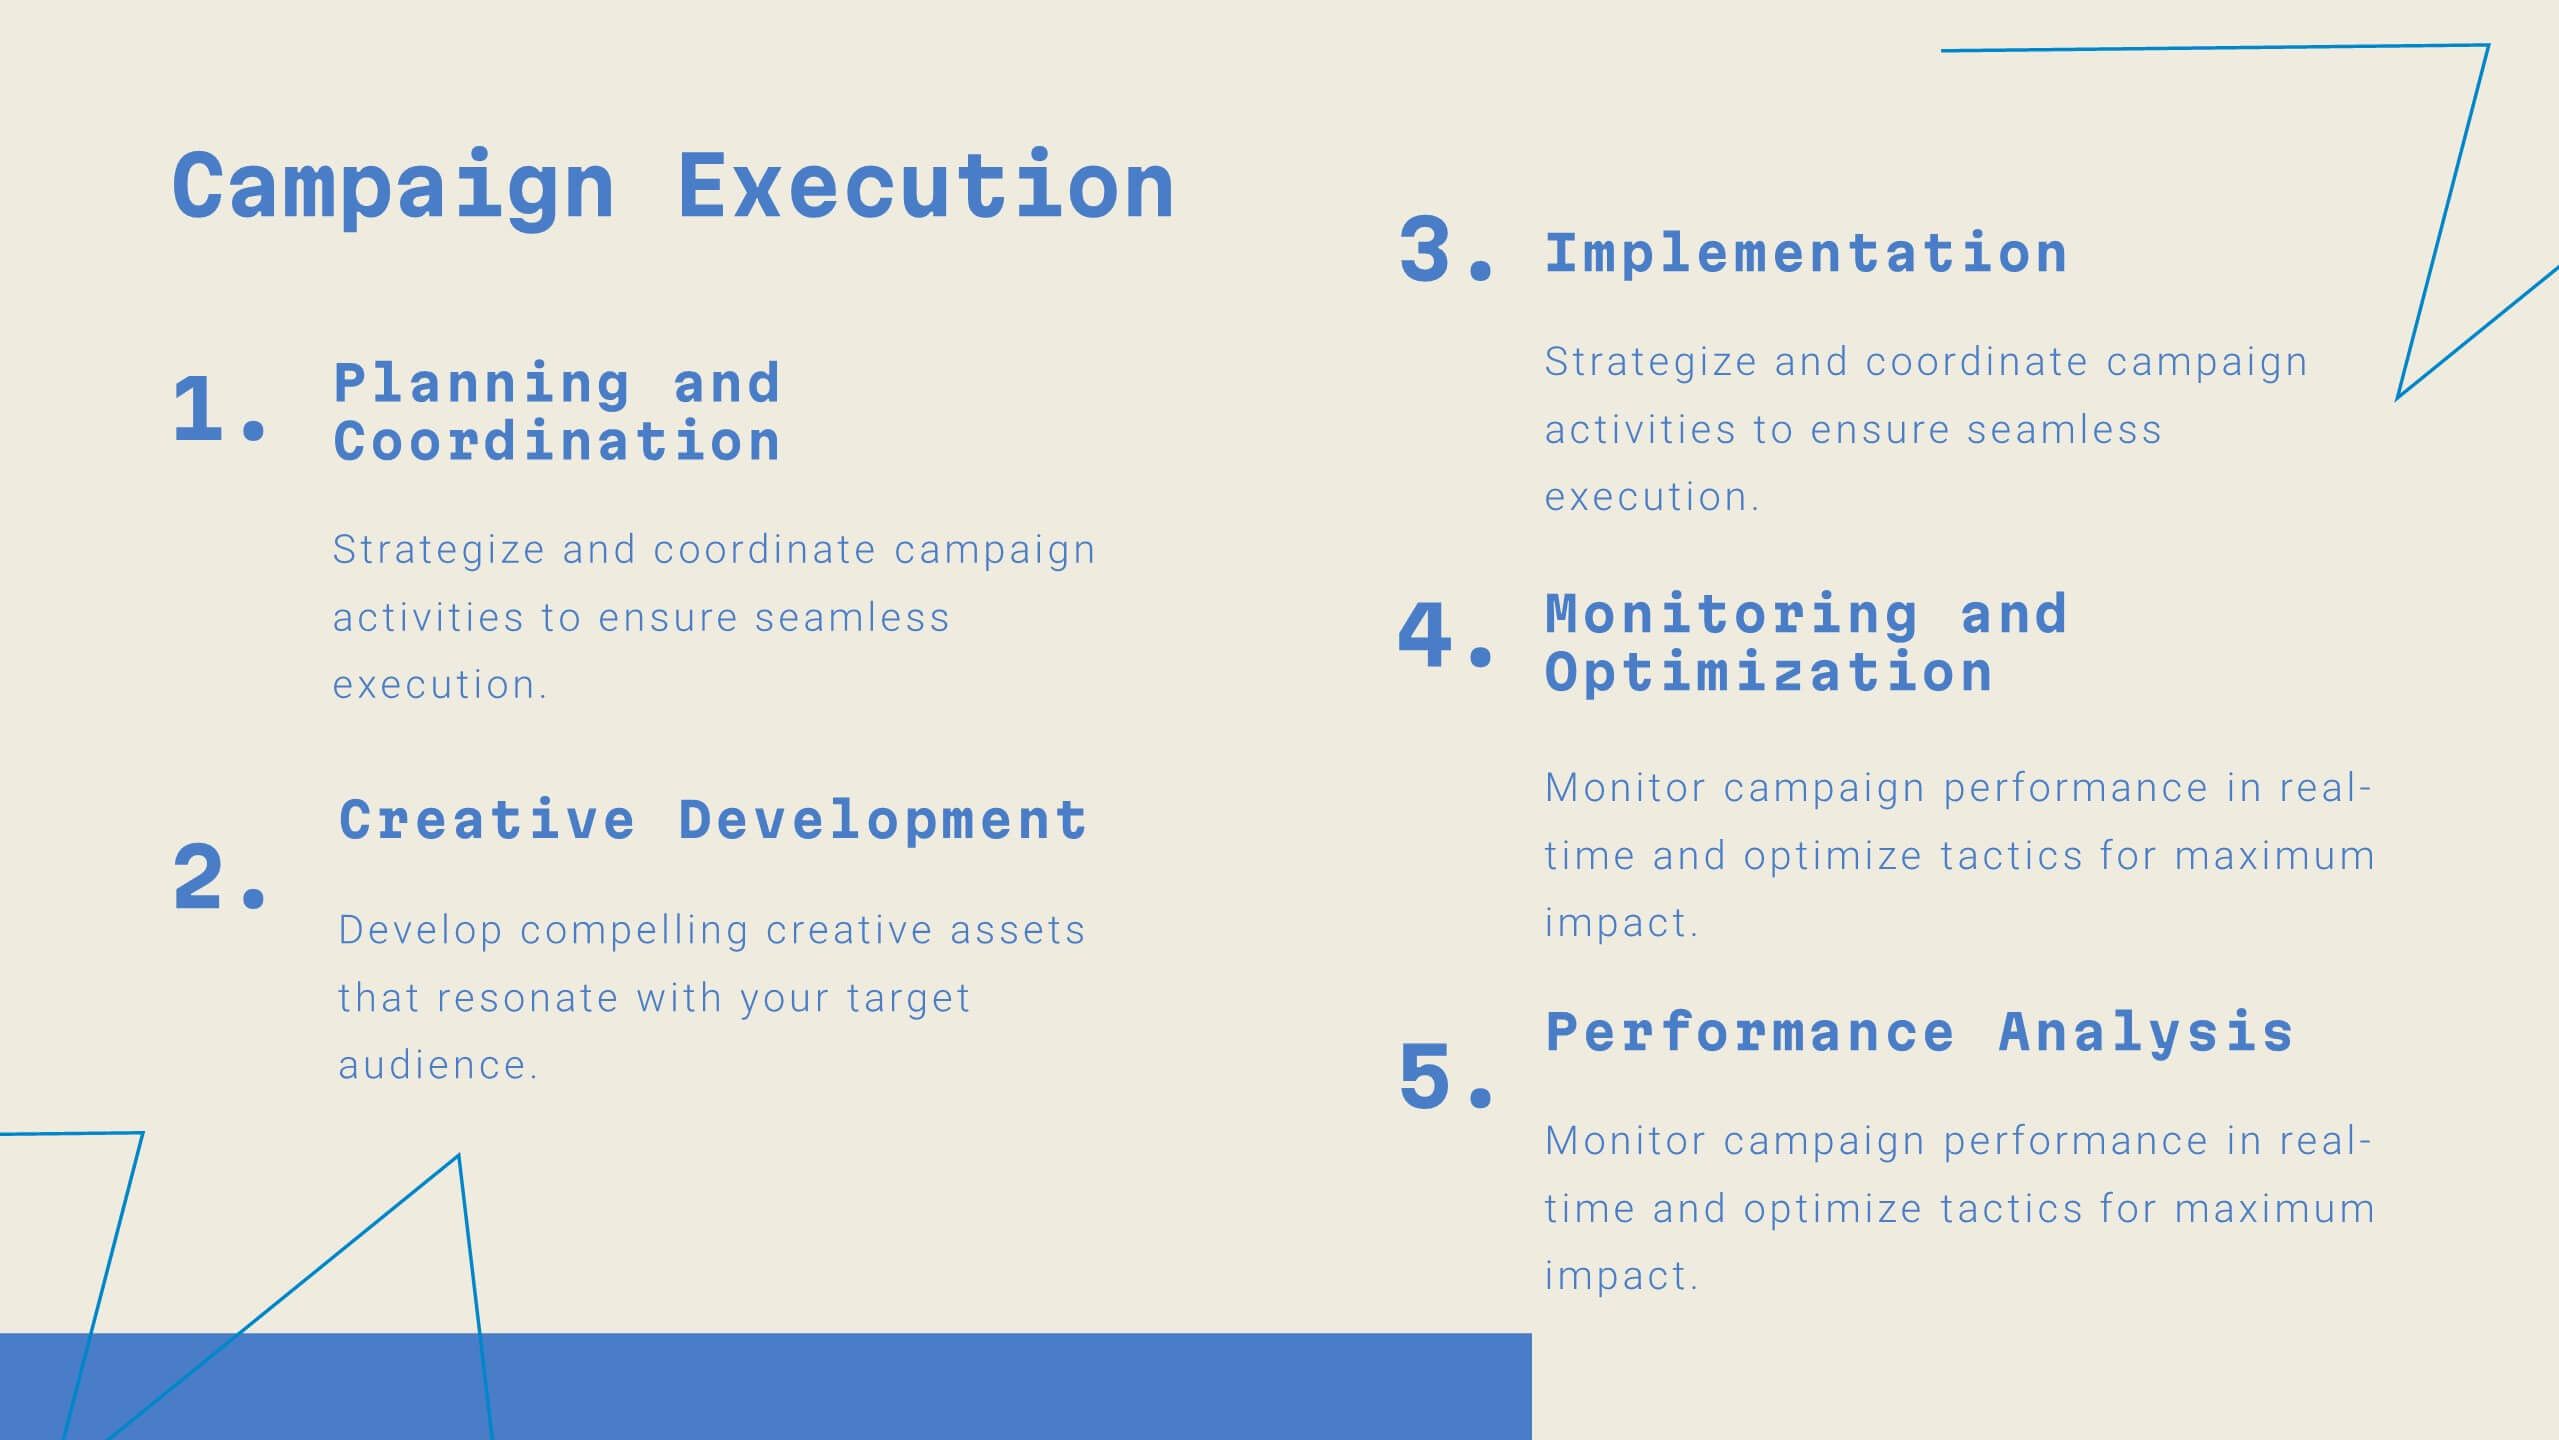
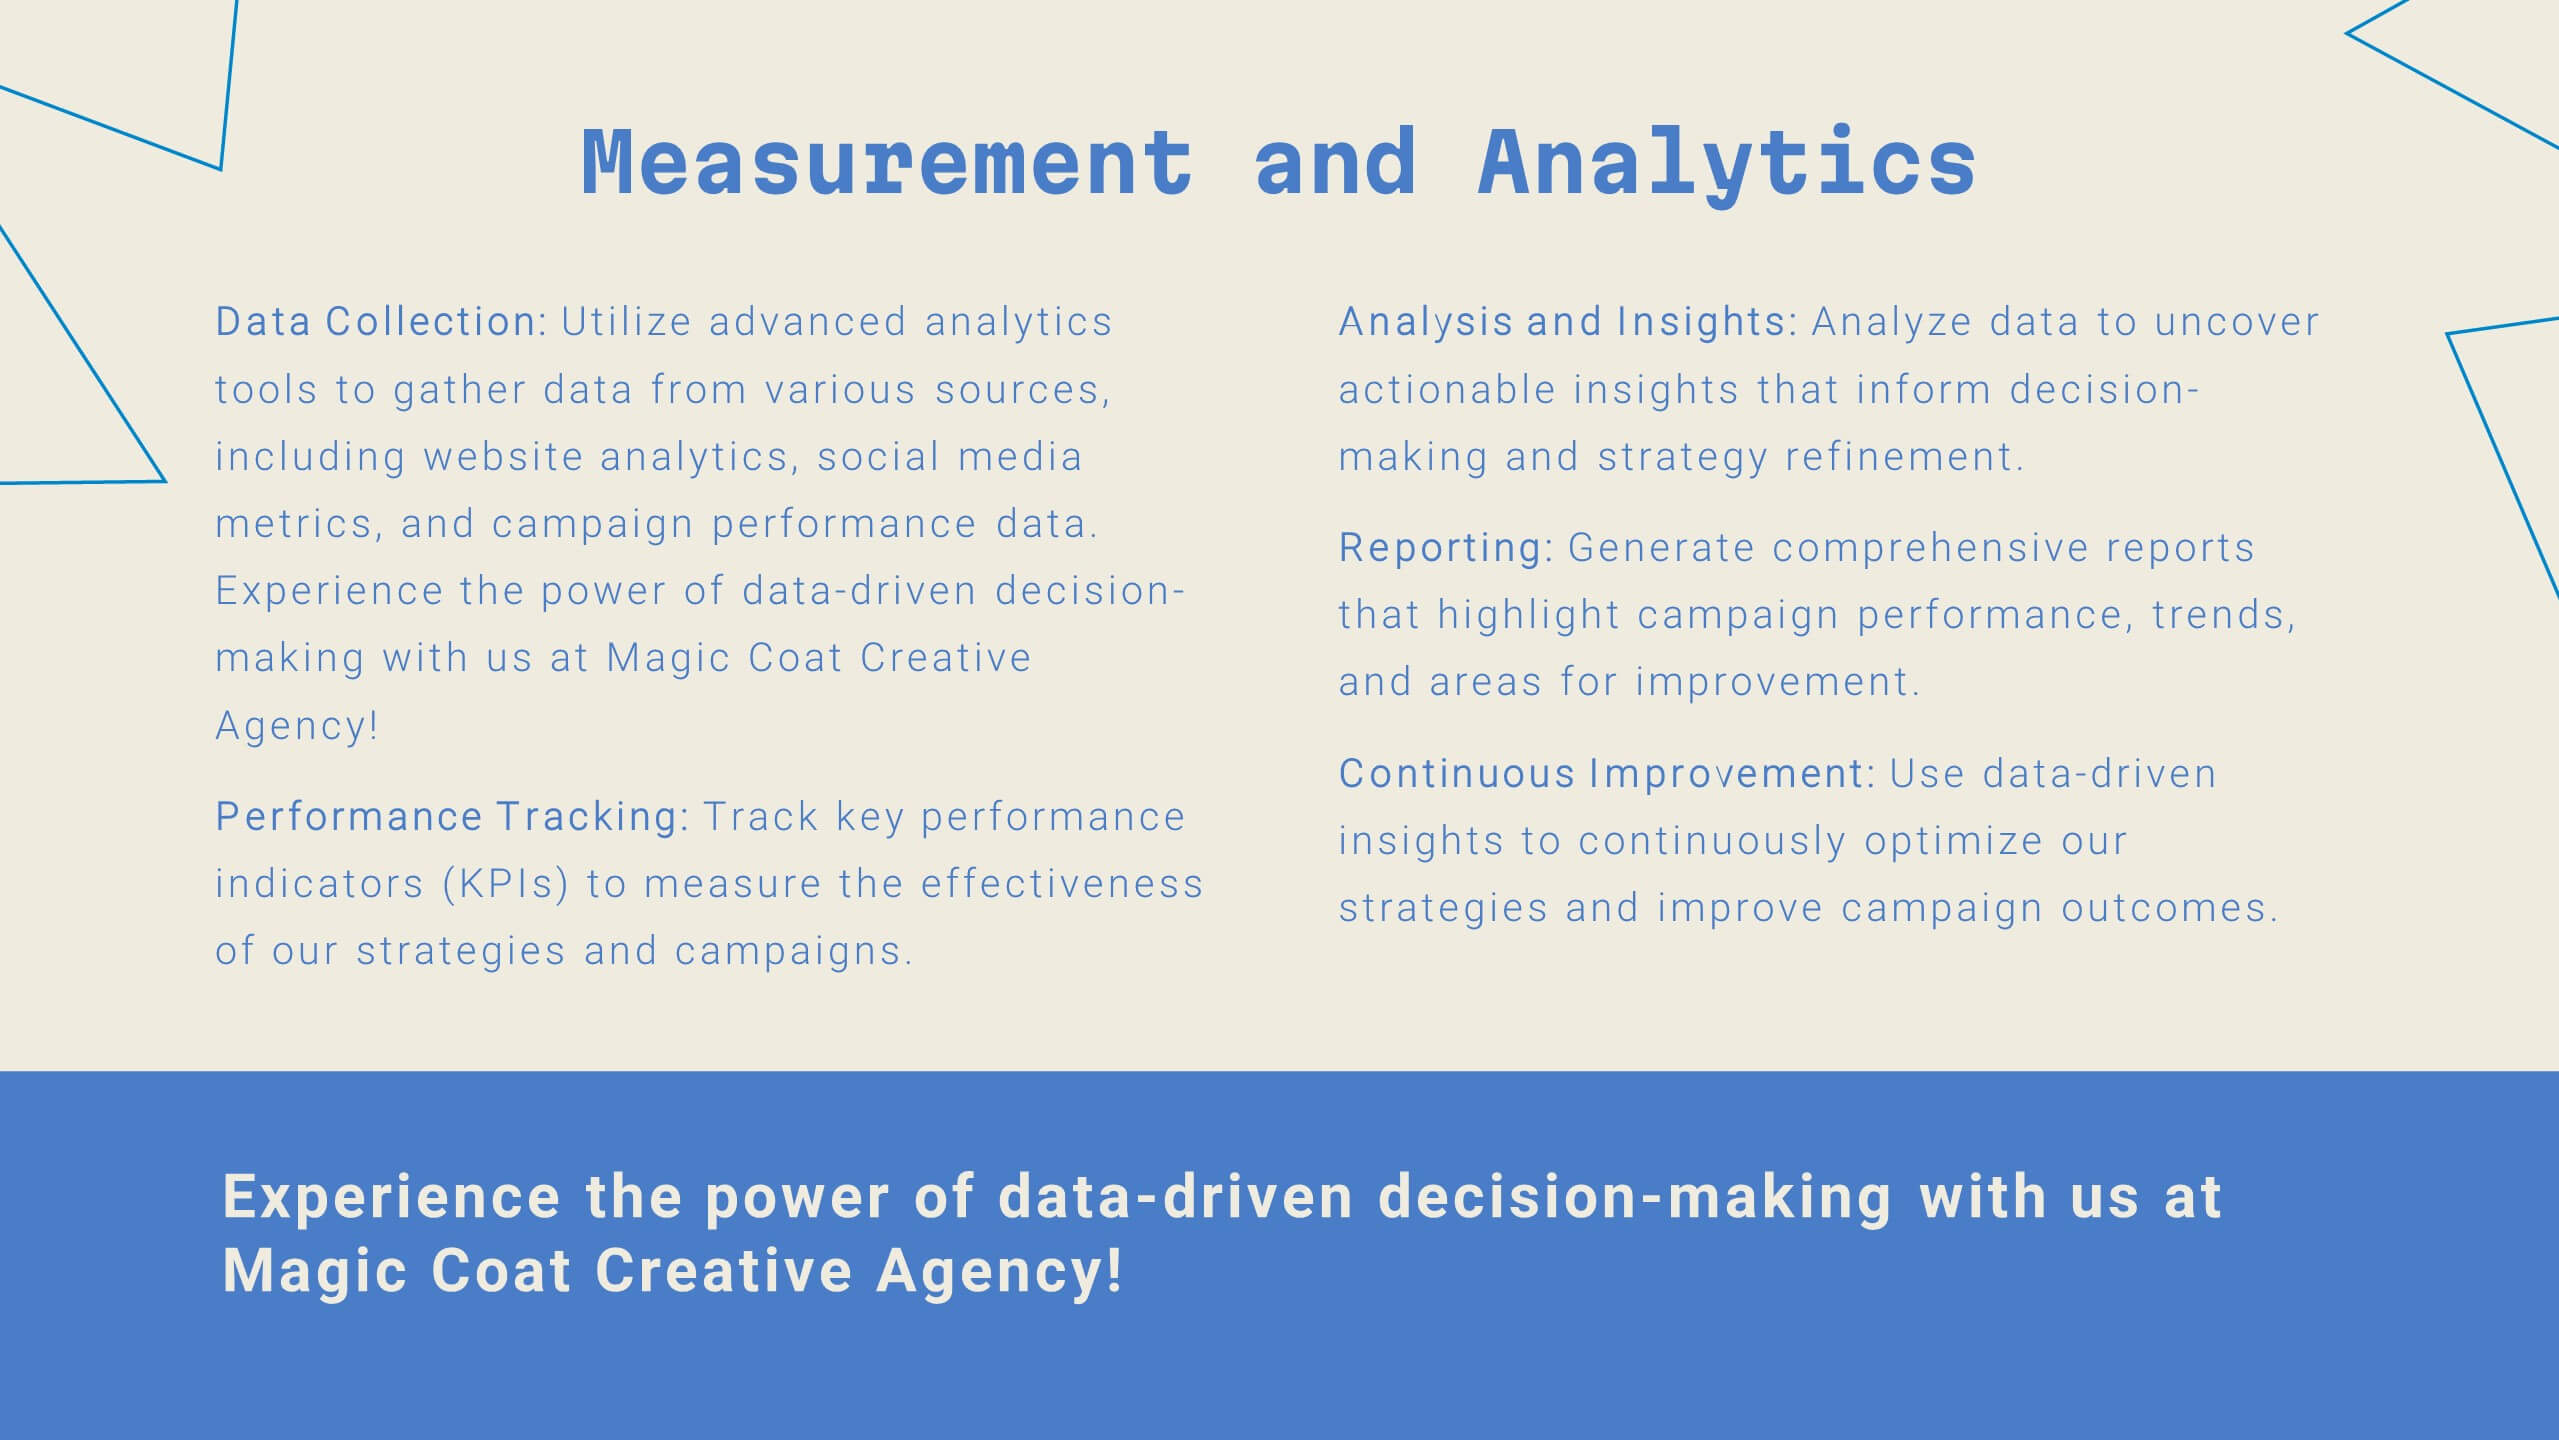
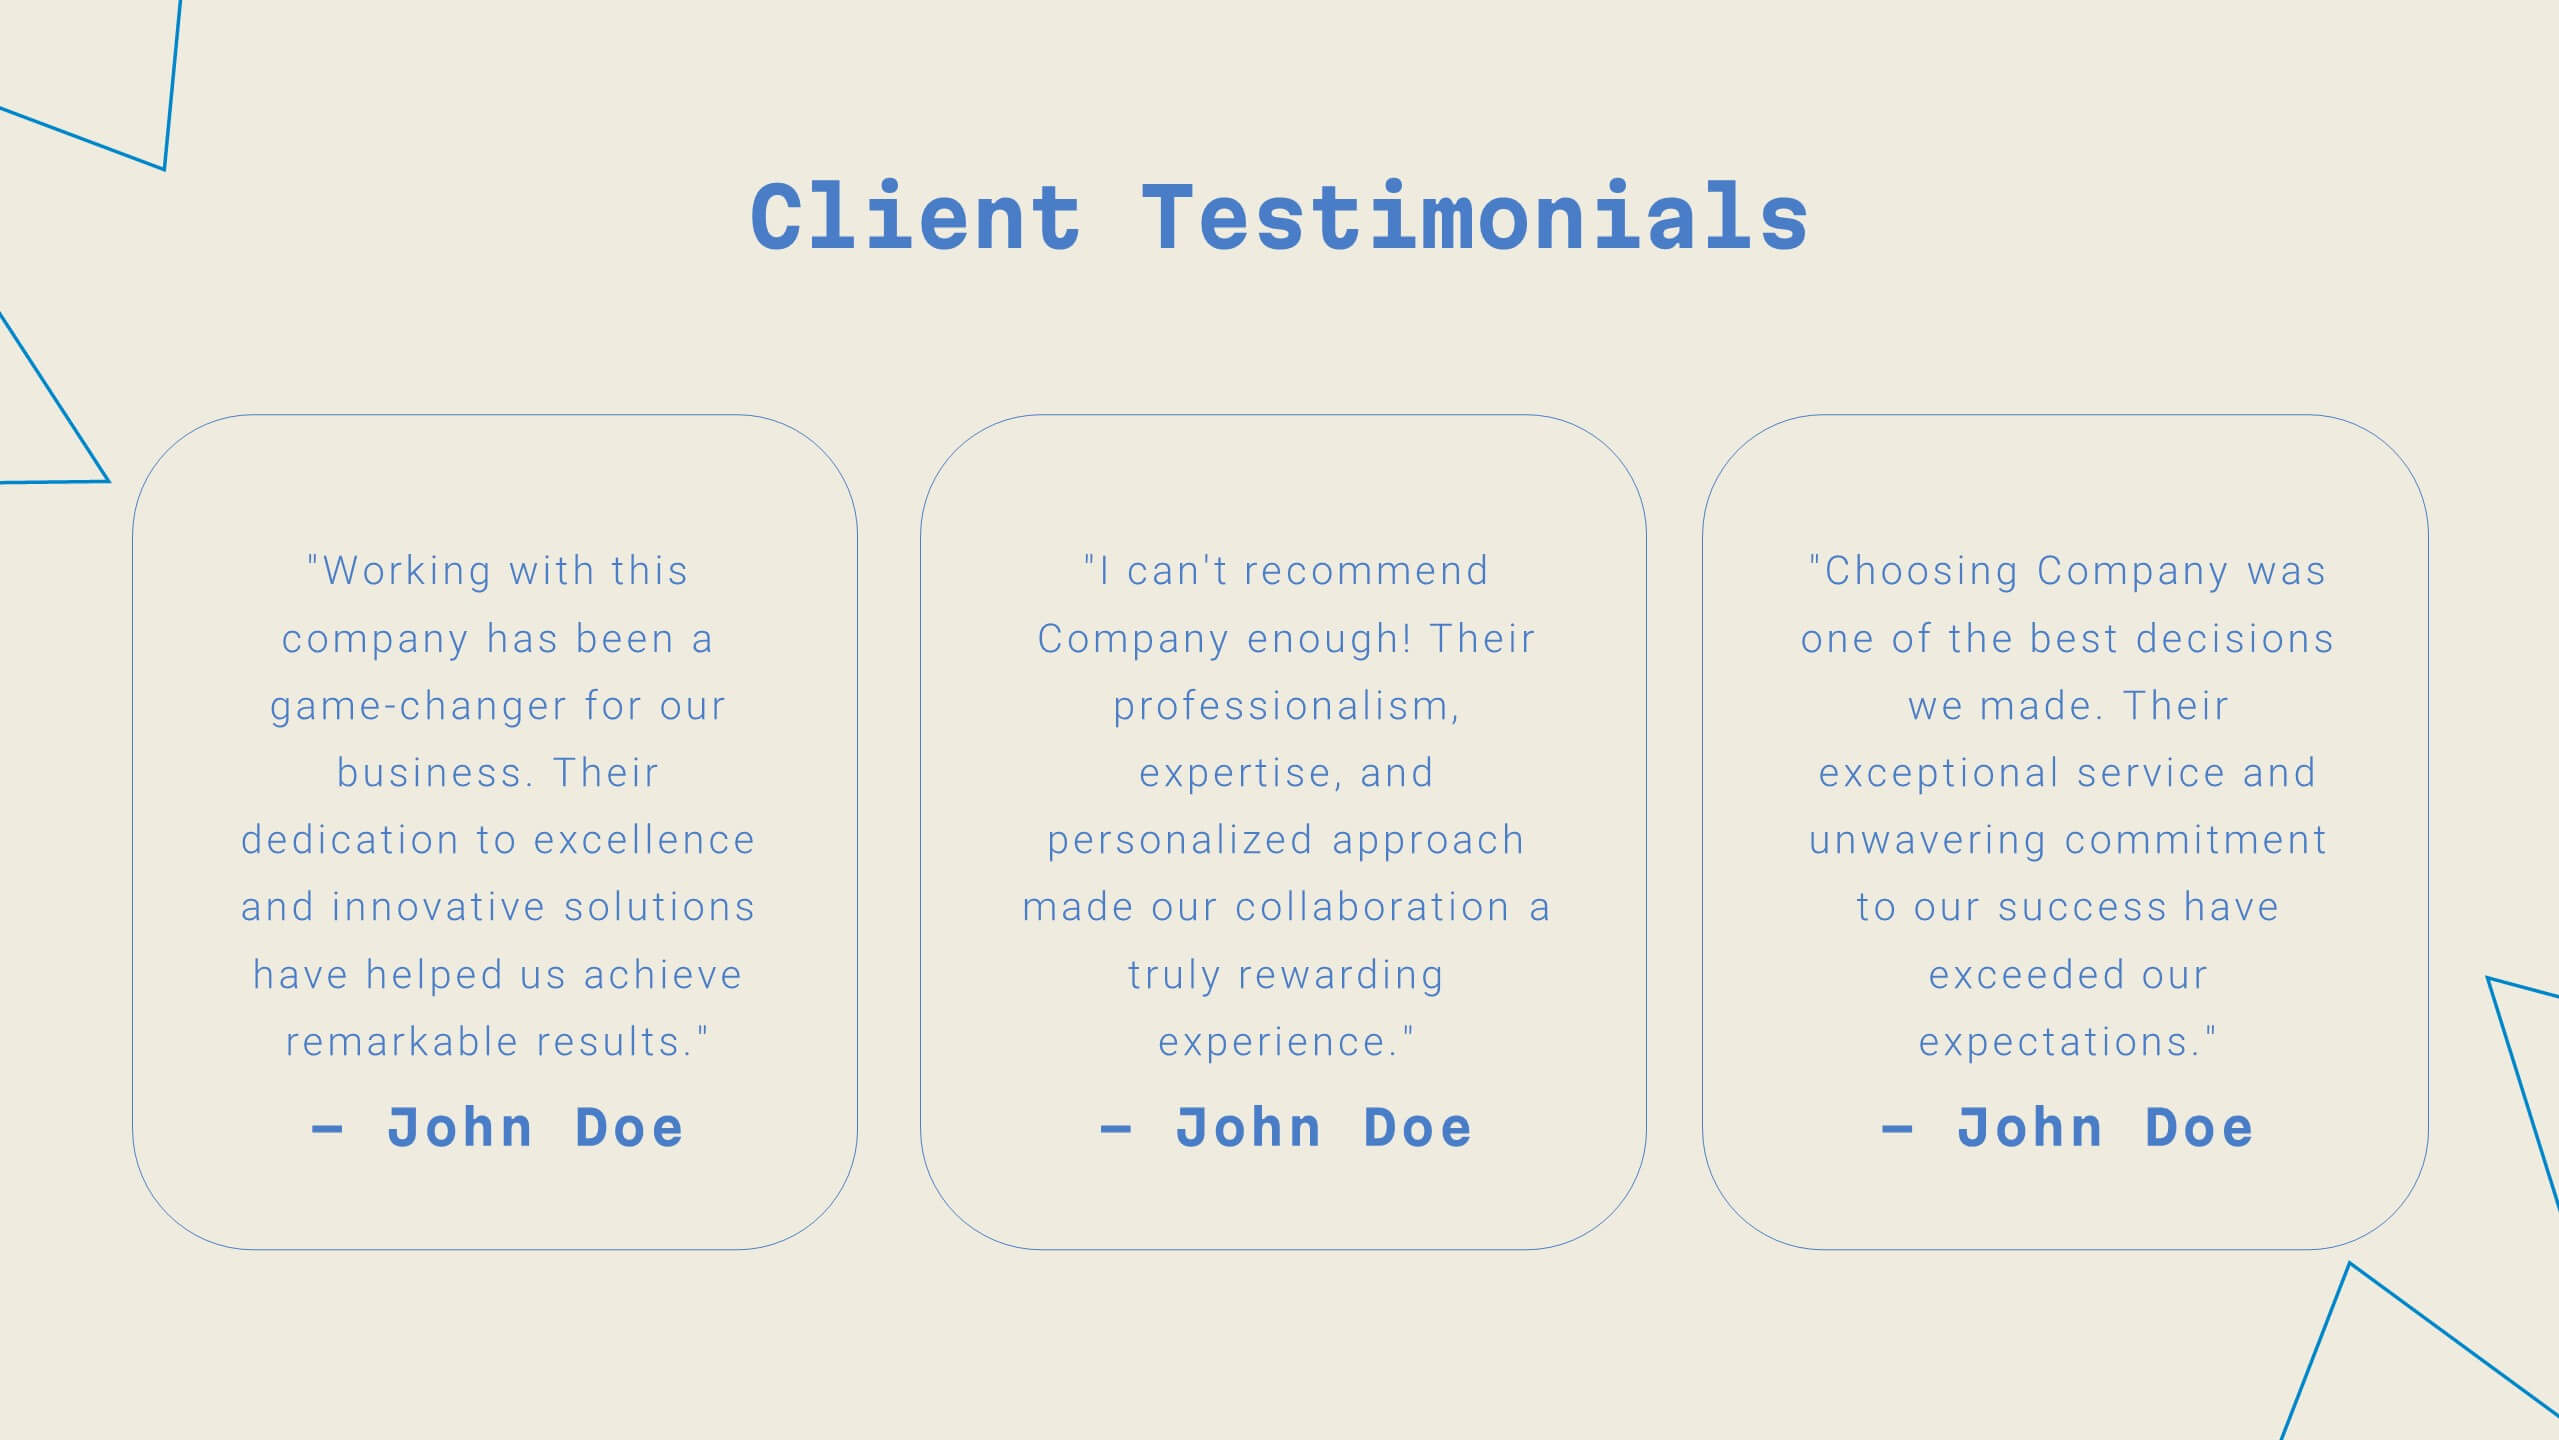
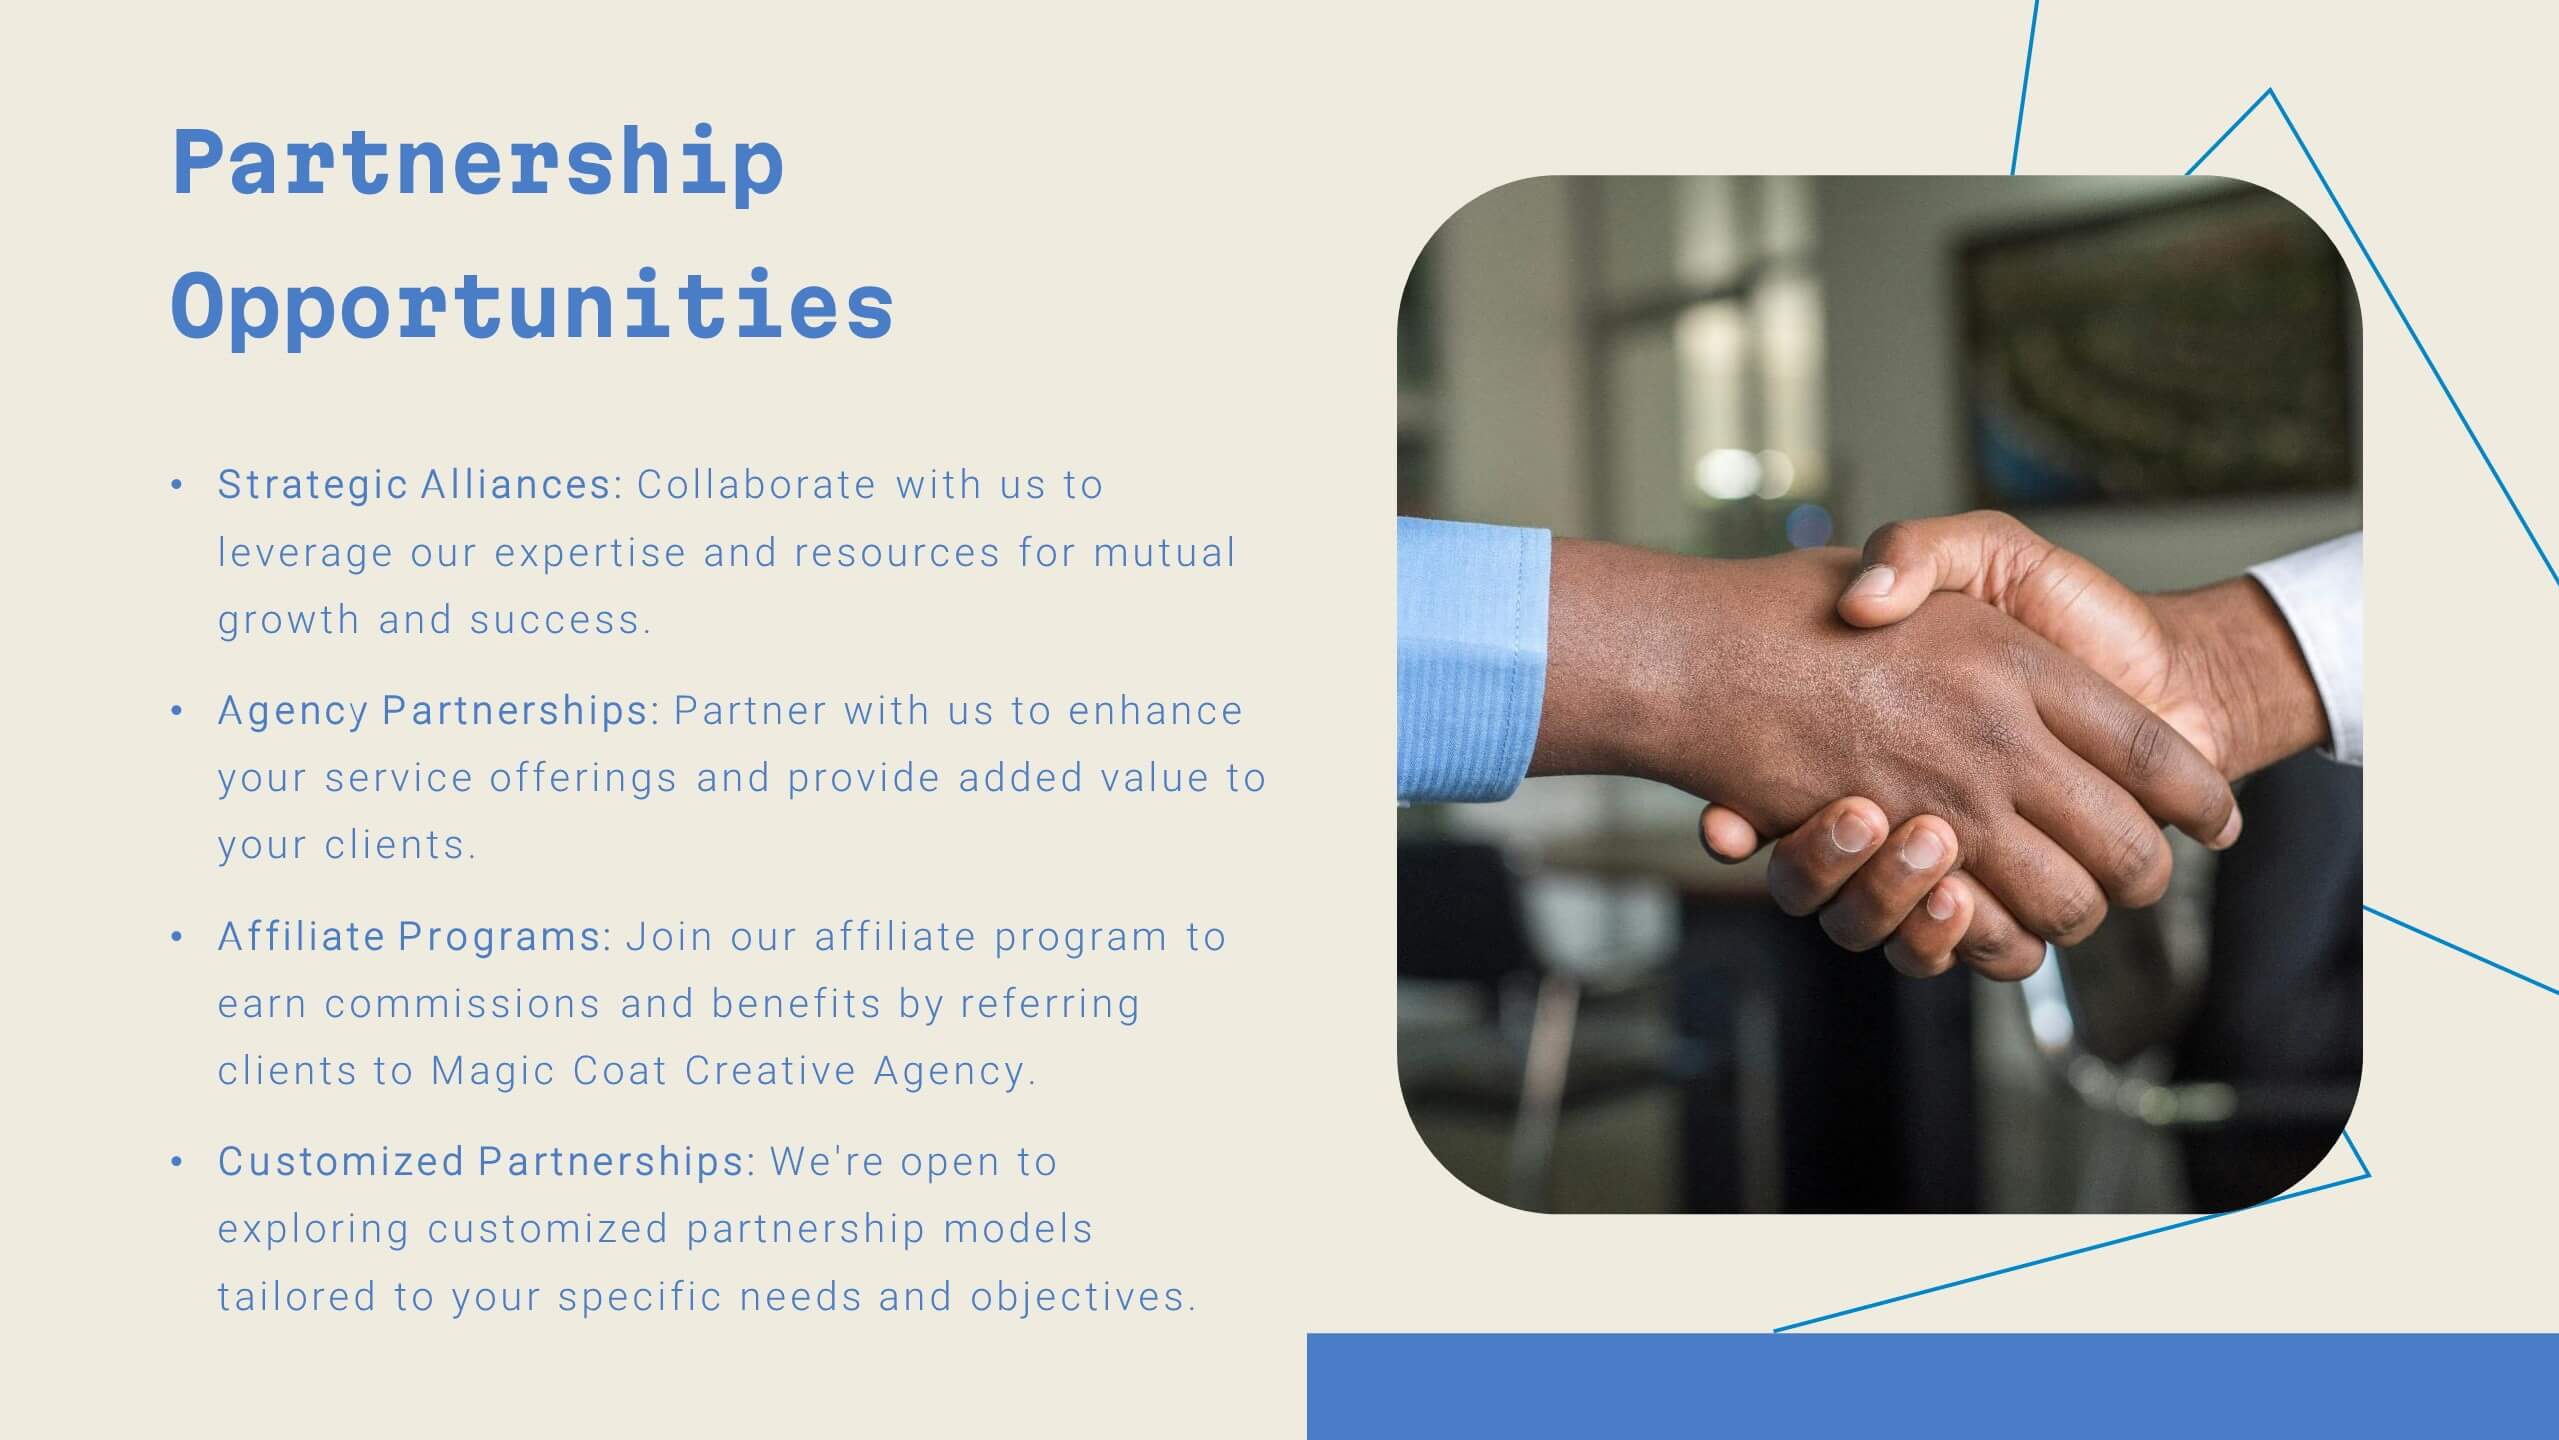
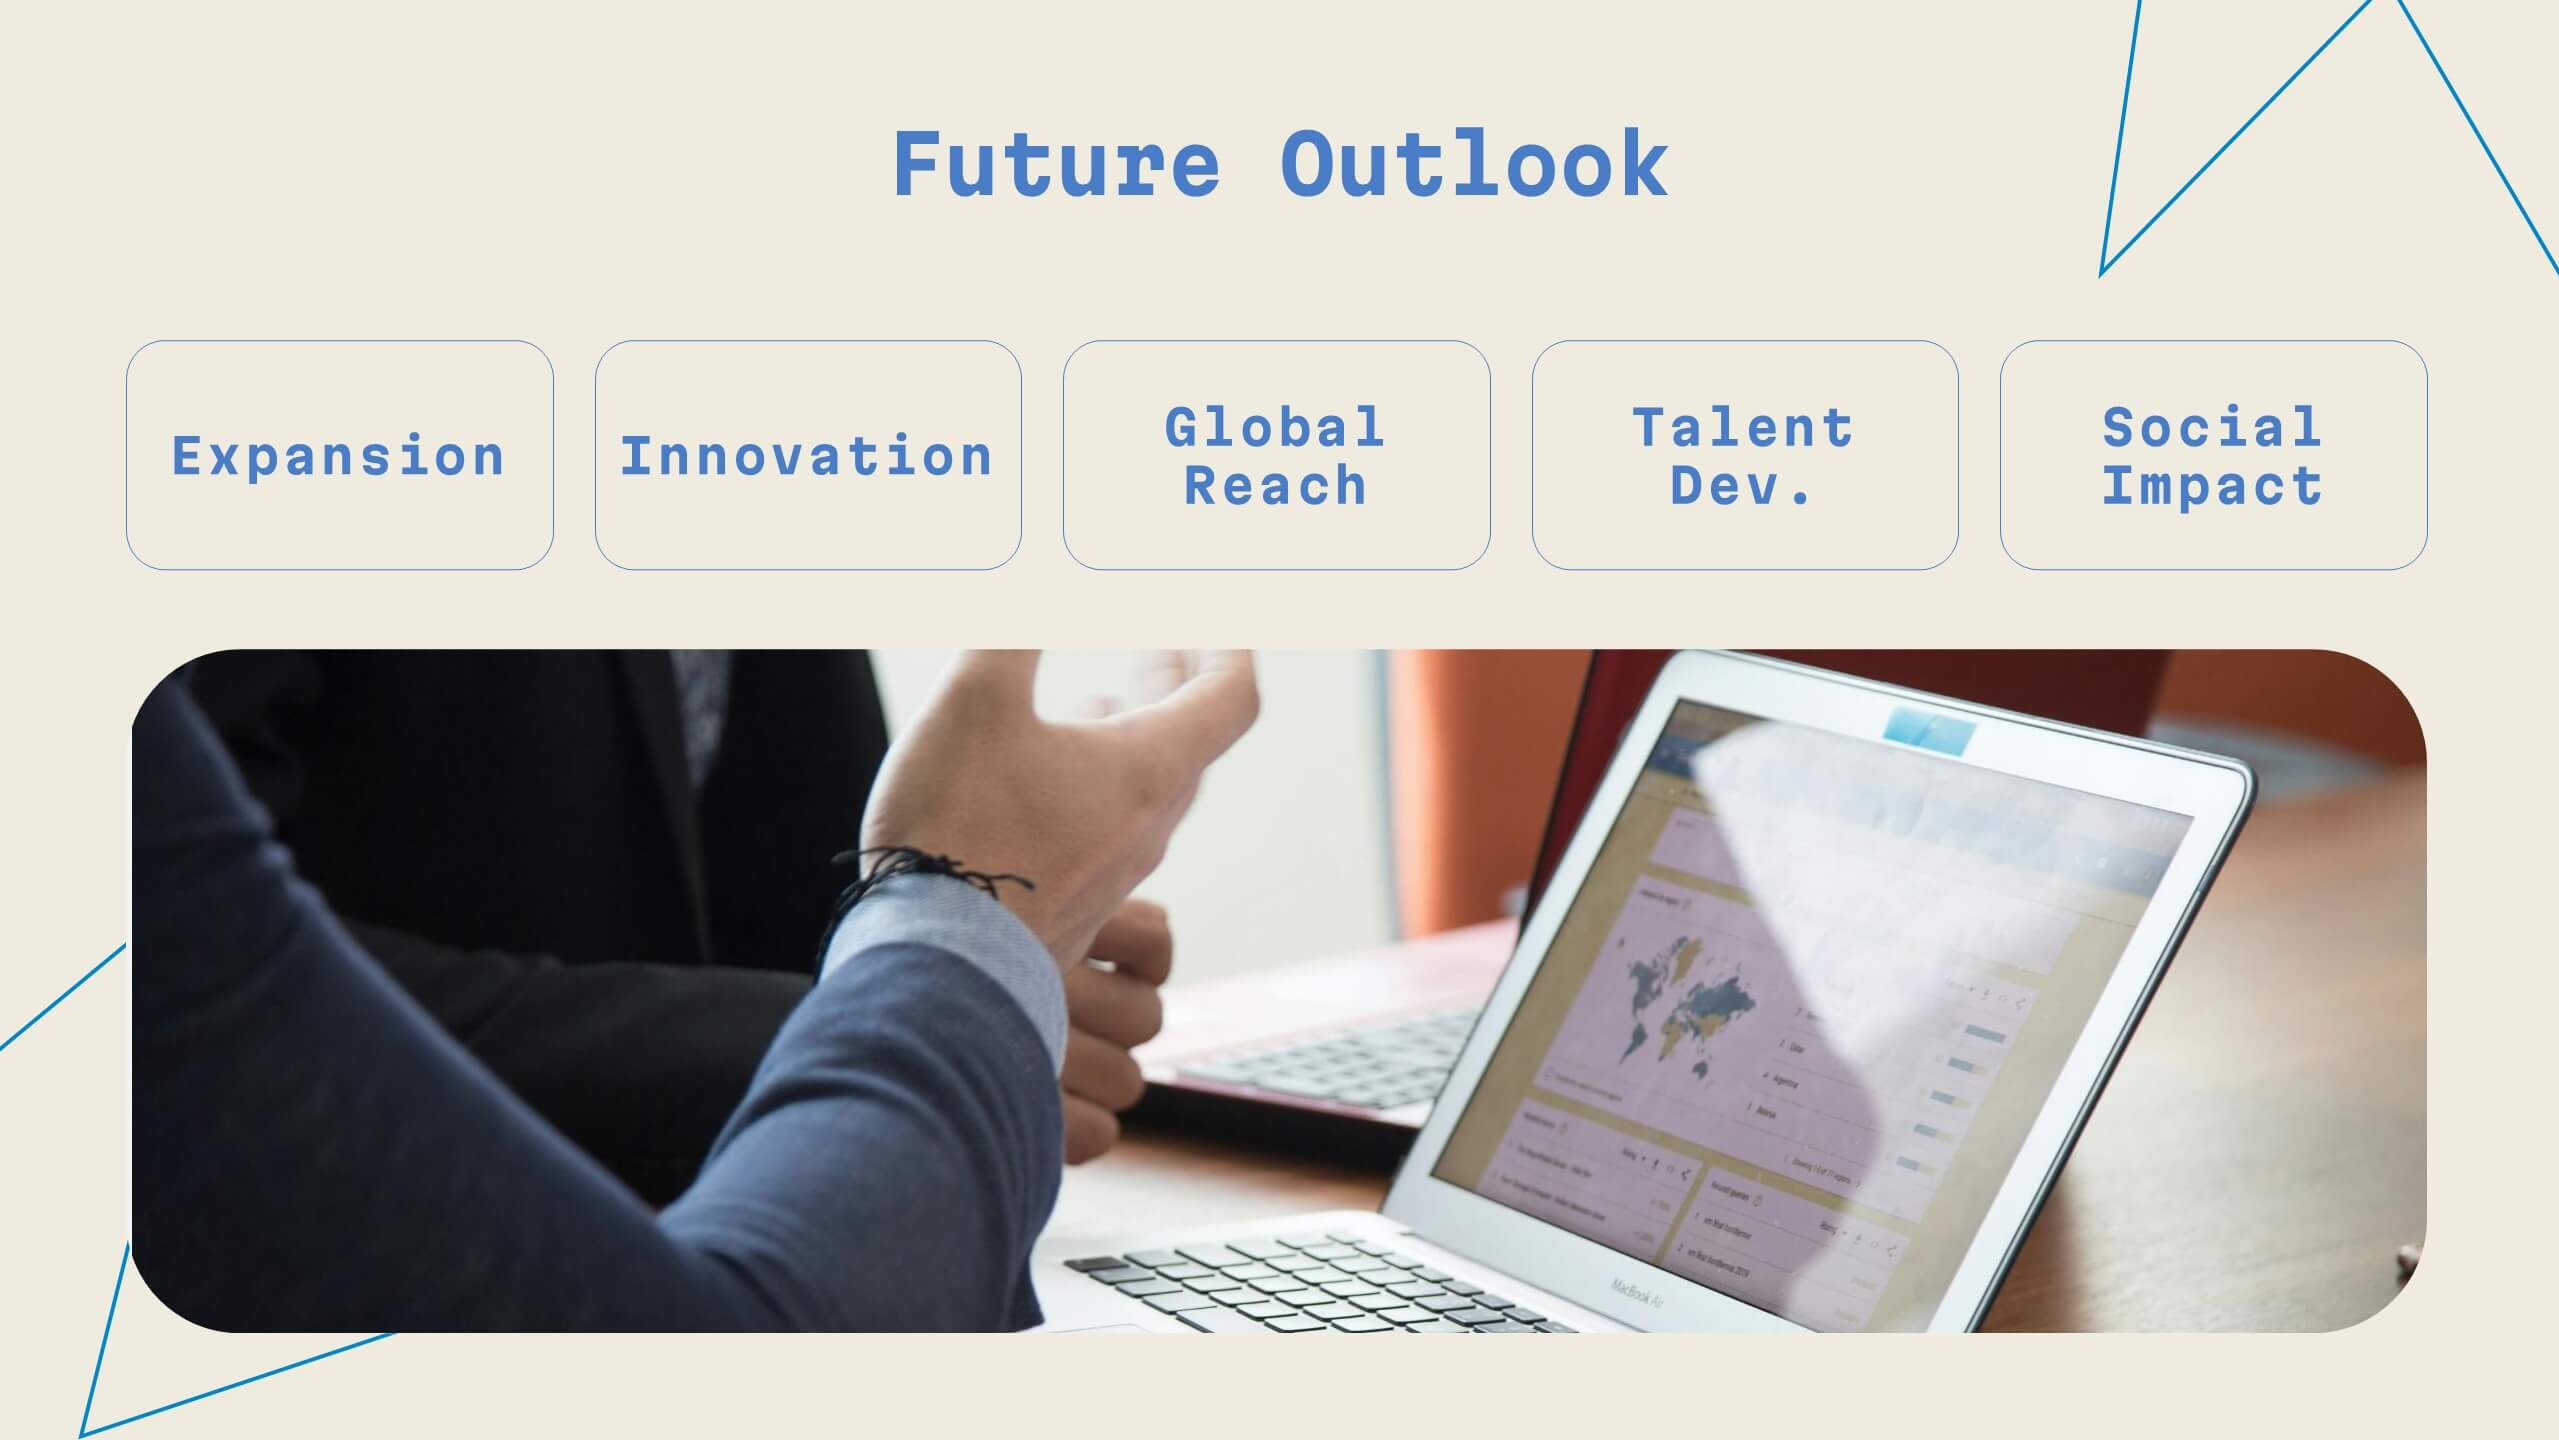
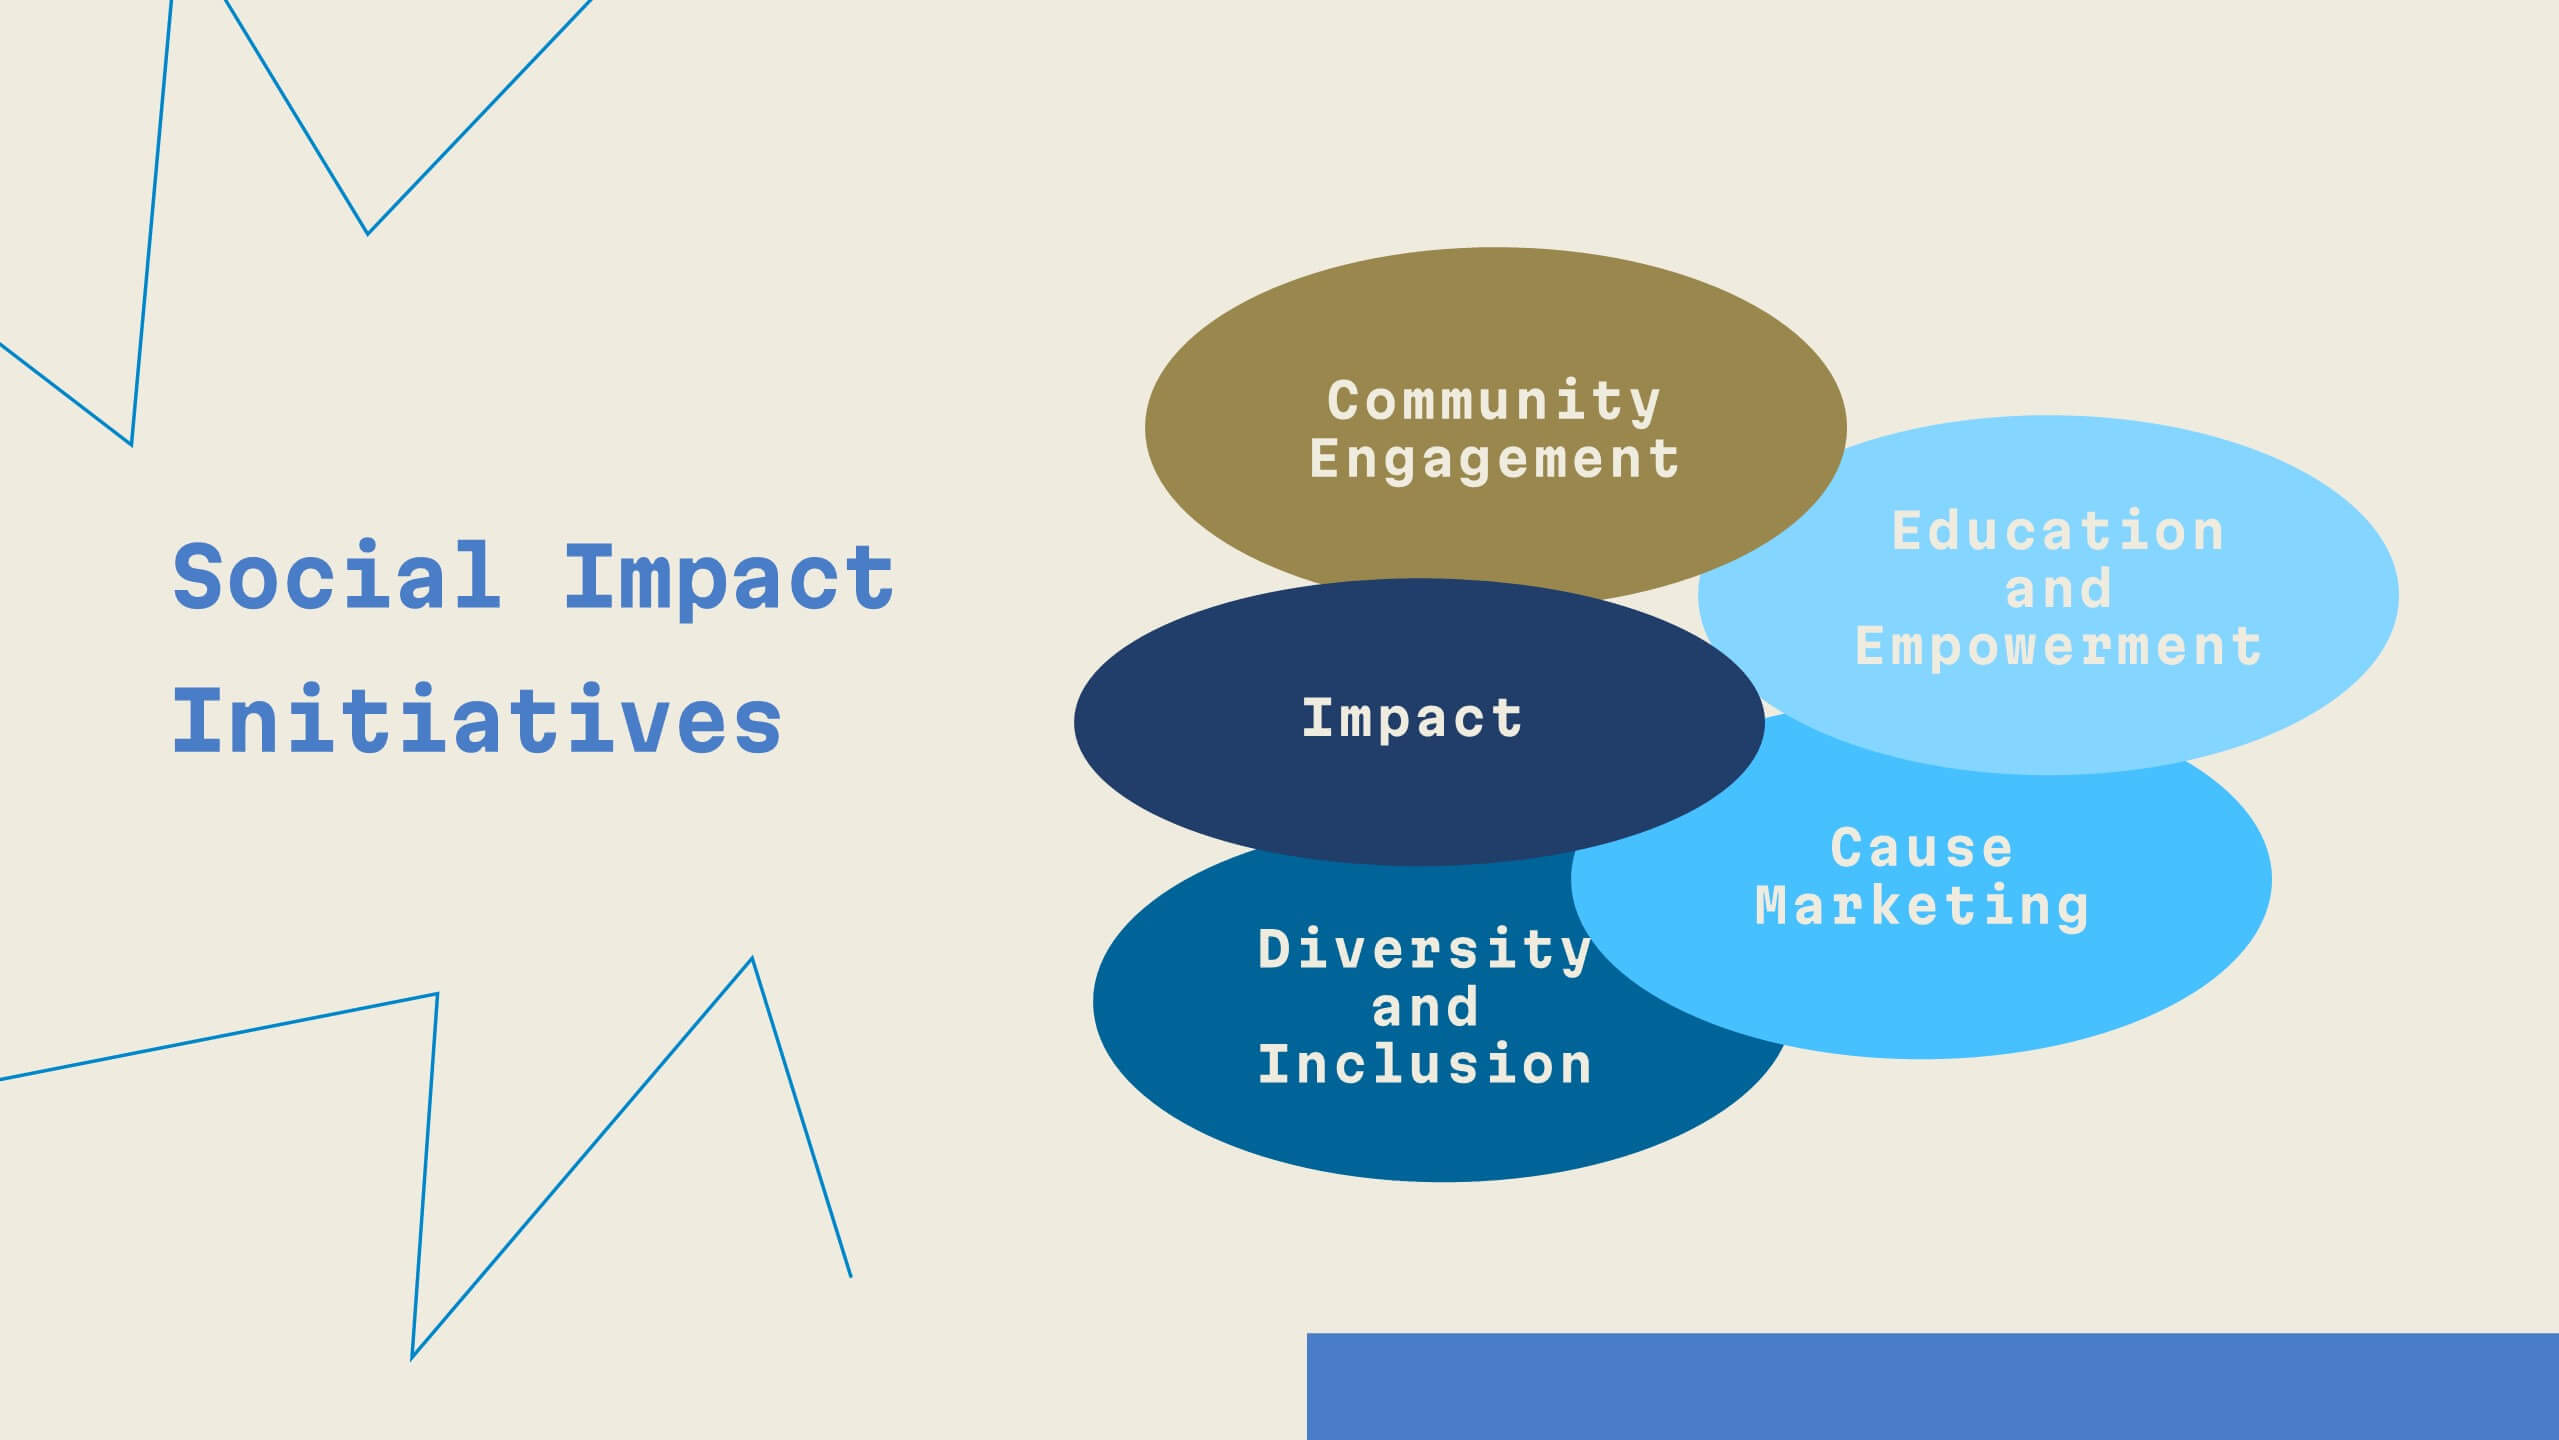
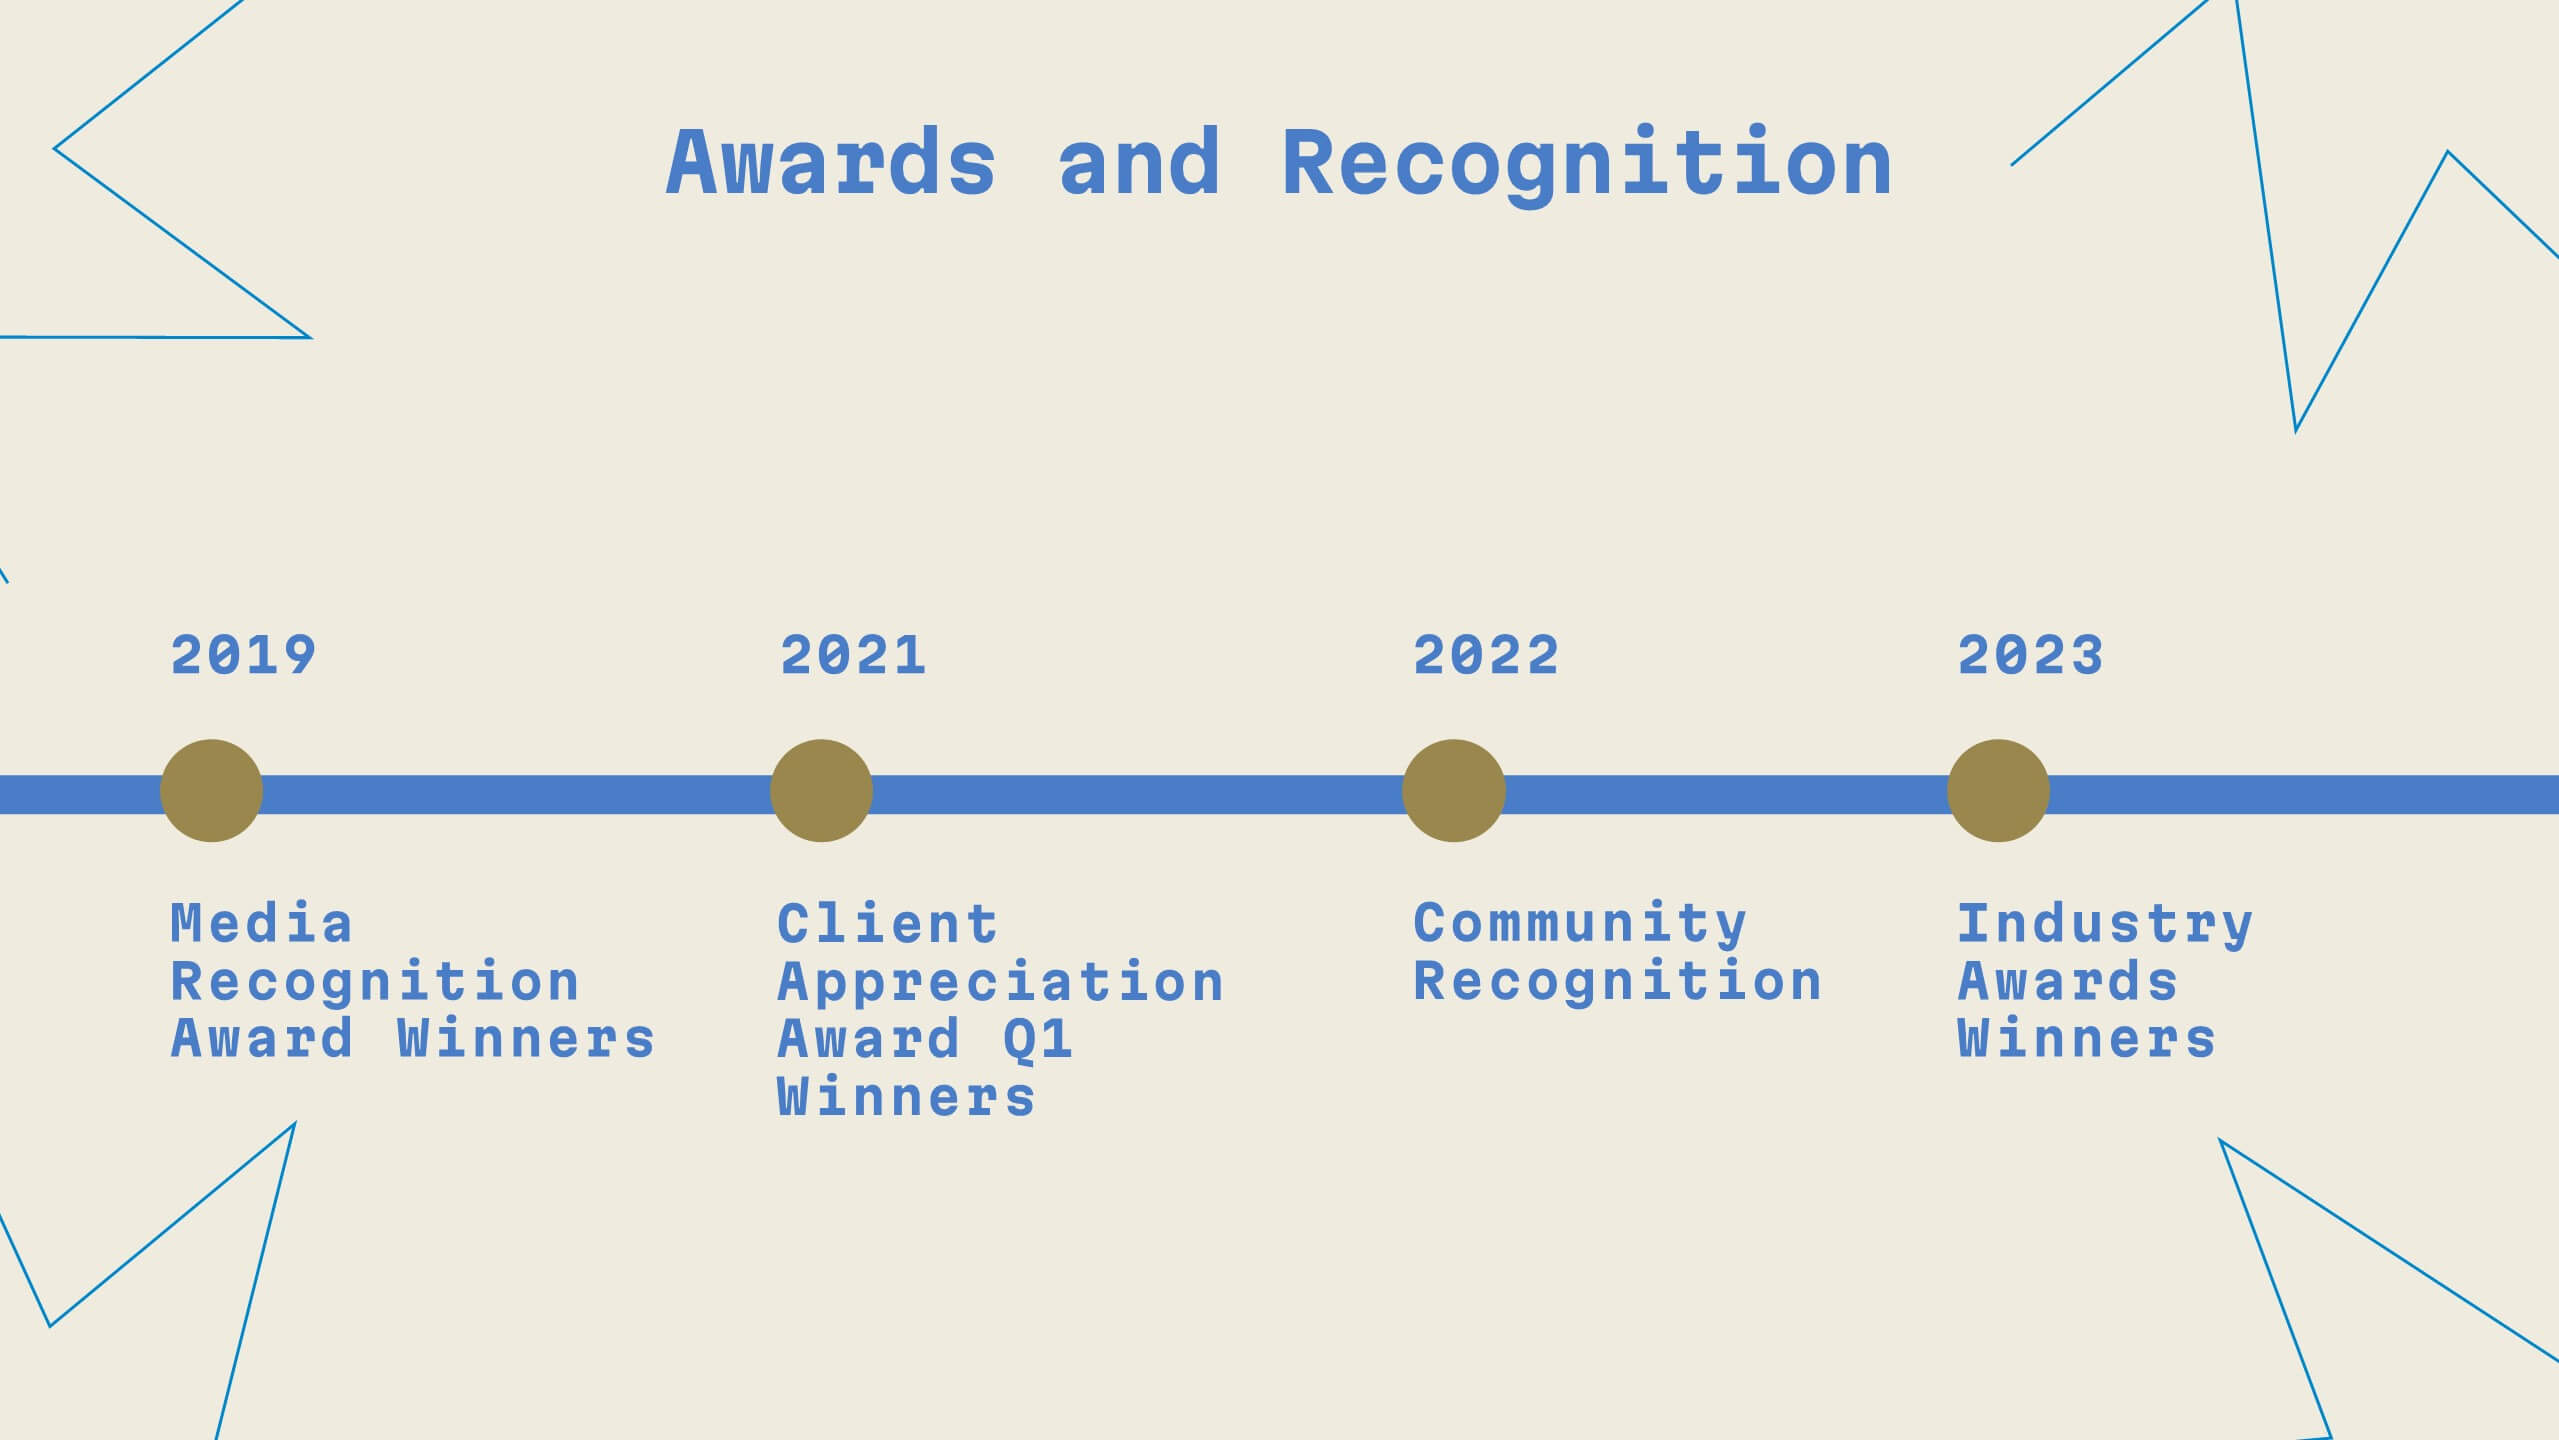
Unity Digital Agency Strategy Plan Presentation
Step into the future of digital marketing with this sleek template! From case studies to strategy development, it offers a comprehensive guide for creating impactful presentations. Highlight client success stories, industry trends, and creative processes with ease. Perfect for showcasing your agency's expertise. Compatible with PowerPoint, Keynote, and Google Slides.


7 diapositivas
Agile Scrum Framework Presentation
Streamline your workflow with this Agile Scrum Framework Presentation Template. Ideal for visualizing iterative processes, sprints, team collaboration, and project planning stages. The circular arrow diagram with editable text placeholders helps communicate each agile step clearly. Fully compatible with PowerPoint, Keynote, and Google Slides.


6 diapositivas
Skills Gap Assessment Infographic
The Skills Gap refers to the mismatch between the skills and qualifications that employers seek in their workforce and the skills possessed by job seekers or employees. This infographic template is a visual representation of the evaluation and analysis of the skills gap within a specific organization, industry, or job sector. The infographic is designed to help businesses and stakeholders understand the disparity between the skills required for certain roles and the skills possessed by the current workforce. By identifying the skills gap, organizations can develop targeted training and development programs to bridge the gap and enhance their employees' skills.


6 diapositivas
Data Visualization Pie Chart Presentation
Present data with clarity using the Data Visualization Pie Chart Presentation template. This professional and fully customizable slide deck is designed for business analysts, marketers, and data scientists to showcase key insights in an engaging and visually impactful way. Featuring a modern pie chart layout, it simplifies complex information for clear communication. Compatible with PowerPoint, Keynote, and Google Slides.


12 diapositivas
Corporate Growth Strategy Steps Presentation
Showcase your expansion roadmap with this Corporate Growth Strategy Steps Presentation. Designed as a five-step vertical ladder, this layout is perfect for illustrating progressive stages like market entry, development, scaling, innovation, and leadership. Each level includes editable icons and text placeholders for clarity and customization. Fully compatible with PowerPoint, Keynote, and Google Slides.


6 diapositivas
Market Structure Infographics
Explore market structure effectively with our Market Structure infographic template. This template is fully compatible with popular presentation software like PowerPoint, Keynote, and Google Slides, allowing you to easily customize it to illustrate and communicate various aspects of market structures. The Market Structure infographic template offers a visually engaging platform to explain different types of market structures, including perfect competition, monopolistic competition, oligopoly, and monopoly. Whether you're a student, economist, business professional, or anyone interested in economics and market dynamics, this template provides a user-friendly canvas to create informative presentations and educational materials. Deepen your understanding of market structure with this SEO-optimized infographic template, thoughtfully designed for clarity and ease of use. Customize it to showcase the characteristics, examples, and implications of each market structure, ensuring that your audience gains valuable insights into how markets function. Start crafting your personalized infographic today to explore the world of market structure in economics.


7 diapositivas
Customer Relationship Management
Strengthen client loyalty and drive growth with this organized CRM infographic. Perfect for presenting customer touchpoints, service strategies, and loyalty-building initiatives. Fully customizable in PowerPoint, Keynote, and Google Slides, this design ensures your CRM workflows are communicated with clarity and visual impact.