


Características


¿Tienes alguna pregunta?
Recomendar


6 diapositivas
McKinsey 7S Model Articles Infographics
Explore the seven critical elements that make up the McKinsey 7S Model, including Strategy, Structure, Systems, Shared Values, Skills, Style, and Staff. Each of these components plays a vital role in shaping your company's success. This infographic is compatible with popular presentation tools like PowerPoint, Keynote, and Google Slides, making it effortless to incorporate into your next business presentation. Unlock the secrets of organizational effectiveness with this concise and visually appealing resource. Enhance your understanding of the McKinsey 7S Model and supercharge your company's performance today. Get ready to transform your business strategy with this user-friendly infographic.


4 diapositivas
Business Challenge Overview Presentation
Kick off your message with a dynamic overview that makes complex challenges feel clear, visual, and manageable. This presentation helps you break down obstacles, compare factors, and guide teams toward smarter decisions with an organized, flowing layout. Fully compatible with PowerPoint, Keynote, and Google Slides.


5 diapositivas
SEO Strategies Infographics
Immerse yourself in the dynamic world of digital marketing with our SEO strategies infographics. Rendered in bold black, vibrant orange, and various eye-catching colors, this creative and vertical template serves as a beacon for marketing professionals, digital strategists, and entrepreneurs who aim to conquer the digital space. Each element, from engaging graphics to interpretative icons, is specifically tailored to present SEO methodologies with clarity and charisma. This infographic template is not only a visual treat but a reservoir of insights, facilitating users to communicate influential SEO tactics effectively and drive their brand's online visibility forward.


6 diapositivas
5 Forces Model Business Analysis Presentation
Showcase your business insights with a bold, flowing design that makes each competitive force easy to compare and understand. This presentation helps you break down market pressures, highlight strategic opportunities, and communicate analysis with clarity and confidence. Fully editable and compatible with PowerPoint, Keynote, and Google Slides.


6 diapositivas
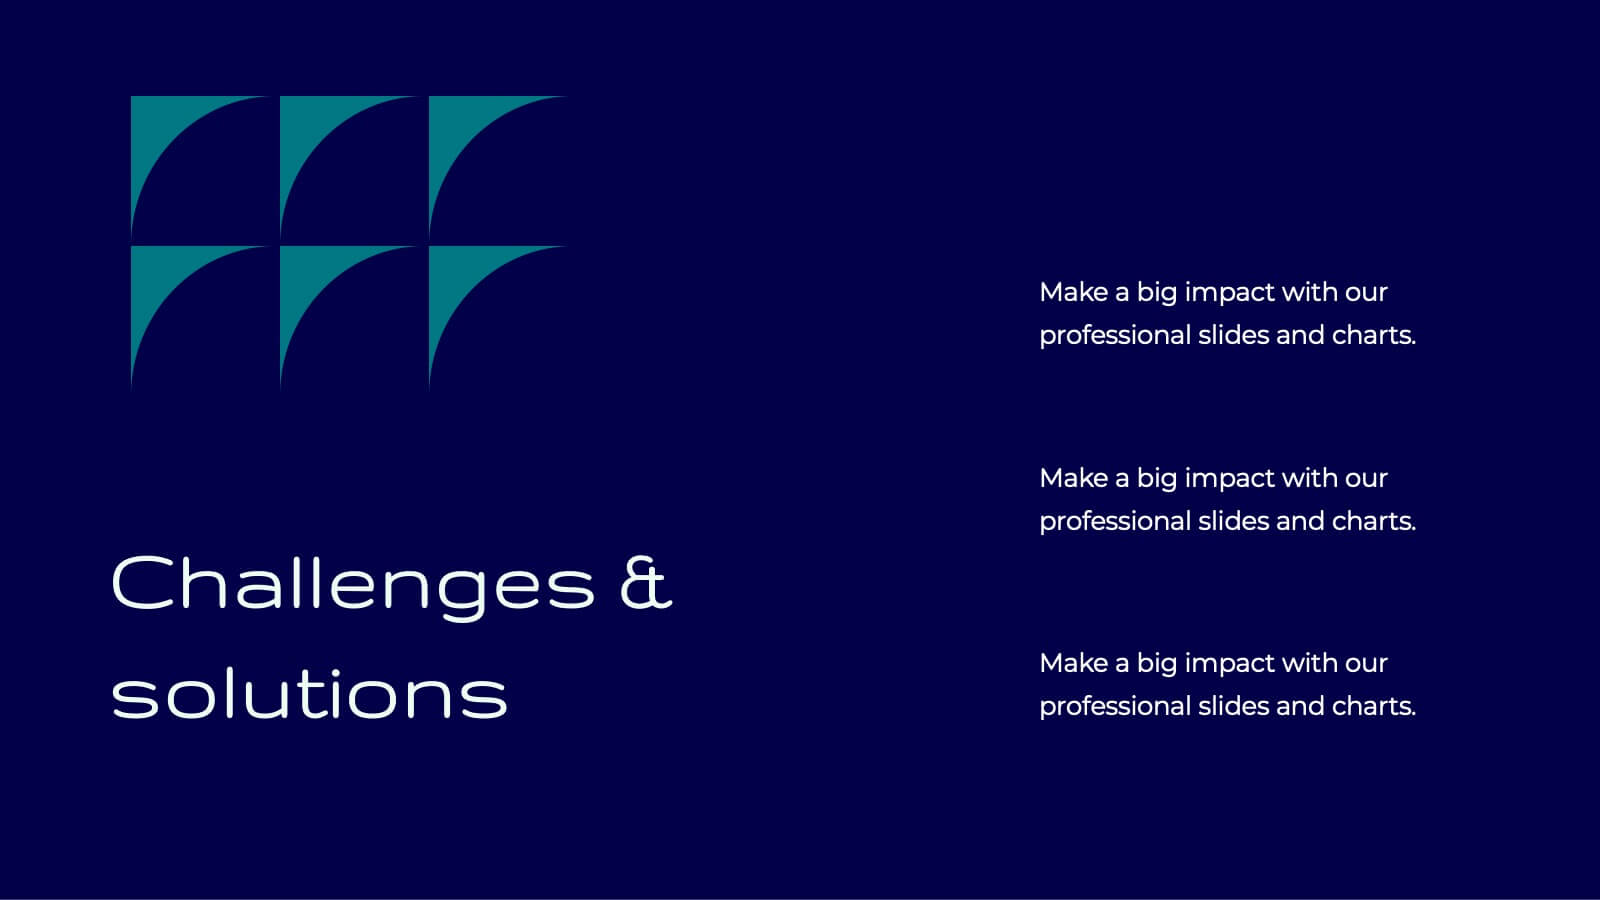
Business Challenges and Solutions Presentation
Address challenges with strategic solutions using this Business Challenges and Solutions template. Featuring a clear side-by-side layout, this design helps visualize business obstacles and their corresponding solutions for effective decision-making. Perfect for problem-solving discussions, strategy meetings, and brainstorming sessions, this template ensures your content remains structured and impactful. Fully customizable for PowerPoint, Keynote, and Google Slides.


5 diapositivas
Creative Bubble Map Infographic Presentation
Bring your ideas to life with dynamic visuals that make connections clear and storytelling effortless. This modern infographic presentation is perfect for showcasing relationships, categories, or data insights in a bold and engaging way. Fully editable and compatible with PowerPoint, Keynote, and Google Slides for seamless customization.


7 diapositivas
Cryptocurrency Infographic Presentation Template
Cryptocurrency is a form of digital or virtual currency that uses cryptography (the conversion of data into an unreadable format) to secure transactions between two parties. Cryptocurrencies use decentralized control as opposed to centralized electronic money and central banking systems. This template is the perfect presentation for informing on the world of cryptocurrency. The decentralized control of each cryptocurrency works through a blockchain. It is an alternative currency brought on by the emergence of Internet. This template comes with appealing illustrations made for you to customize.


5 diapositivas
Business Choices and Outcomes Analysis Presentation
Visually connect key business options with their potential results using the Business Choices and Outcomes Analysis slide. Featuring a clean puzzle-style layout, this template is perfect for illustrating decision pathways, pros and cons, or strategy alternatives. Ideal for consultants, managers, and analysts. Easily customizable in PowerPoint, Keynote, and Google Slides.


6 diapositivas
Business Structure Outline Presentation
Visualize your company’s framework with this modern business structure slide. Perfect for showcasing team roles, departments, or organizational functions, it helps simplify complex relationships into a clear overview. Easily editable in Canva, PowerPoint, and Google Slides—ideal for presentations, planning sessions, or onboarding new employees with a professional, easy-to-follow design.


5 diapositivas
Educational A-Z Letter Design Presentation
Present your ideas with clarity using the Educational A-Z Letter Design Presentation. This slide uses a vertical layout with stylized book-like segments and bold A–D lettering, ideal for categorizing content or showcasing multi-part learning points. Fully editable and compatible with PowerPoint, Keynote, and Google Slides.


6 diapositivas
Circle Diagram for Organizational Structure Presentation
Visualize team roles and functions with the Circle Diagram for Organizational Structure Presentation. This hexagon-centered circular layout clearly displays six departments or categories around a unified core, using icons and color coding for easy interpretation. Perfect for showcasing business units, workflows, or collaborative systems. Fully editable in PowerPoint, Google Slides, and Canva.


6 diapositivas
Alphabet Infographic and Typography Layout Presentation
Showcase key information with visual flair using this Alphabet Infographic and Typography Layout. The bold letter "A" is constructed from geometric shapes, each linked to editable text areas—ideal for presenting 6 grouped ideas or segmented data. Fully compatible with PowerPoint, Canva, and Google Slides. Perfect for modern, clean presentations.

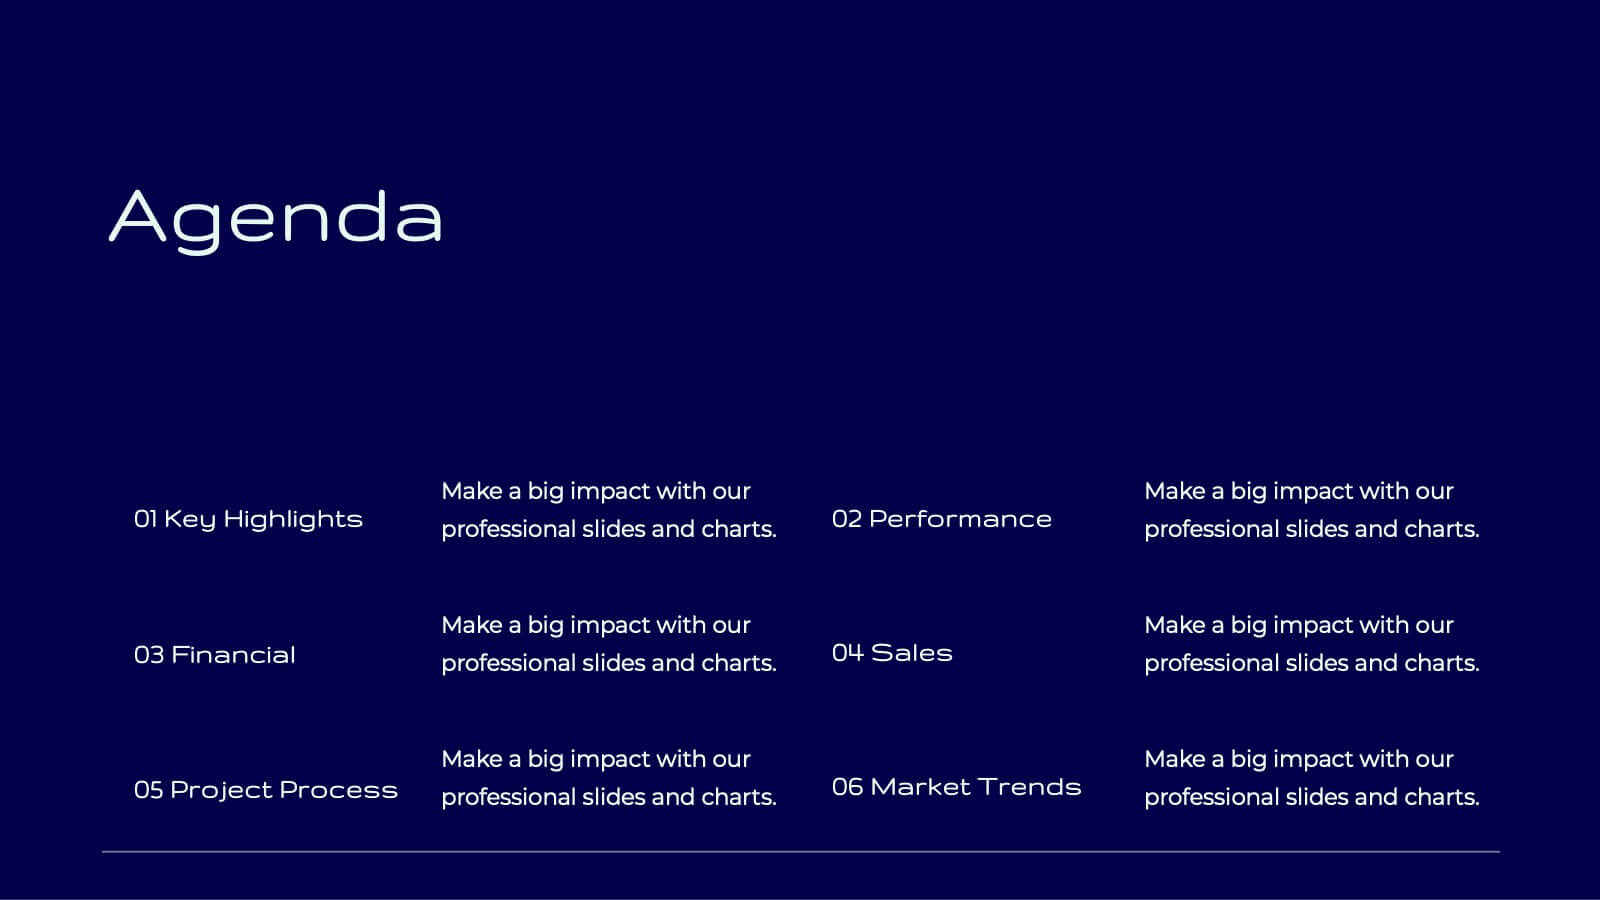
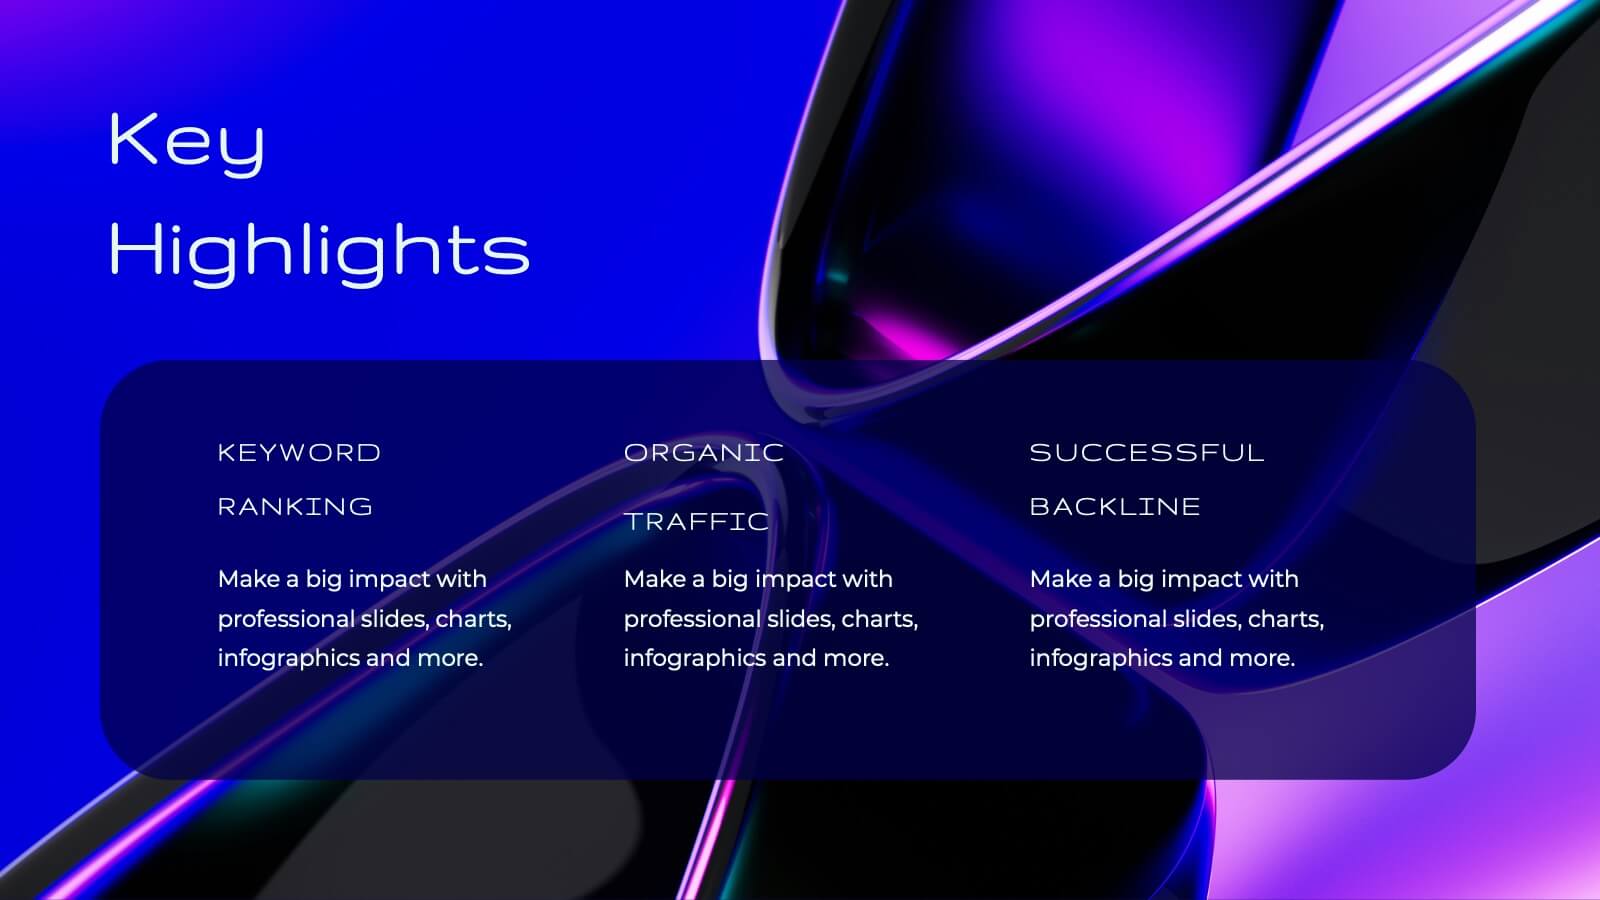
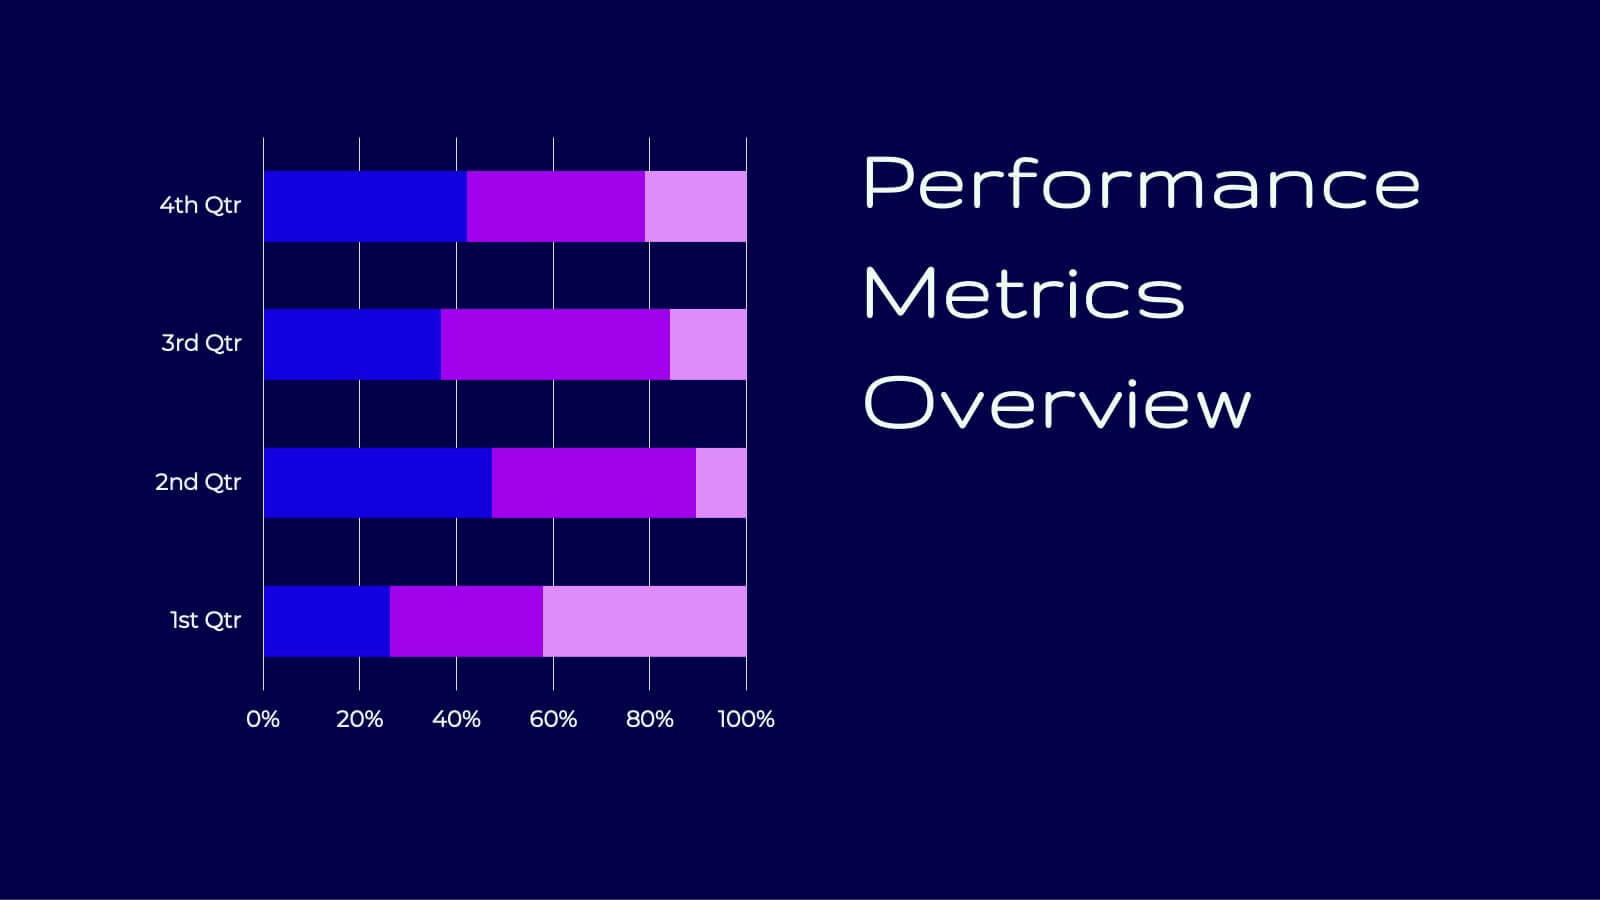
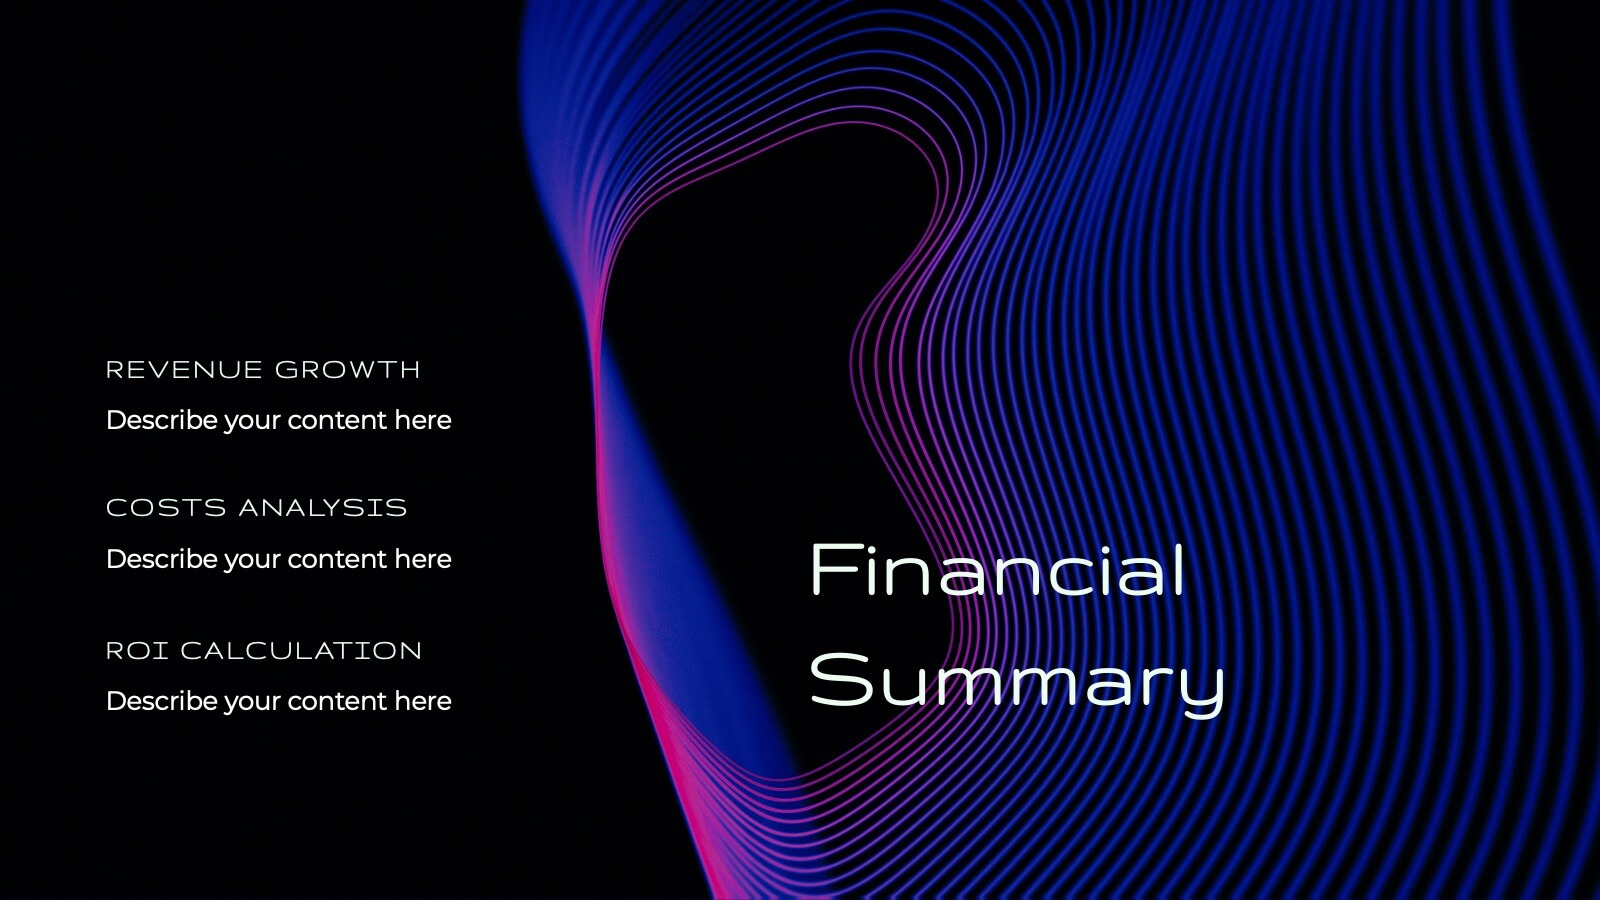

22 diapositivas
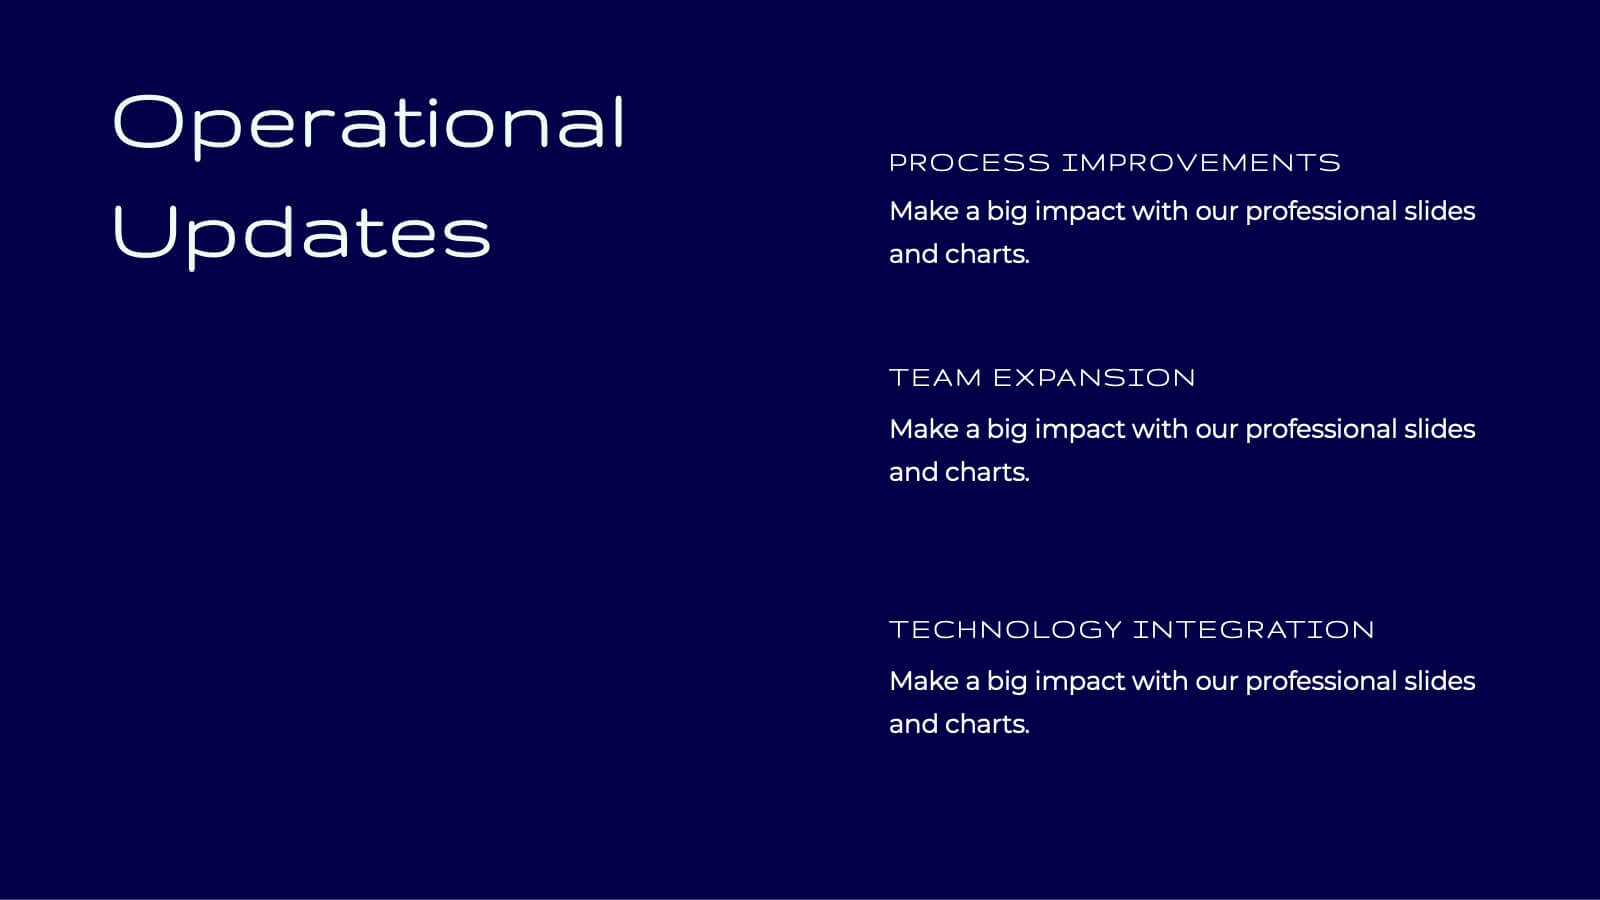
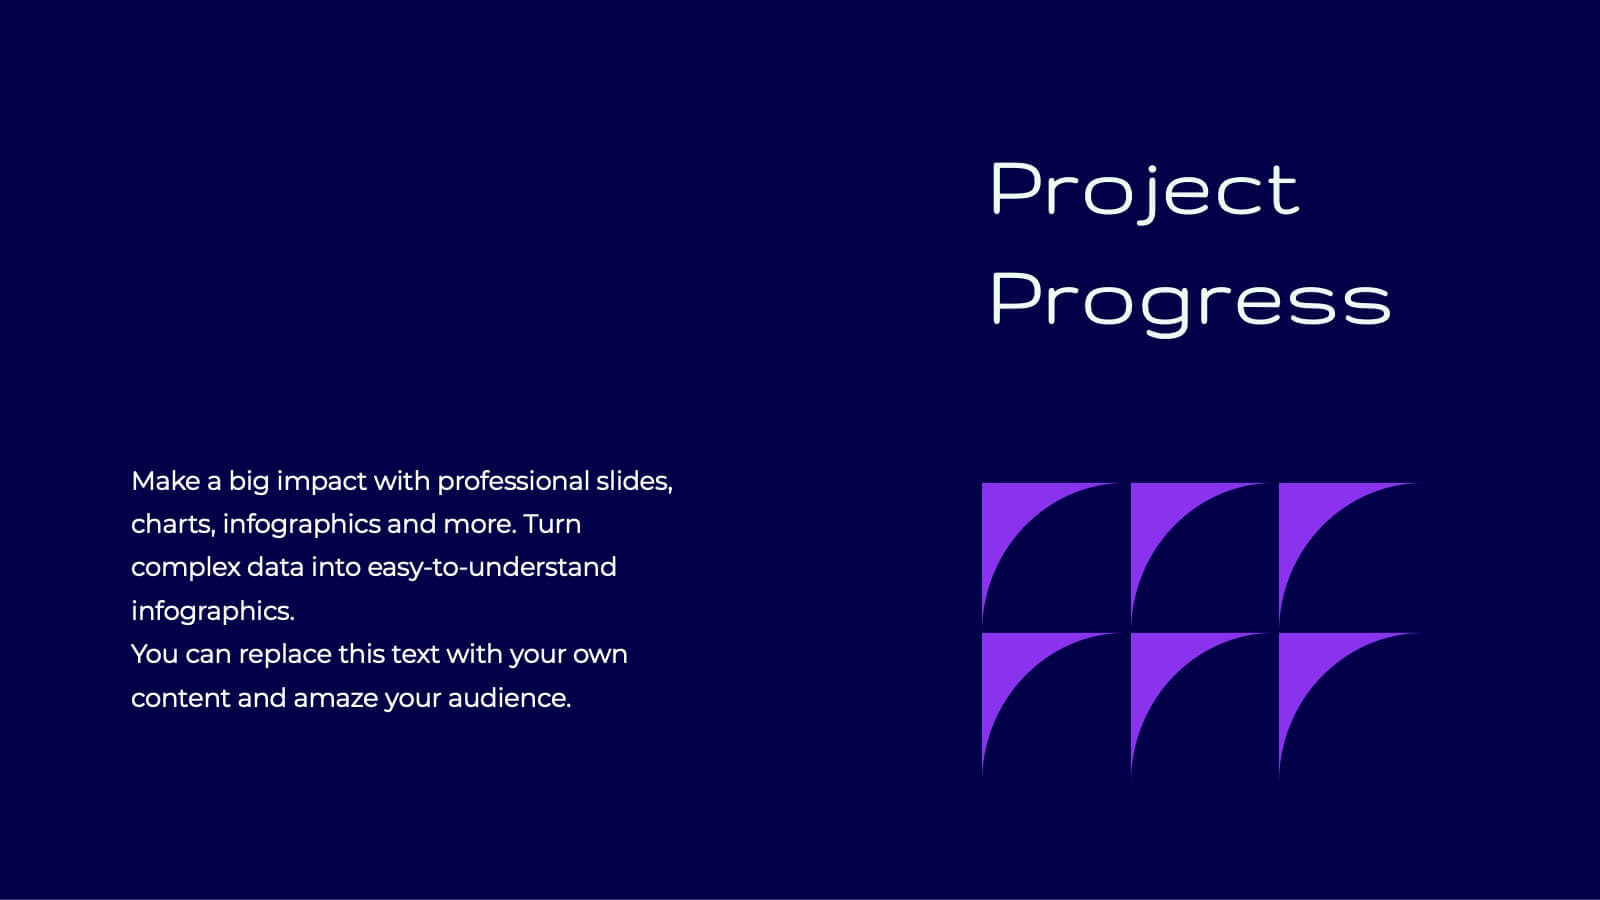
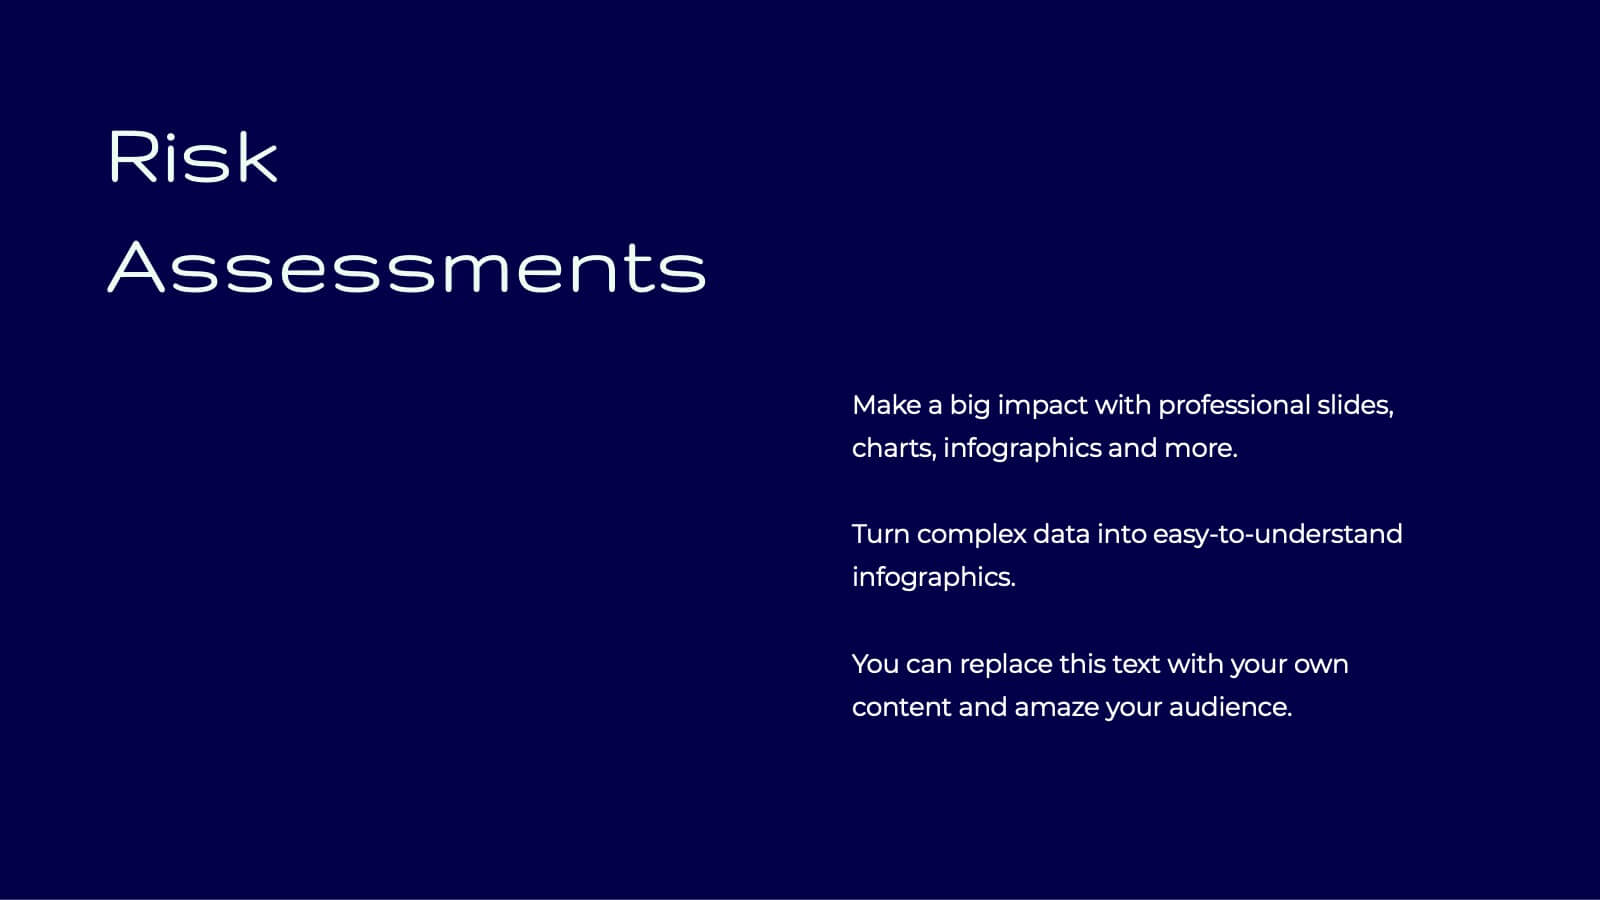
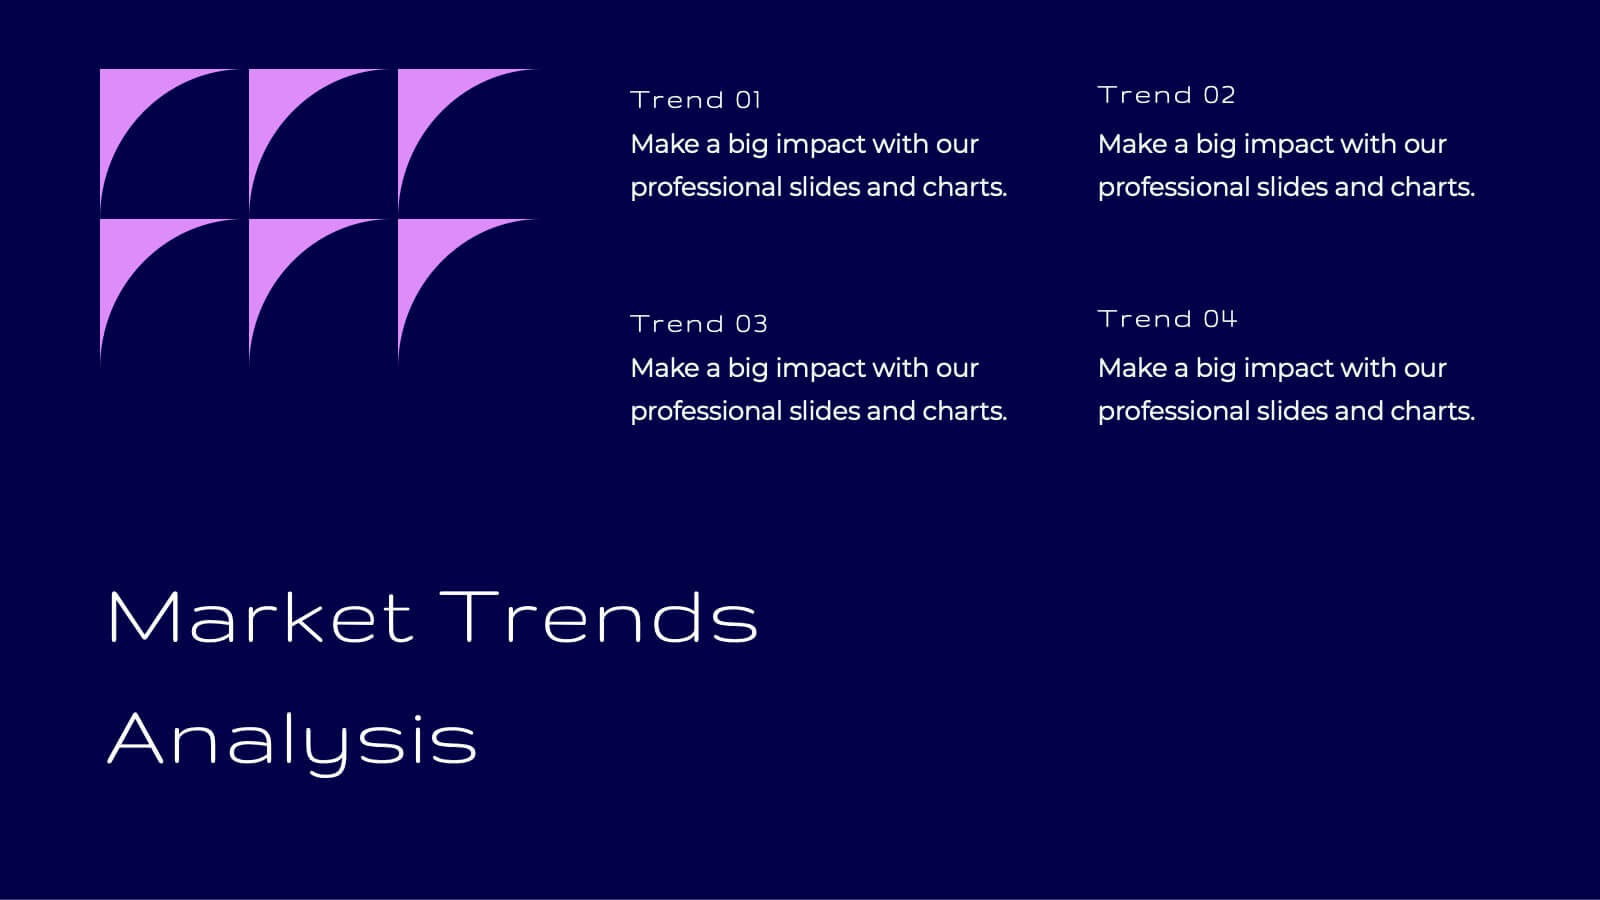
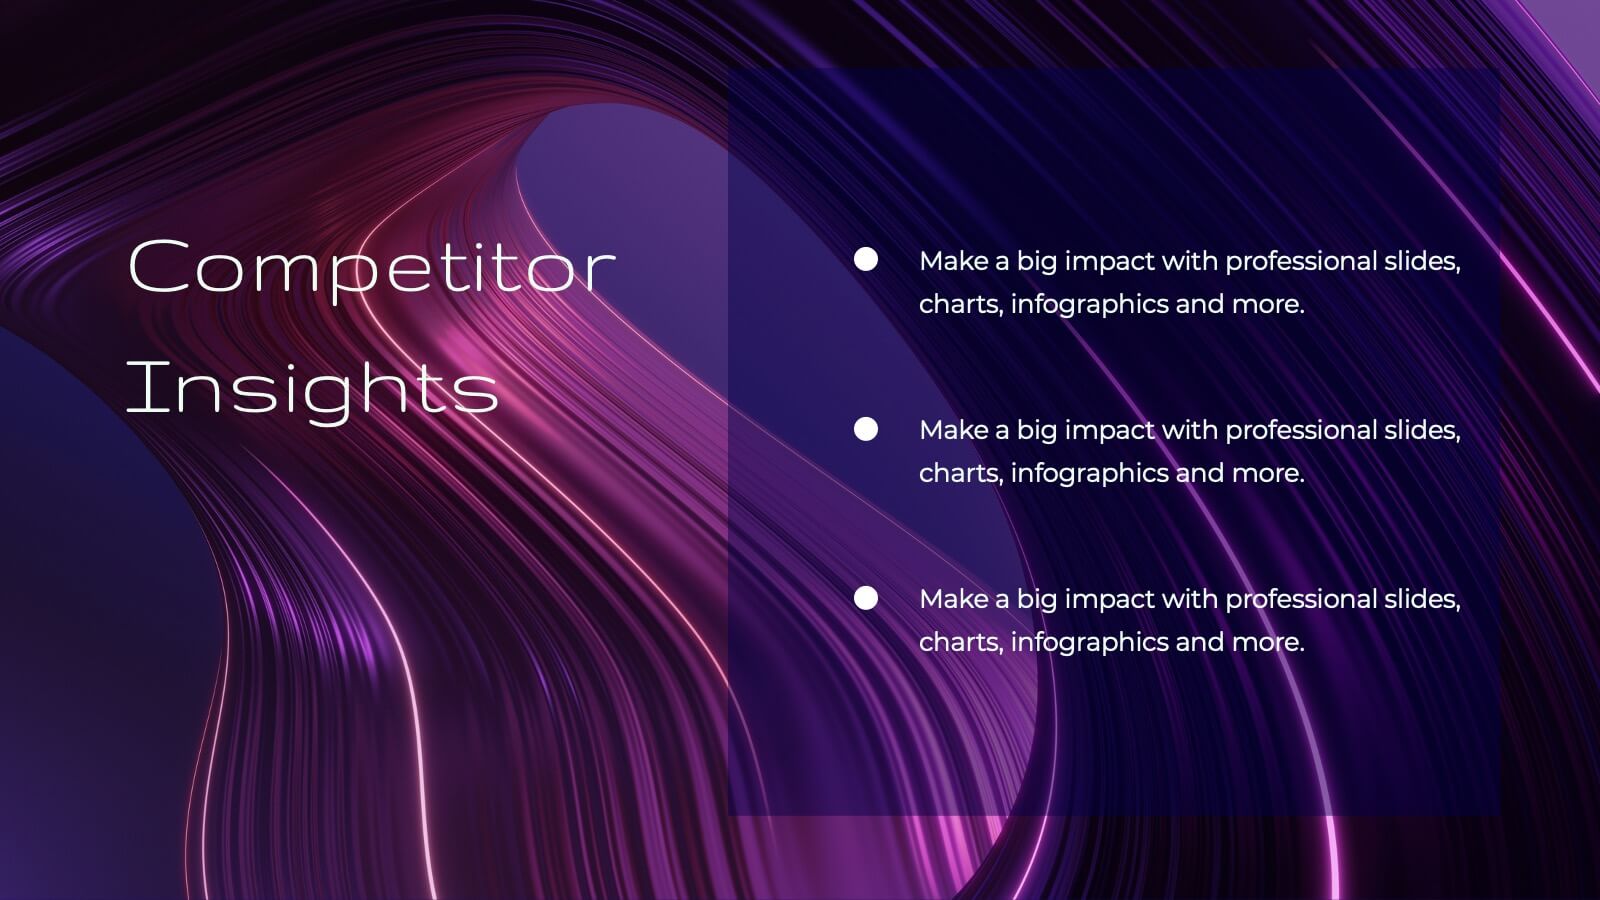
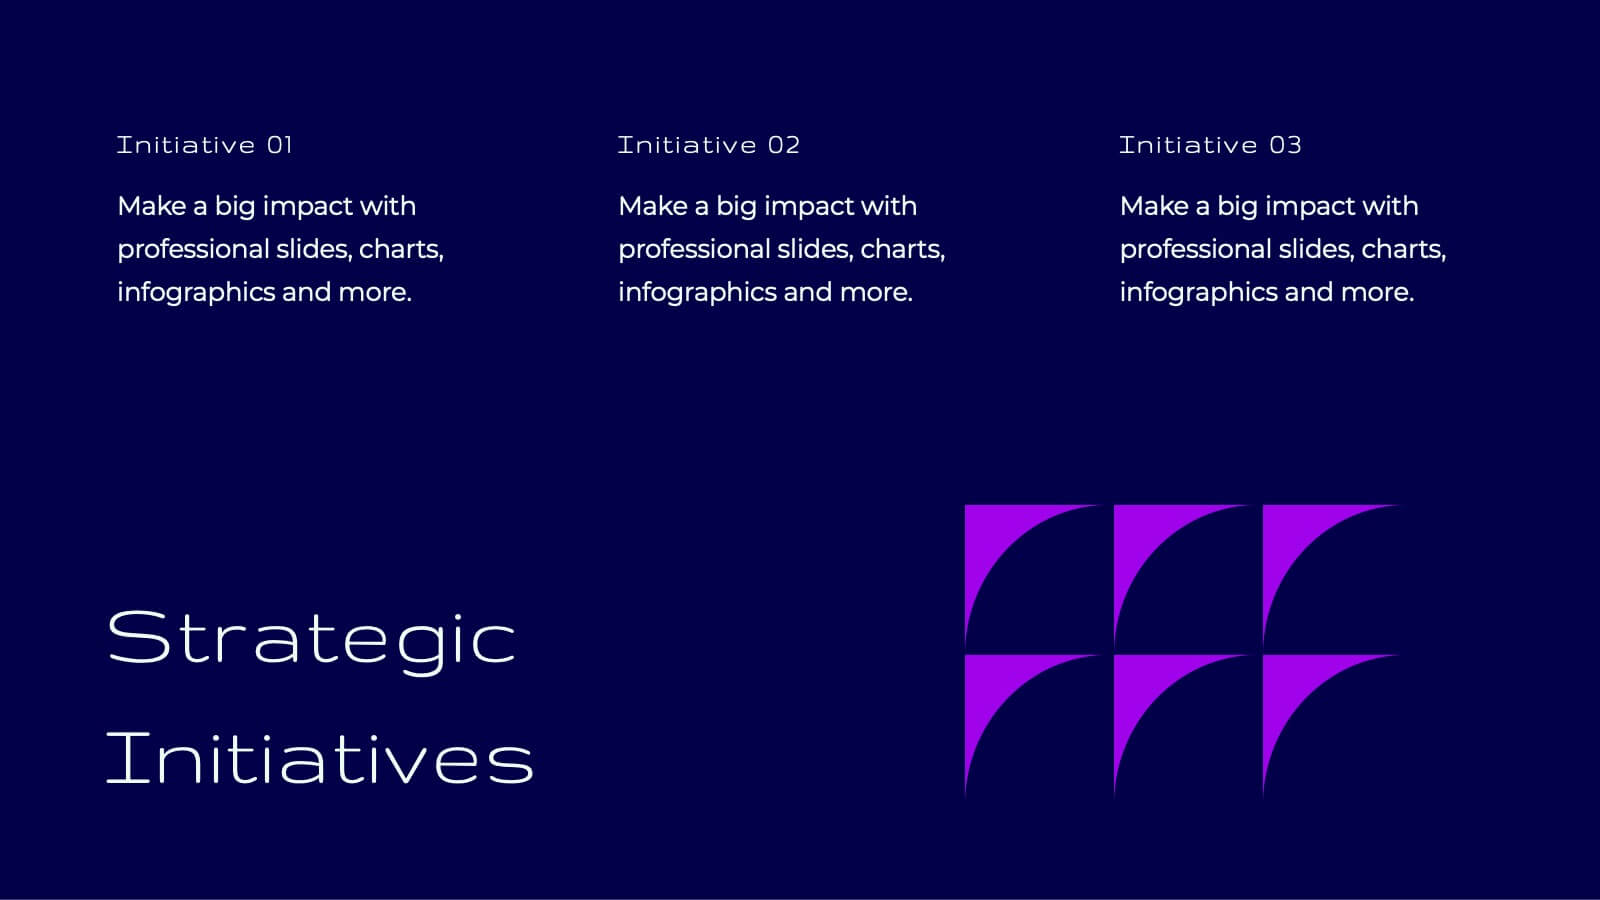
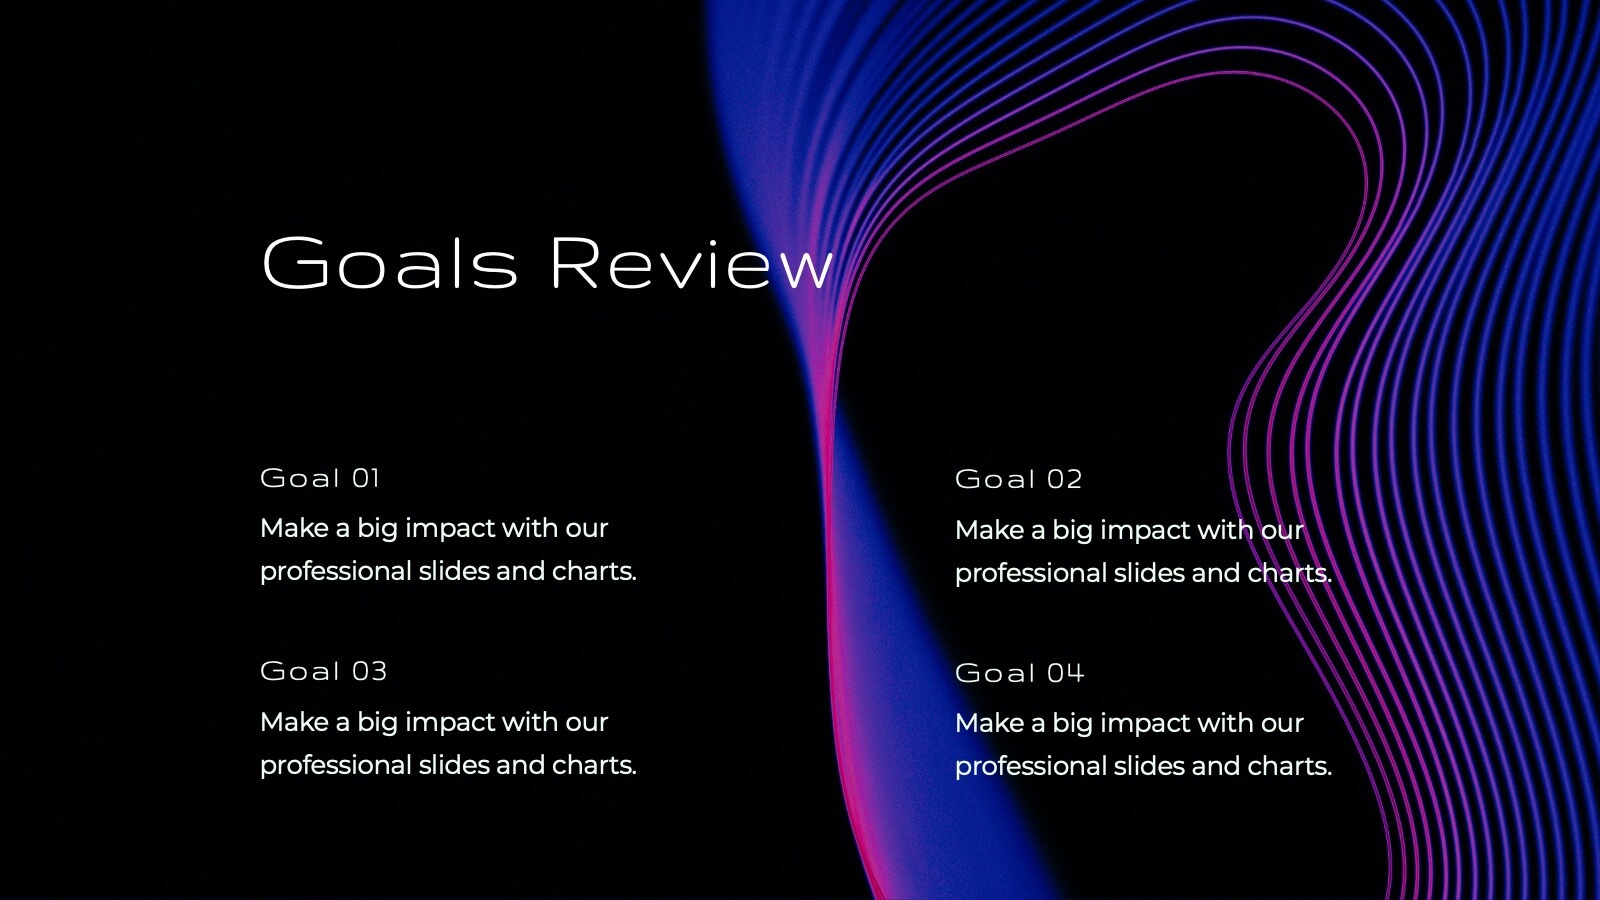
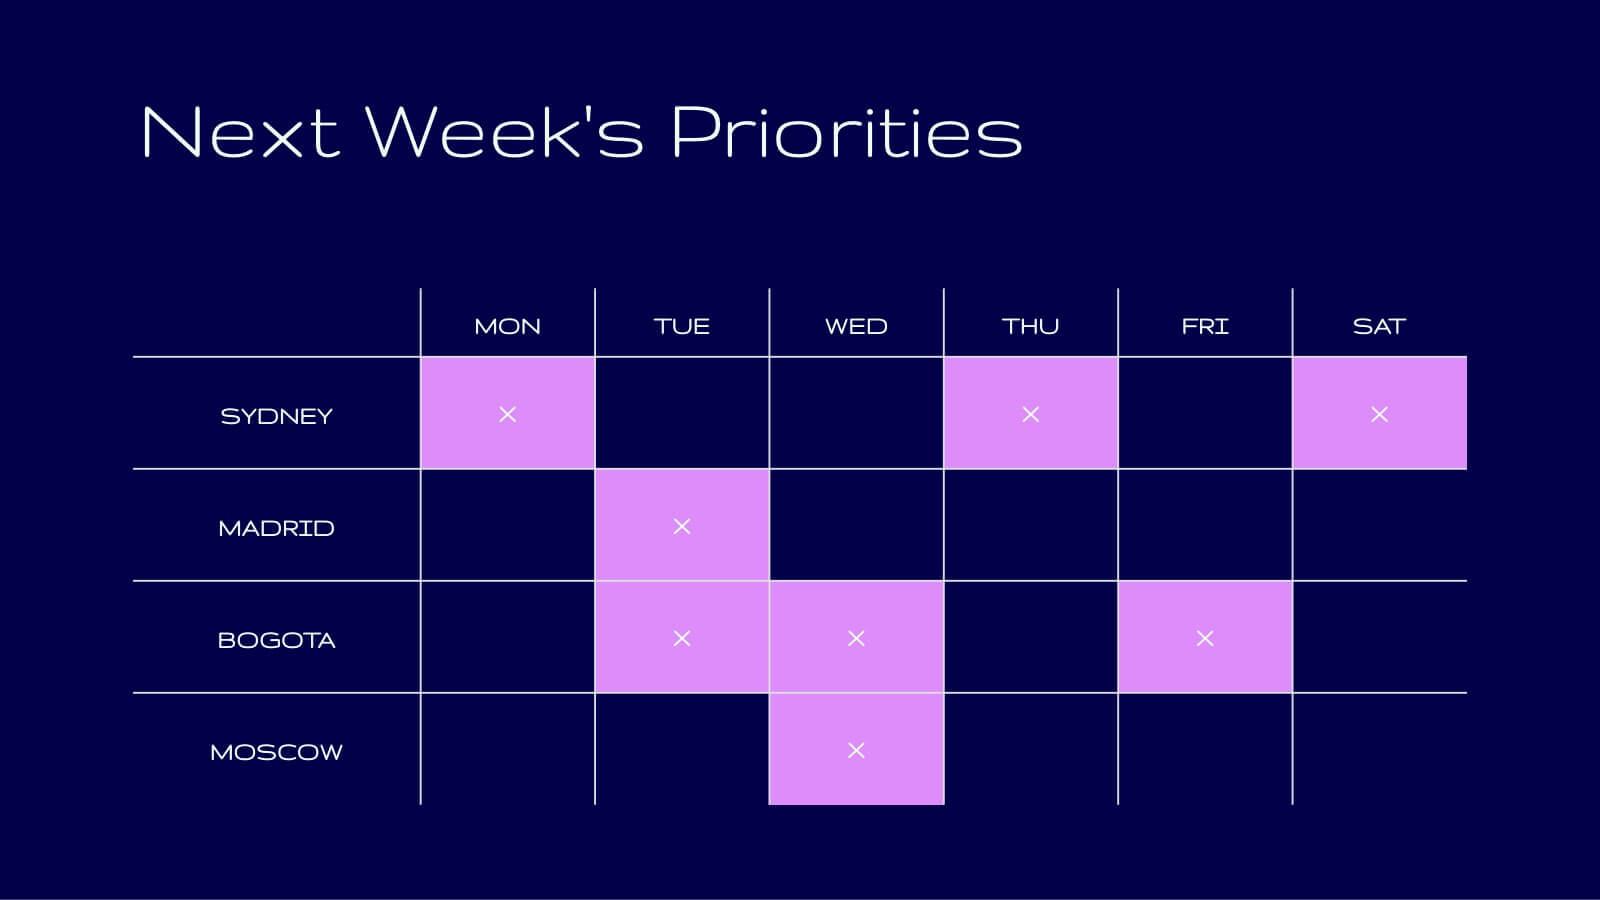
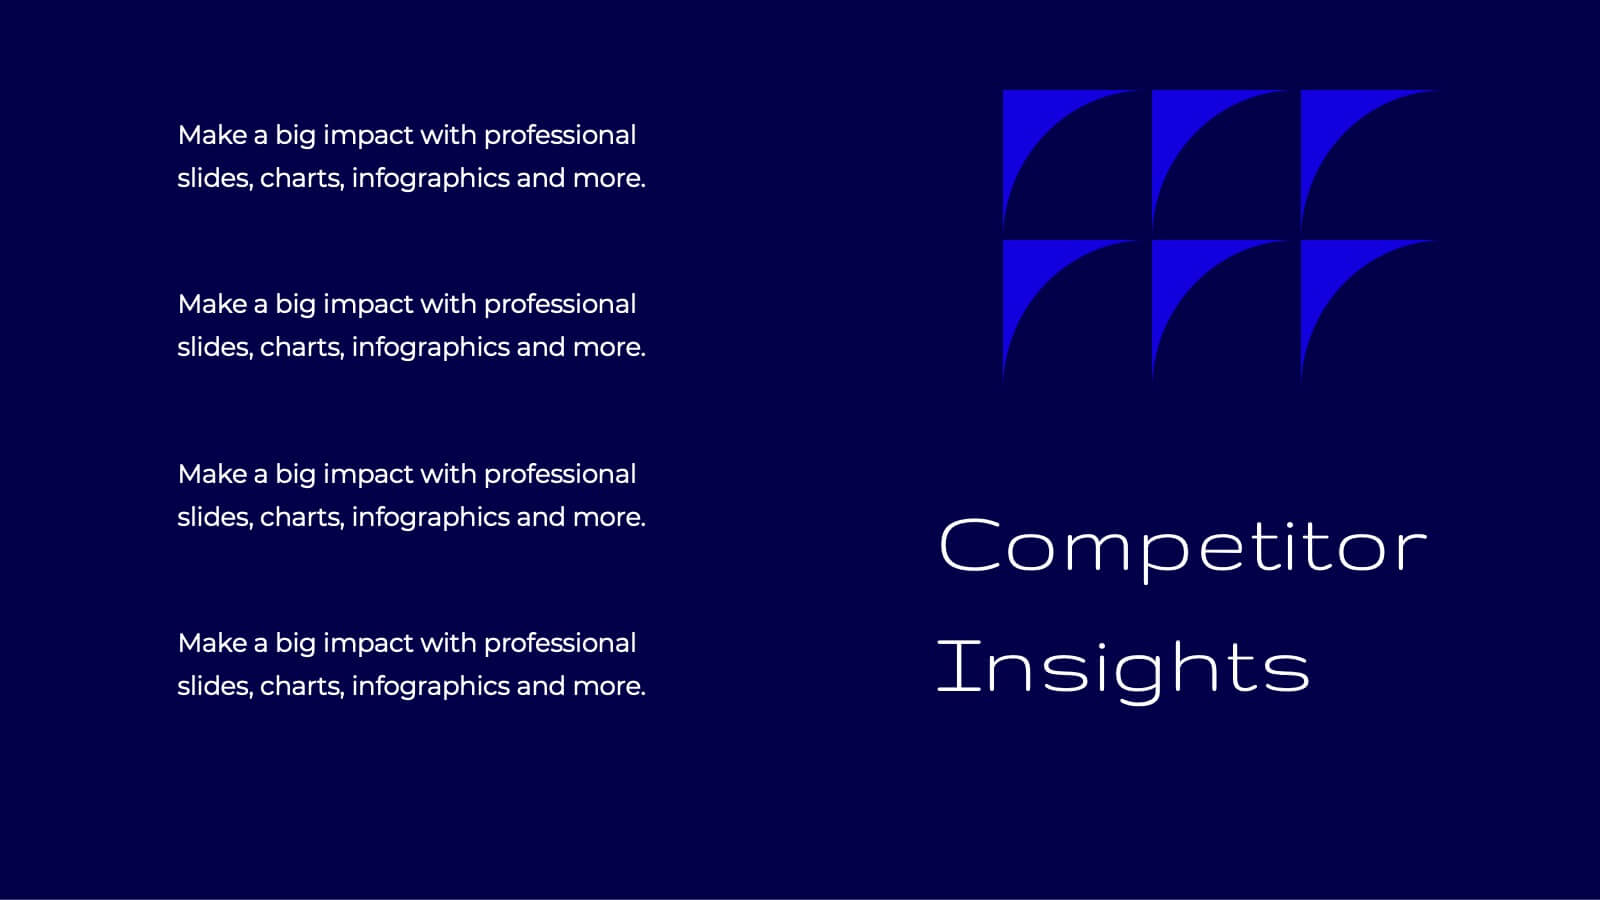
Tidal Research Findings Report Presentation
Deliver your research findings with impact using this sleek and modern report template! It covers key highlights, performance metrics, project progress, and competitor insights, making it ideal for clear, professional presentations. Perfect for summarizing challenges, solutions, and strategic initiatives. Compatible with PowerPoint, Keynote, and Google Slides for seamless reporting.


6 diapositivas
Financial Forecasting and Numerical Analysis Presentation
Visualize your financial insights with clarity using this clean and modern bar chart template. Designed for presenting financial projections, budget analysis, and performance metrics, this slide breaks down six key categories for easy comparison. Ideal for financial reviews, business updates, or investment pitches. Fully editable in PowerPoint, Keynote, and Google Slides.


6 diapositivas
Big Data Solutions Infographics
Discover the power of Big Data Solutions with our customizable infographic template. This template is fully compatible with popular presentation software like PowerPoint, Keynote, and Google Slides, allowing you to easily customize it to illustrate and communicate various aspects of big data solutions. The Big Data Solutions infographic template offers a visually engaging platform to explain the principles, technologies, and benefits of harnessing big data for insights and decision-making. Whether you're a data professional, business leader, or simply interested in the world of big data, this template provides a user-friendly canvas to create informative presentations and educational materials. Deepen your understanding of Big Data Solutions with this SEO-optimized infographic template, thoughtfully designed for clarity and ease of use. Customize it to showcase data sources, analytics tools, data storage options, and the real-world applications of big data in various industries, ensuring that your audience gains valuable insights into this transformative field. Start crafting your personalized infographic today to explore the world of Big Data Solutions.


25 diapositivas
Jasper Rebranding Project Plan Presentation
Elevate your brand transformation with this sleek rebranding presentation template! It covers everything from mission and values to market analysis and brand positioning. Perfect for showcasing your brand guidelines and touchpoints. Fully customizable, and compatible with PowerPoint, Keynote, and Google Slides, making your rebranding process seamless and professional.


6 diapositivas
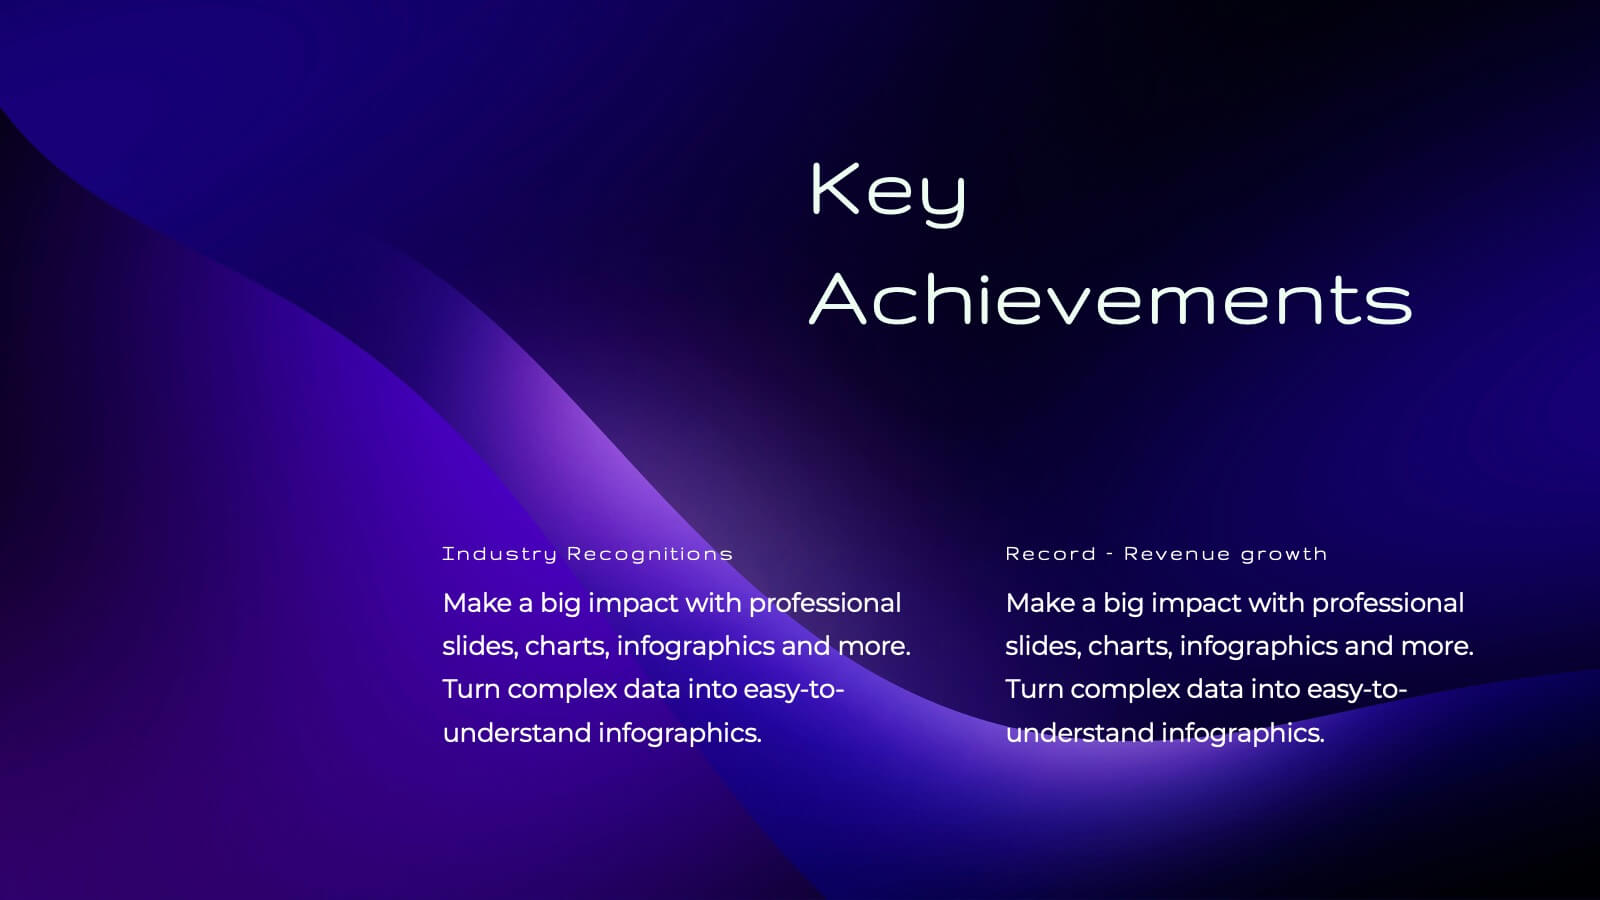
Key Business Milestones Presentation
Showcase your company’s journey with this dynamic and professional presentation design. Perfect for highlighting achievements, key phases, and growth stages, it helps you visualize progress with clarity and impact. Fully editable and compatible with PowerPoint, Keynote, and Google Slides, making milestone storytelling simple and visually compelling.