


Características


¿Tienes alguna pregunta?
Recomendar


7 diapositivas
Pricing Comparison Table Infographic
Dive into the strategic world of pricing with our intricately designed pricing table infographic. Imbued with the trustworthiness of blue, the crisp clarity of white, the optimism of yellow, and the urgency of red, our template visualizes pricing strategies in an engaging manner. Furnished with detailed infographics, distinct icons, and adaptable image placeholders, it translates complex pricing data into an easy-to-grasp format. Seamlessly crafted for Powerpoint, Keynote, or Google Slides. A vital asset for business analysts, marketers, sales professionals, or any brand strategizing its pricing model. Engage your audience; let every slide be a value proposition.


6 diapositivas
Core Mission Vision Goals Presentation
Spark clarity and momentum with a clean, modern slide designed to showcase your organization’s purpose and future direction. This presentation highlights your core mission and vision in a visually engaging layout that keeps teams aligned and focused. Fully compatible with PowerPoint, Keynote, and Google Slides.


7 diapositivas
Safety Rules Infographic
Safety rules are crucial in various settings, including workplaces, public spaces, and homes, because they play a fundamental role in protecting individuals from harm and ensuring their well-being. This infographic template aims to present essential safety rules and guidelines in a visually appealing manner. Compatible with Powerpoint, Keynote, and Google Slides. Tailor the content to suit your specific safety guidelines and ensure the infographic effectively communicates the importance of safety across different contexts. This will allow you to effectively communicate essential safety guidelines in your presentations.


5 diapositivas
New Venture Pitch Deck Structure Presentation
Outline your pitch with clarity using the New Venture Pitch Deck Structure Presentation. Designed for startups and entrepreneurs, this vertical timeline layout helps you present key sections like business model, problem/solution, and go-to-market strategy. Fully editable in PowerPoint, Canva, and Google Slides to fit your branding needs.


6 diapositivas
Bubble Map Organizer Infographic
A bubble map, is a visual representation that uses bubbles or circles to display data relationships and patterns. Each bubble in the map represents a data point, and its size and position convey information about various attributes of that data point. This Infographic template is a visual tool that helps organize and represent information in a hierarchical or interconnected manner. The bubble's are used for concepts or topics, and the relationships between bubbles are visually depicted with connecting lines. Compatible with Powerpoint, keynote, and Google Slides. You can choose a color palette that's visually appealing and easily distinguishable.


5 diapositivas
Root Cause Analysis Fishbone Format Presentation
Break down complex problems with the Root Cause Analysis Fishbone Format Presentation. Designed to identify contributing factors visually, this diagram helps teams analyze causes across multiple categories—ideal for quality control, troubleshooting, and process improvement. Fully editable in Canva, PowerPoint, or Google Slides for effortless customization.


6 diapositivas
McKinsey 7S Framework
Visualize the interdependent elements of organizational success with this professional McKinsey 7S Framework template. Ideal for strategic planning, change management, or internal assessments, this editable slide highlights structure, systems, style, staff, skills, strategy, and shared values. Fully compatible with PowerPoint, Keynote, and Google Slides.


7 diapositivas
Human Resources Process Infographic
Dive deep into the intricate world of HR with our human resources process infographic. Designed for clarity and ease of understanding, this infographic provides a streamlined look into the diverse steps and stages involved in efficient management. With a clean white canvas complemented by various shades of blue and a spectrum of colors for differentiation, this infographic promises an insightful journey. This is a tool for professionals aiming to present complex processes in a digestible format. Given its universal design, it's perfect for integration into PowerPoint, Keynote, or Google Slides presentations, ensuring that your content not only educates but also engages.


5 diapositivas
Closing Statement with Highlights Presentation
Wrap up your presentation with this clean, step-by-step summary slide. Featuring a rising arrow path and a trophy icon, it’s ideal for showcasing final insights or major achievements. Highlight up to five key points clearly and concisely. Fully customizable in PowerPoint, Keynote, and Google Slides for seamless presentation use.


21 diapositivas
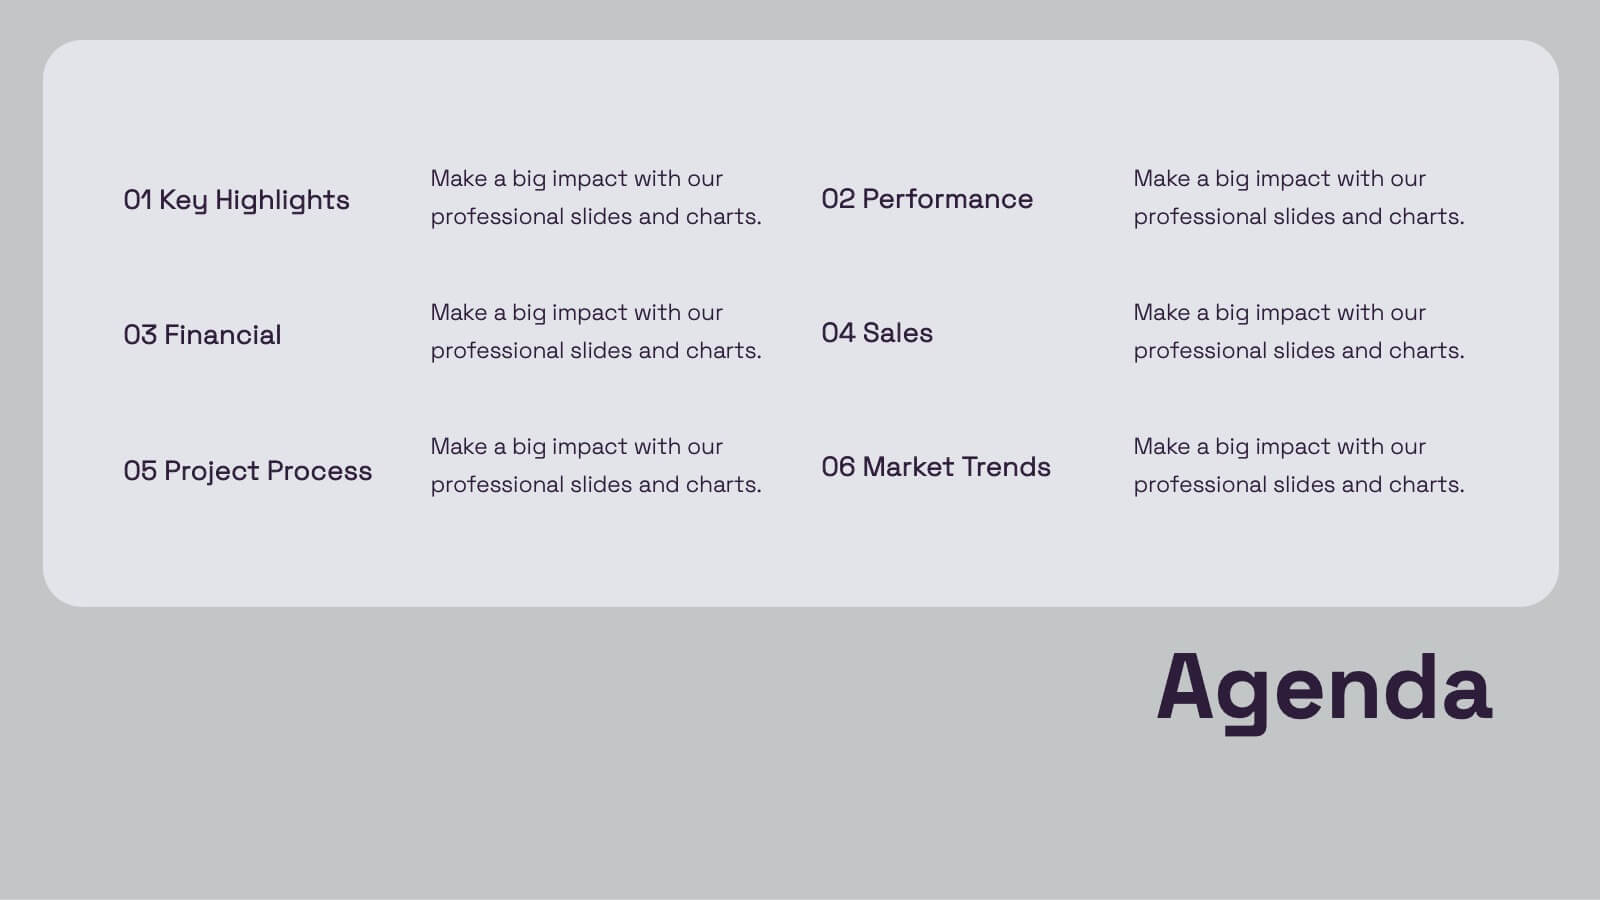
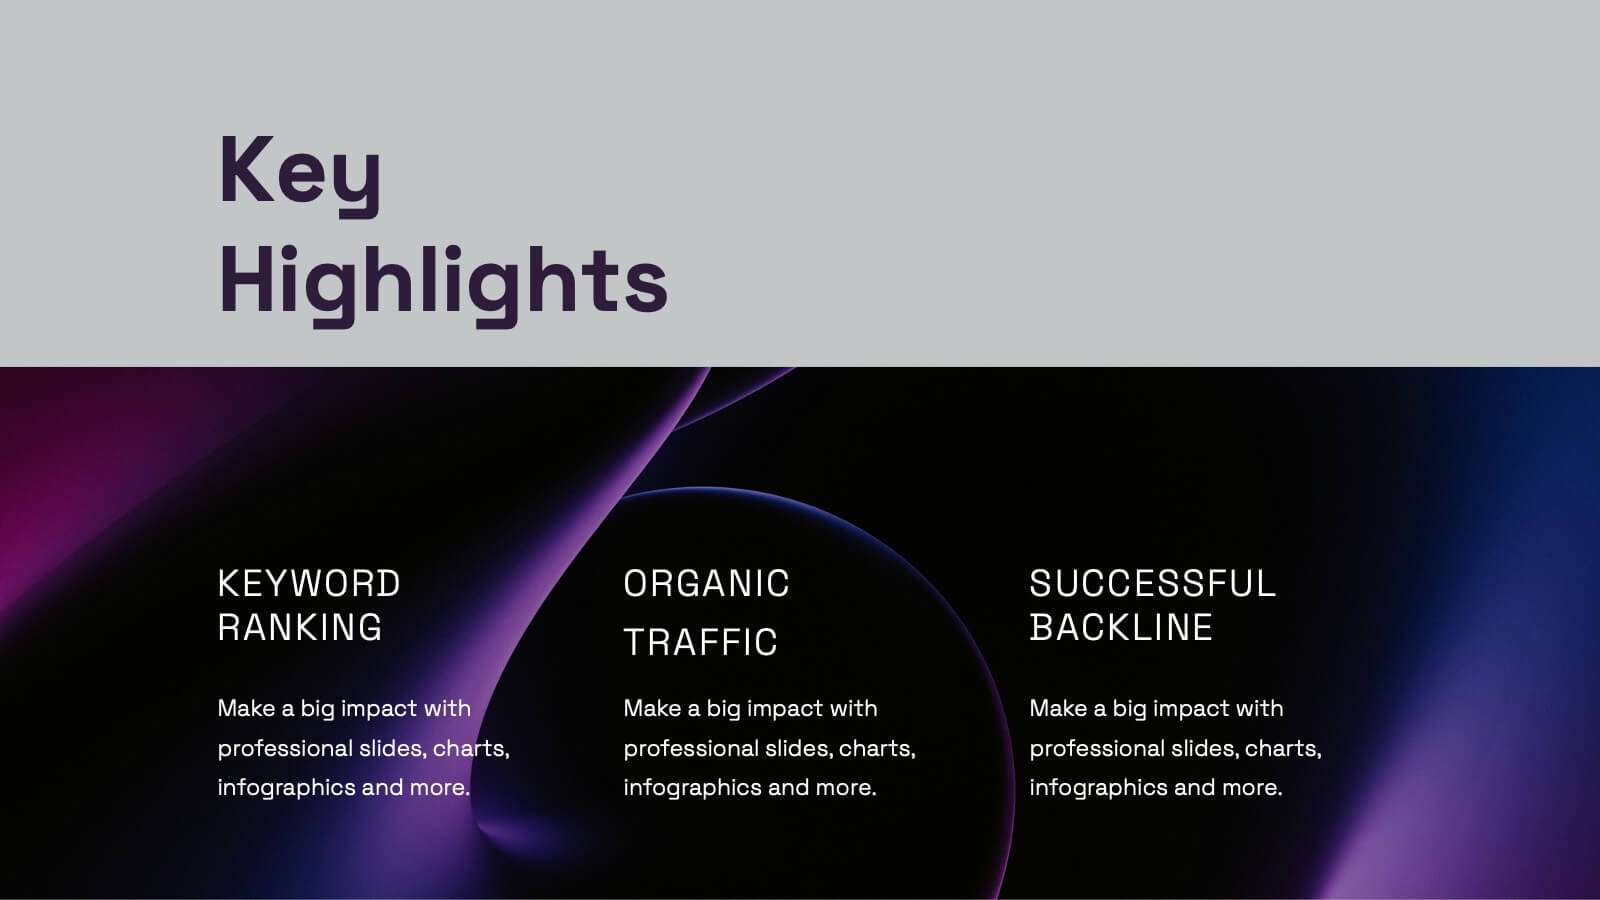
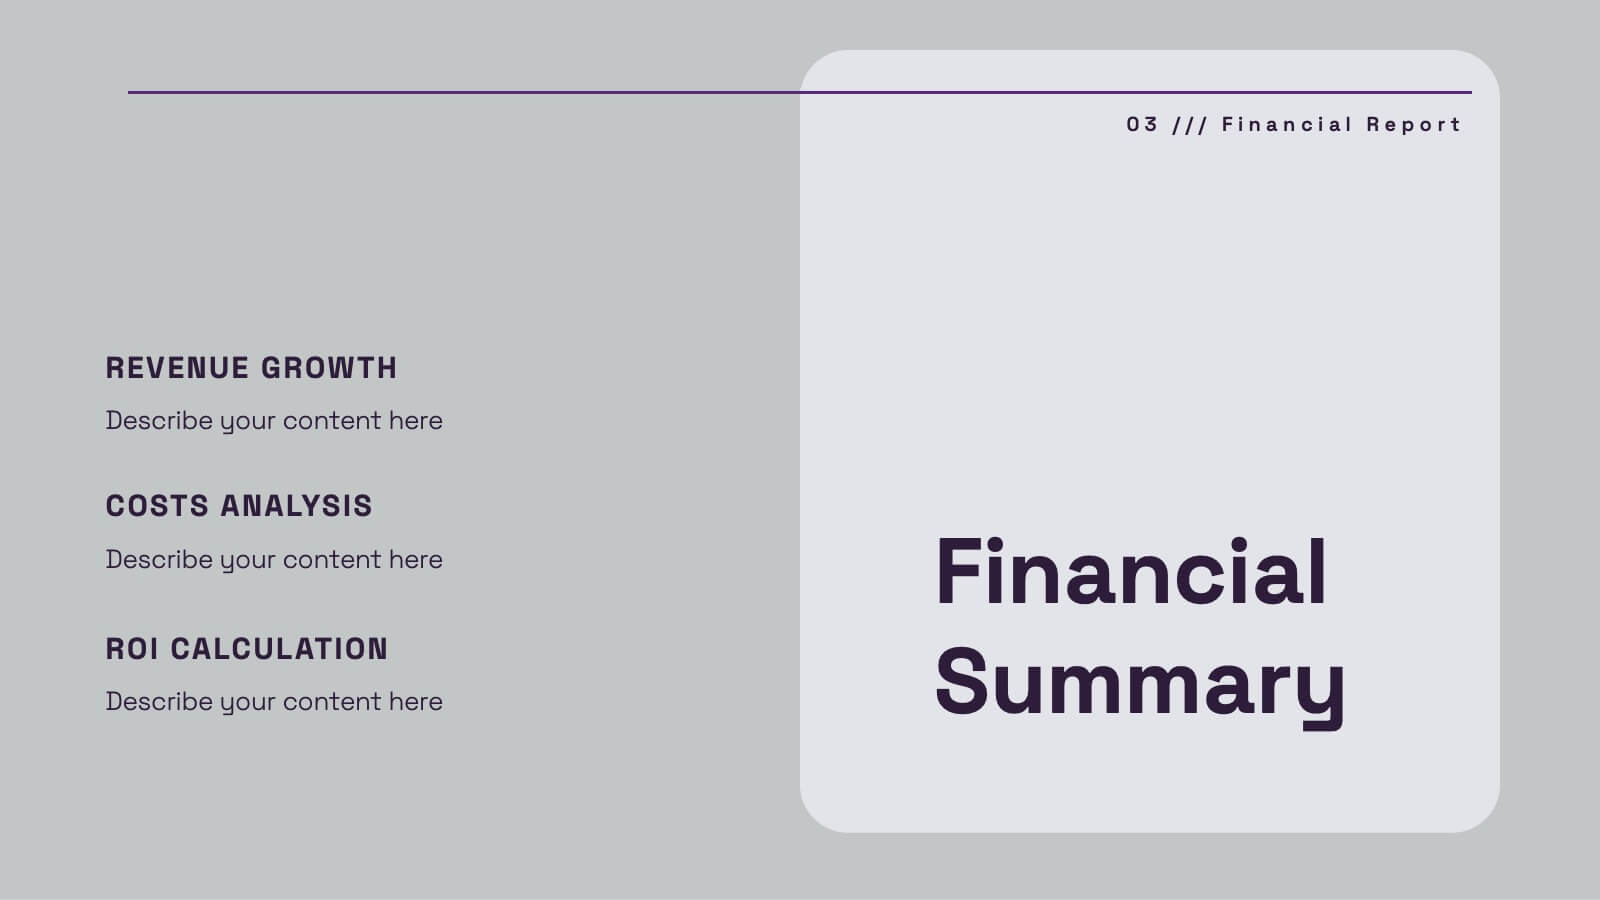
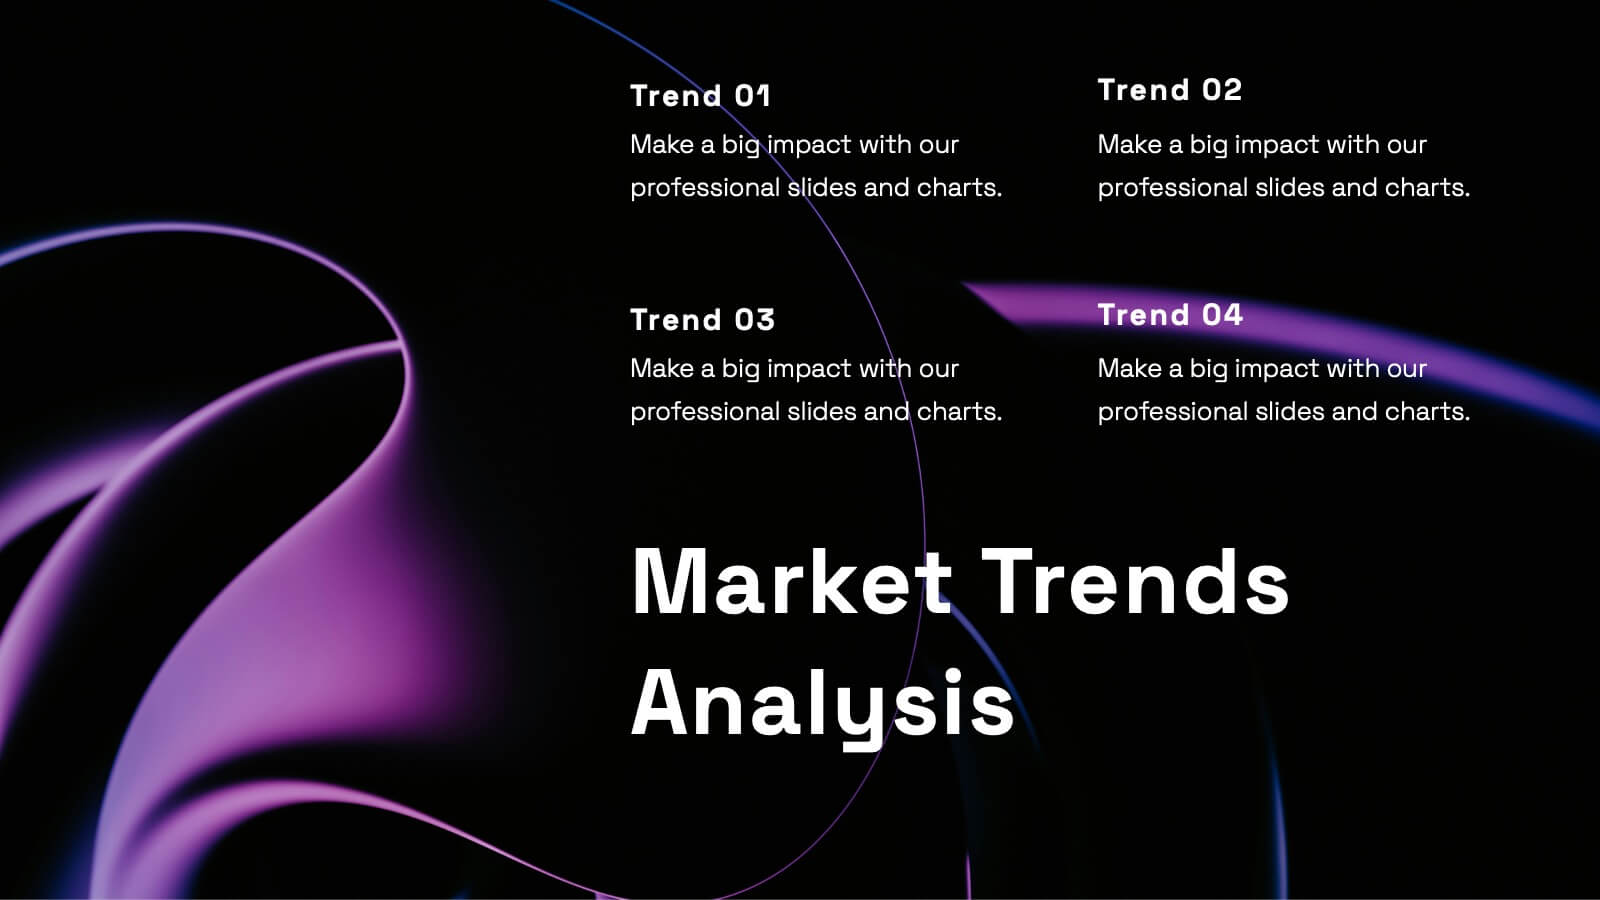
Uplift Financial Report Presentation
Present your financial or business report with this sleek and modern presentation template! It includes essential sections such as performance metrics, financial summaries, project progress, and market trends analysis, ensuring a comprehensive overview. Whether you're discussing key achievements or competitor insights, this template is perfect for delivering a professional and polished report. Compatible with PowerPoint, Keynote, and Google Slides for easy use and customization.


5 diapositivas
Cryptocurrency Investment Infographics
Cryptocurrency Investment refers to the practice of buying, holding, or trading digital currencies as a form of investment. These infographic templates allow you to effectively present information about cryptocurrency investment, demystify the subject, and empower individuals to explore and navigate the world of digital currencies with confidence. Use these infographics to educate and inform individuals about the world of cryptocurrency investment. These aim to provide key information and insights to help people make informed decisions when it comes to investing in cryptocurrencies. Compatible with Powerpoint, Keynote, and Google Slides.


6 diapositivas
Milestones Technologies Infographics
Highlight significant milestones in technology with our Milestones Technologies infographic template. This template is fully compatible with popular presentation software like PowerPoint, Keynote, and Google Slides, allowing you to easily customize it to showcase pivotal moments and achievements in the world of technology. The Milestones Technologies infographic template offers a visually engaging platform to chronicle and celebrate key technological advancements, innovations, and breakthroughs throughout history. Whether you're a tech enthusiast, educator, or simply interested in technological progress, this template provides a user-friendly canvas to create informative presentations and educational materials. Deepen your appreciation for the impact of technology with this SEO-optimized Milestones Technologies infographic template, thoughtfully designed for clarity and ease of use. Customize it to highlight milestones across various fields, from computing and telecommunications to space exploration and biotechnology, making it a valuable resource for sharing the history of technology with your audience. Start crafting your personalized infographic today to explore the remarkable journey of technological progress.


4 diapositivas
Interactive Data Dashboard Display Presentation
Present data with clarity using this Interactive Data Dashboard Display presentation. Designed to showcase multiple metrics at once, it includes pie charts, donut charts, bubble graphs, and bar comparisons. Ideal for business reports, marketing insights, or performance reviews. Fully editable in Canva, PowerPoint, and Google Slides for flexible customization.


7 diapositivas
Environmental Specialist Infographic
An Environmental Specialist, is a professional who focuses on environmental issues and challenges, aiming to develop solutions and strategies to address them. This engaging infographic template is designed to shed light on the critical role of environmental specialists, presenting data, facts, and strategies to inspire and educate on the path towards a sustainable and eco-friendly world. Fully customizable and compatible with Powerpoint, Keynote, and Google Slides. This infographic is your guide to understanding and appreciating the invaluable work of environmental specialists.


4 diapositivas
Vision Statement Development Framework Presentation
Define and refine your company’s future with the Vision Statement Development Framework. This clean, step-by-step infographic guides you through creating a focused and inspiring vision statement. Ideal for strategic sessions, leadership presentations, and goal-setting workshops. Fully editable in PowerPoint, Canva, and Google Slides for seamless customization.


7 diapositivas
Business Law Infographic
Demystify the intricate world of business law with our Business Law Infographic. Set against a crisp white backdrop, accented with authoritative purple, trustworthy blue, and attention-grabbing yellow, our template encapsulates the gravity and nuance of legalities in the corporate sphere. Furnished with clear-cut infographics, symbolic icons, and pertinent image placeholders, it decodes legal jargon into an easily comprehensible visual format. Precisely crafted for Powerpoint, Keynote, or Google Slides. An indispensable guide for business owners, legal consultants, corporate trainers, or any entity navigating the maze of business legislation.


6 diapositivas
Sales Skills Development Training Presentation
Bring your sales training to life with a sleek, infinity-loop visual that keeps learners engaged from start to finish. This template helps you map out each phase of sales skill development, from lead generation to closing. Fully customizable and compatible with PowerPoint, Keynote, and Google Slides for seamless integration.