


Características


¿Tienes alguna pregunta?
Recomendar


26 diapositivas
Startup Presentation
Elevate your startup's story with this Startup Presentation template. It features slides for your mission, innovation highlights, market analysis, and growth strategy. Perfect for engaging potential investors and partners. This versatile template is compatible with PowerPoint, Keynote, and Google Slides, making it easily accessible for all your presentation needs.


7 diapositivas
Environmental Infographic Presentation Template
An Environmental infographic is a great tool for educating your audience about the state of the environment. This template includes a large format and bold colors that create an impactful visual appeal. The design provides space for facts, stats, and descriptions of the project in question. Use this template to show how much the world has changed and what measures are being taken to mitigate effects on the environment. This infographic has a green hue and illustrations that allow you to add information on the world's natural resources. This is a unique and fun way to display your information.


5 diapositivas
Energy Sources in The United States Infographics
Energy Sources in The United States Infographics is a bold, colorful, and modern presentation


5 diapositivas
Innovation in Digital Technologies Presentation
Highlight key advancements with this Innovation in Digital Technologies Presentation. Designed with four modern icon segments, this slide helps communicate your digital transformation journey clearly. Ideal for showcasing emerging tools, platforms, or strategies. Fully editable in Canva, PowerPoint, or Google Slides for seamless integration into any tech-focused presentation.


11 diapositivas
Company Team Meeting Presentation
Bring your team together with our dynamic Company Team Meeting presentation template. Designed for clarity and engagement, this template sets the stage for productive discussions, from weekly roundups to strategic planning sessions. It begins with a vibrant cover slide that sets an upbeat tone for the meeting, followed by a clear agenda to keep your discussion on track. With slides tailored for talking points, updates, upcoming events, and deadlines, it helps you streamline the flow of information. The template includes sections for announcements and feedback, encouraging open dialogue. Ground rules are laid out to foster a respectful and collaborative environment, while the progress and challenges slides are perfect for a transparent review of the company's status and addressing any hurdles head-on with practical solutions. This template, adaptable to PowerPoint, Keynote, and Google Slides, not only captures attention with its colorful design but also reinforces team cohesion and focus on common goals. Use it to energize your team meetings and ensure everyone leaves aligned and motivated.


7 diapositivas
Pillar of Success Infographic
Pillars of Success is a metaphorical term used to describe principles or key elements that are essential for achieving success in various aspects of life, whether it's in personal development, business, education, relationships, or any other domain. This infographic template unveils the essential principles that constitute the very pillars upon which triumph and accomplishment stand. Compatible with Powerpoint, Keynote, and Google Slides. The pillars represent foundational factors that contribute to success. This template symbolizes the foundation of any successful venture, emphasizing the importance of a strong start.


6 diapositivas
Skills Gap Assessment Infographic
The Skills Gap refers to the mismatch between the skills and qualifications that employers seek in their workforce and the skills possessed by job seekers or employees. This infographic template is a visual representation of the evaluation and analysis of the skills gap within a specific organization, industry, or job sector. The infographic is designed to help businesses and stakeholders understand the disparity between the skills required for certain roles and the skills possessed by the current workforce. By identifying the skills gap, organizations can develop targeted training and development programs to bridge the gap and enhance their employees' skills.


6 diapositivas
Tiered Pricing Plan Layout Presentation
Clearly compare features across your service levels with this Tiered Pricing Plan Layout Presentation. Ideal for showcasing Basic, Regular, and Premium options in a side-by-side table with checkmarks and pricing. Great for SaaS, product subscriptions, or membership tiers. Fully editable in Canva, PowerPoint, Google Slides, and Keynote.


7 diapositivas
Technology Consulting Infographic
Technology consulting, also known as IT consulting or tech consulting, involves providing expert advice and guidance to organizations regarding their technology strategy, utilization, and optimization. This infographic template provides a compelling way to illustrate complex concepts, strategies, and data related to technology consulting. Fully customizable and compatible with Powerpoint, Keynote, and Google Slides. The sleek, modern design reflects the cutting-edge nature of technology and consulting services. This infographic is your go-to tool for creating presentations that showcase your technology consulting expertise.


10 diapositivas
Project Launch in 4 Structured Phases Presentation
Present your roadmap with clarity using this four-phase launch diagram. Designed for planning, strategy, or product rollout presentations, each step is illustrated in a 3D layered format with editable text sections. Fully customizable in PowerPoint, Keynote, and Google Slides—ideal for project managers and teams outlining sequential development or launches.


4 diapositivas
Oceania Region Editable Map Slide Presentation
Highlight your insights across Australia and the Pacific with a clean, modern map layout designed for clarity and engagement. Ideal for visualizing market regions, travel data, or geographic comparisons, this slide combines style with precision. Fully compatible with PowerPoint, Keynote, and Google Slides for effortless customization and presentation.


5 diapositivas
Business Performance Dashboard Presentation
Bring your data to life with a crisp, unified view of metrics that matter. This presentation helps you track performance, compare results, and visualize progress through charts and KPIs that keep teams aligned. Clean, modern, and easy to adapt. Fully compatible with PowerPoint, Keynote, and Google Slides.
22 diapositivas
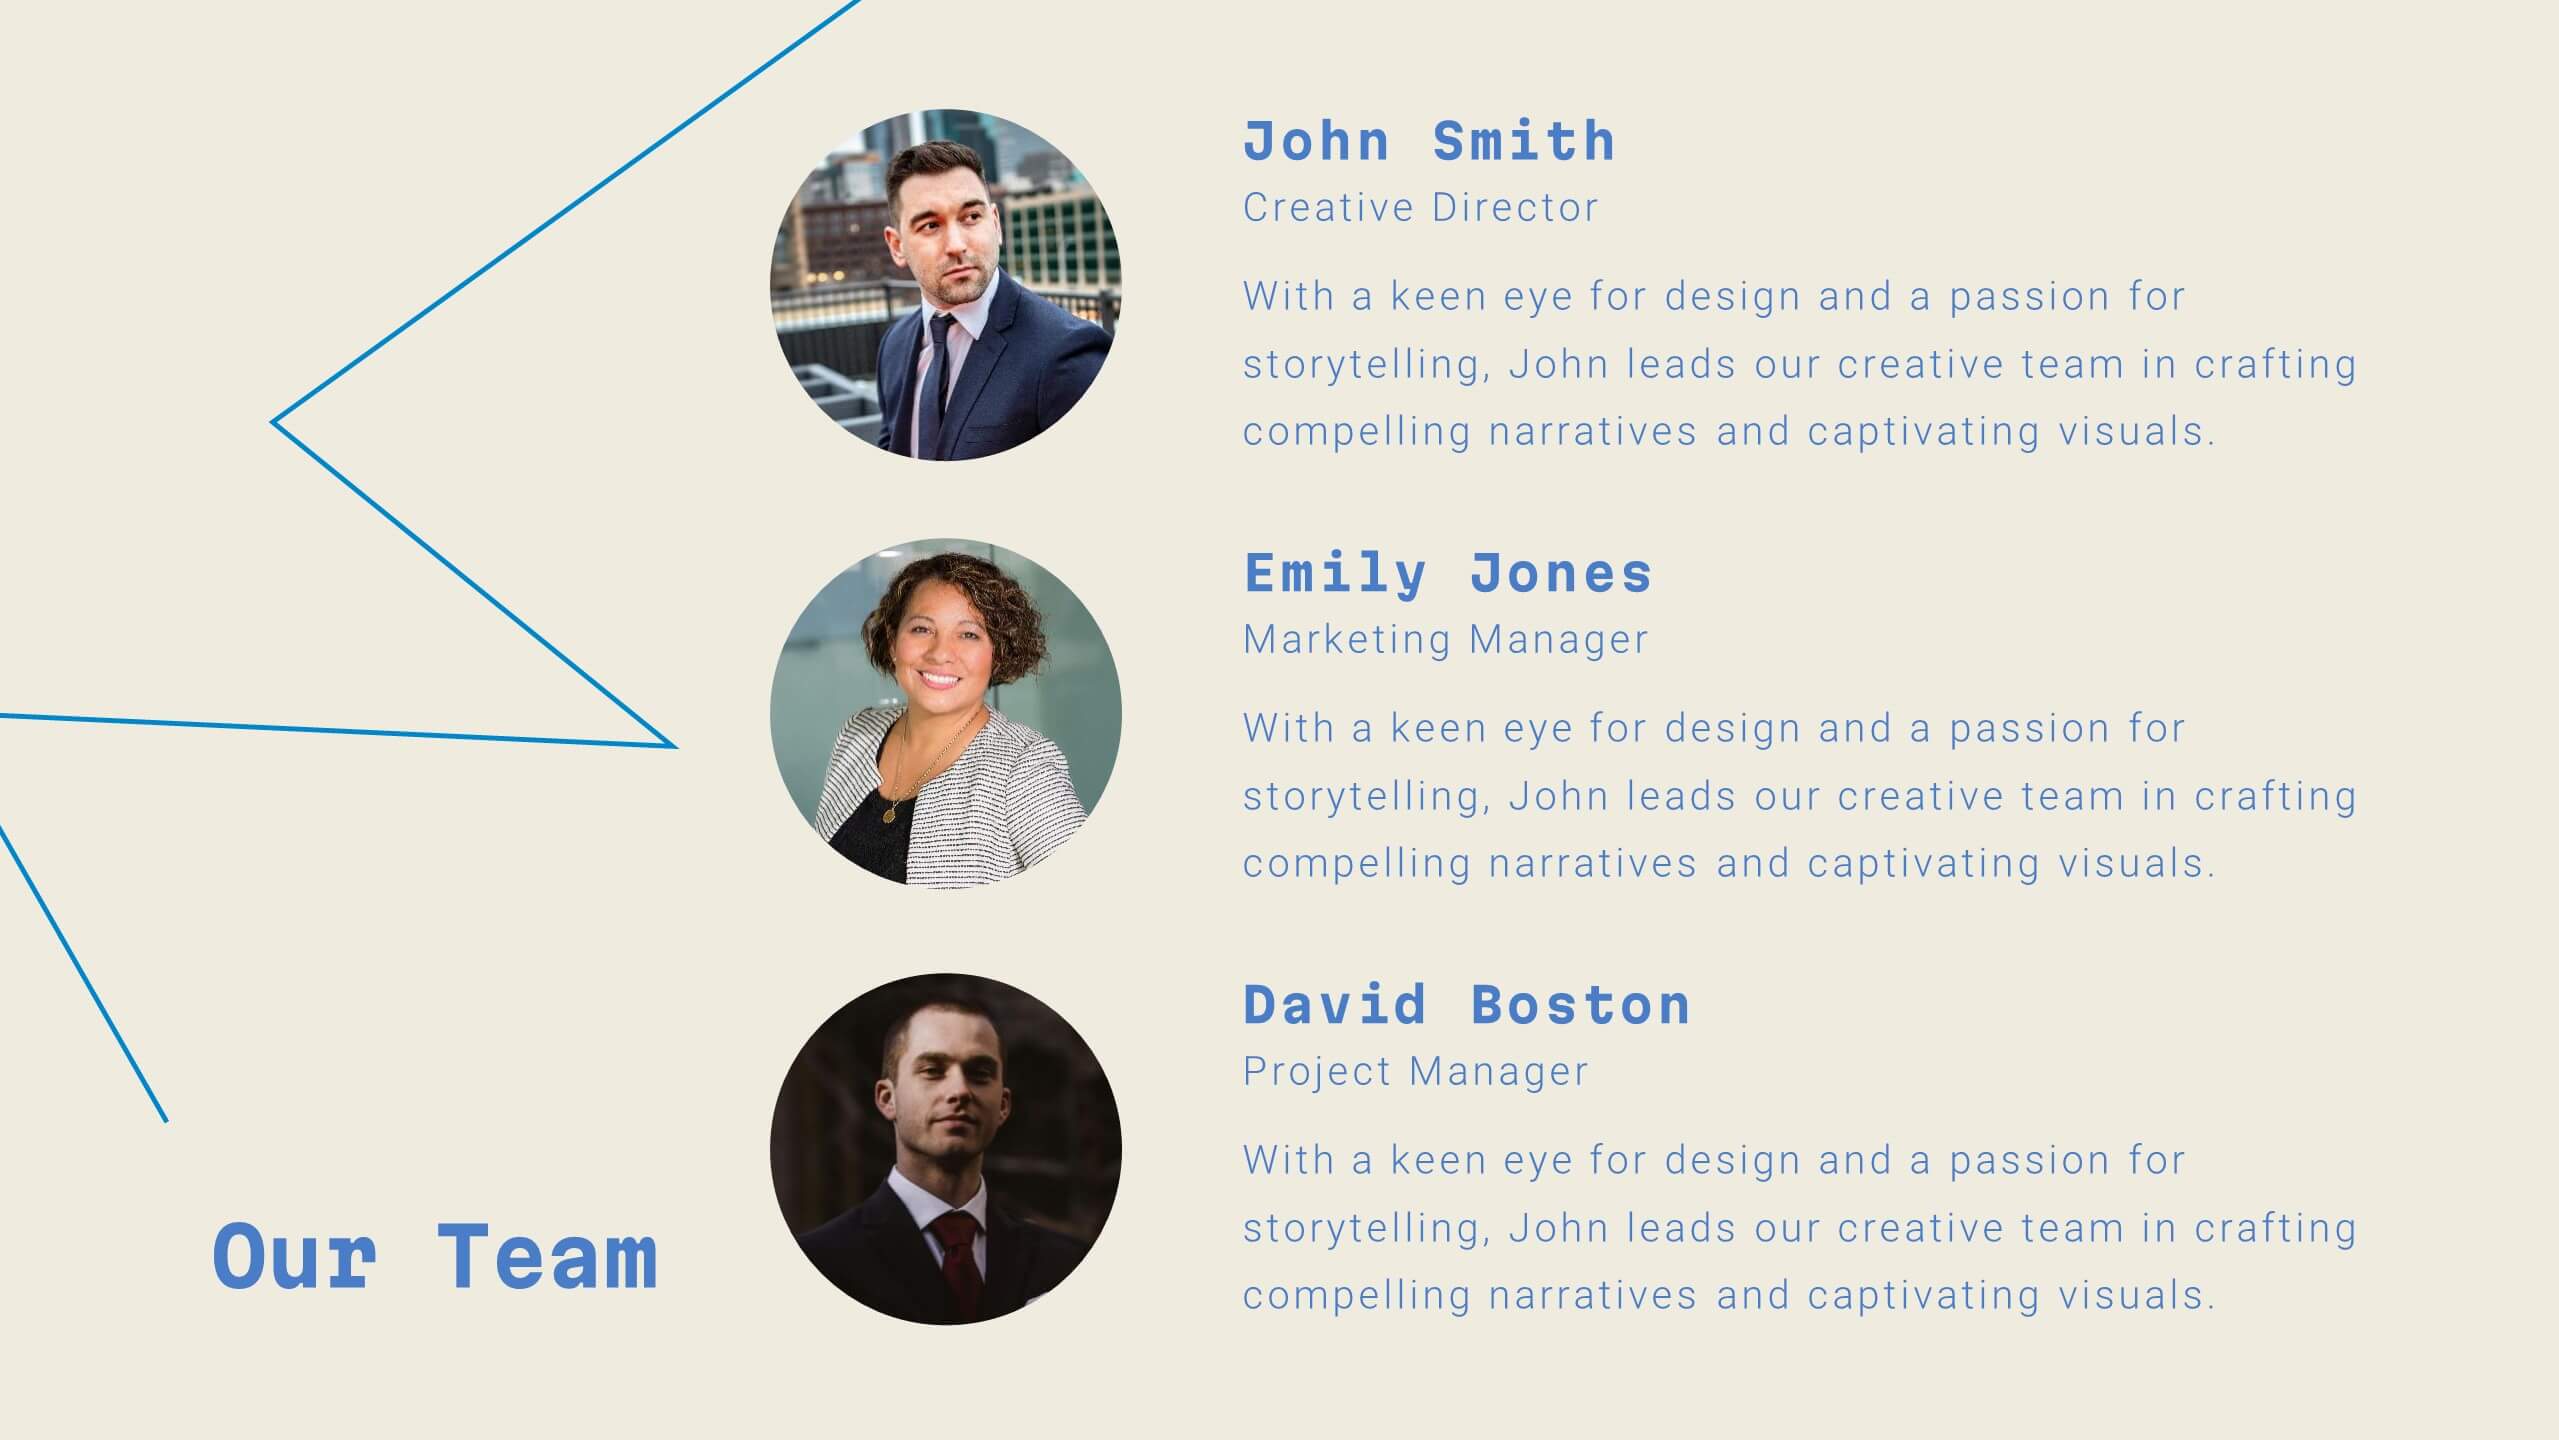
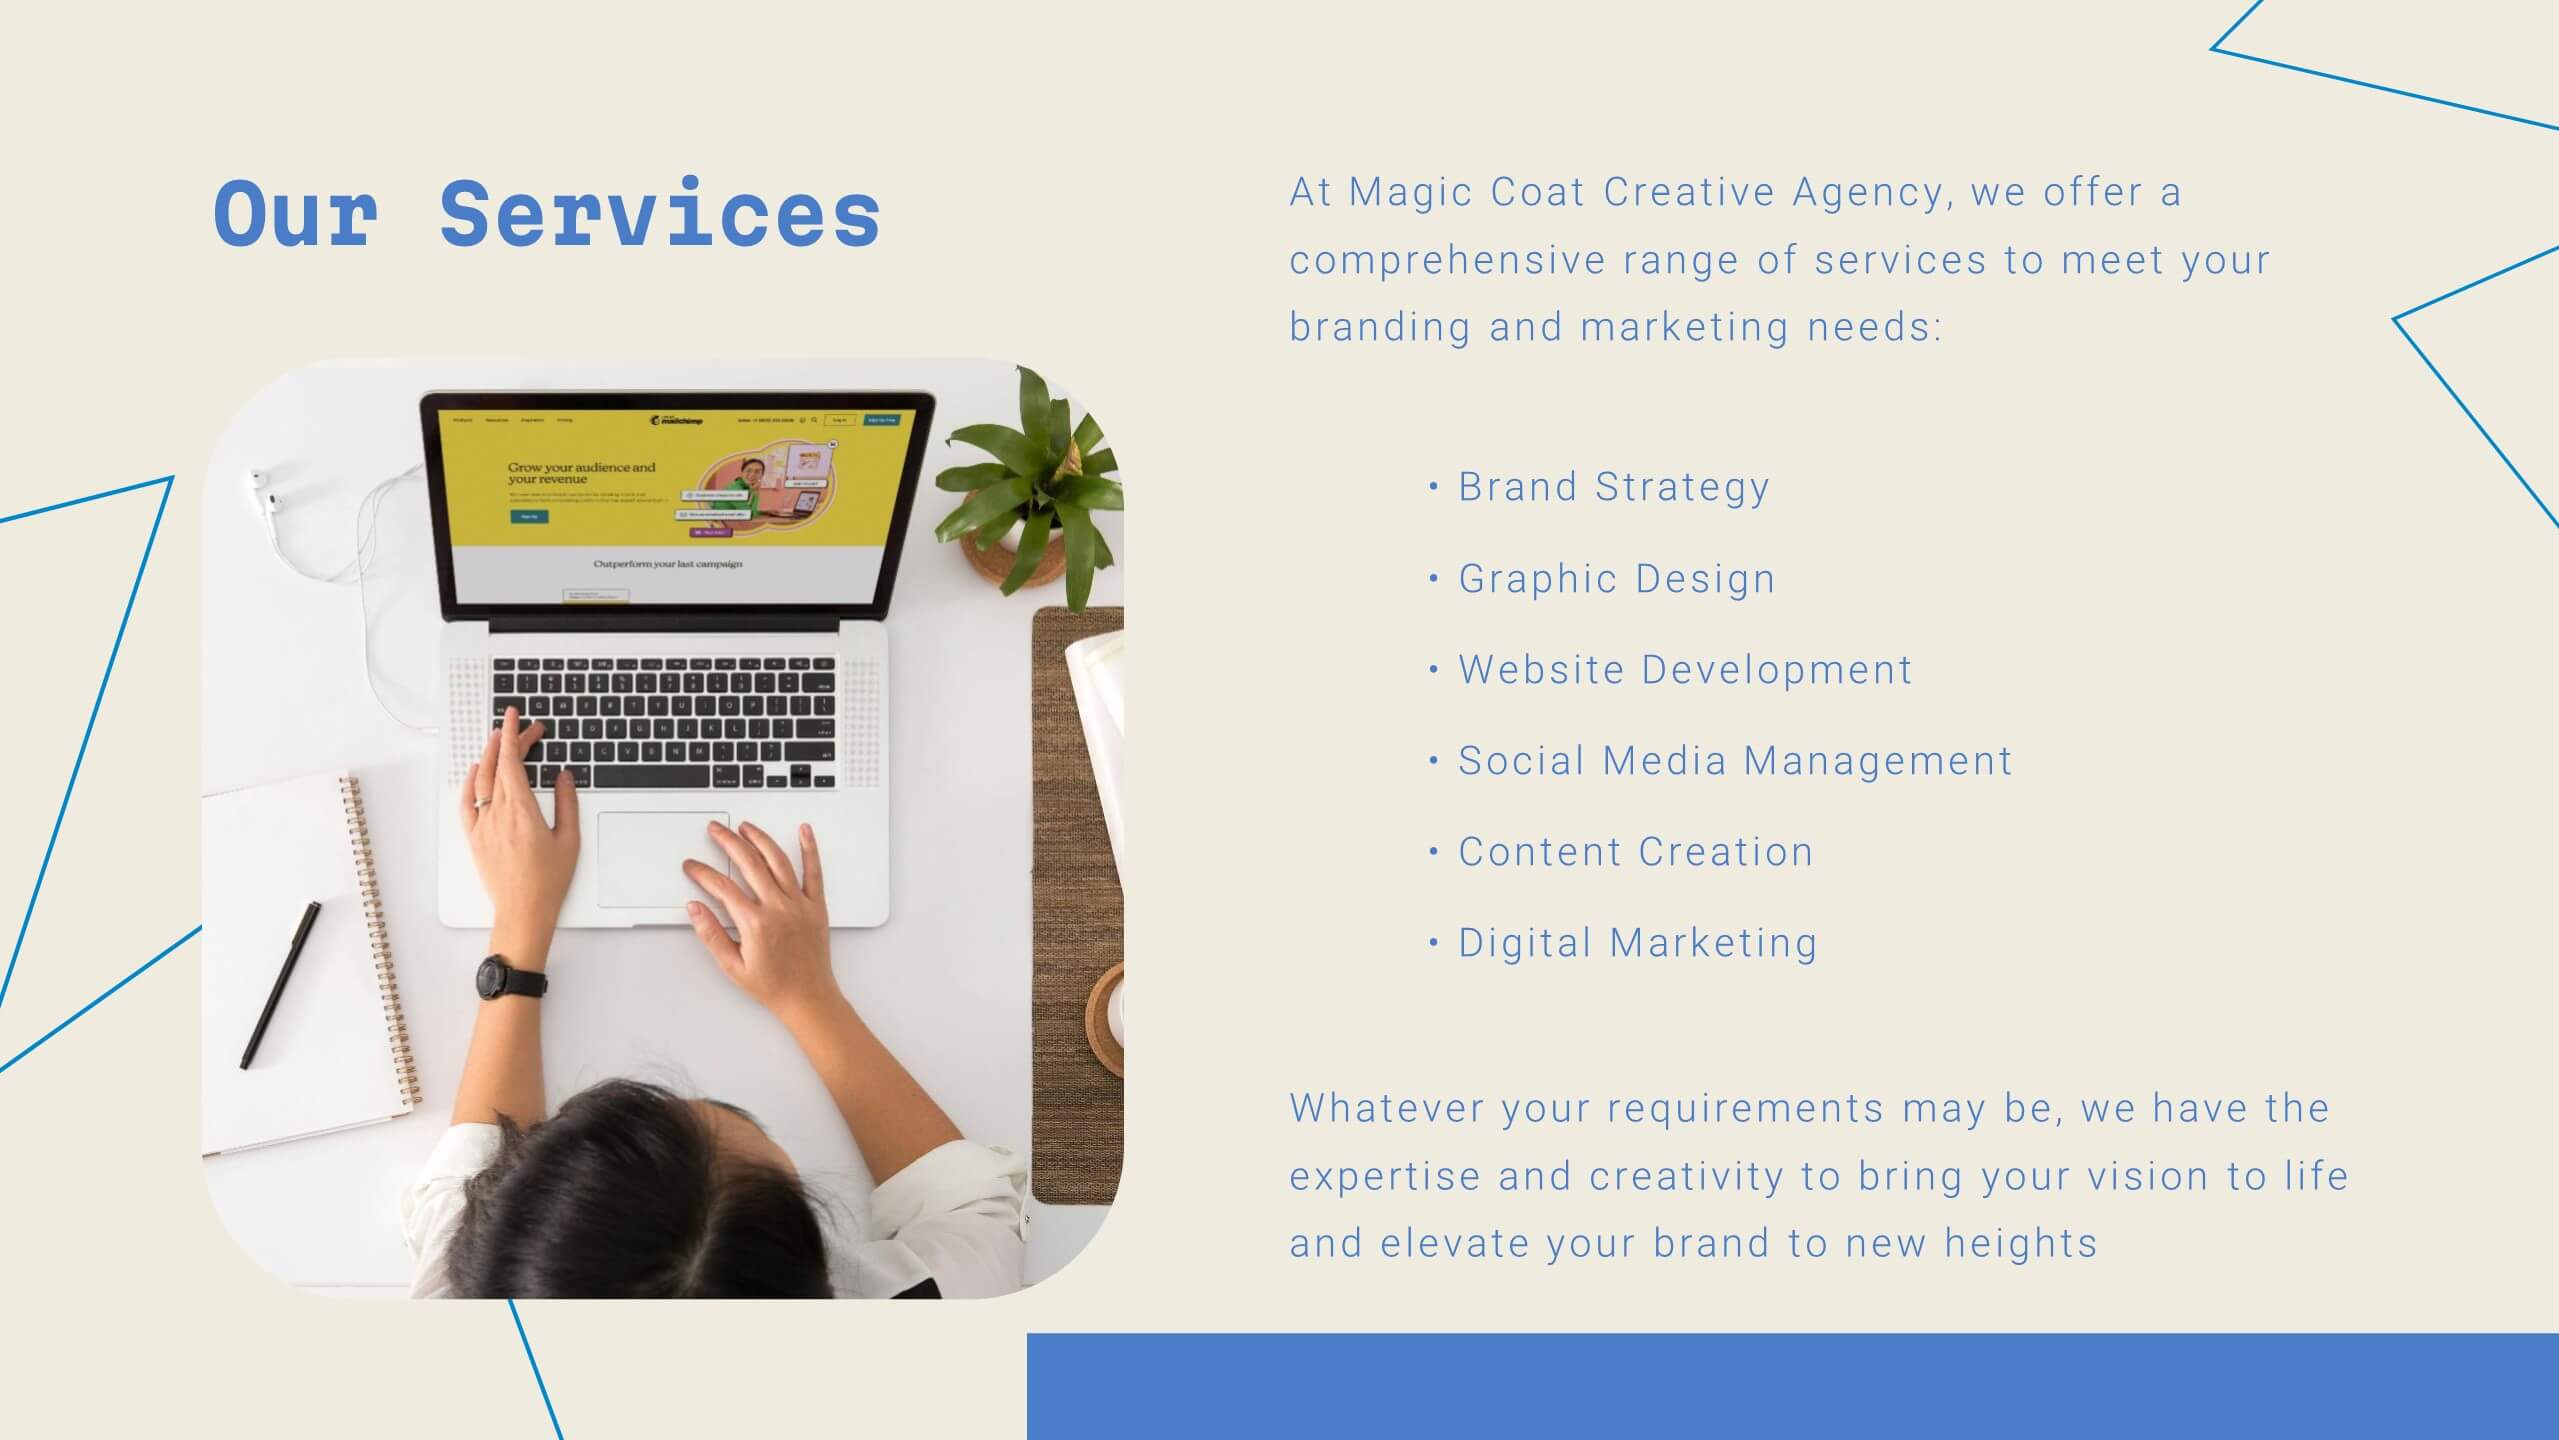
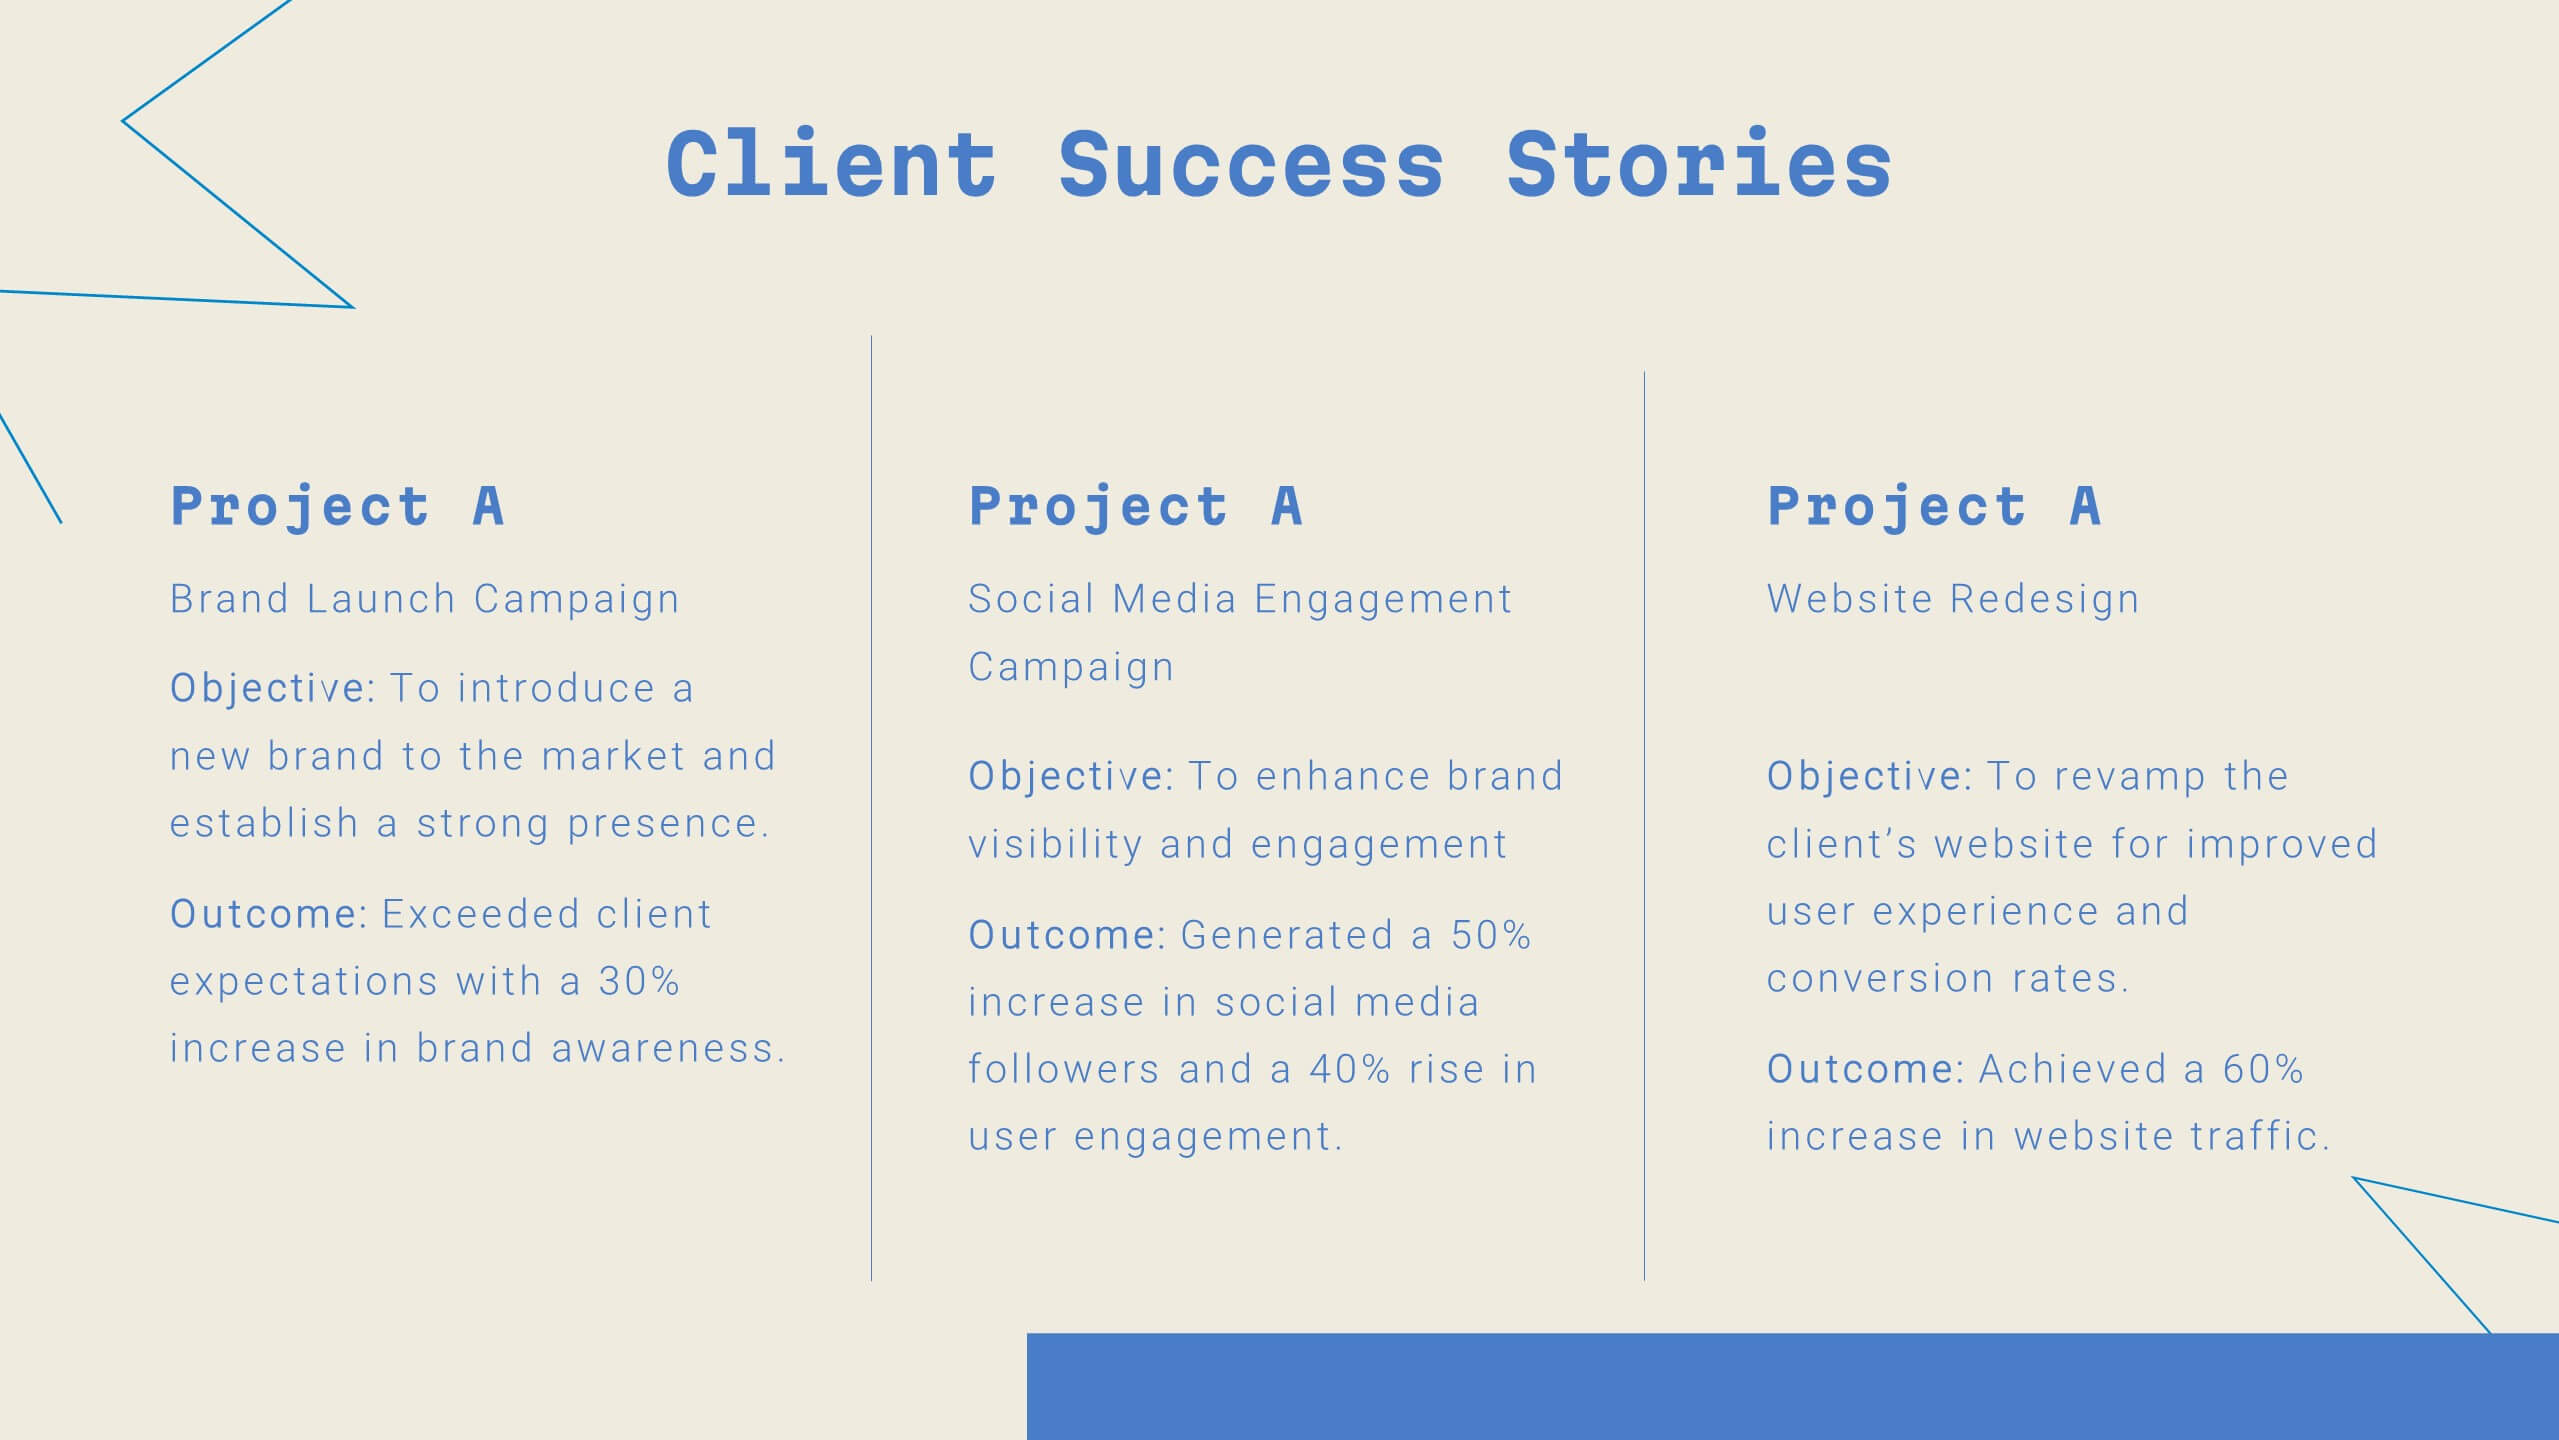
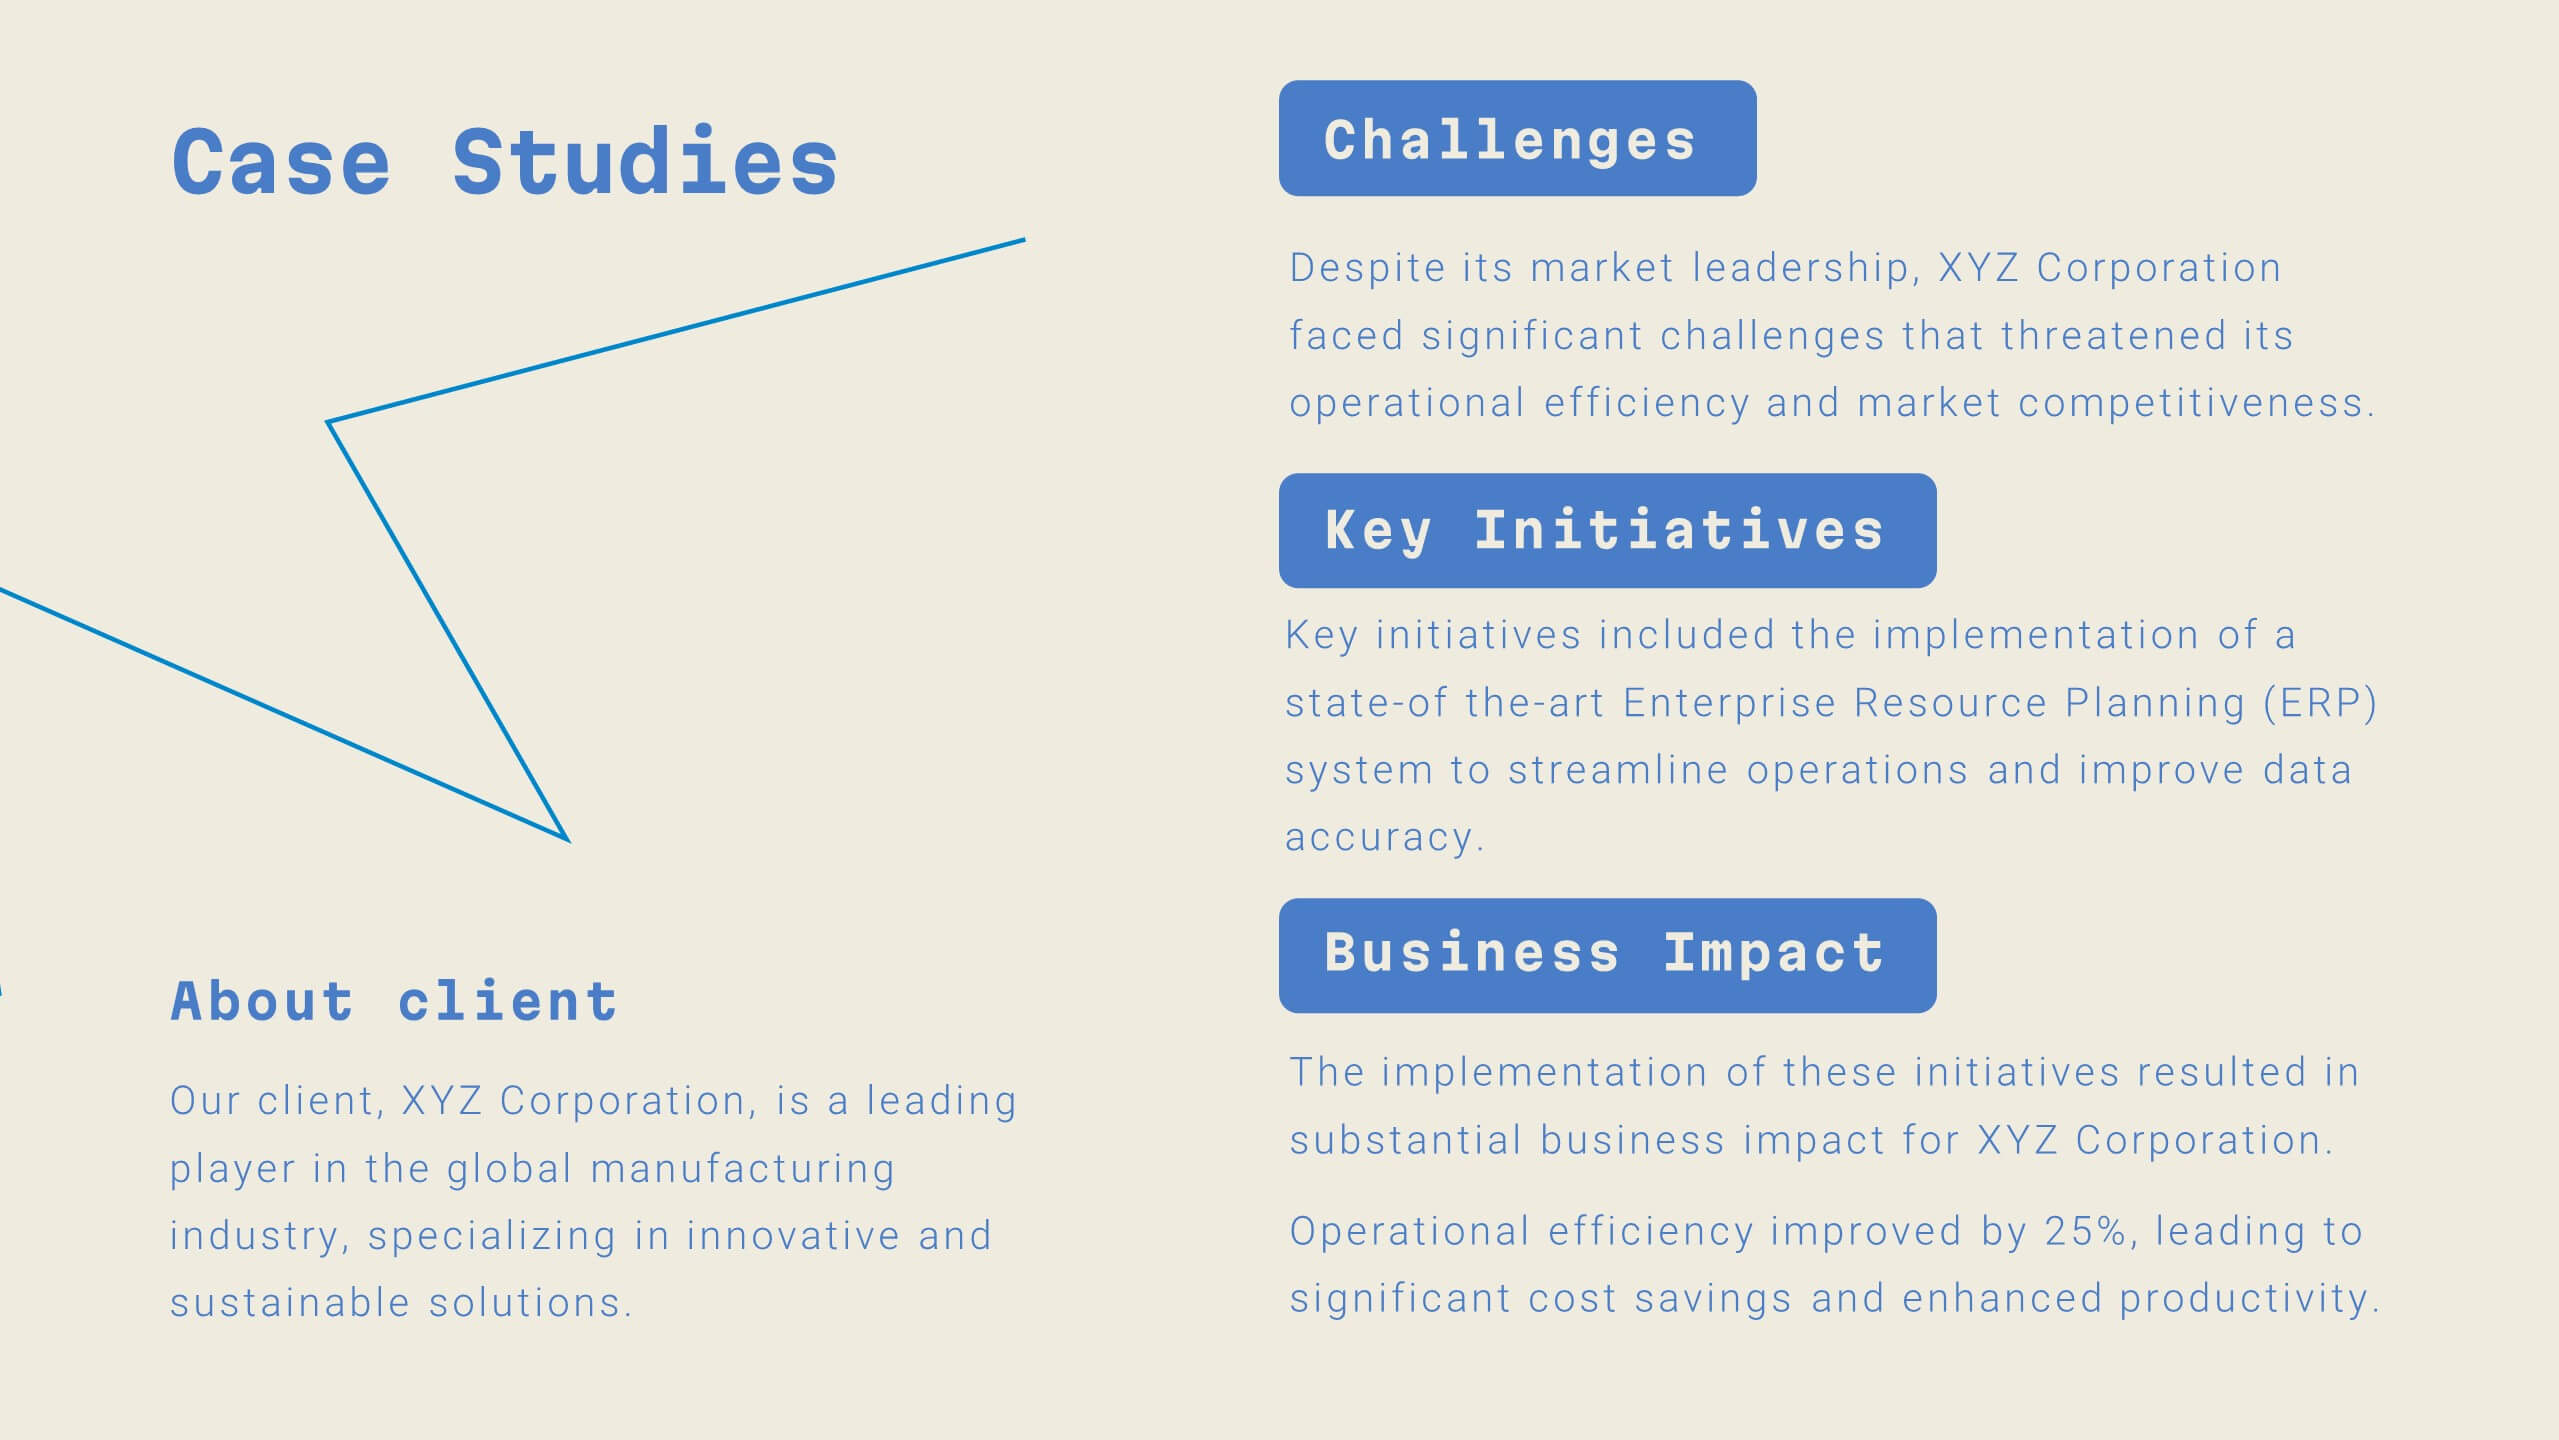
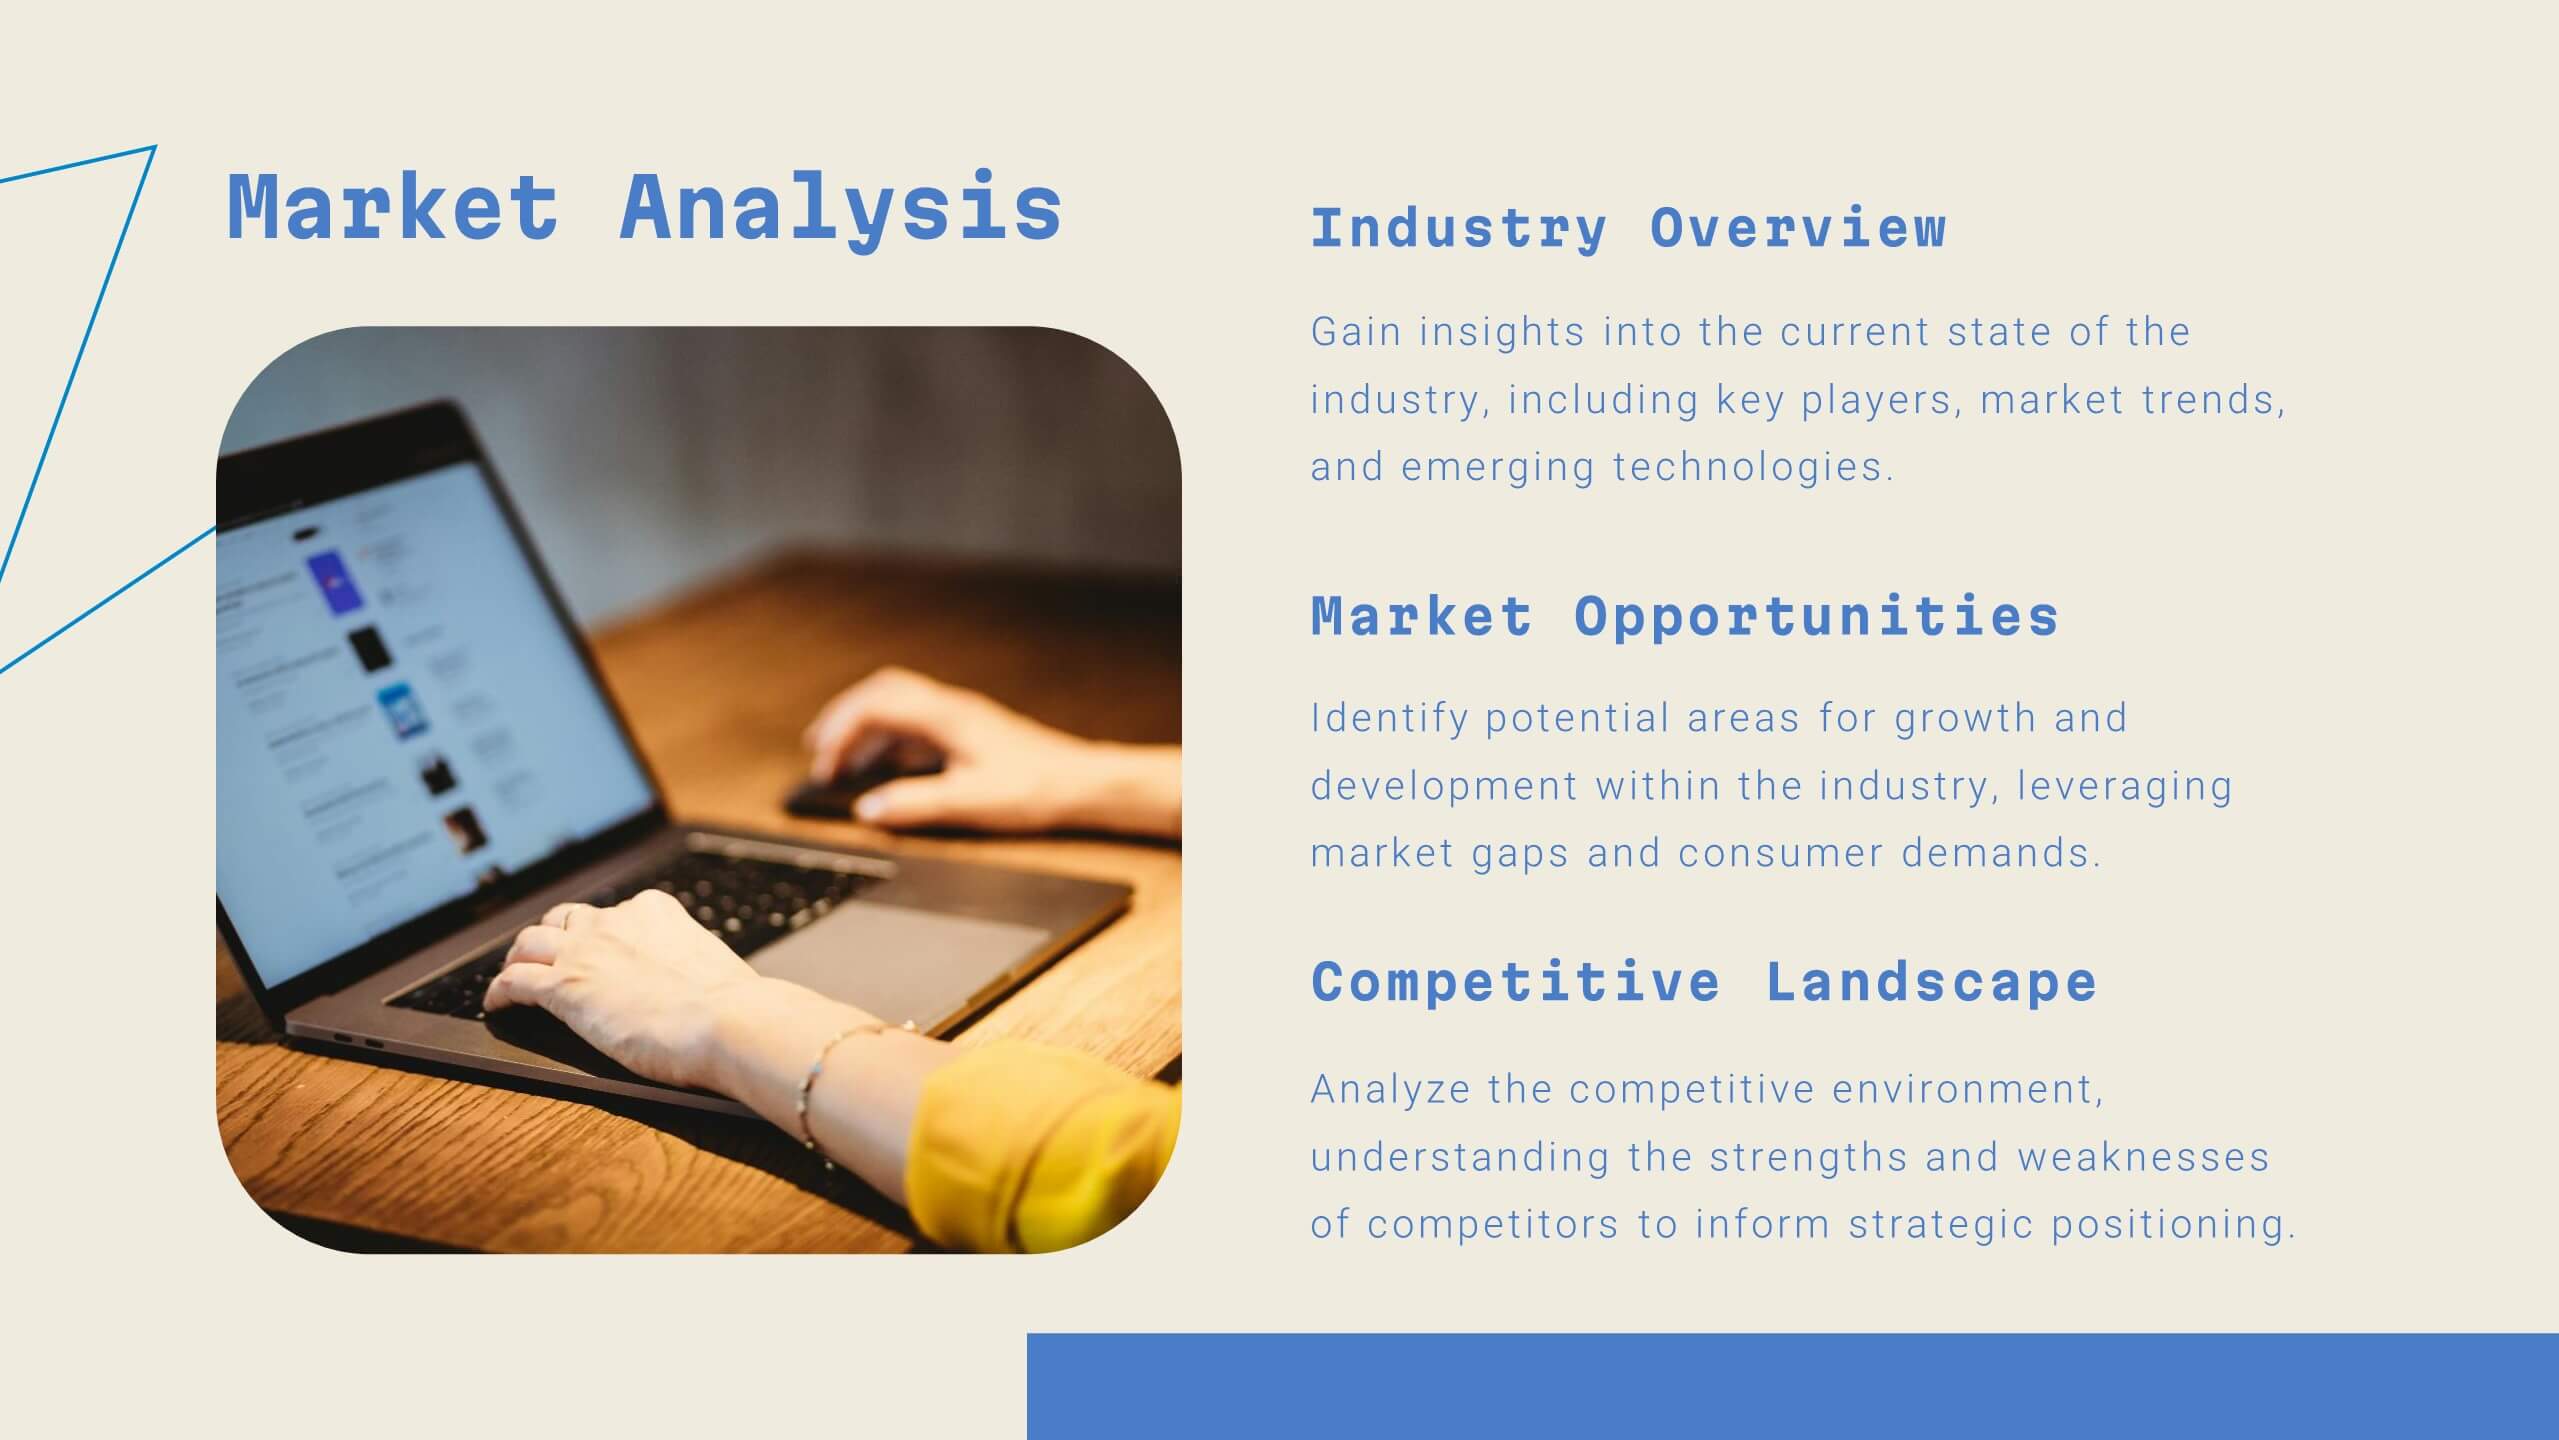
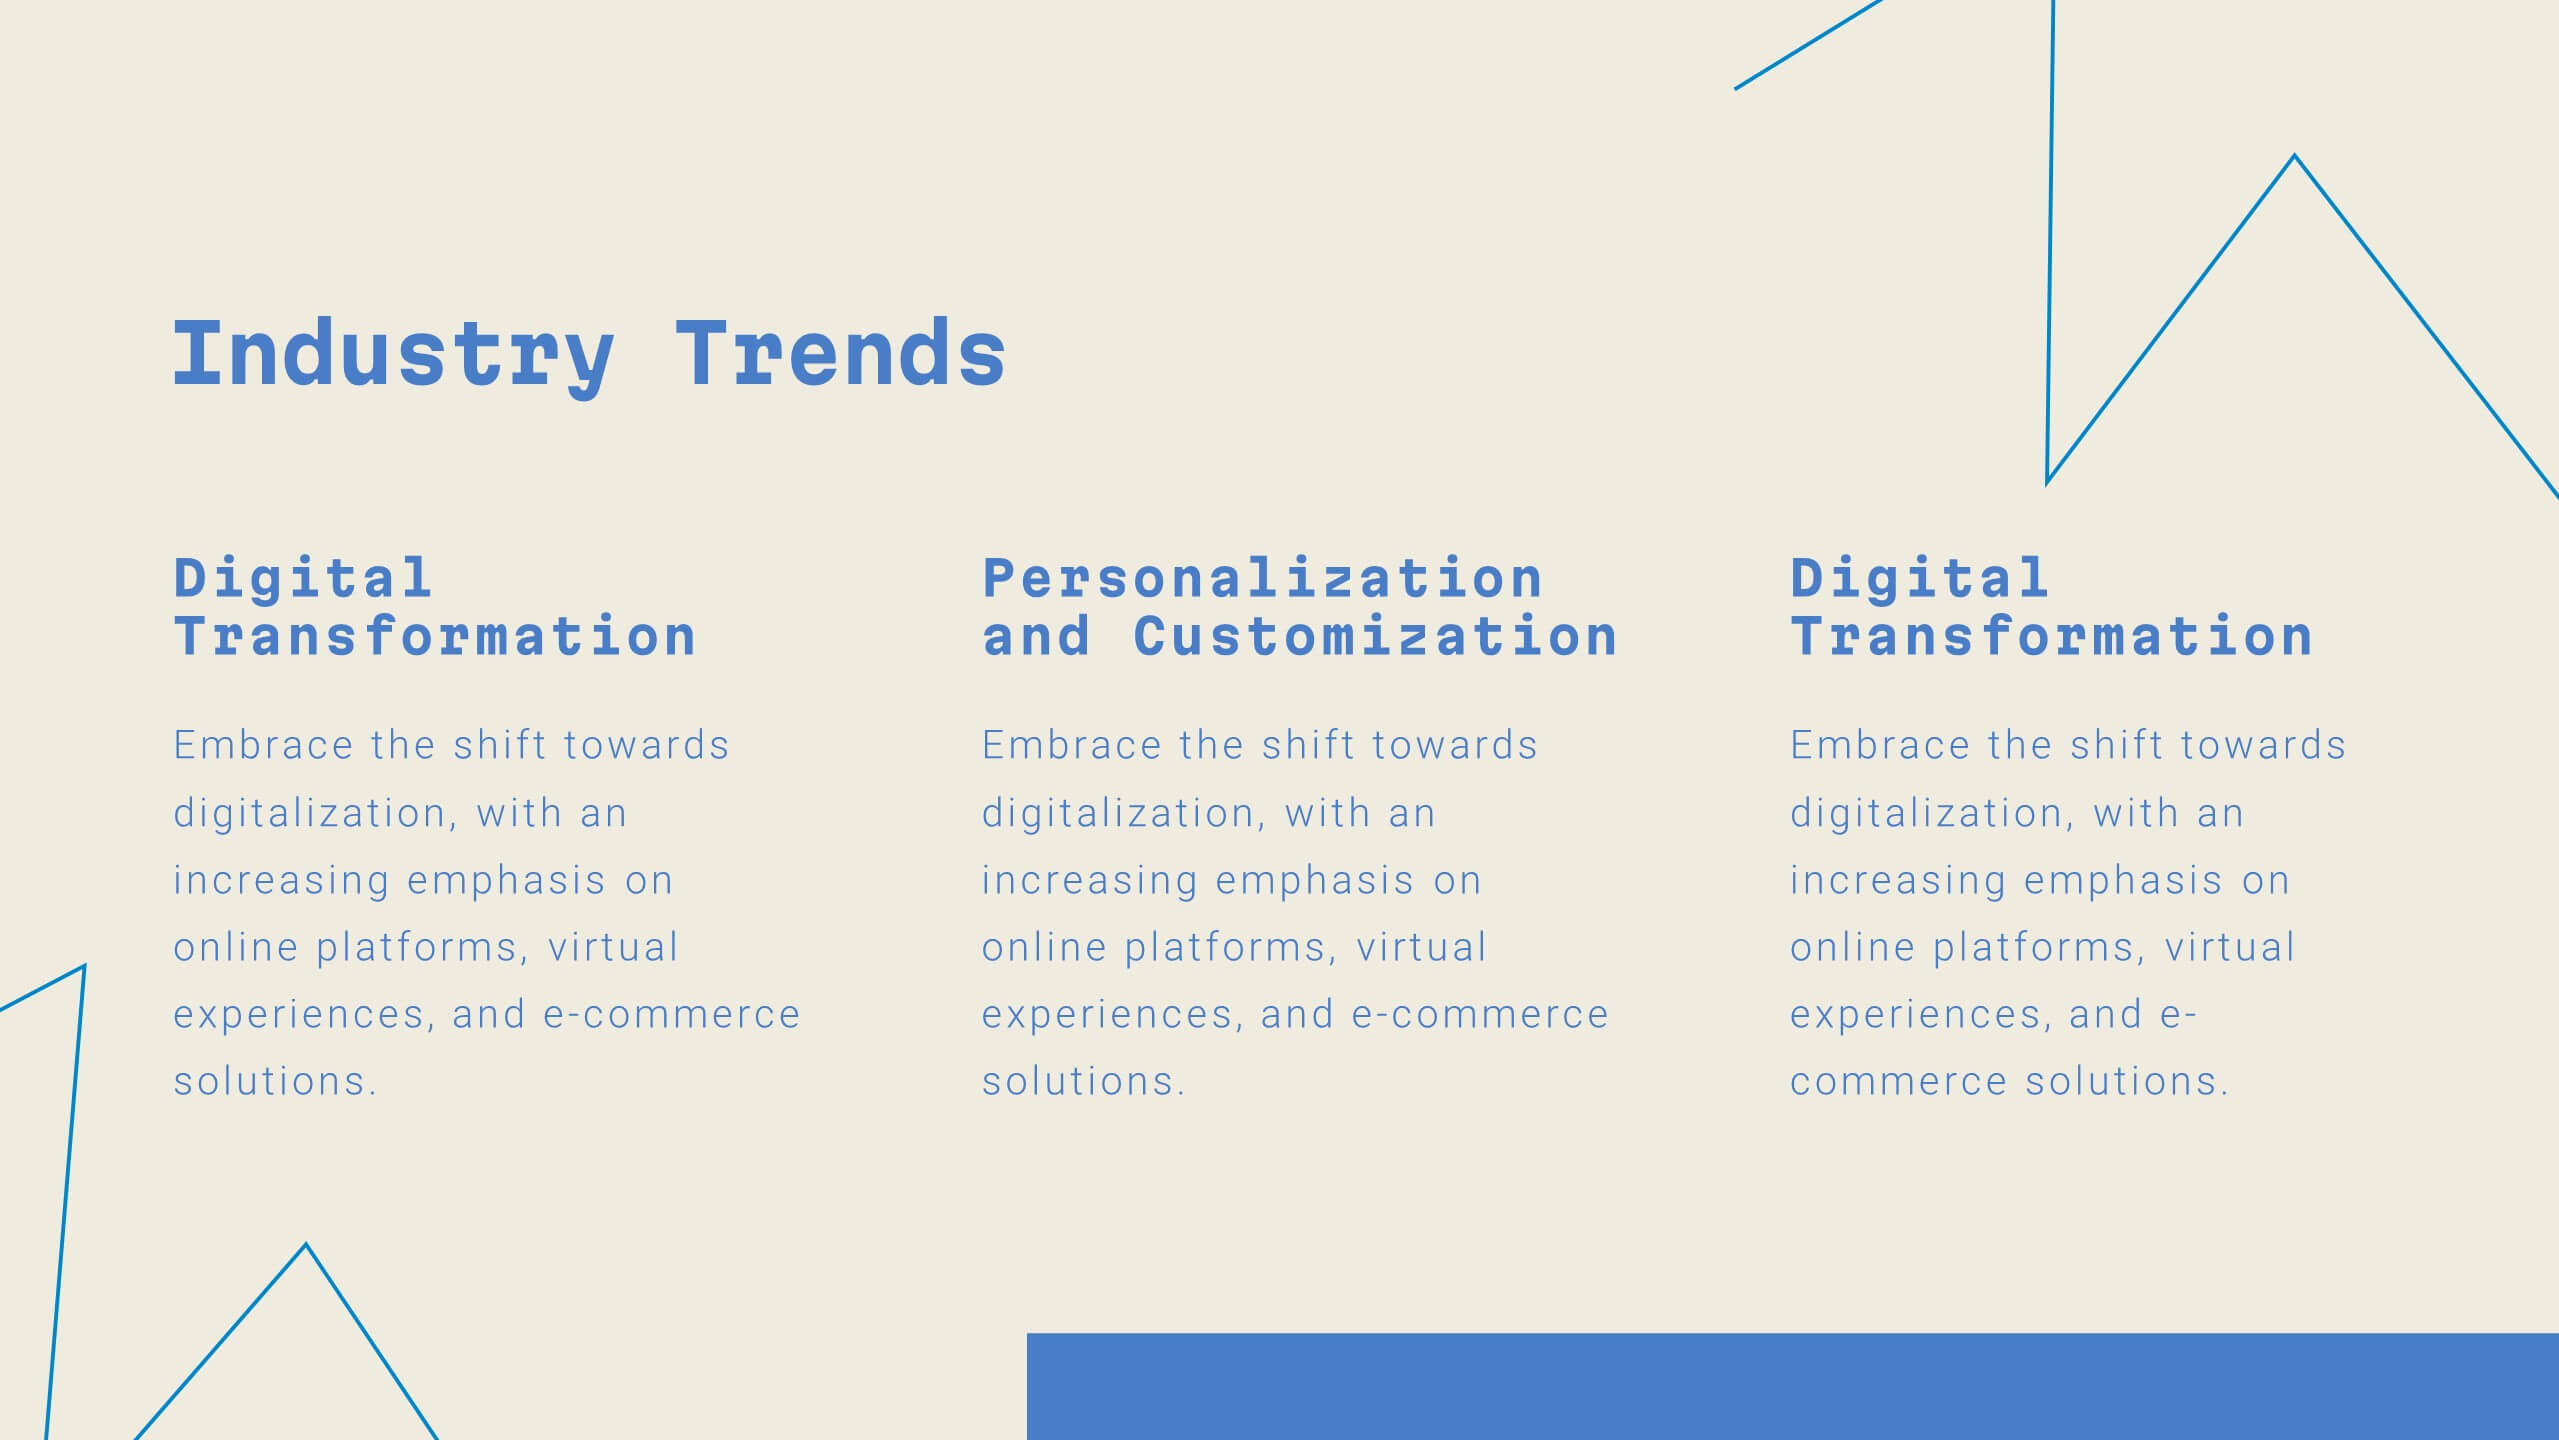
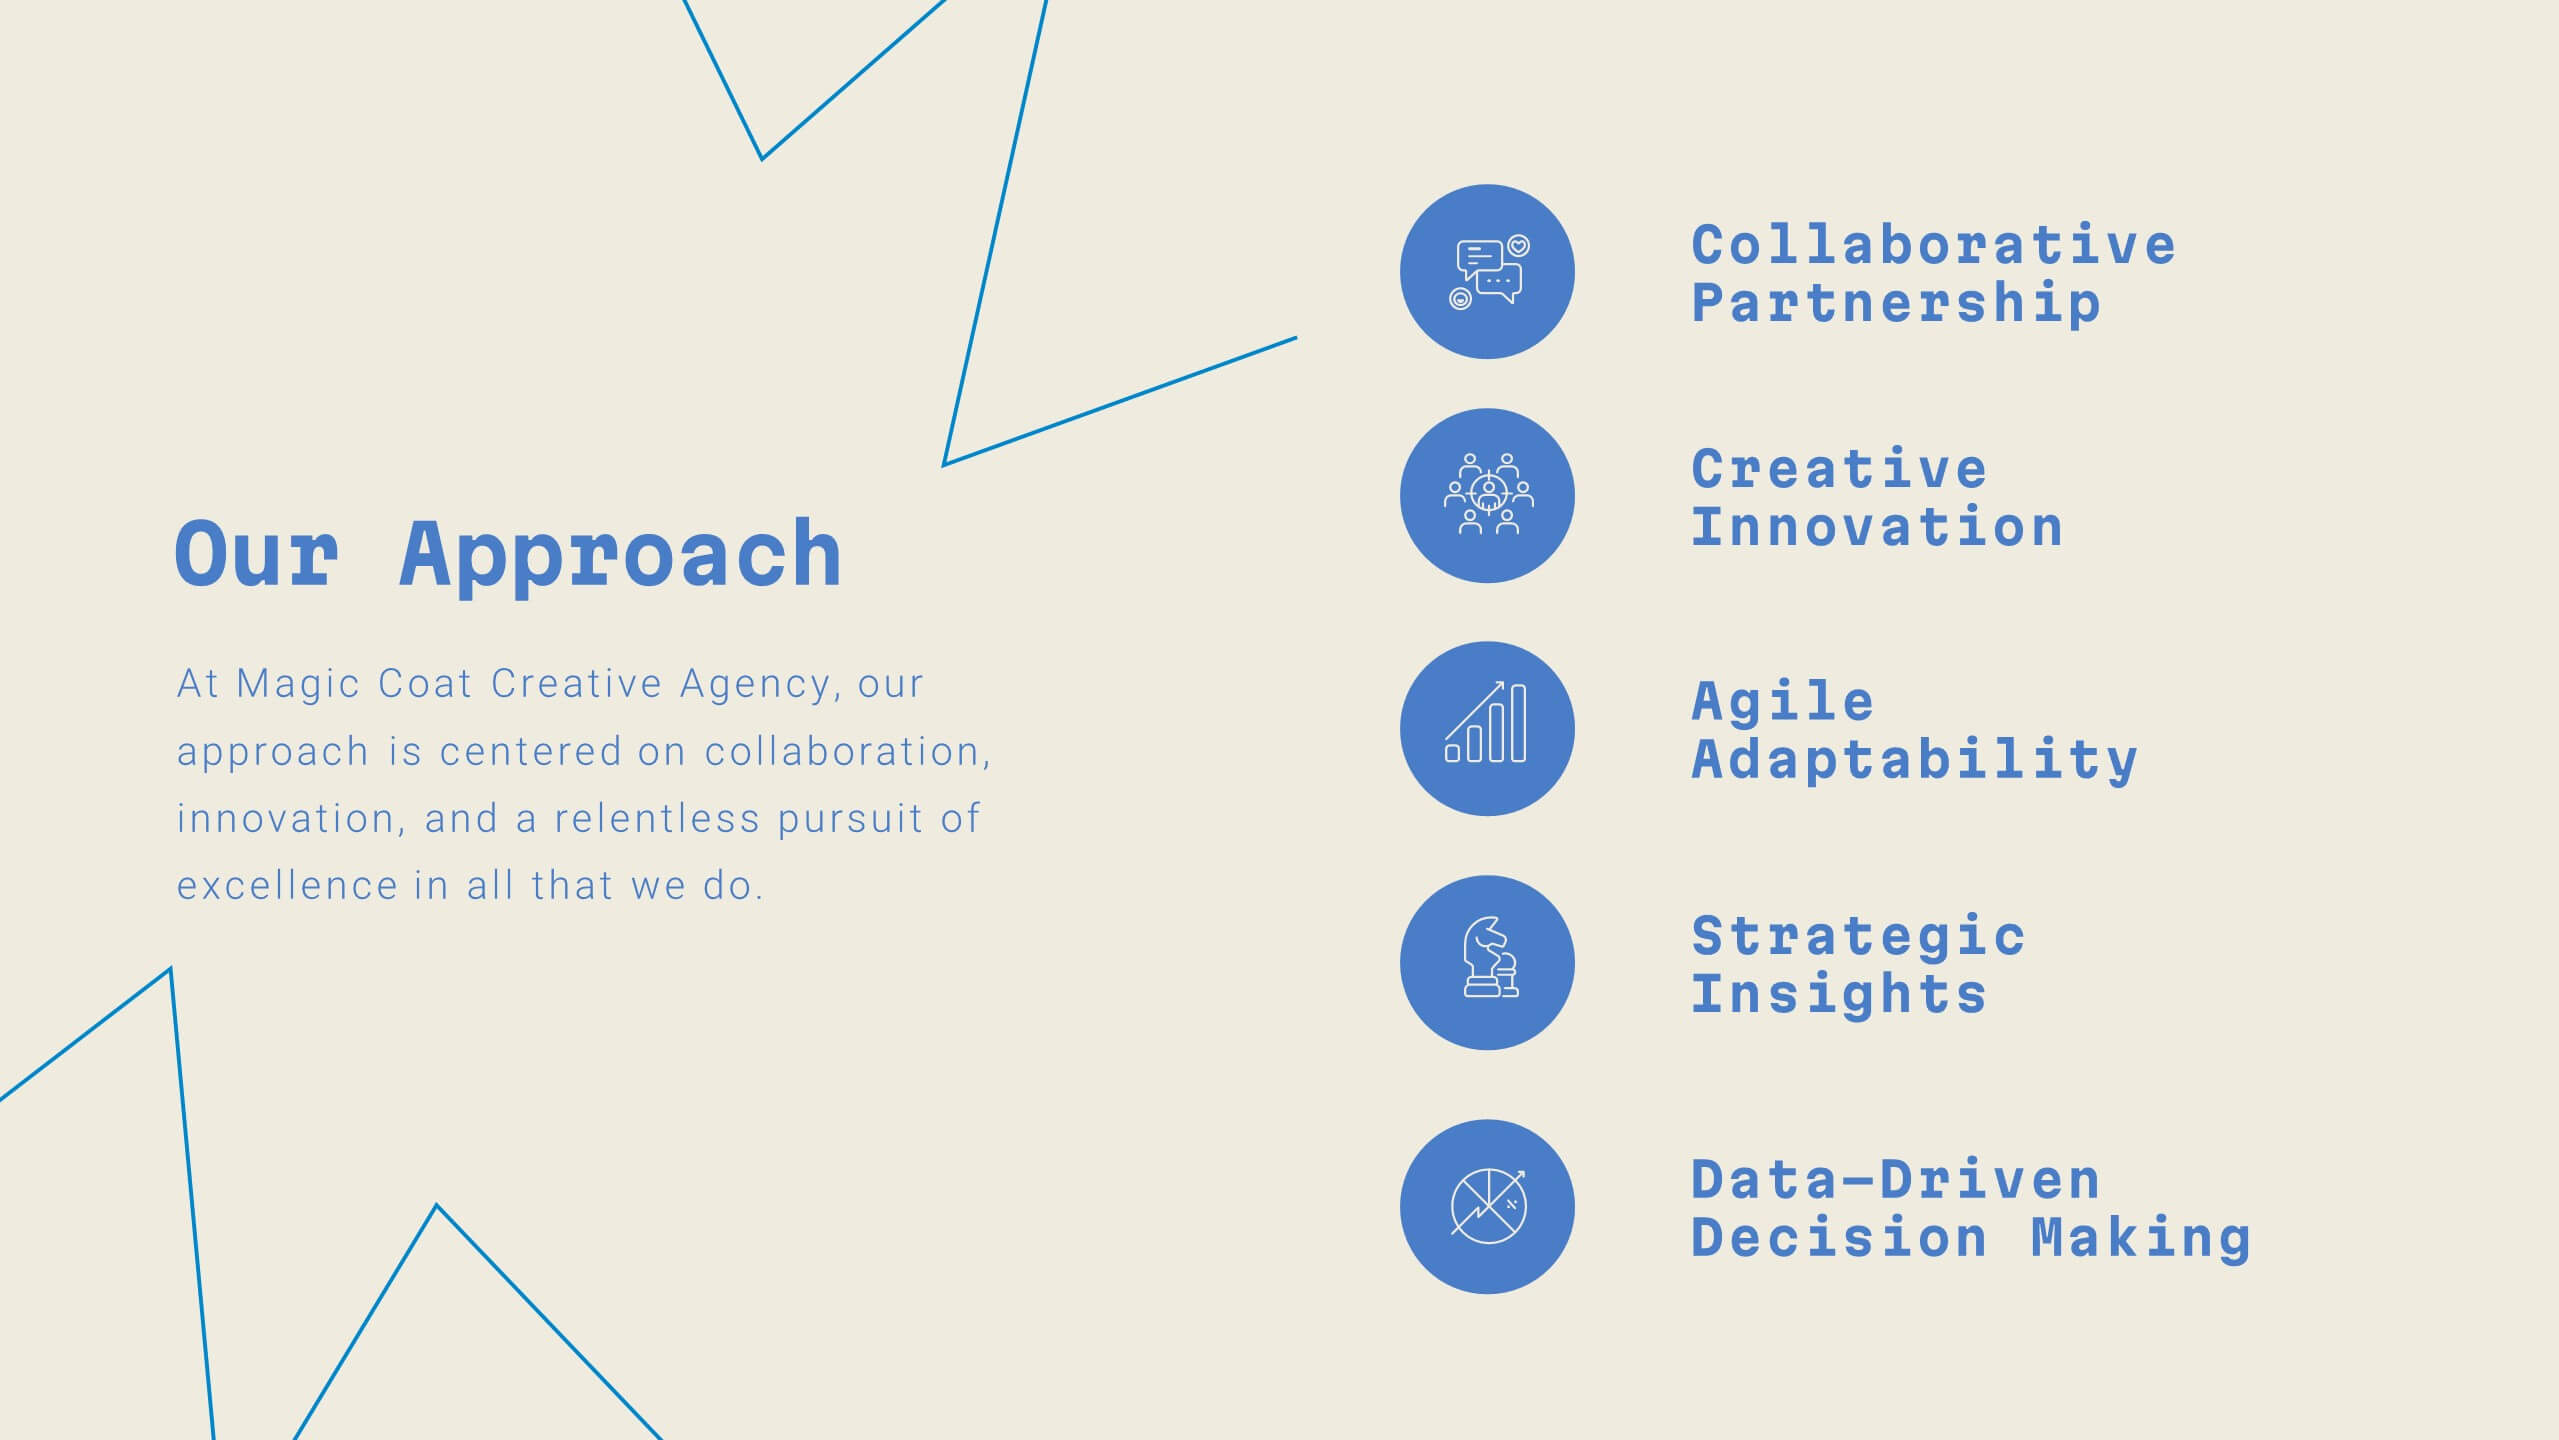
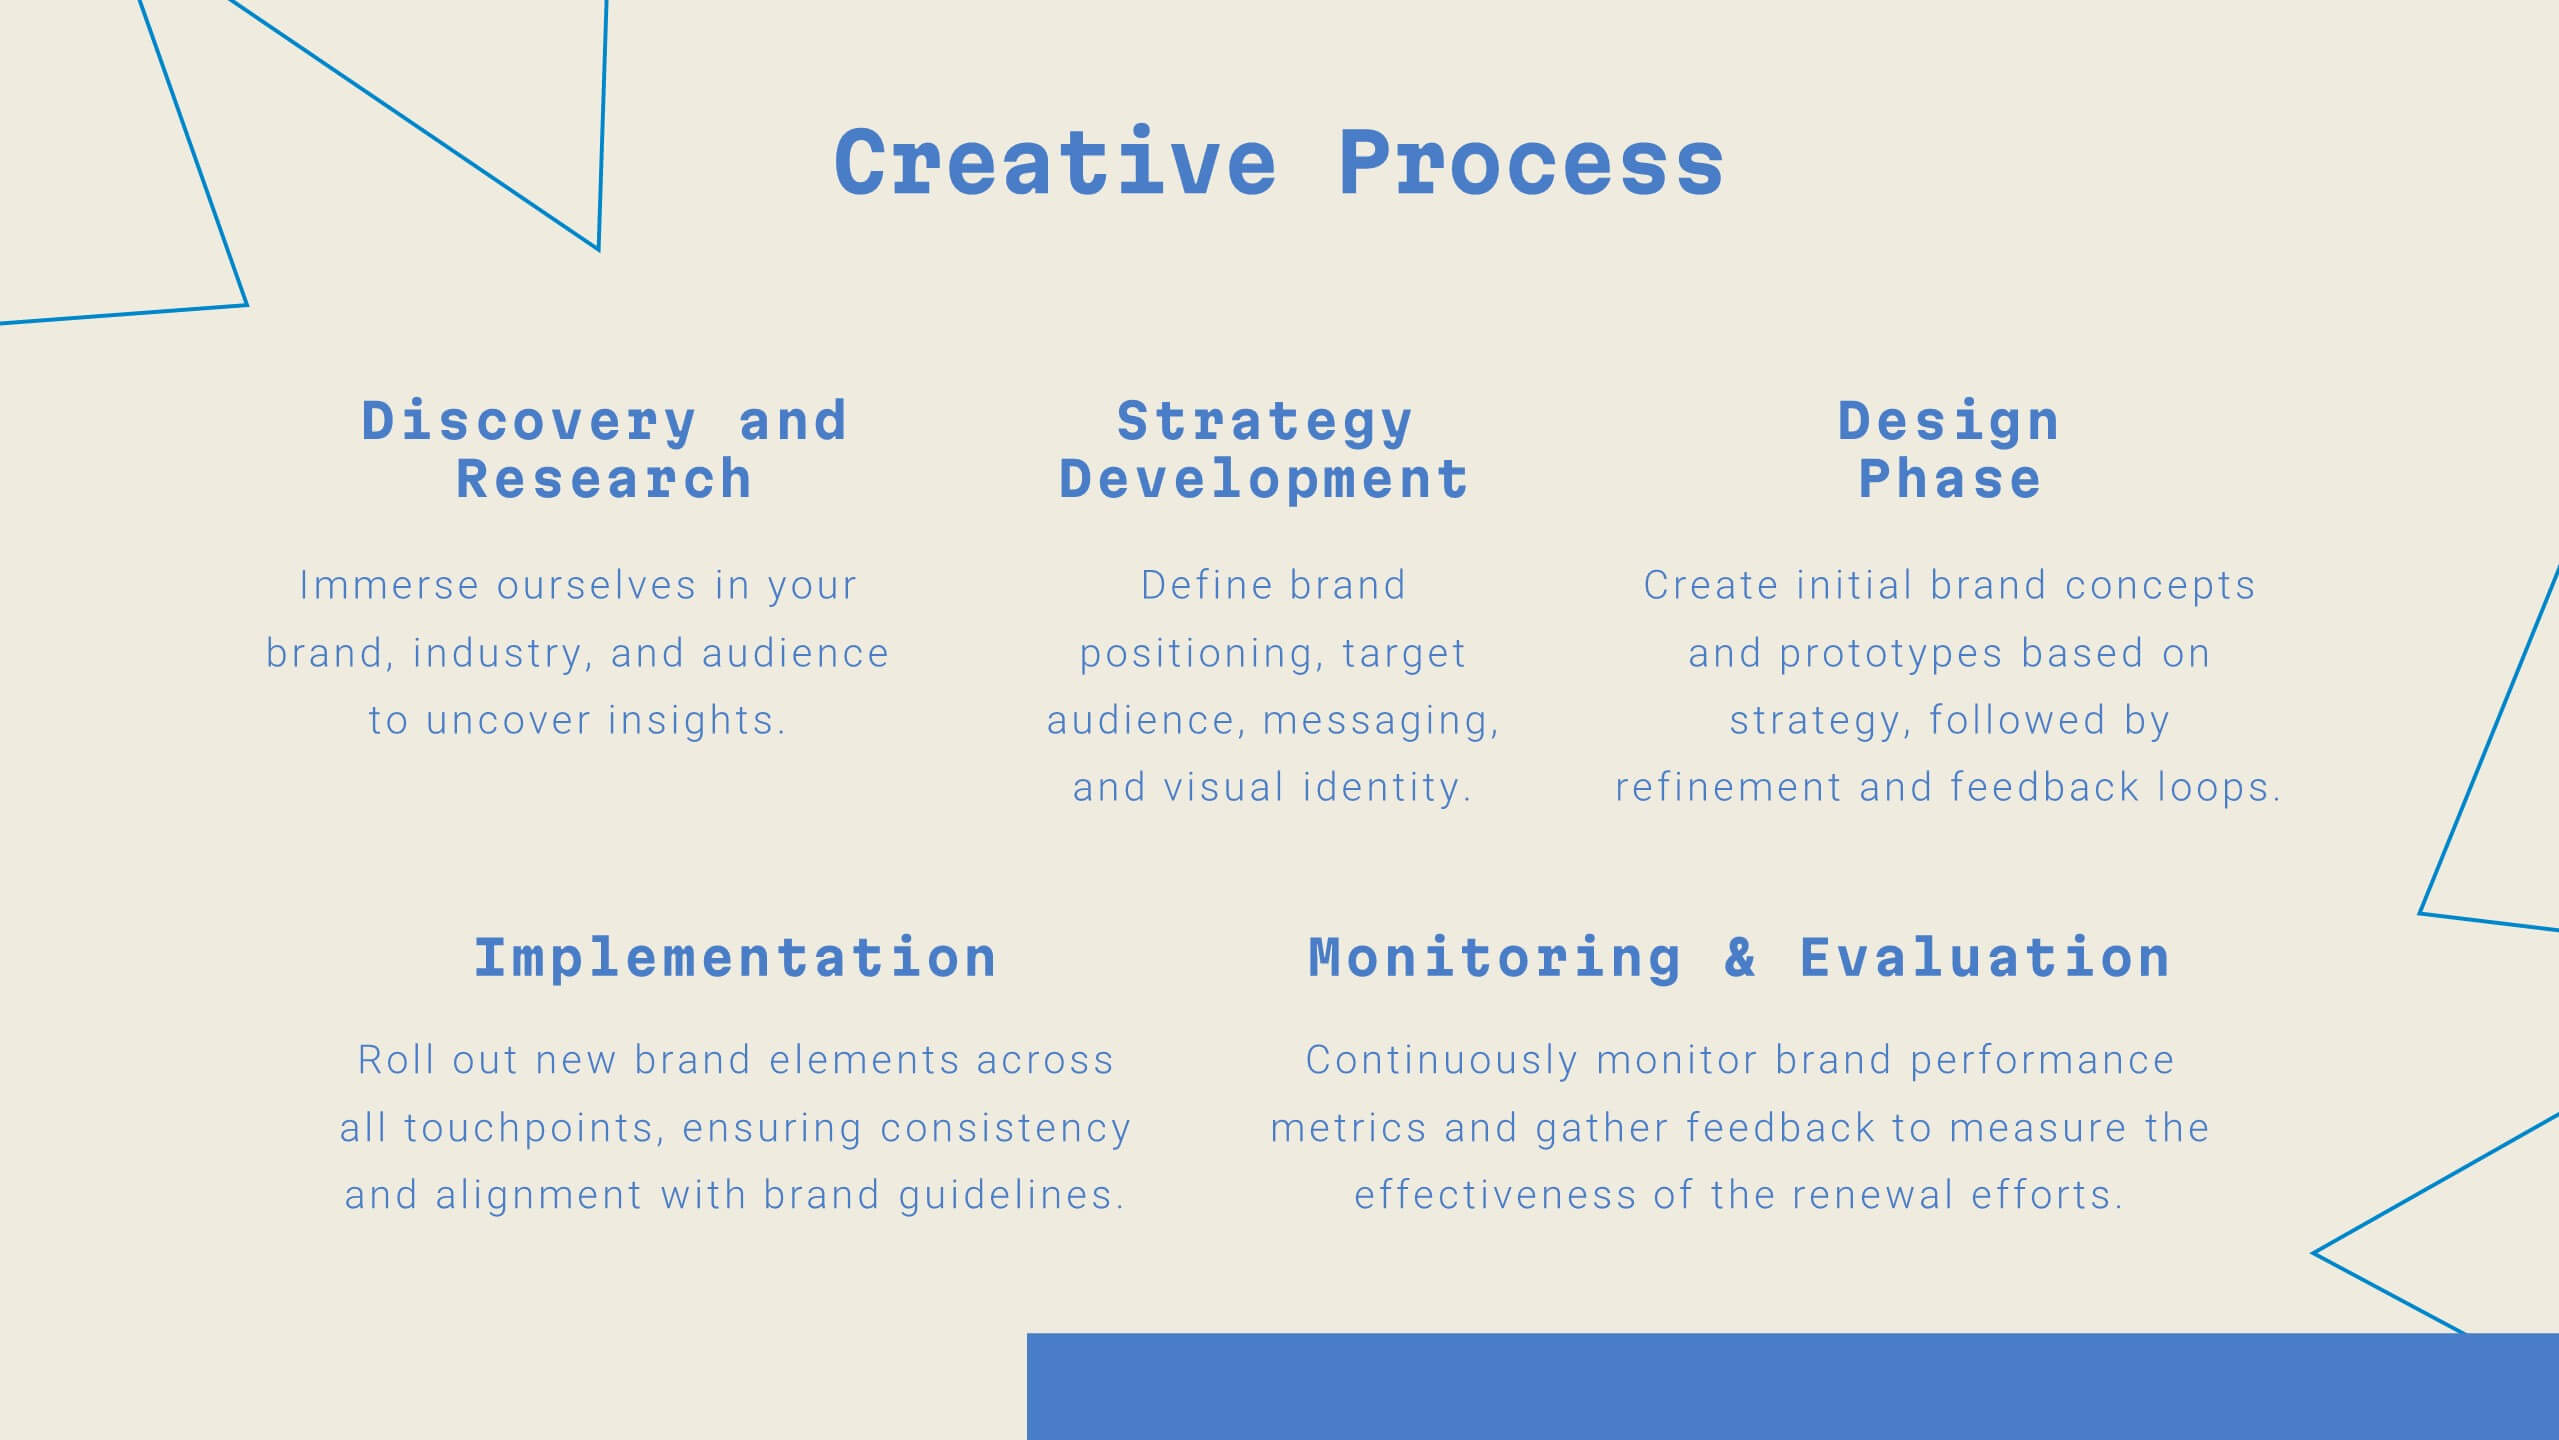
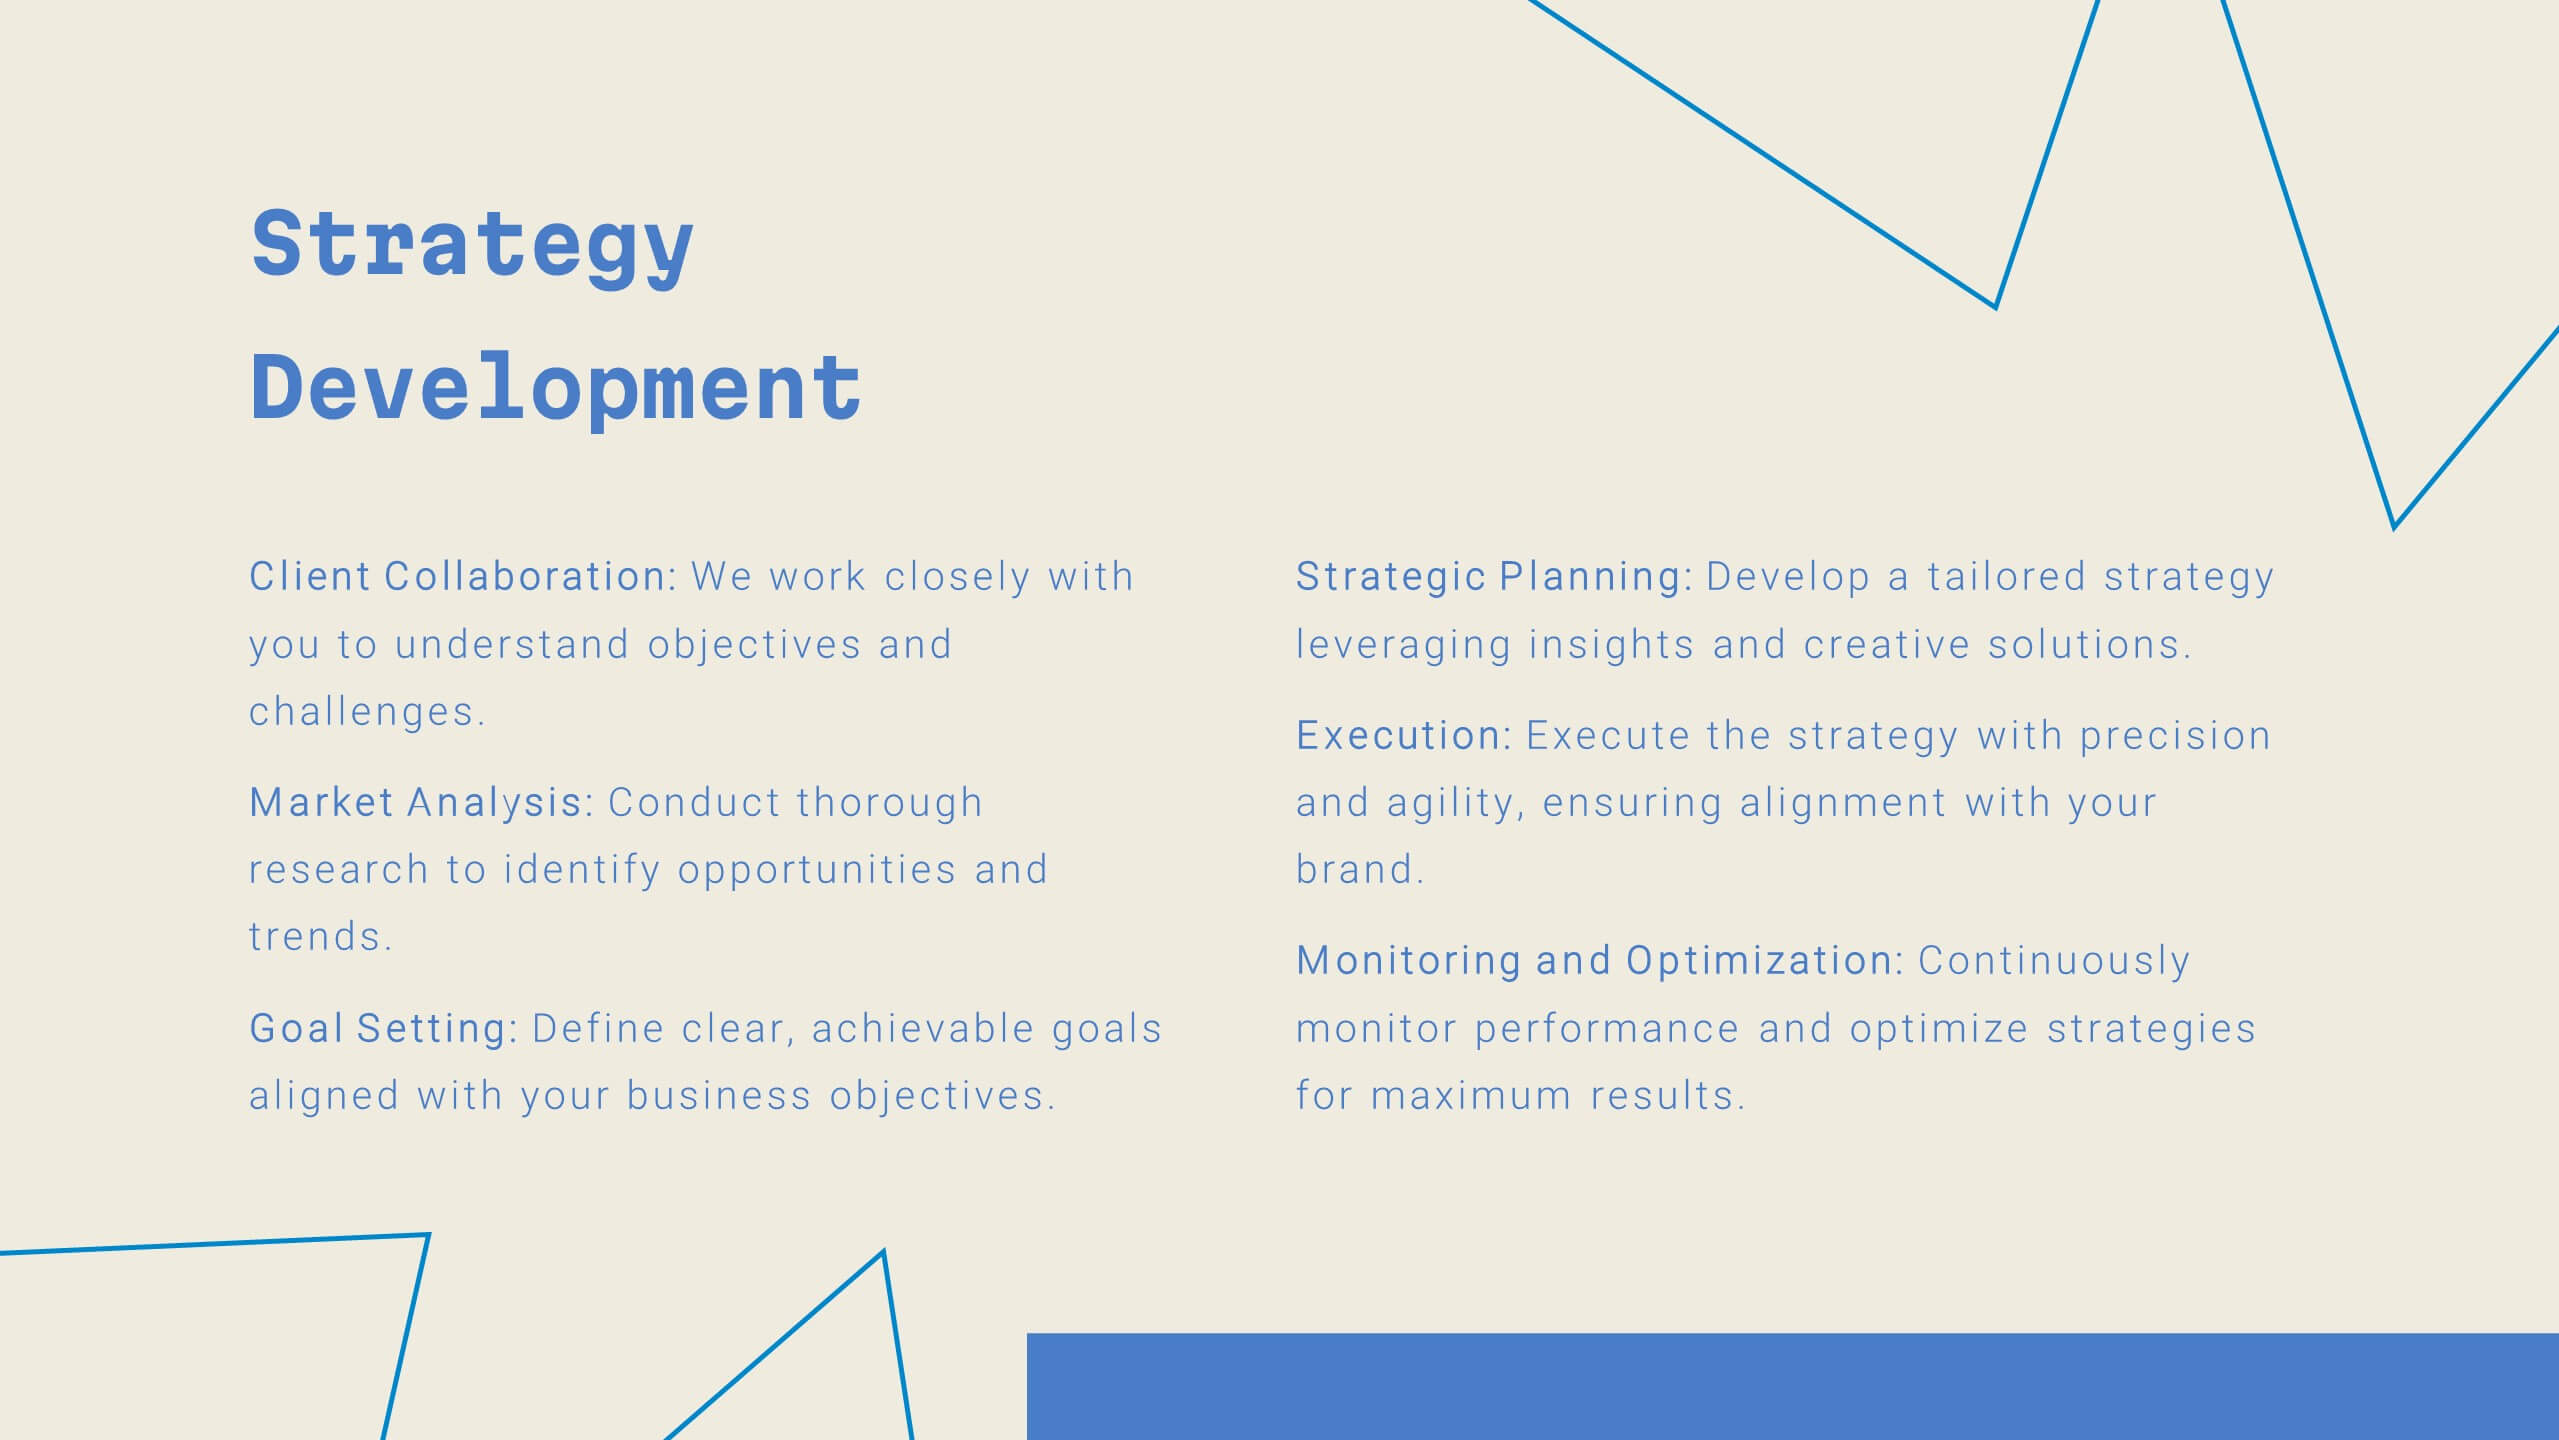
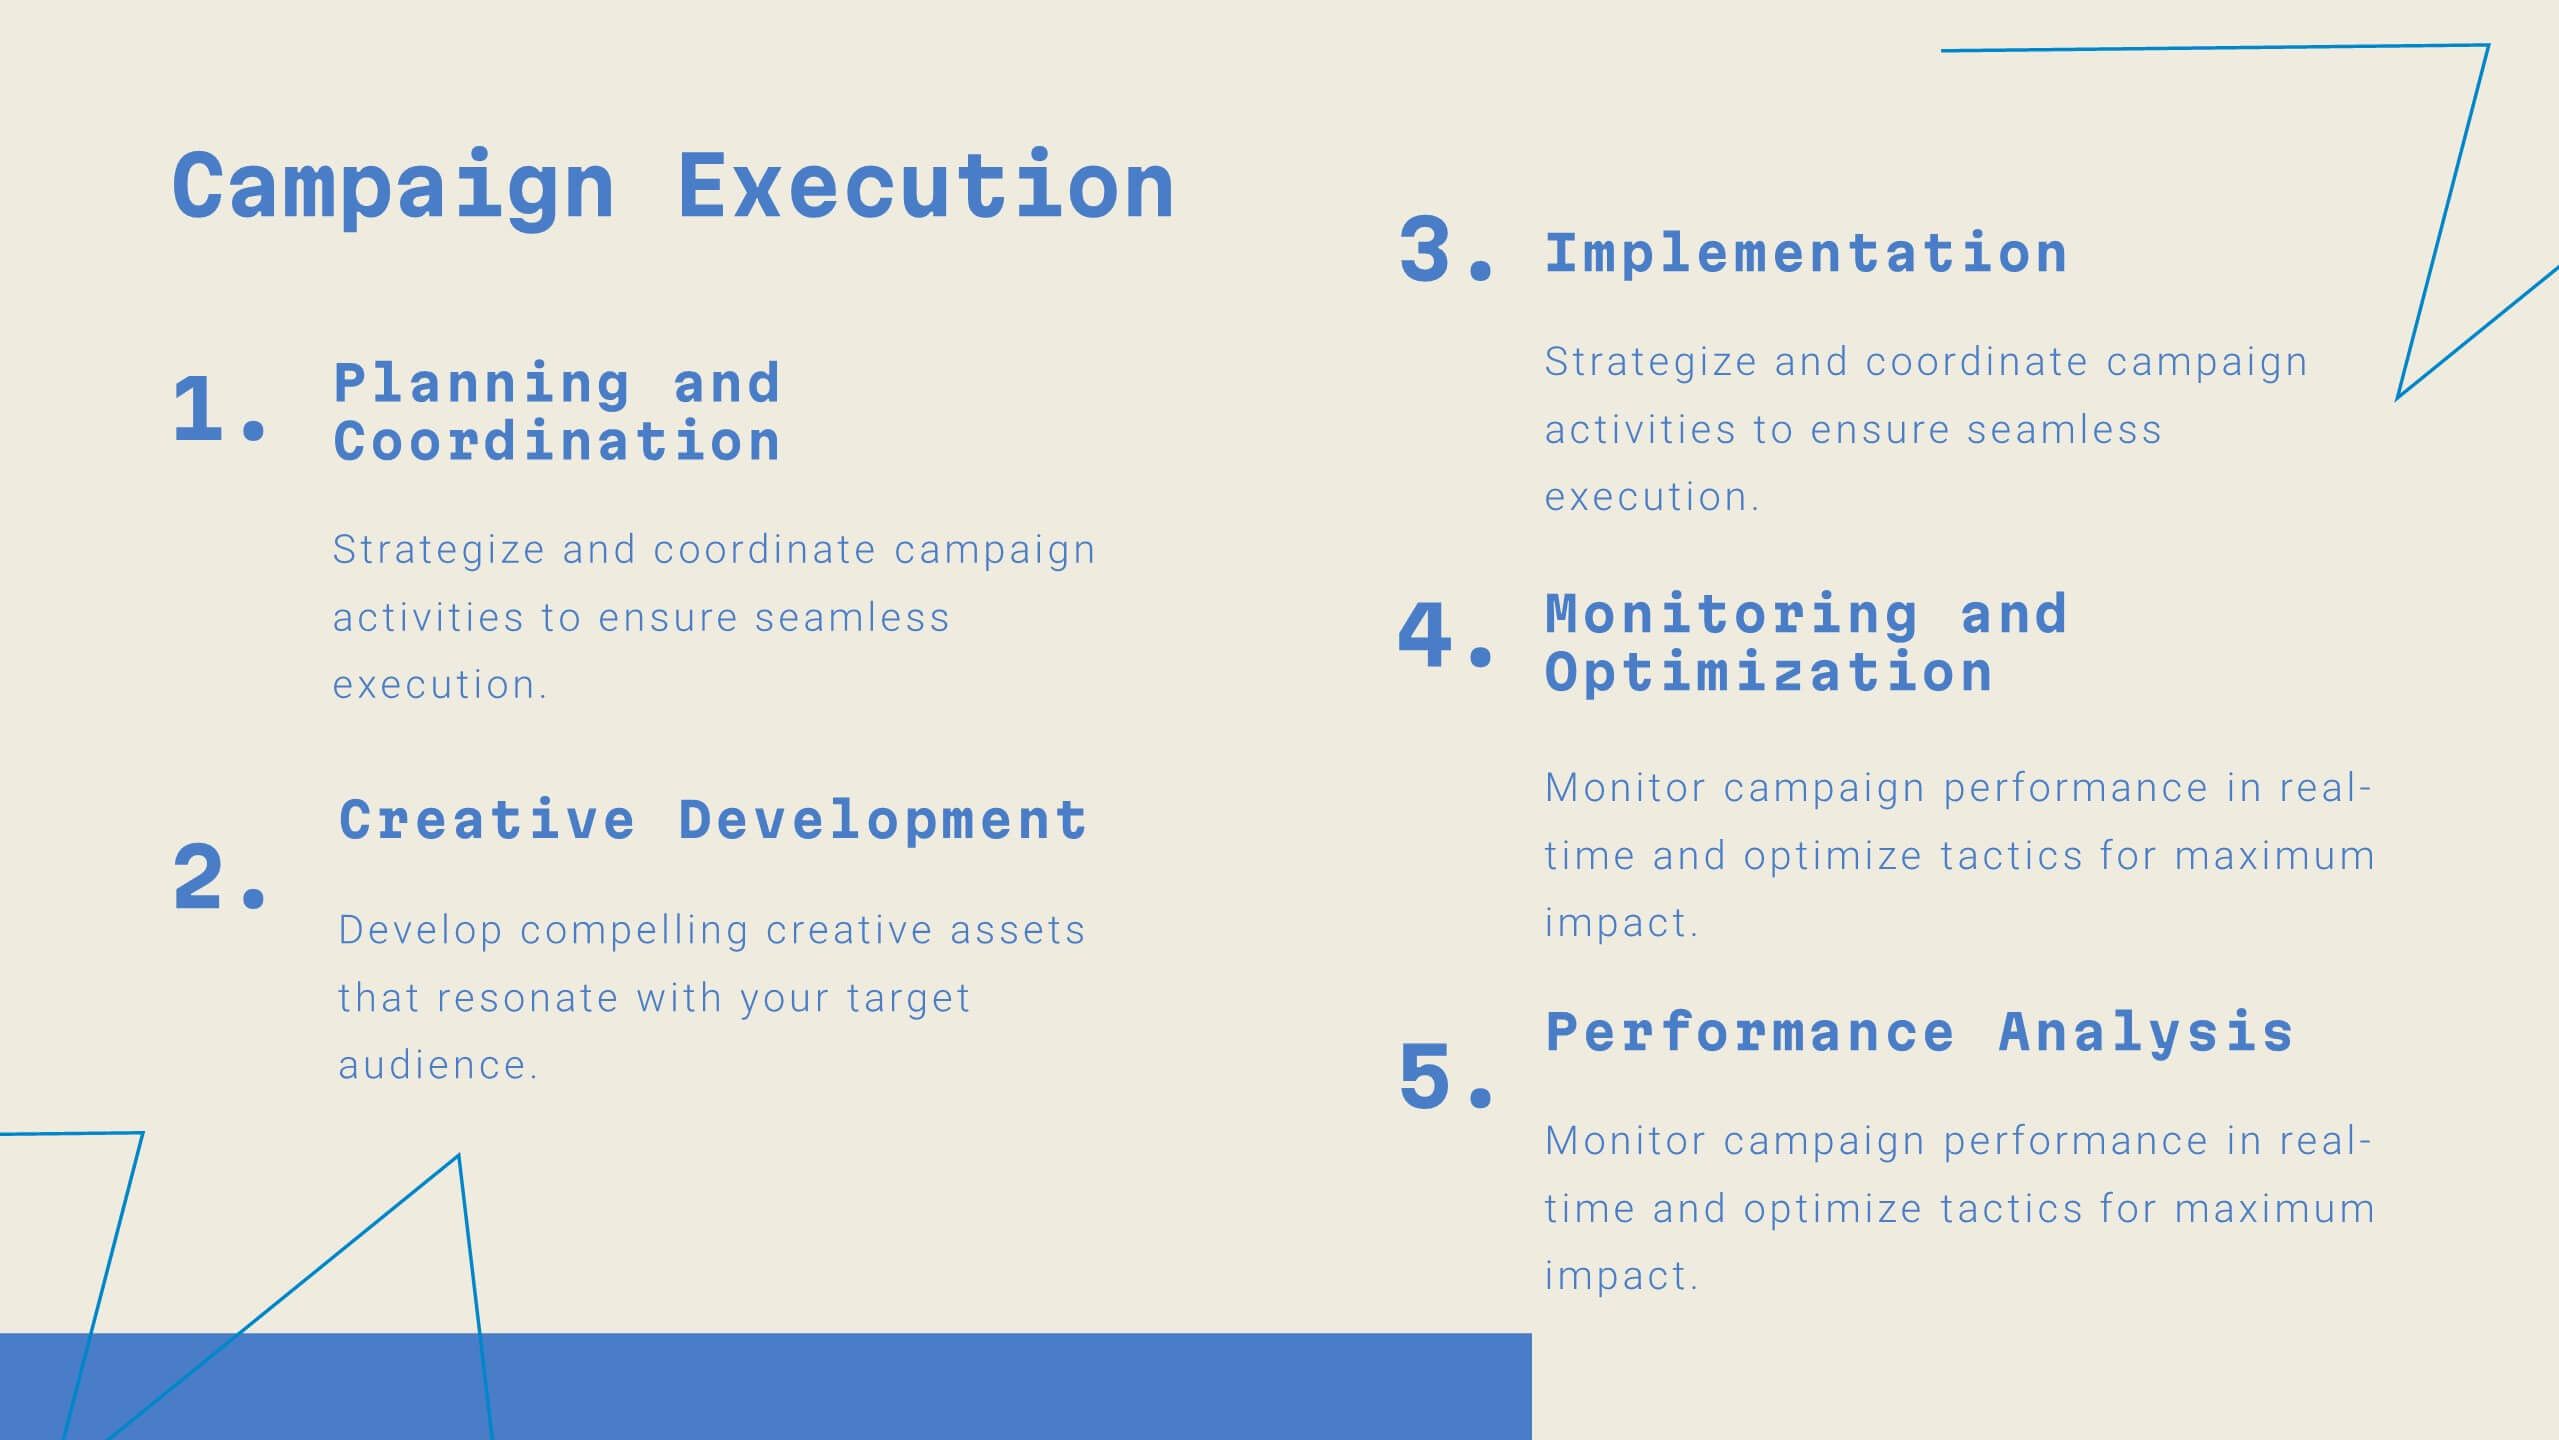
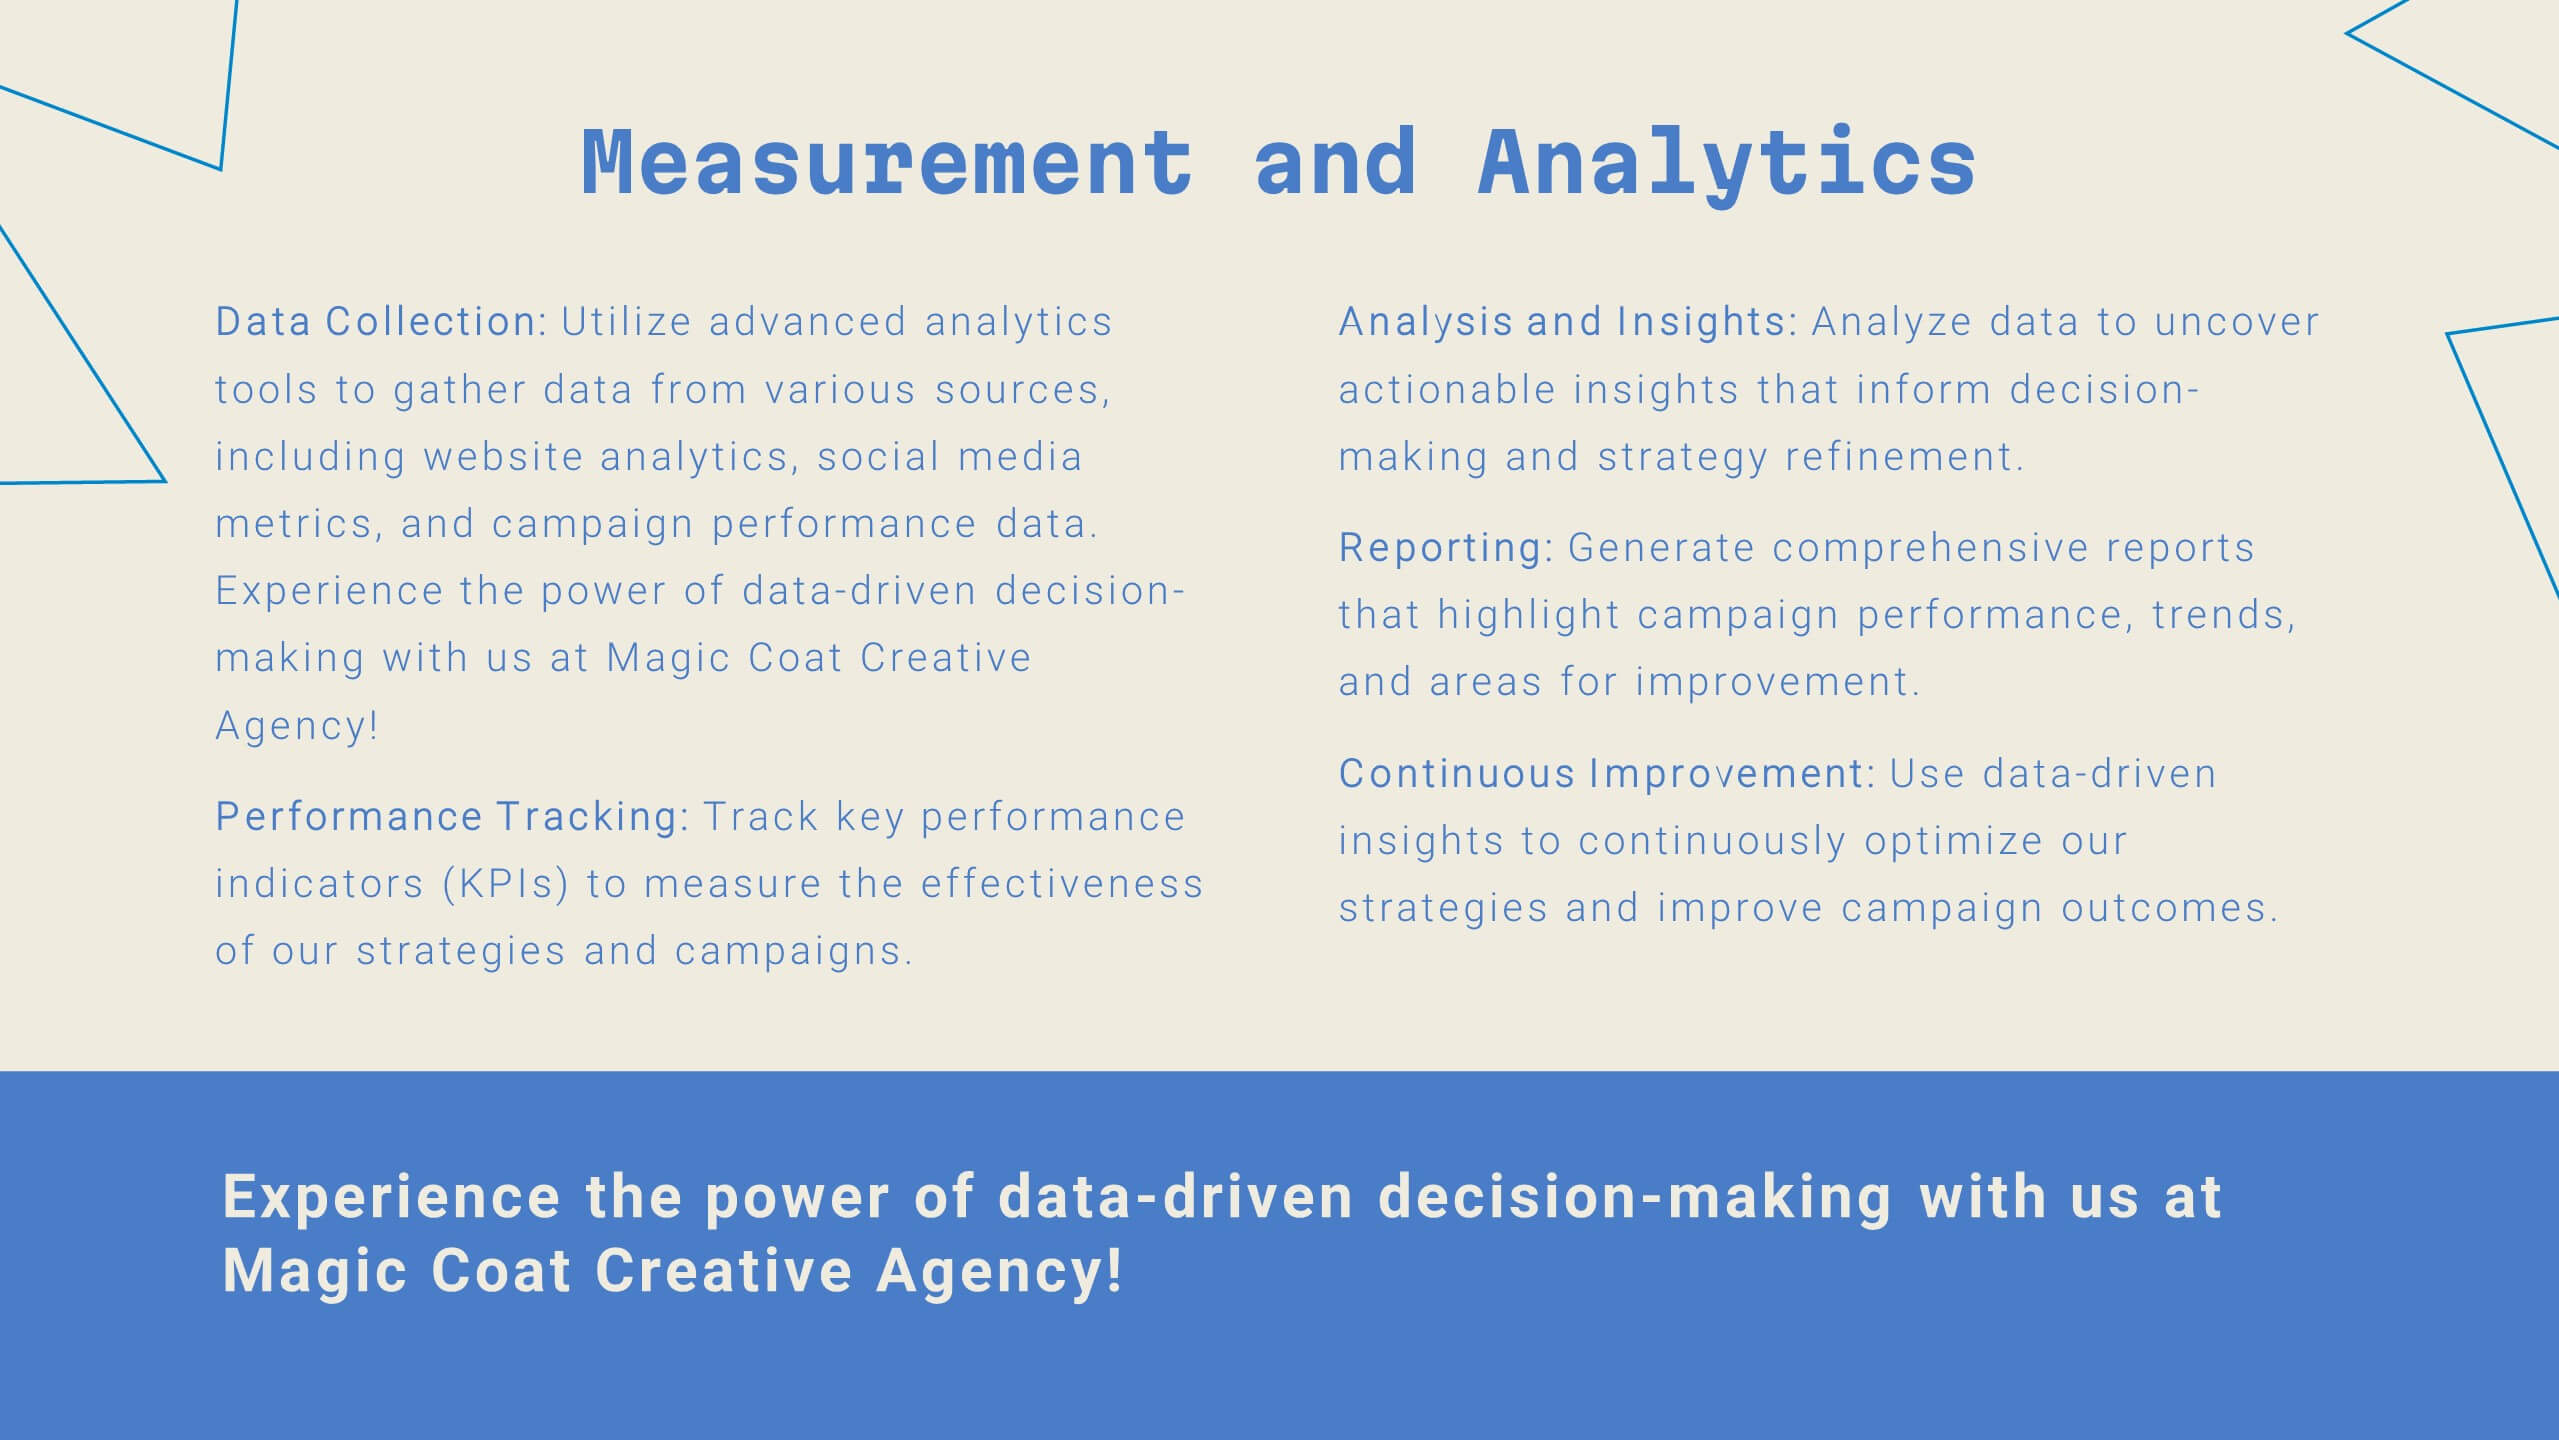
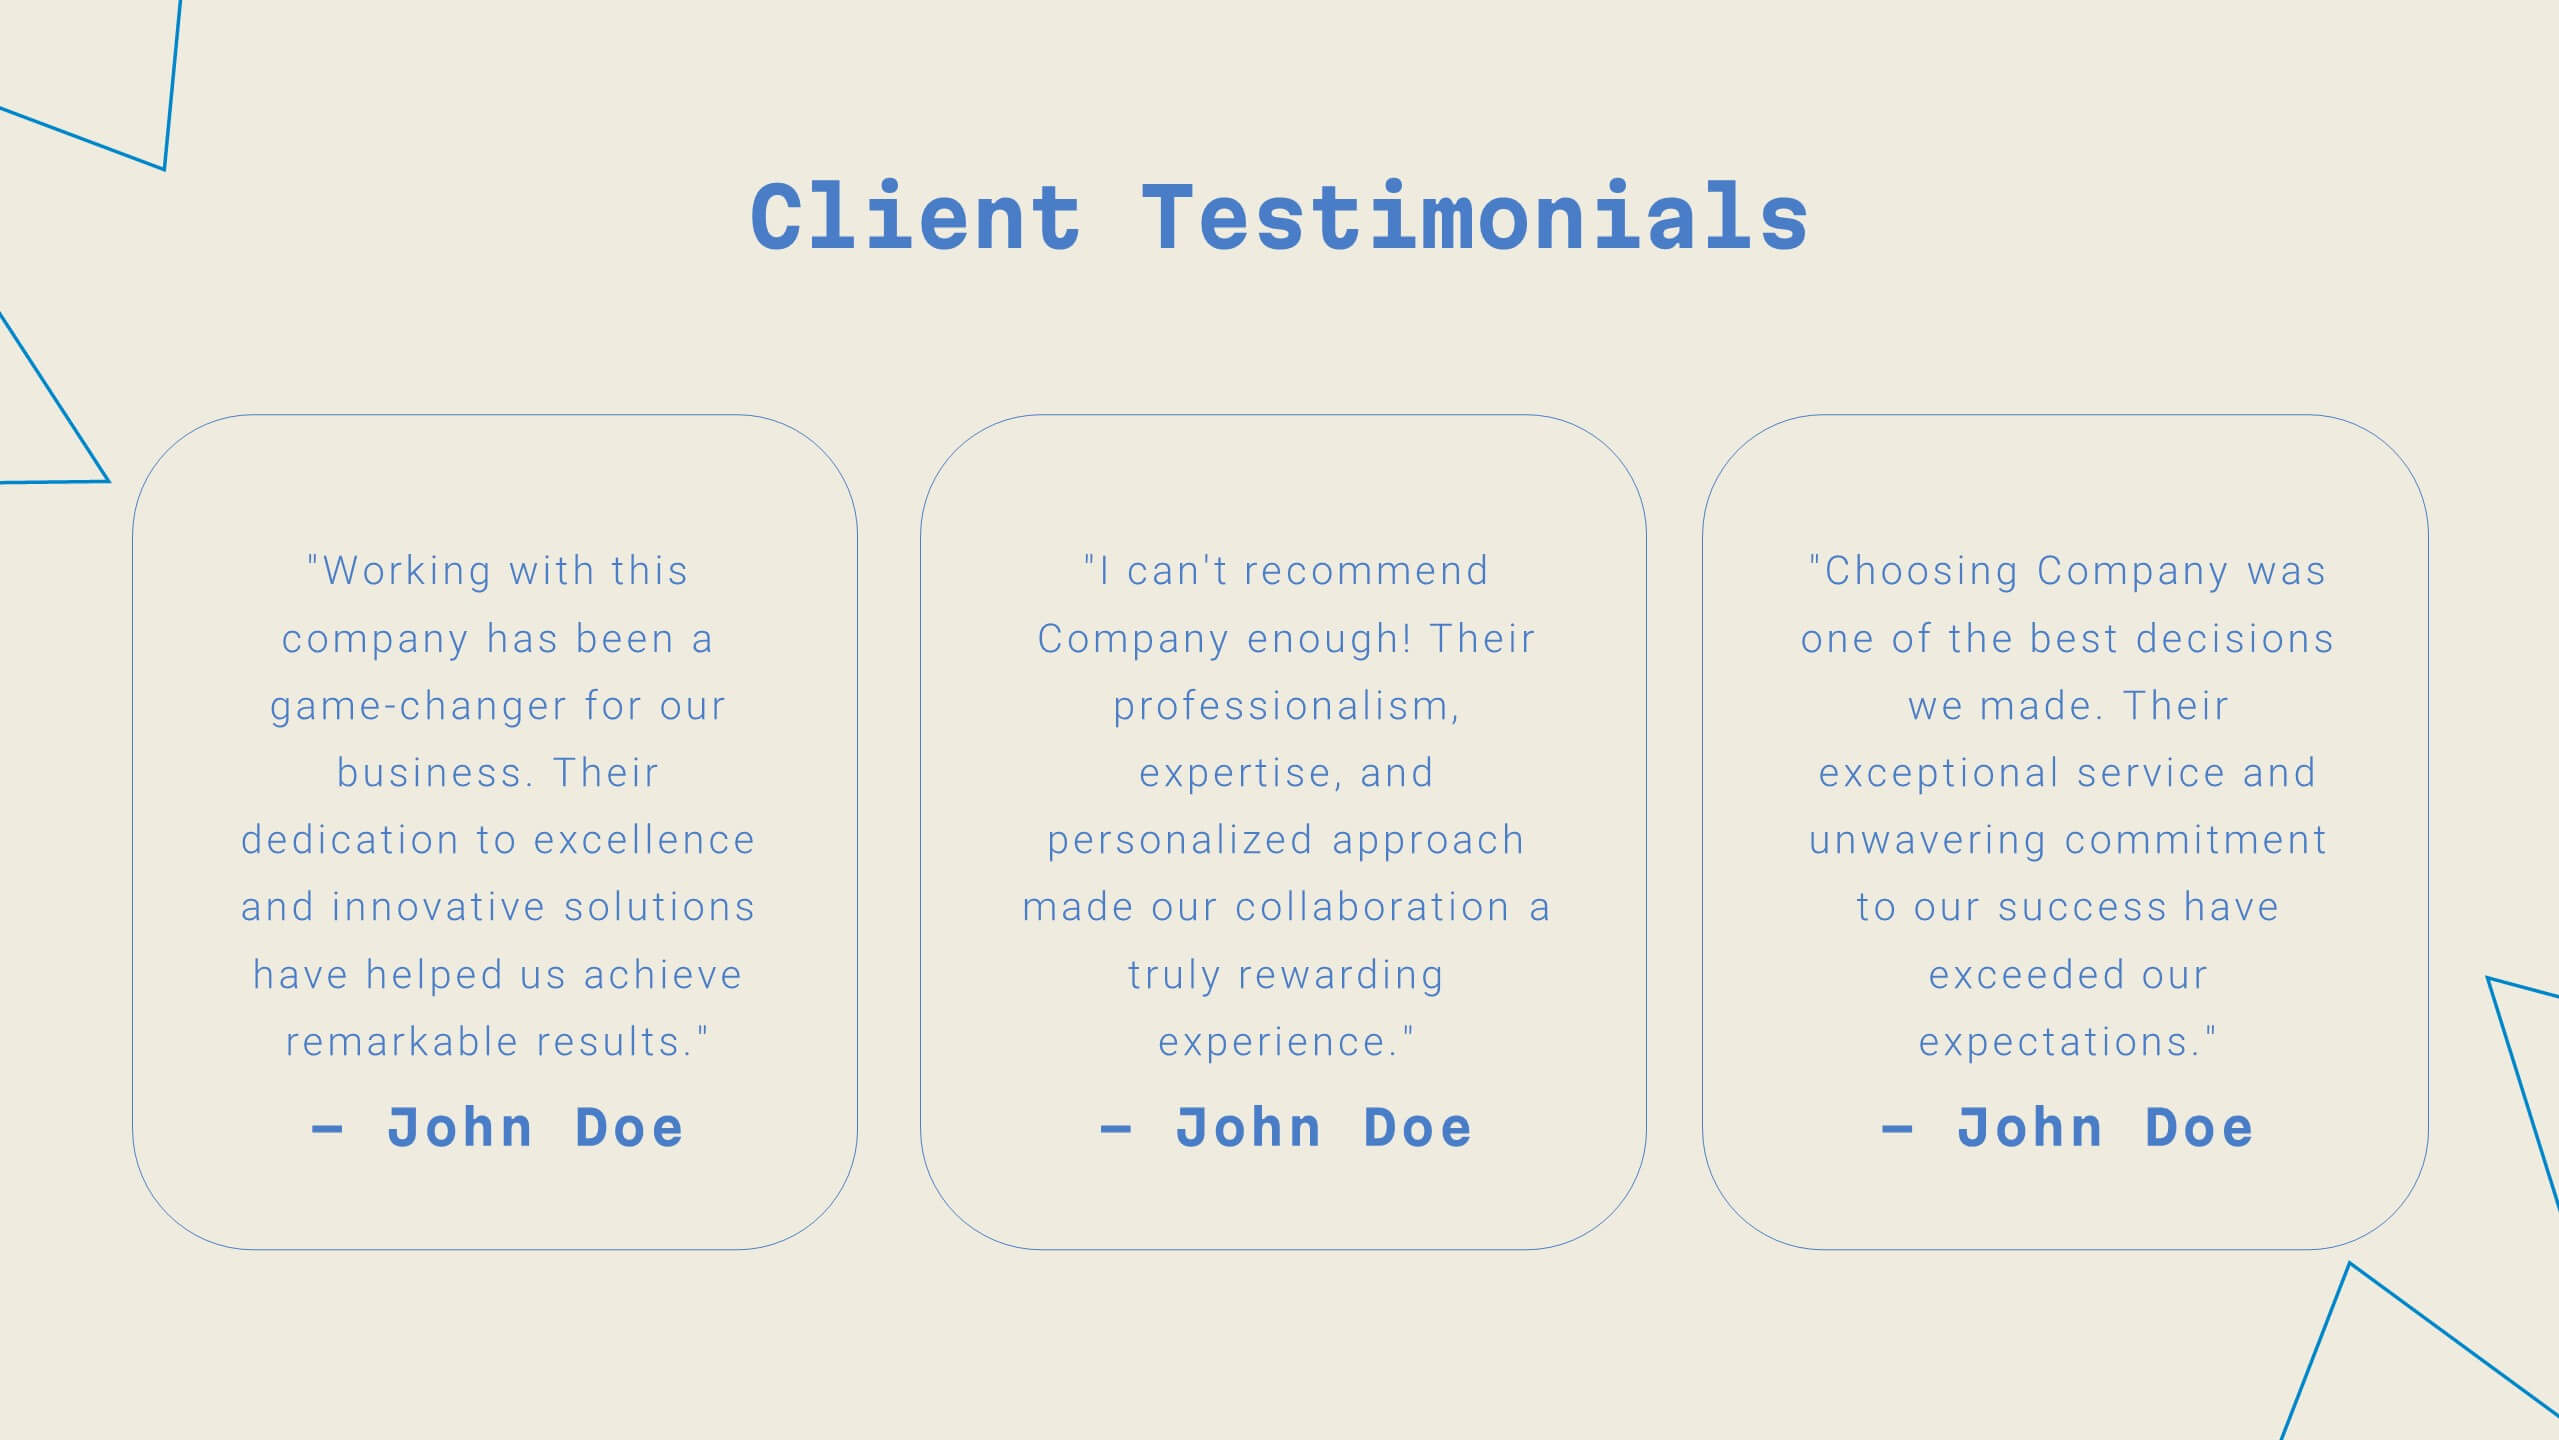
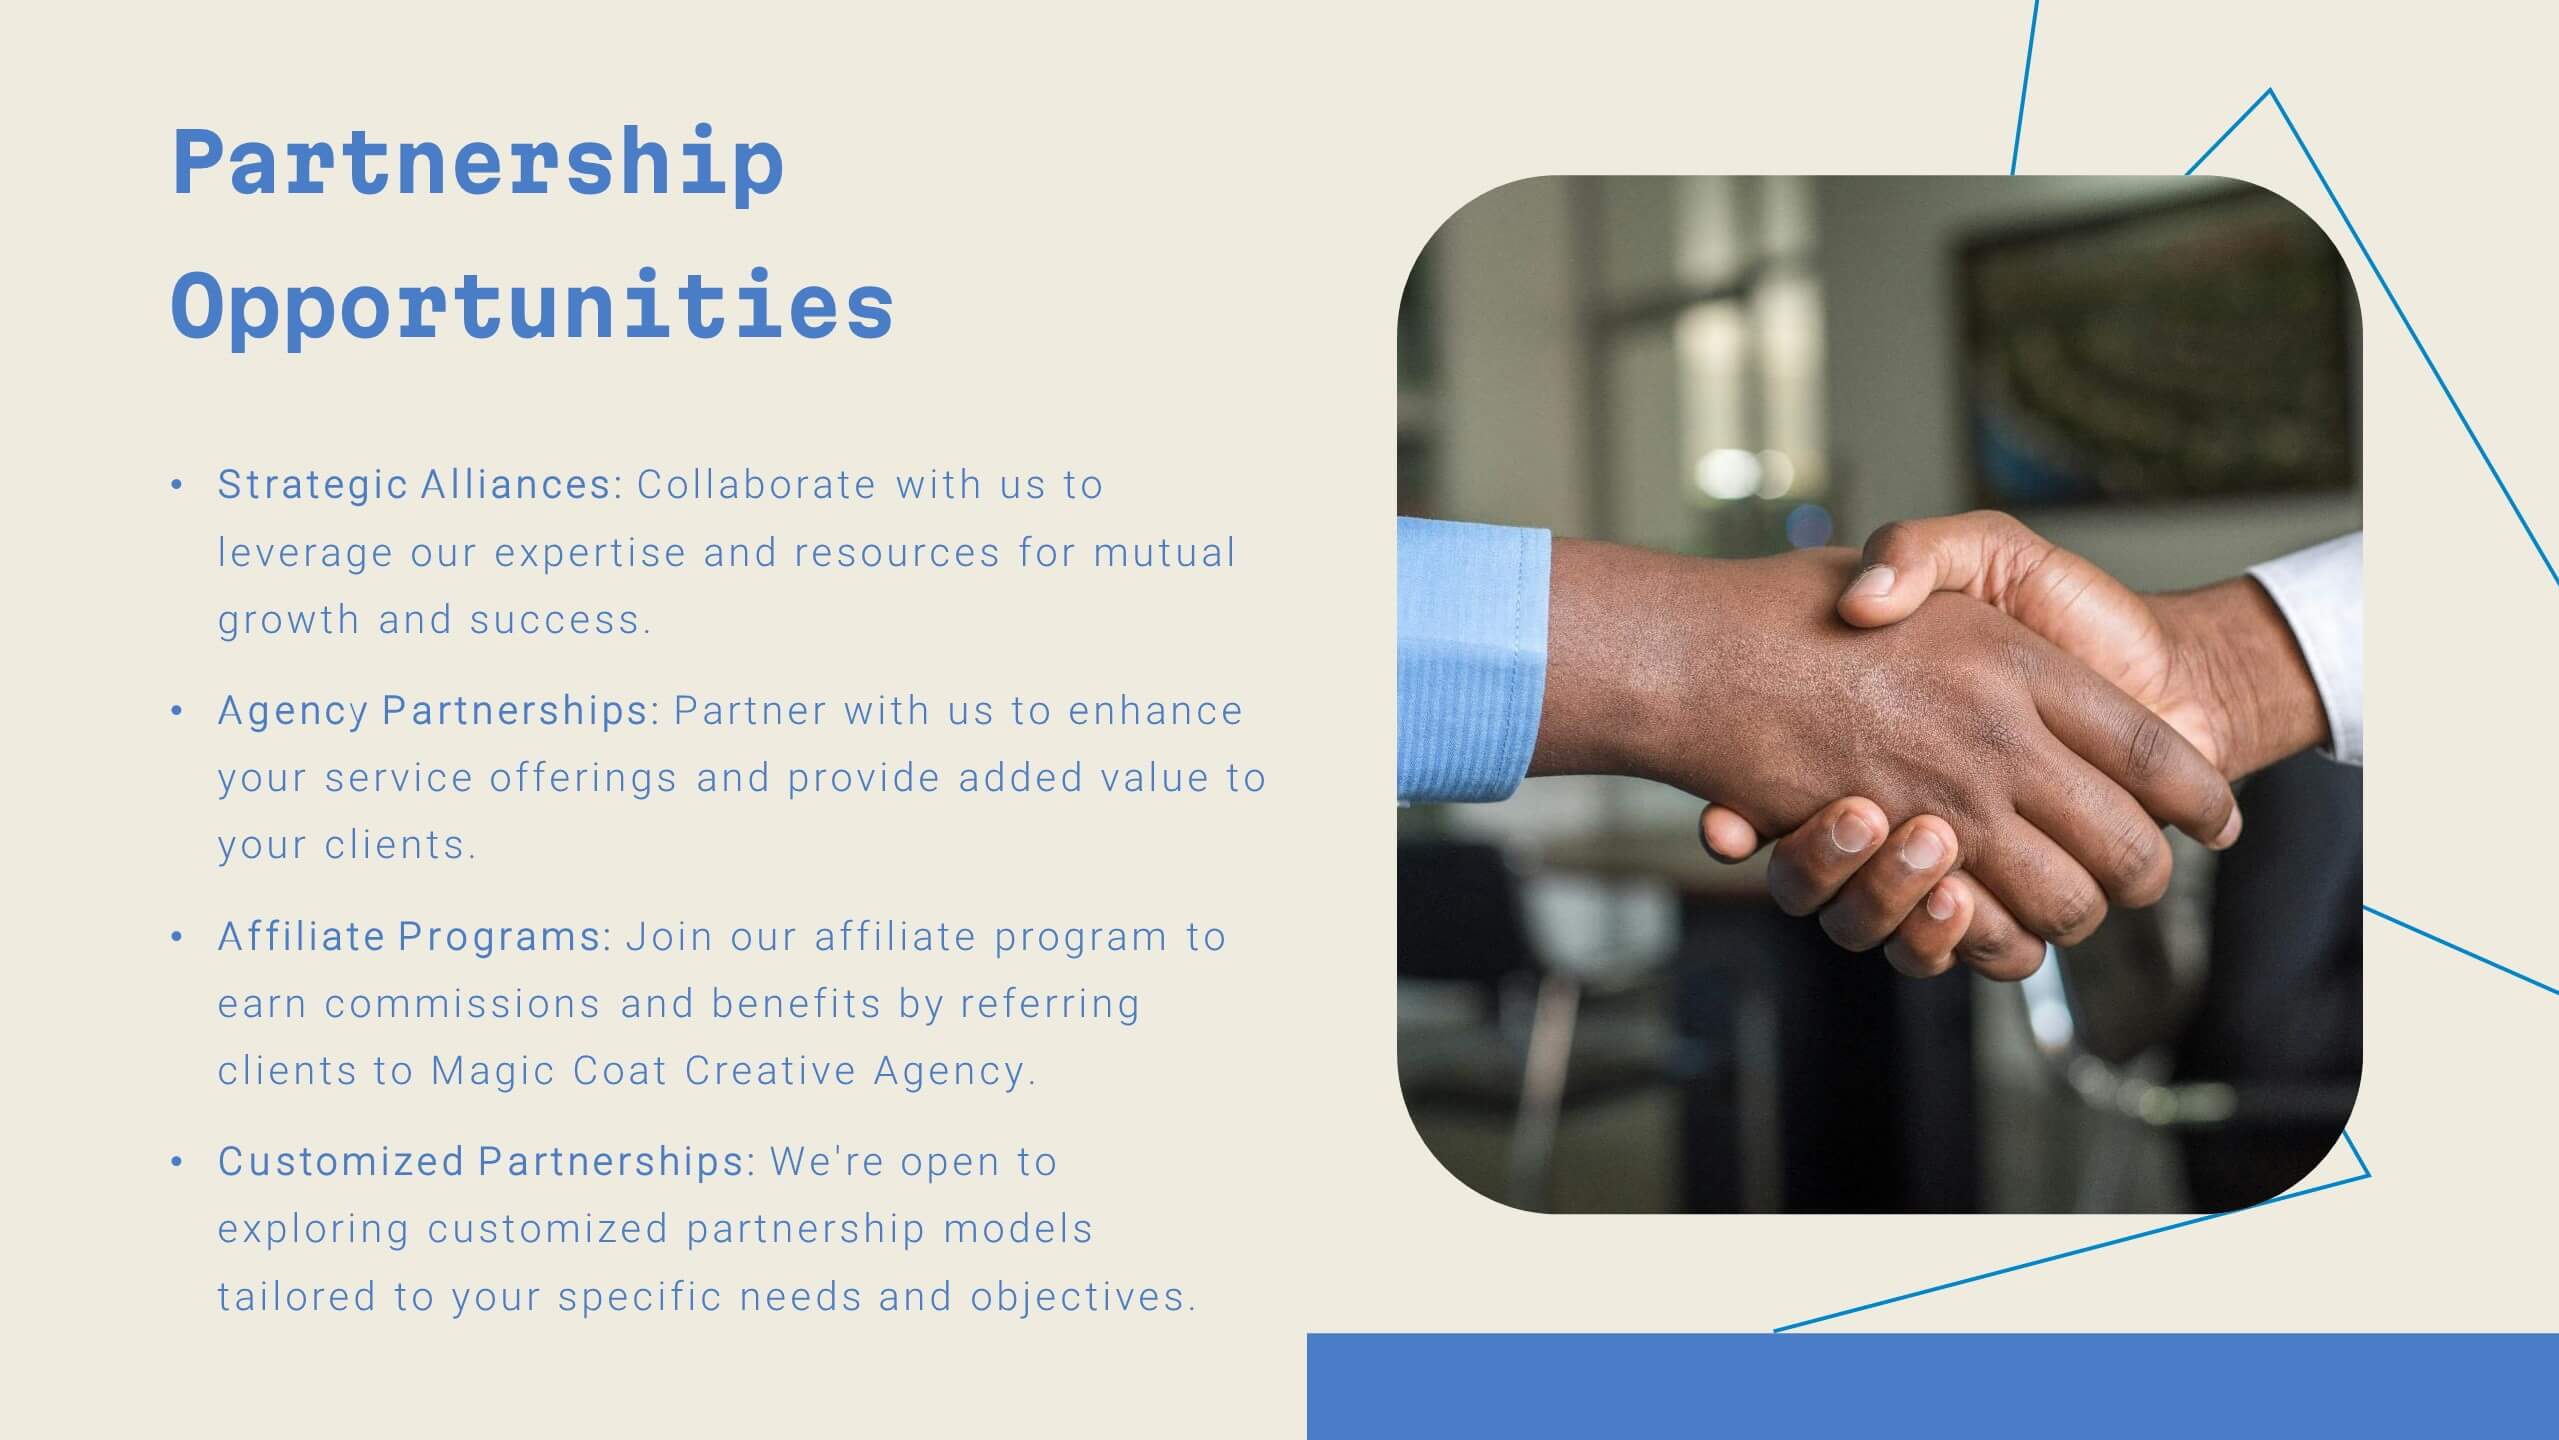
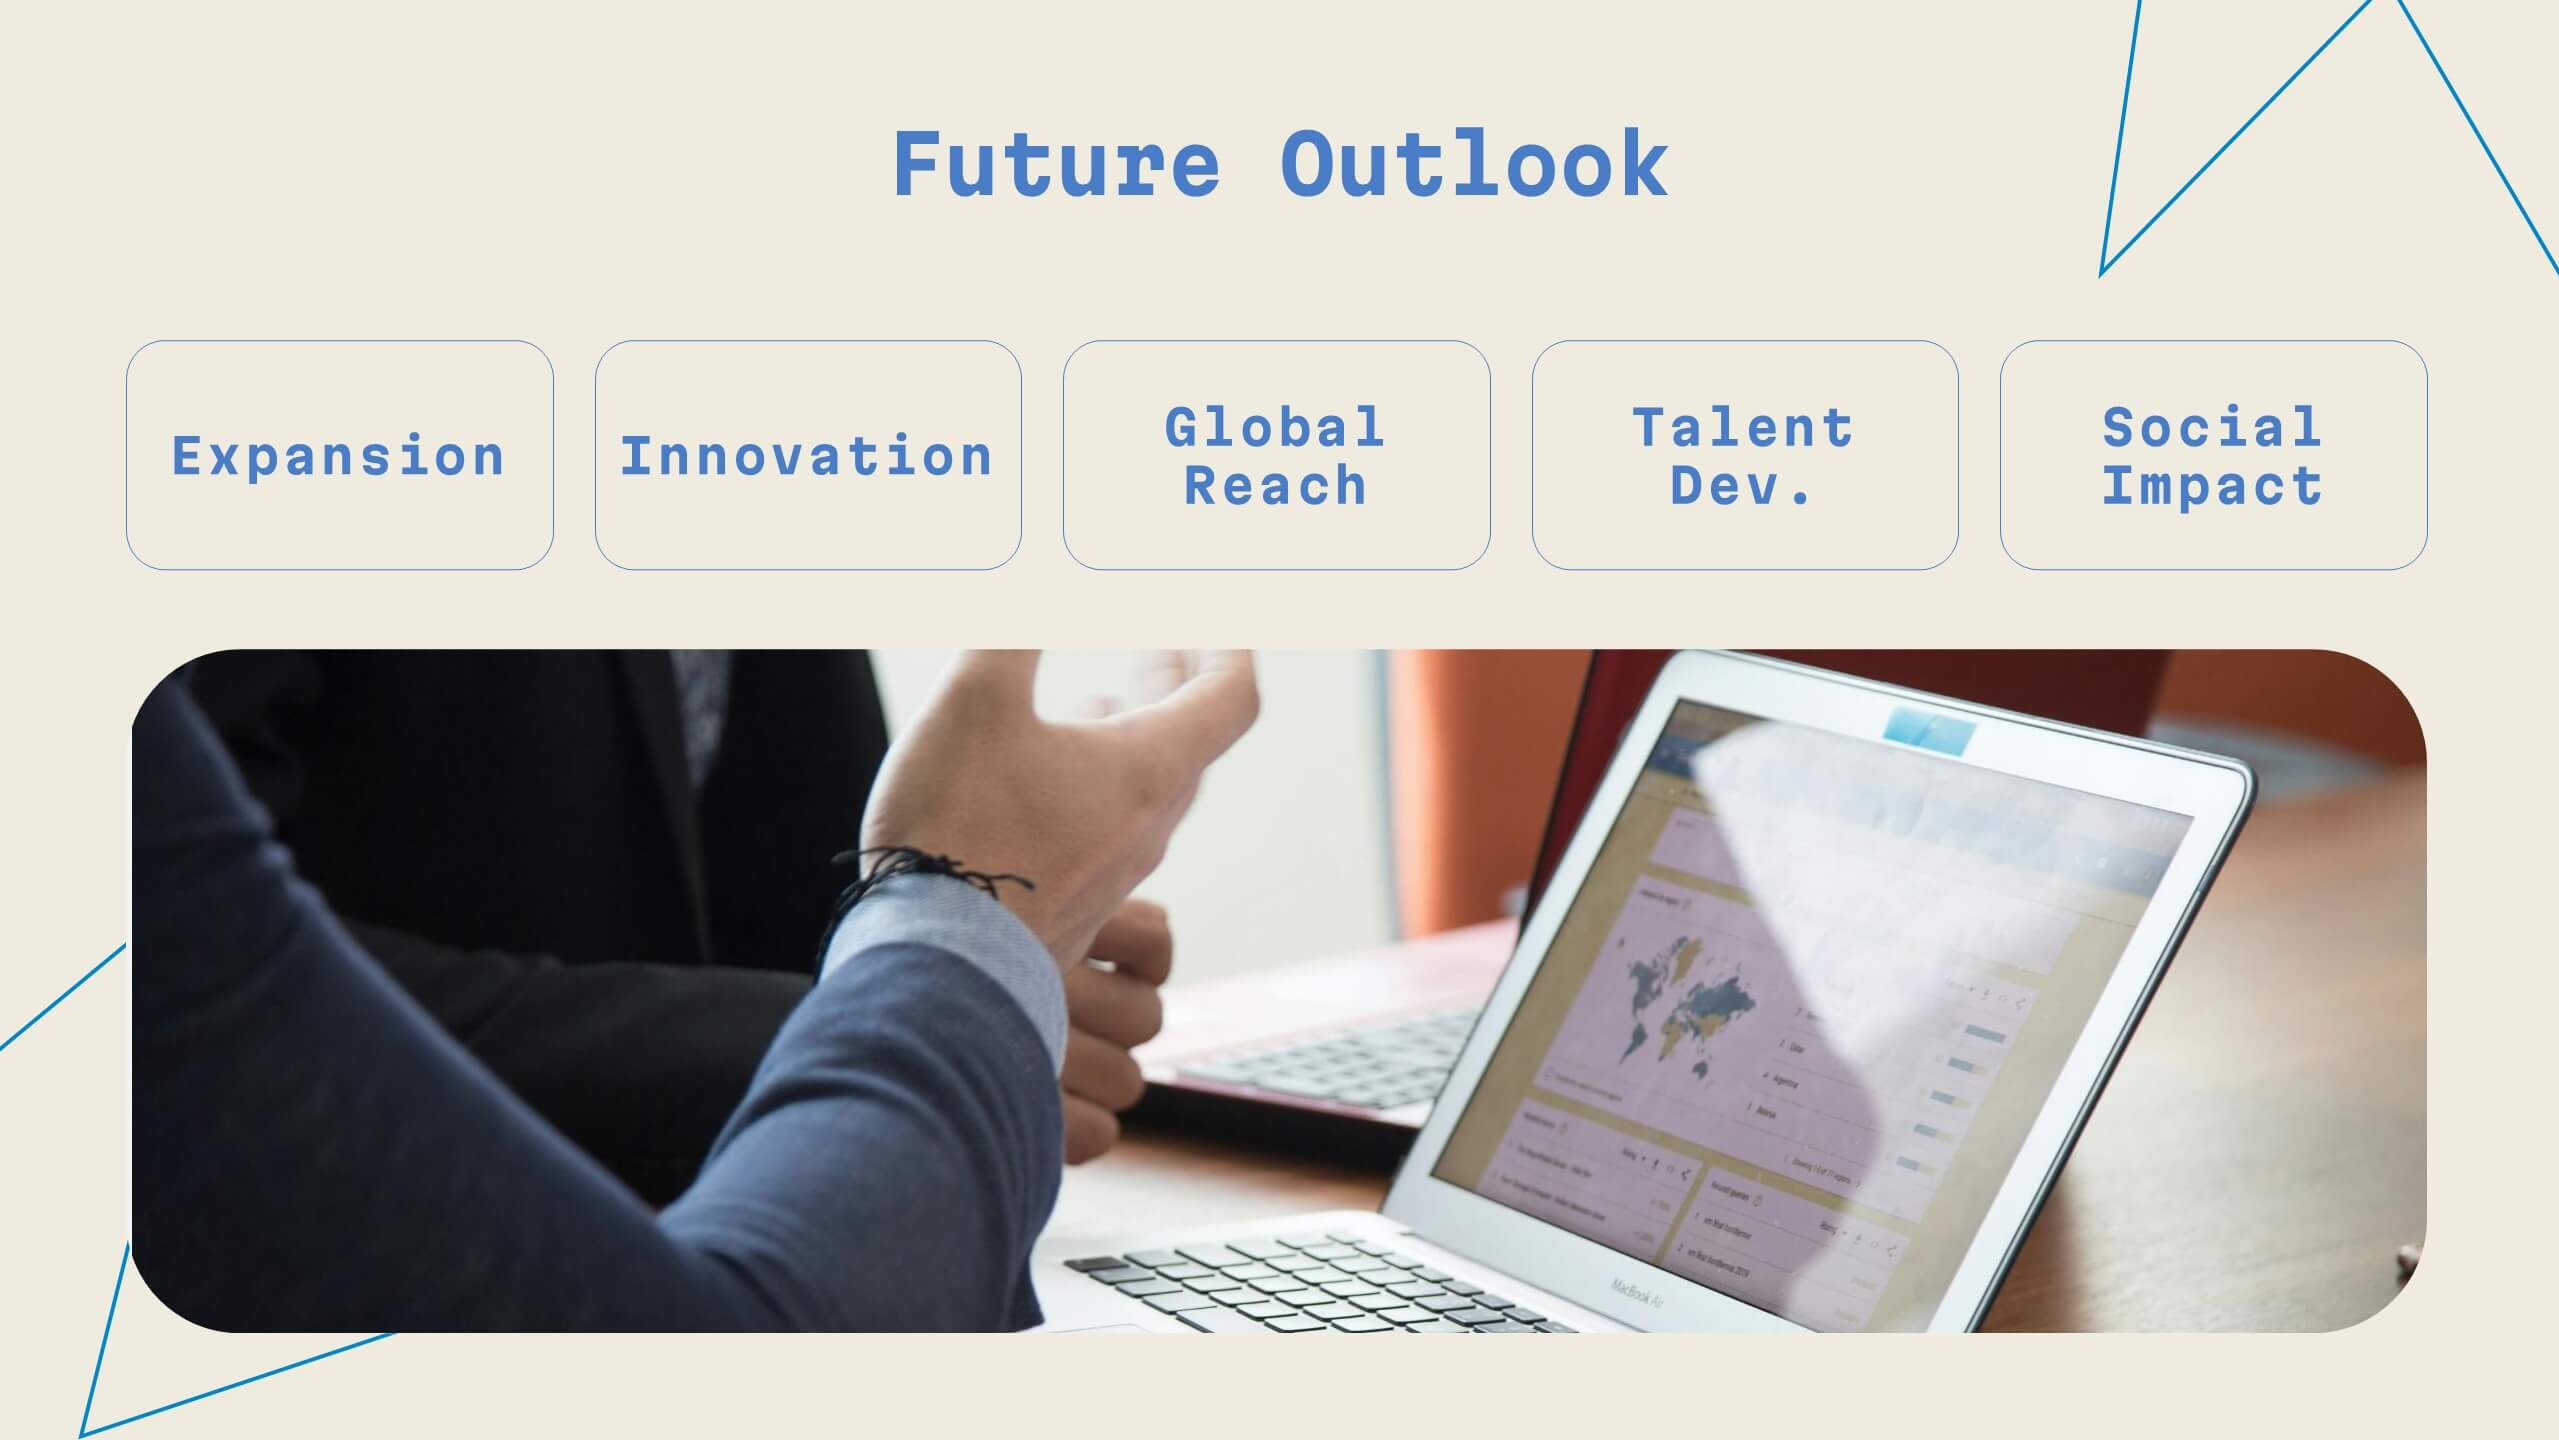
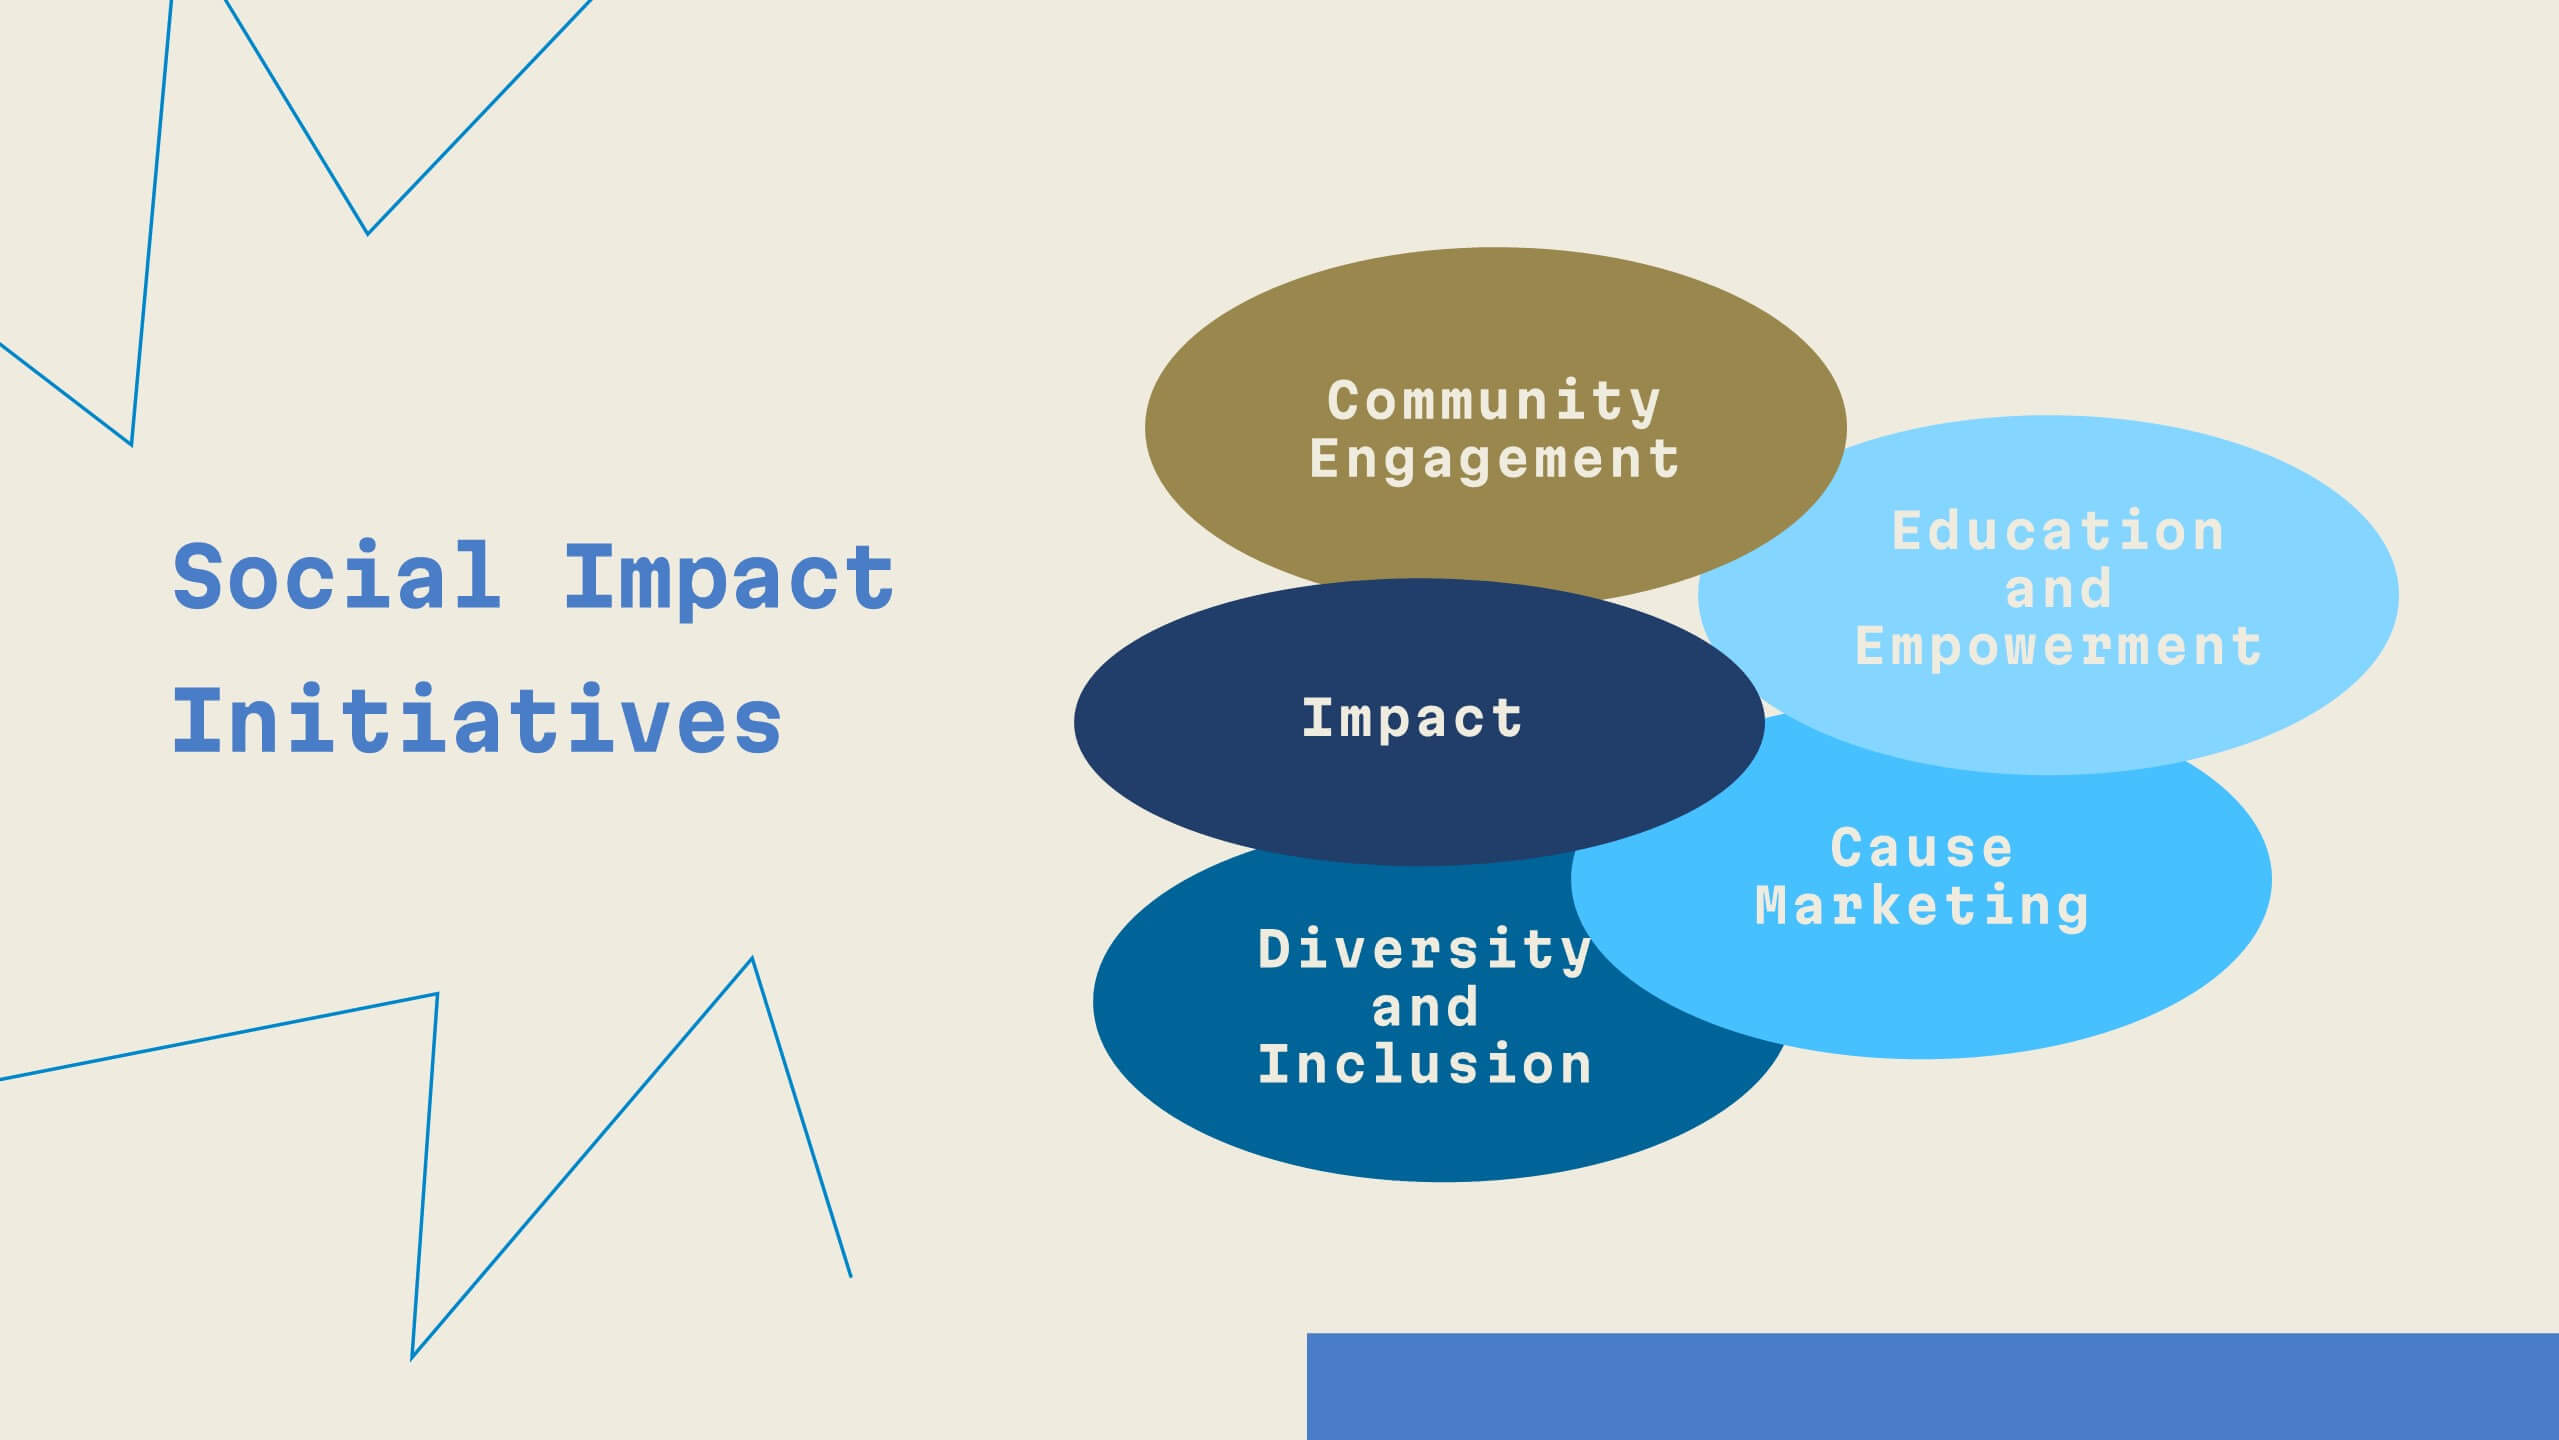
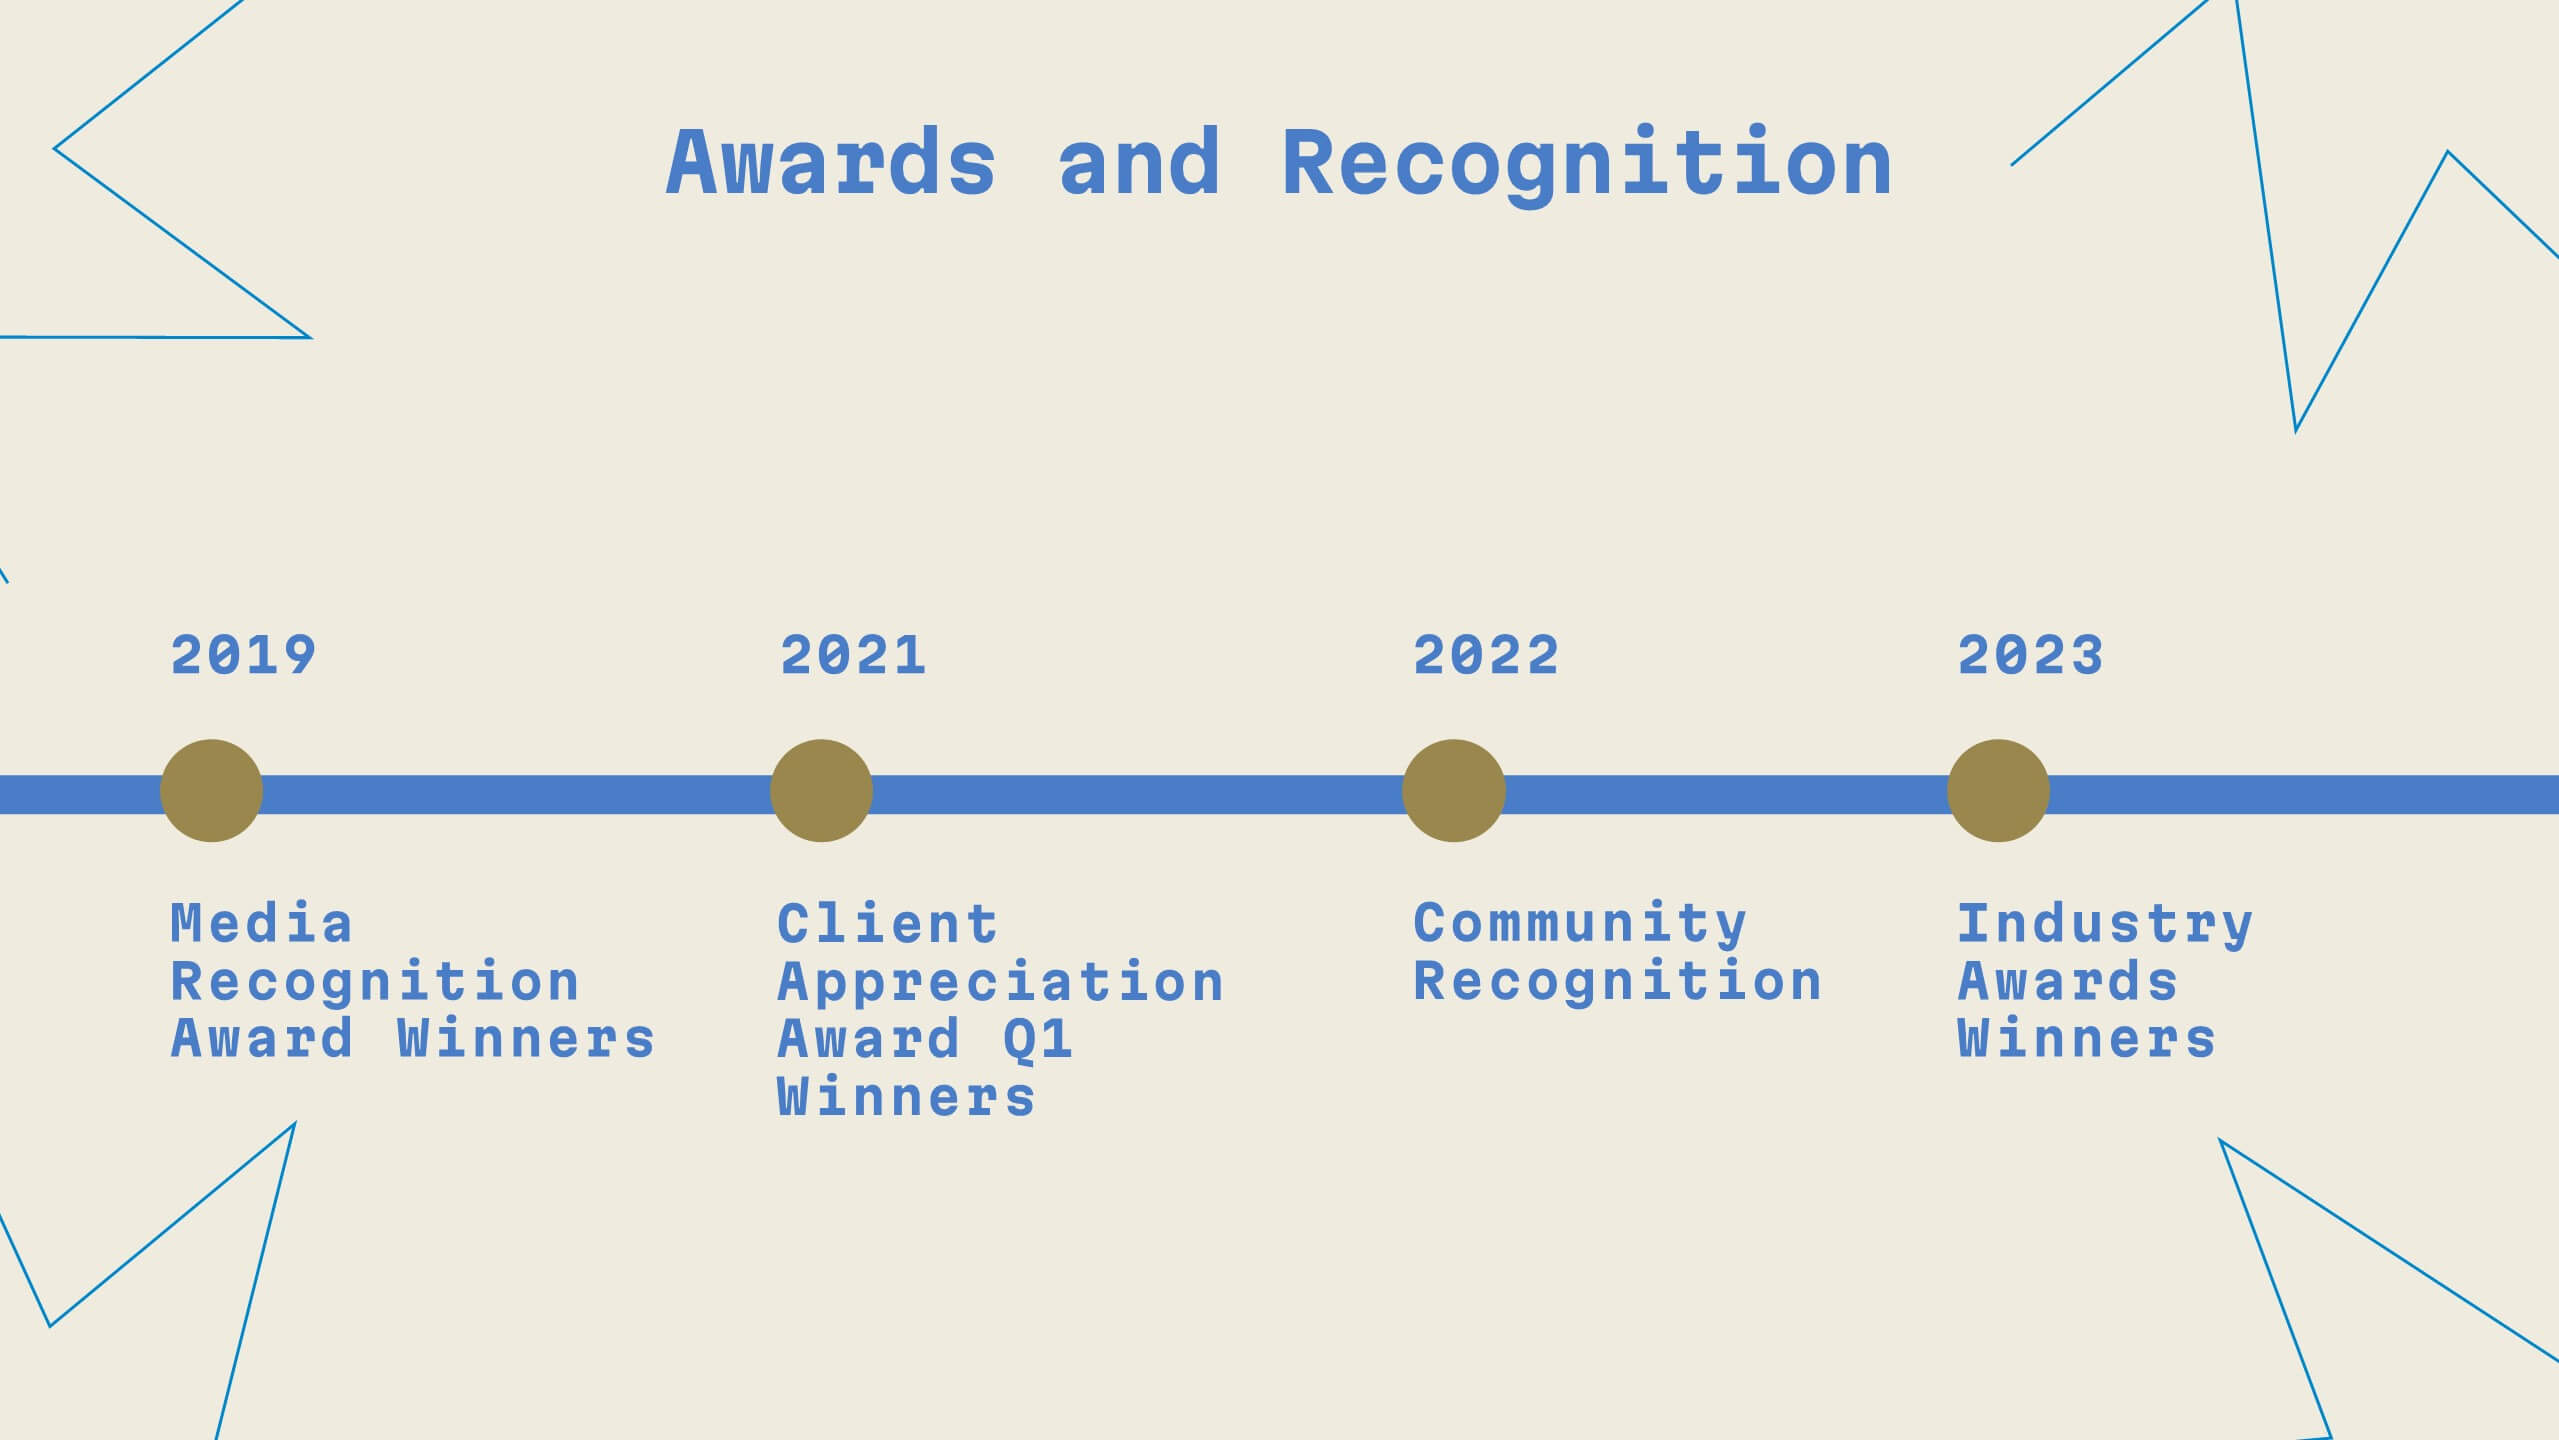
Unity Digital Agency Strategy Plan Presentation
Step into the future of digital marketing with this sleek template! From case studies to strategy development, it offers a comprehensive guide for creating impactful presentations. Highlight client success stories, industry trends, and creative processes with ease. Perfect for showcasing your agency's expertise. Compatible with PowerPoint, Keynote, and Google Slides.


5 diapositivas
Consequences of Fake News Infographics
Fake news refers to false or misleading information presented as factual news. These are informative infographic templates that highlights the significant impact of fake news on individuals, society, and democracy. They are designed with the aim to raise awareness about the dangers of misinformation and its far-reaching consequences. Use this to educate and inform your audience about the detrimental effects of fake news on individuals, society, and democracy. This increases awareness and promotes media literacy. Fully customizable and compatible with Powerpoint, Keynote, and Google Slides.


5 diapositivas
Performance Metrics Dashboard Presentation
Turn complex data into clear, engaging visuals with a clean, modern dashboard layout that highlights performance results at a glance. Perfect for tracking KPIs, progress, and team outcomes, this template brings structure and clarity to reports. Easily editable in PowerPoint, Keynote, and Google Slides for professional presentations.


6 diapositivas
Community Ecology Infographic
Ecology is the scientific study of the interactions between organisms and their environment. This infographic template is an informative representation of the interactions and relationships among different species in a specific ecological community. It highlights the key concepts and principles of community ecology, helping the audience understand the intricate connections that exist in nature. This infographic features an illustration of a diverse ecosystem, showcasing various plants, animals, and microorganisms that coexist within the community. The illustration visually represents the complexity and diversity of the community.


5 diapositivas
Environmental and Social Sustainability Presentation
Explore the synergy of environmental protection and social responsibility with our Environmental and Social Sustainability Presentation template. This visual aid is a compelling tool for discussing key strategies in balancing ecological and social impacts, providing a roadmap for sustainable business practices. Ideal for engaging audiences in discussions about conservation and community engagement, the template is fully compatible with PowerPoint, Keynote, and Google Slides, ensuring a smooth presentation experience in any setting.