
Características


¿Tienes alguna pregunta?
Recomendar


25 diapositivas
Siren Rebranding Project Plan Presentation
This sleek brand presentation template covers essential elements like market analysis, brand guidelines, positioning, and audience insights. It's designed to showcase your brand identity and development strategies with a modern layout. Compatible with PowerPoint, Keynote, and Google Slides, it’s perfect for delivering professional and engaging brand presentations.


6 diapositivas
Modern Science Report Presentation
Bring your findings to life with a clean, dynamic layout designed to make scientific insights easy to follow. This presentation highlights key data, research points, and lab observations in a structured, visually engaging format that supports clarity and accuracy. Fully compatible with PowerPoint, Keynote, and Google Slides.


6 diapositivas
Organizational Structure Overview Presentation
Map out your team’s structure with clarity using this simple organizational chart template. Ideal for showcasing departments, reporting lines, or team roles, it helps stakeholders quickly understand who’s who and how responsibilities are divided. Perfect for internal meetings, onboarding decks, or company overviews. Works with PowerPoint, Keynote, and Google Slides.


10 diapositivas
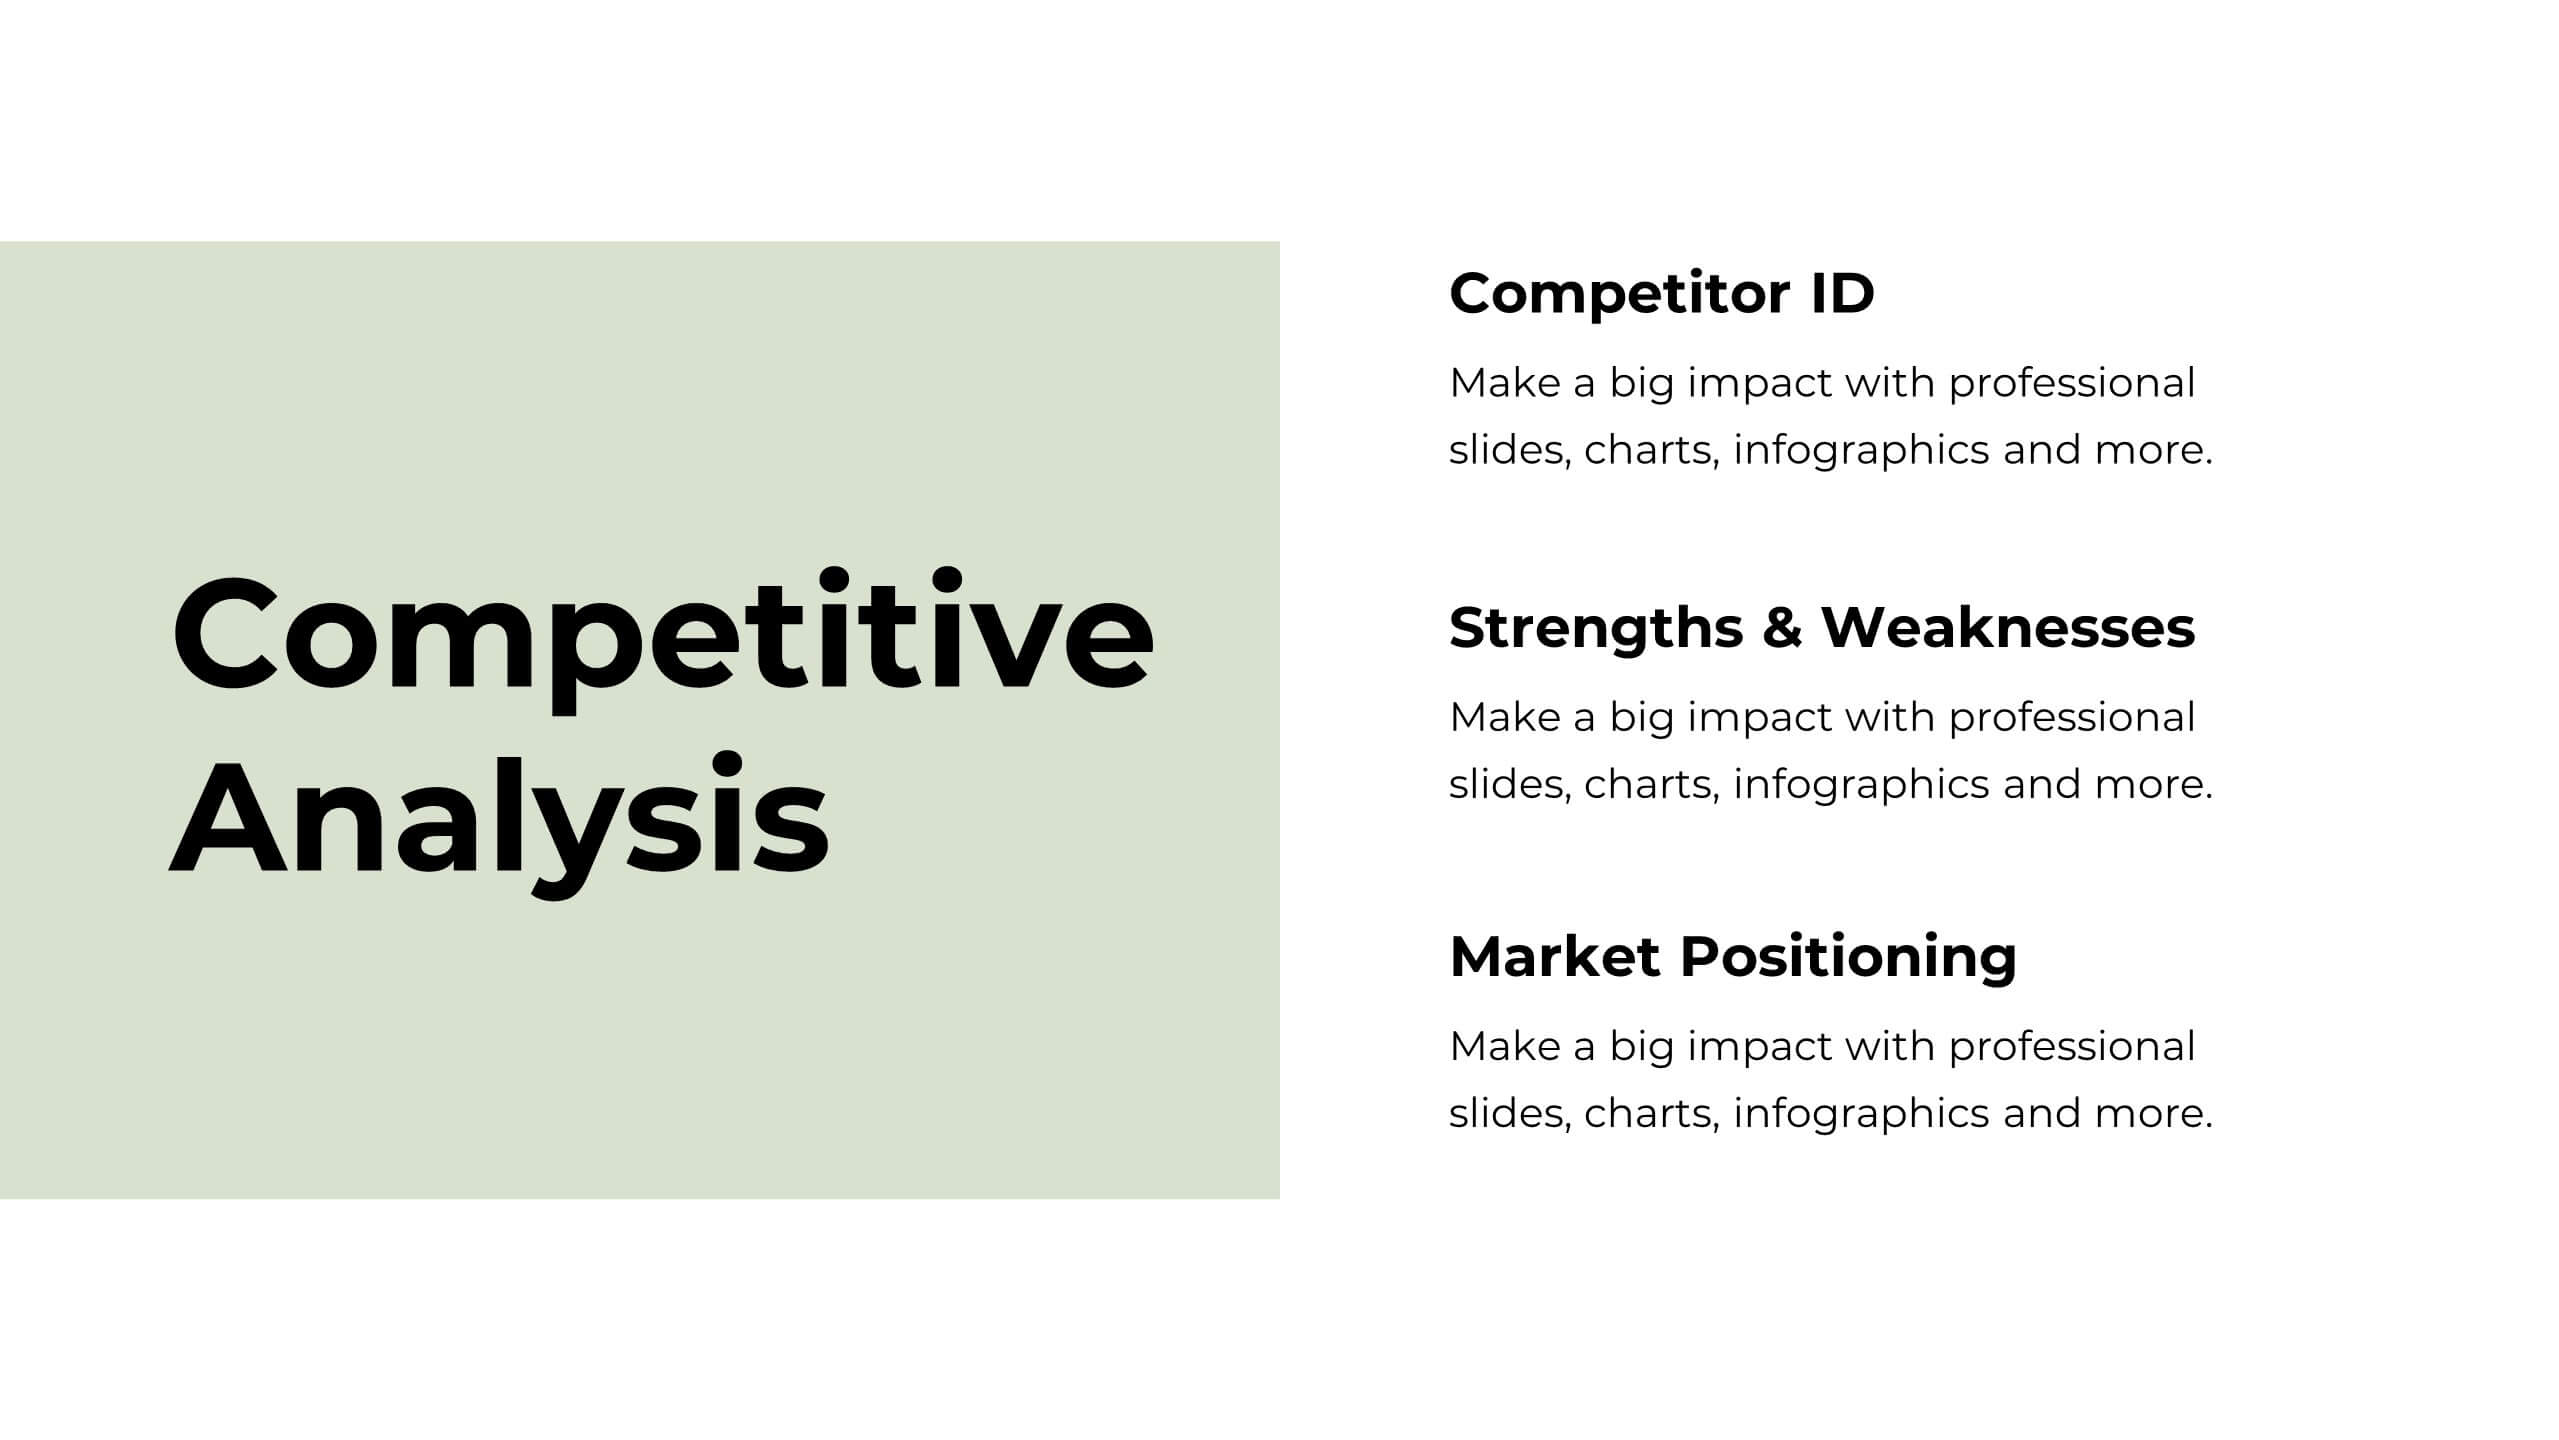
SWOT and Competitor Comparison Presentation
Turn insights into strategy with a clean, visual layout designed to compare strengths, weaknesses, opportunities, and threats side by side. This professional presentation helps teams evaluate competitors and identify growth opportunities clearly. Compatible with PowerPoint, Keynote, and Google Slides for easy editing and seamless presentation delivery.


4 diapositivas
Creative Title Slide Templates Presentation
Make a bold first impression with the Creative Title Slide Templates Presentation. Featuring a sleek, split-layout design with glowing blue abstract waves, this template combines modern aesthetics with functional clarity. Circular icons on the side offer quick visual cues for business categories or departments. Ideal for keynote introductions or professional project kickoffs. Compatible with PowerPoint, Keynote, and Google Slides.


5 diapositivas
Supply Chain Management Plan Presentation
Streamline your presentation with a sleek and organized design built to illustrate process flow and logistics. Perfect for explaining production stages, delivery systems, or business operations, this visual layout brings clarity and structure to your message. Compatible with PowerPoint, Keynote, and Google Slides for effortless customization and use.


5 diapositivas
Business Growth and Expansion
Visually communicate each stage of business development with this Business Growth and Expansion diagram. Featuring a dynamic circular flow, this editable slide is perfect for showcasing progress, scaling strategies, or roadmap milestones. Fully compatible with PowerPoint, Keynote, and Google Slides—ideal for business plans and strategic presentations.


4 diapositivas
Work From Home Bests Practices Presentation
Bring remote work to life with a clean, modern layout that helps teams stay focused, organized, and productive. This presentation highlights key habits, routines, and strategies for working efficiently from home, offering clear visuals that simplify every point. Fully editable and compatible with PowerPoint, Keynote, and Google Slides.


21 diapositivas
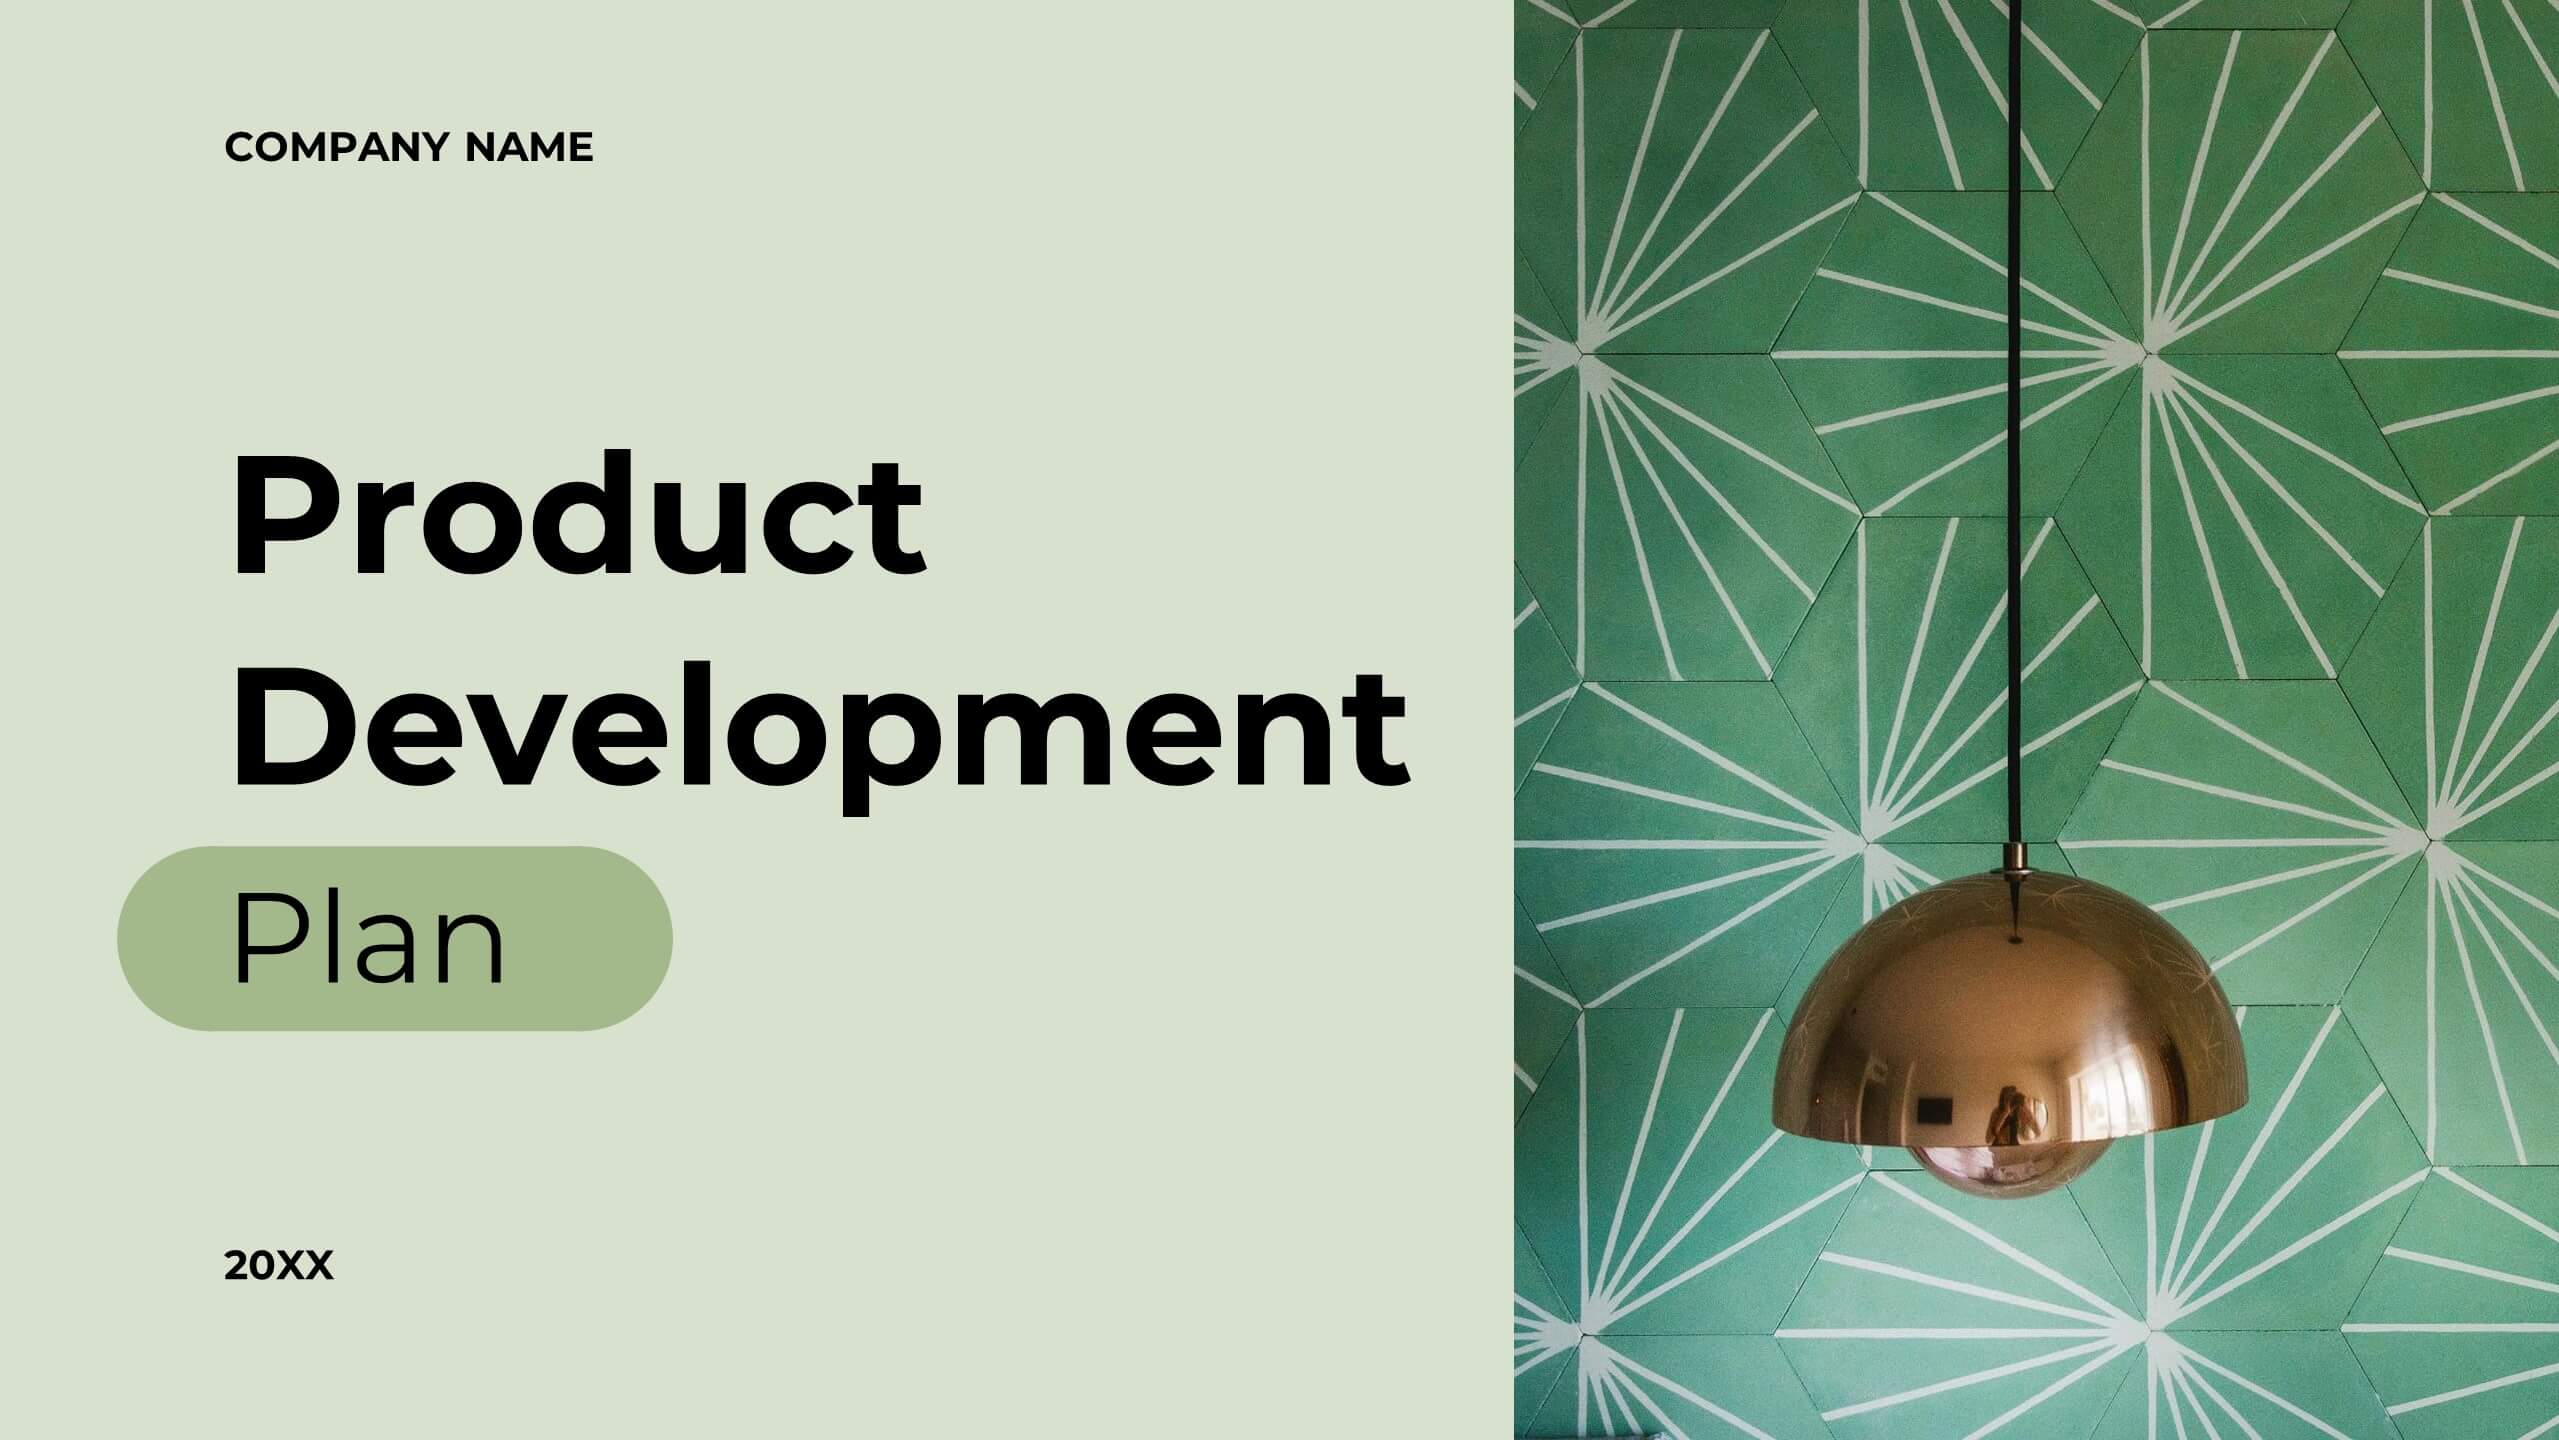
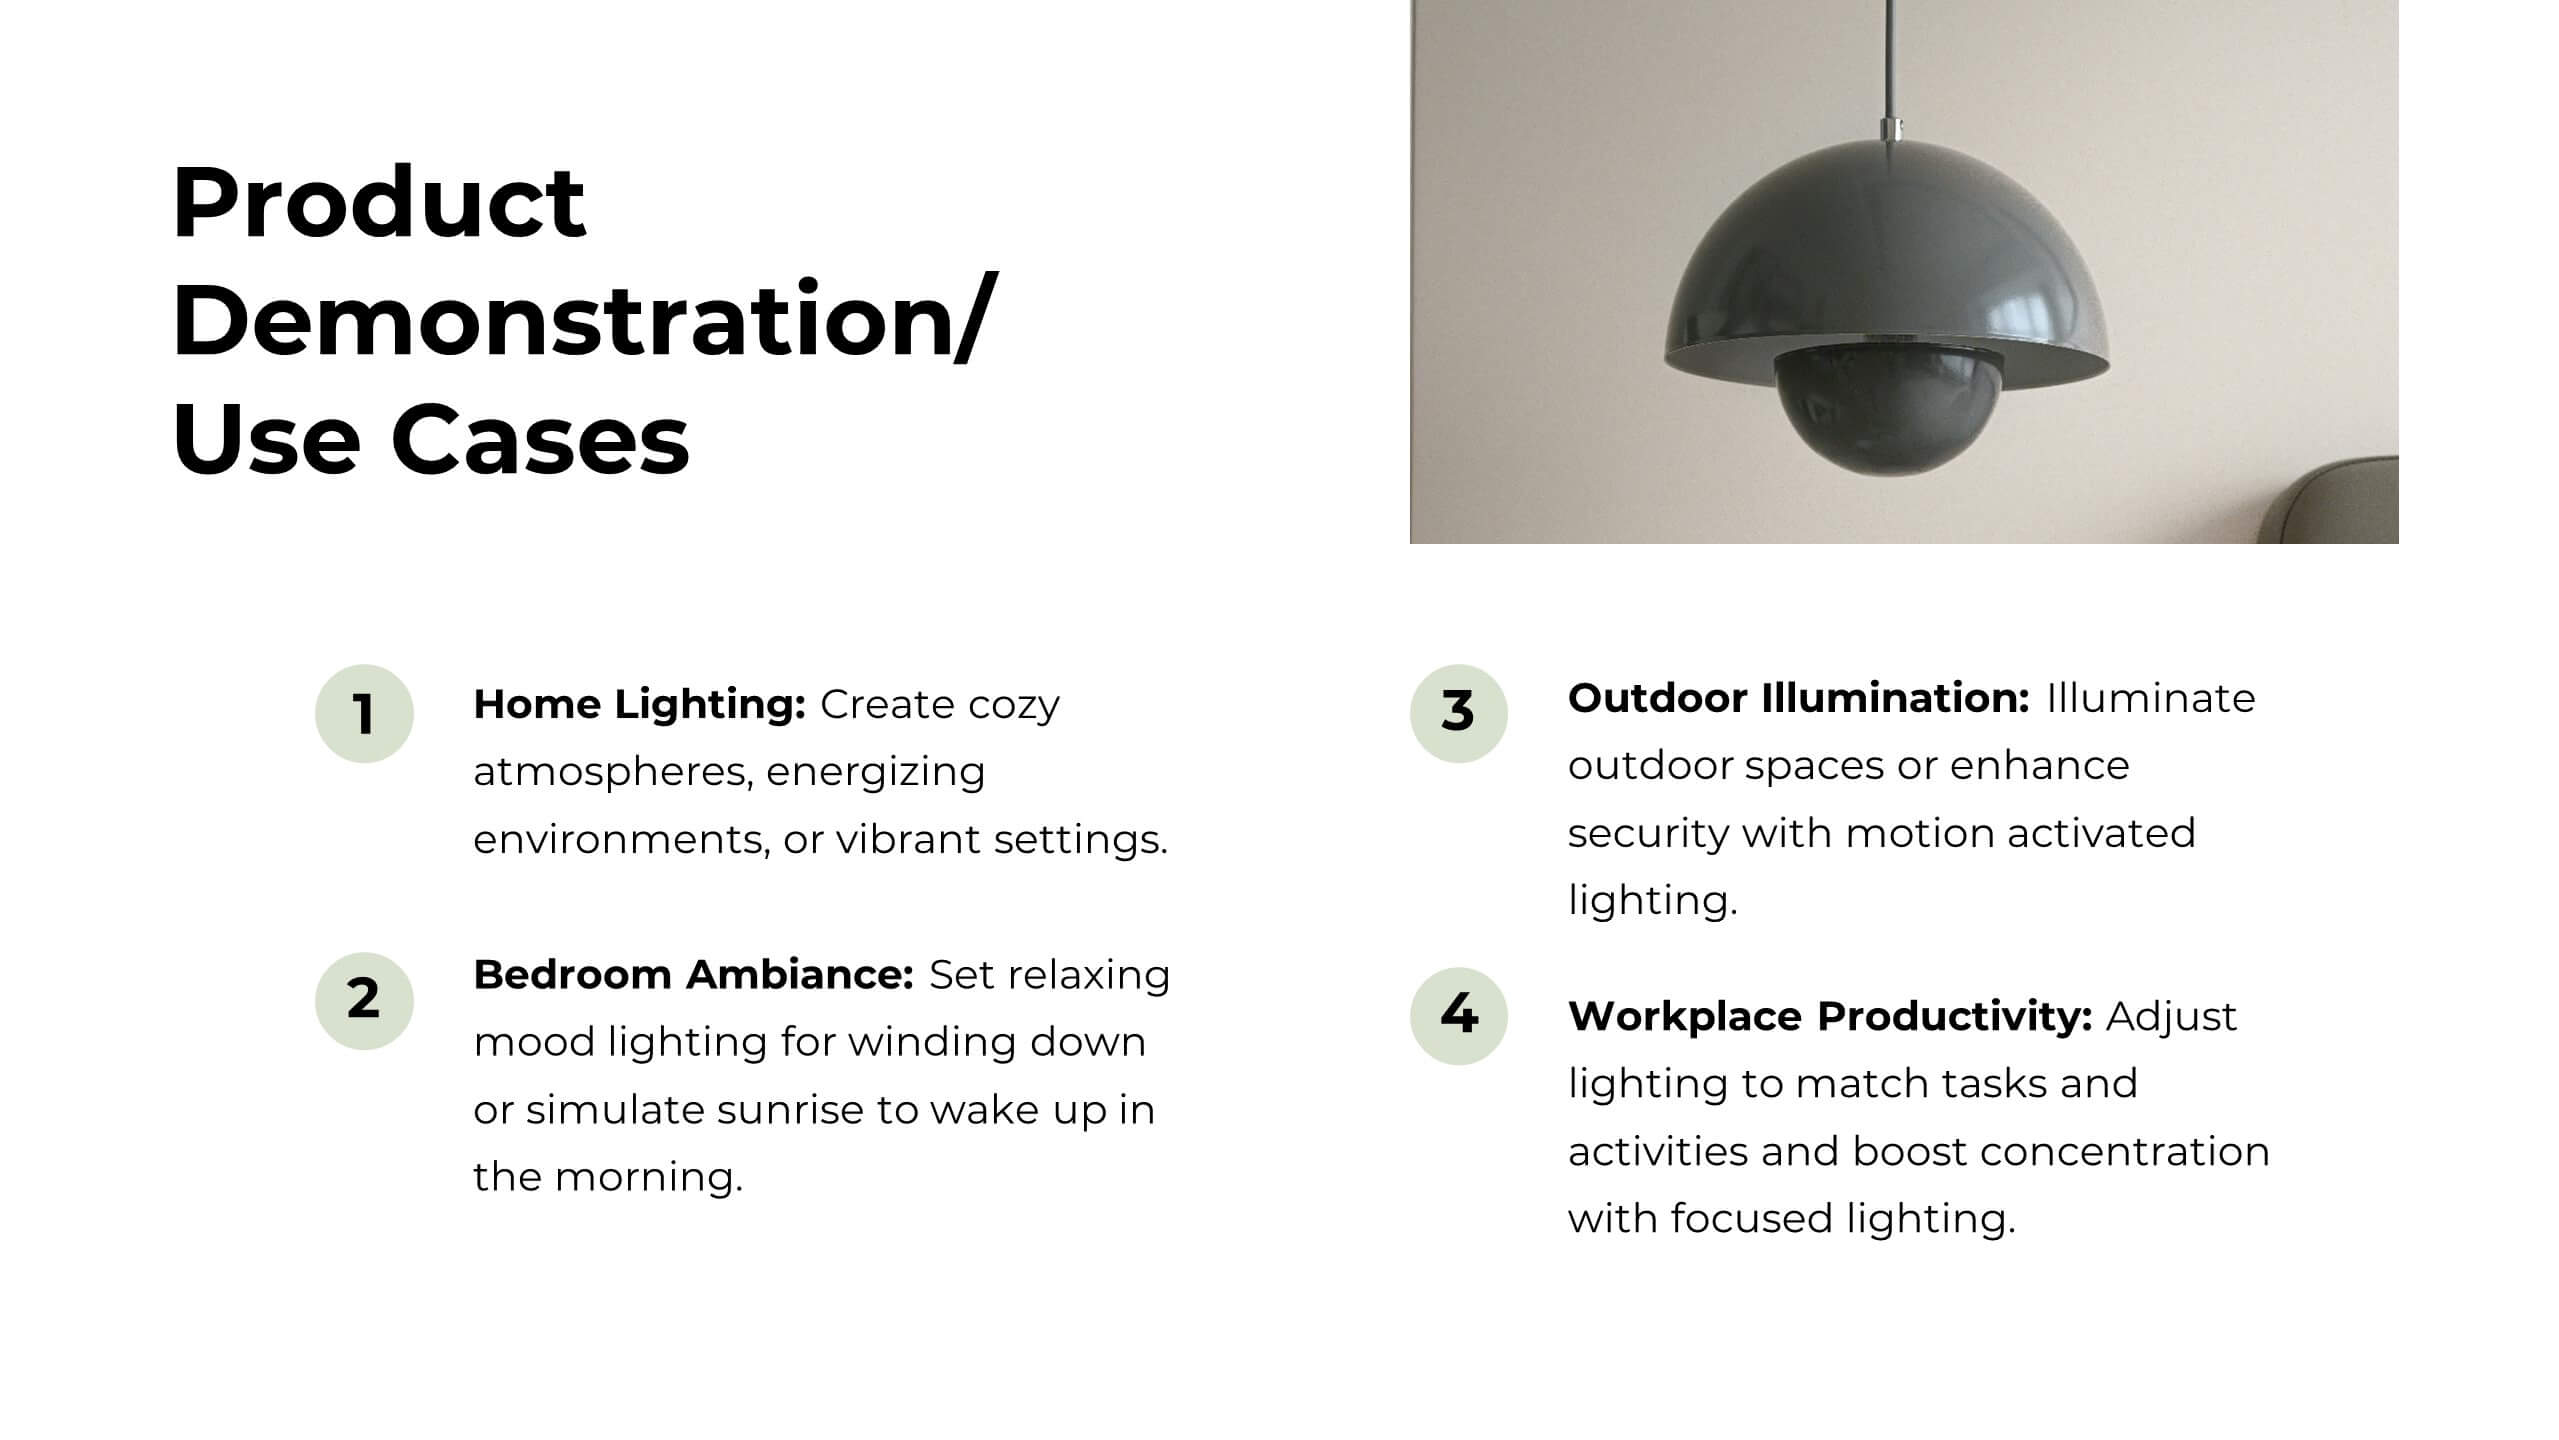
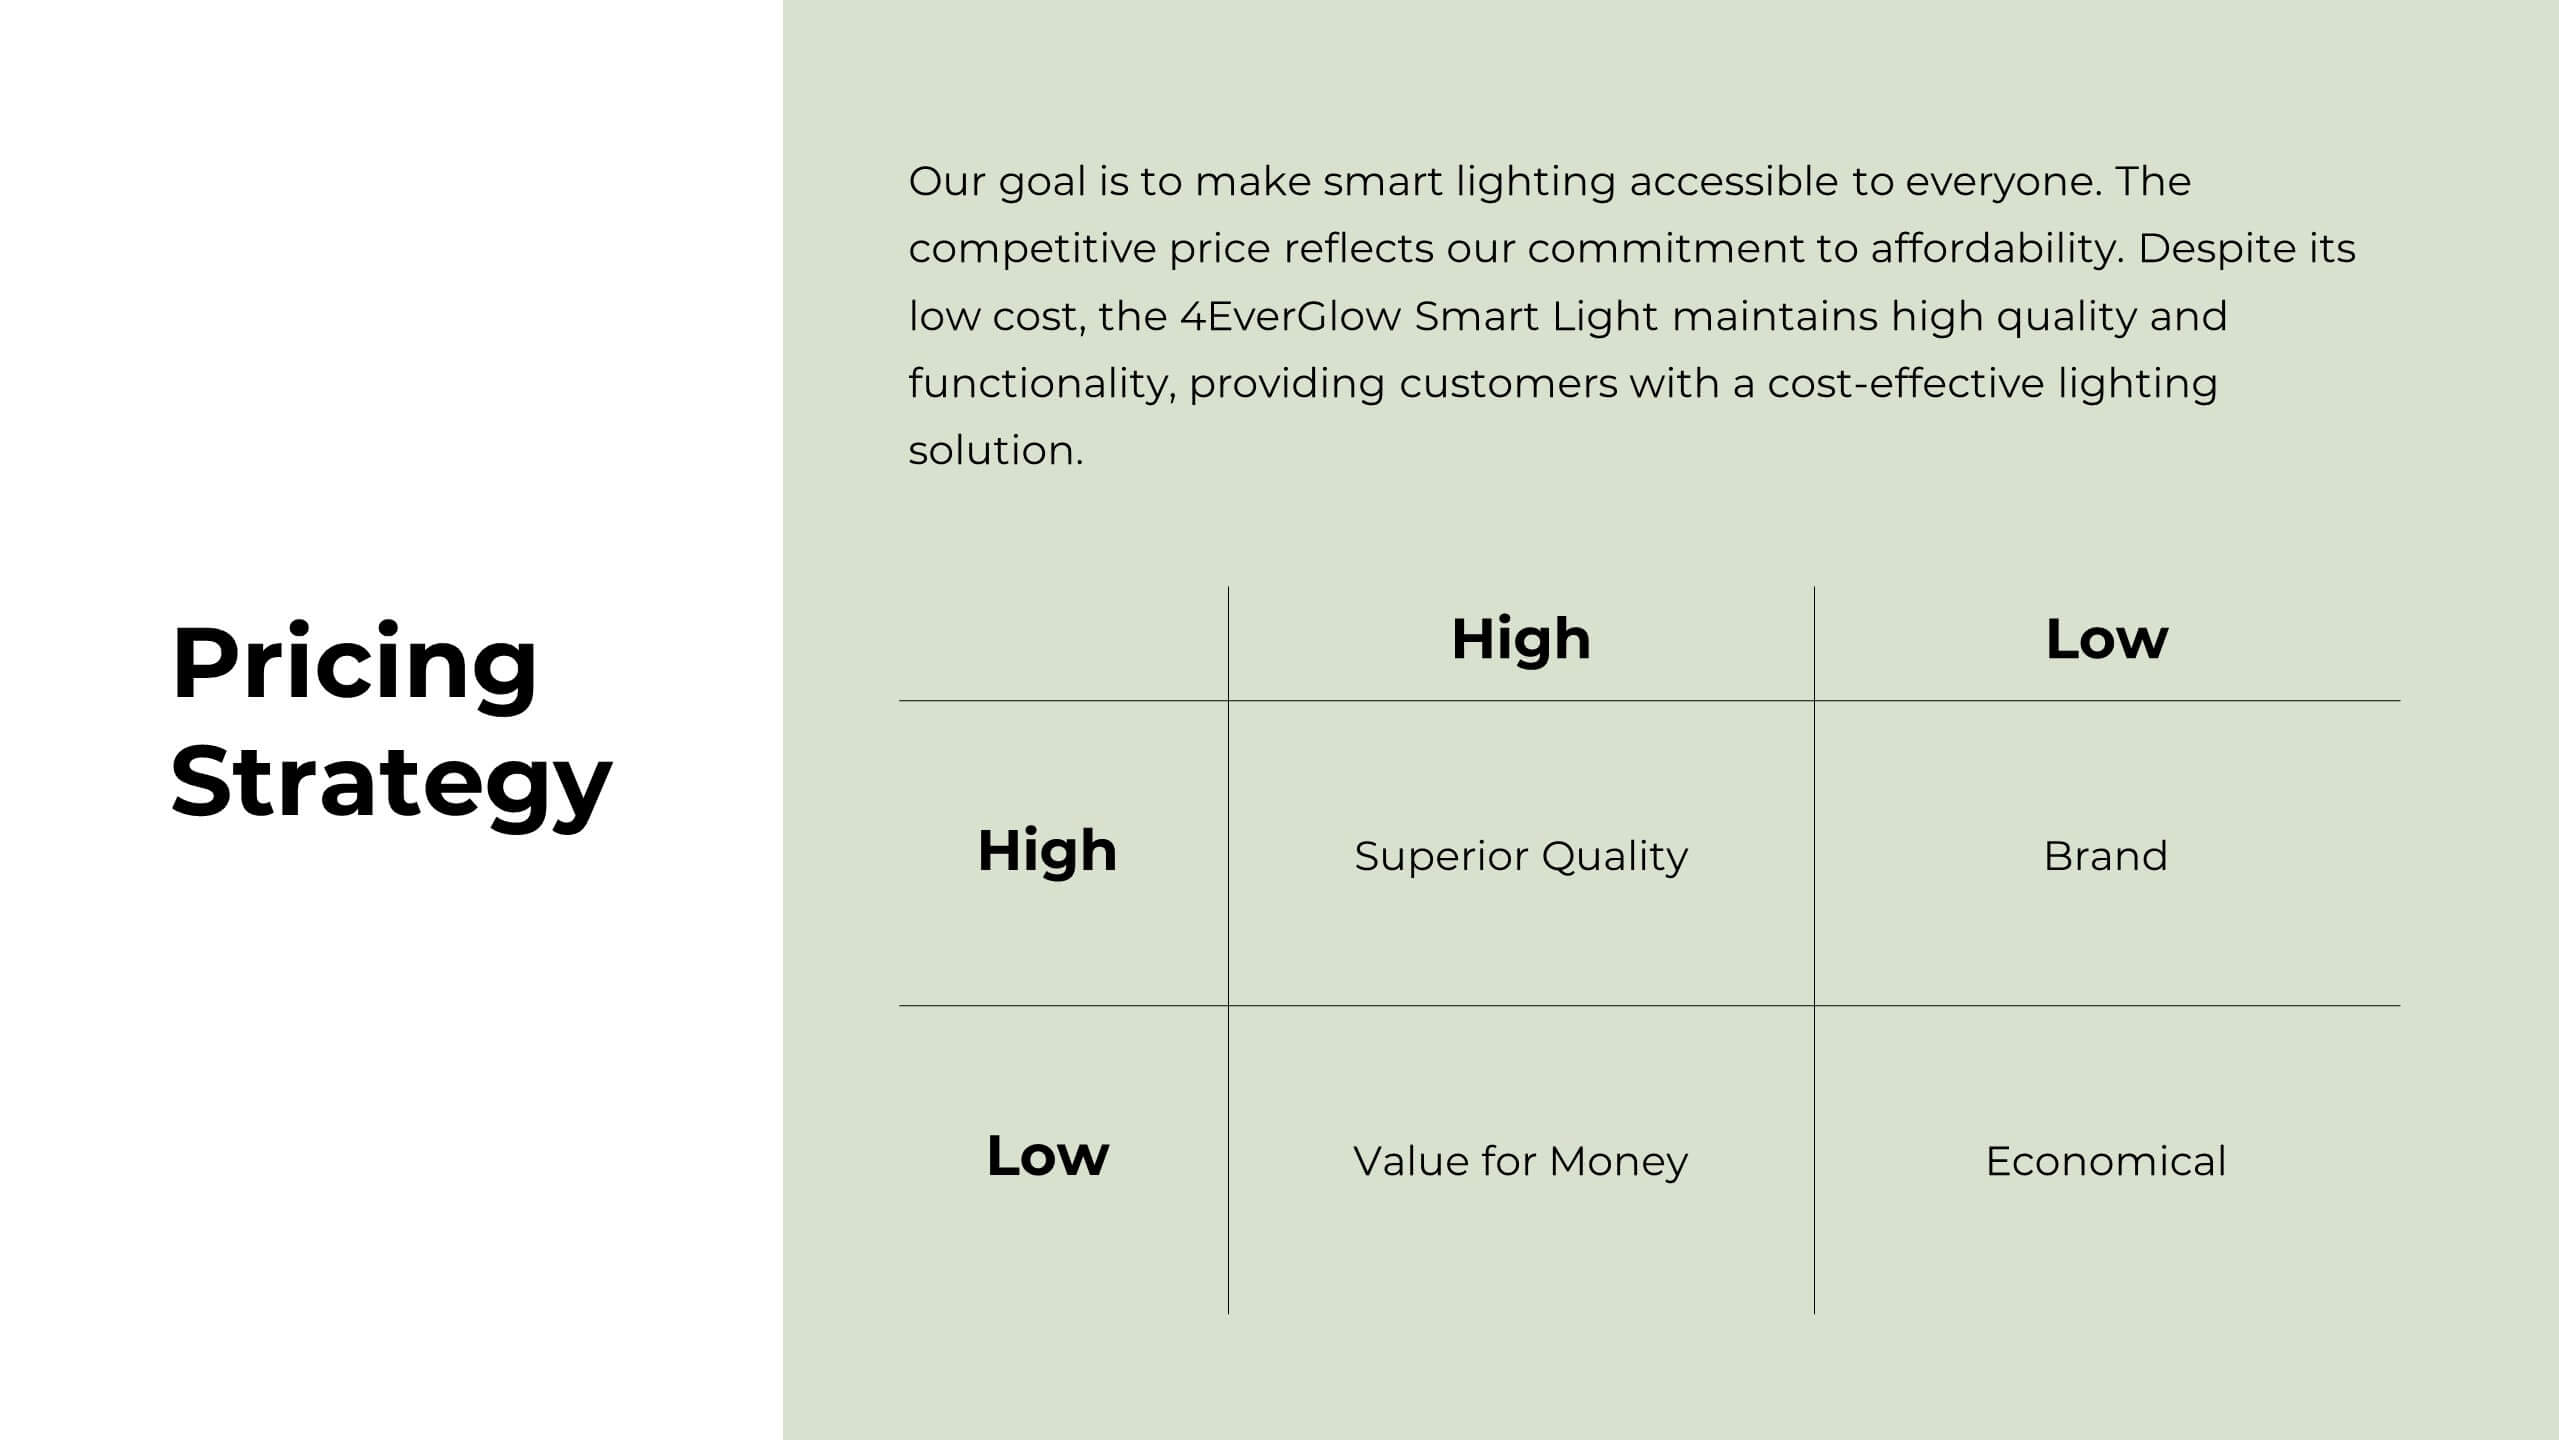
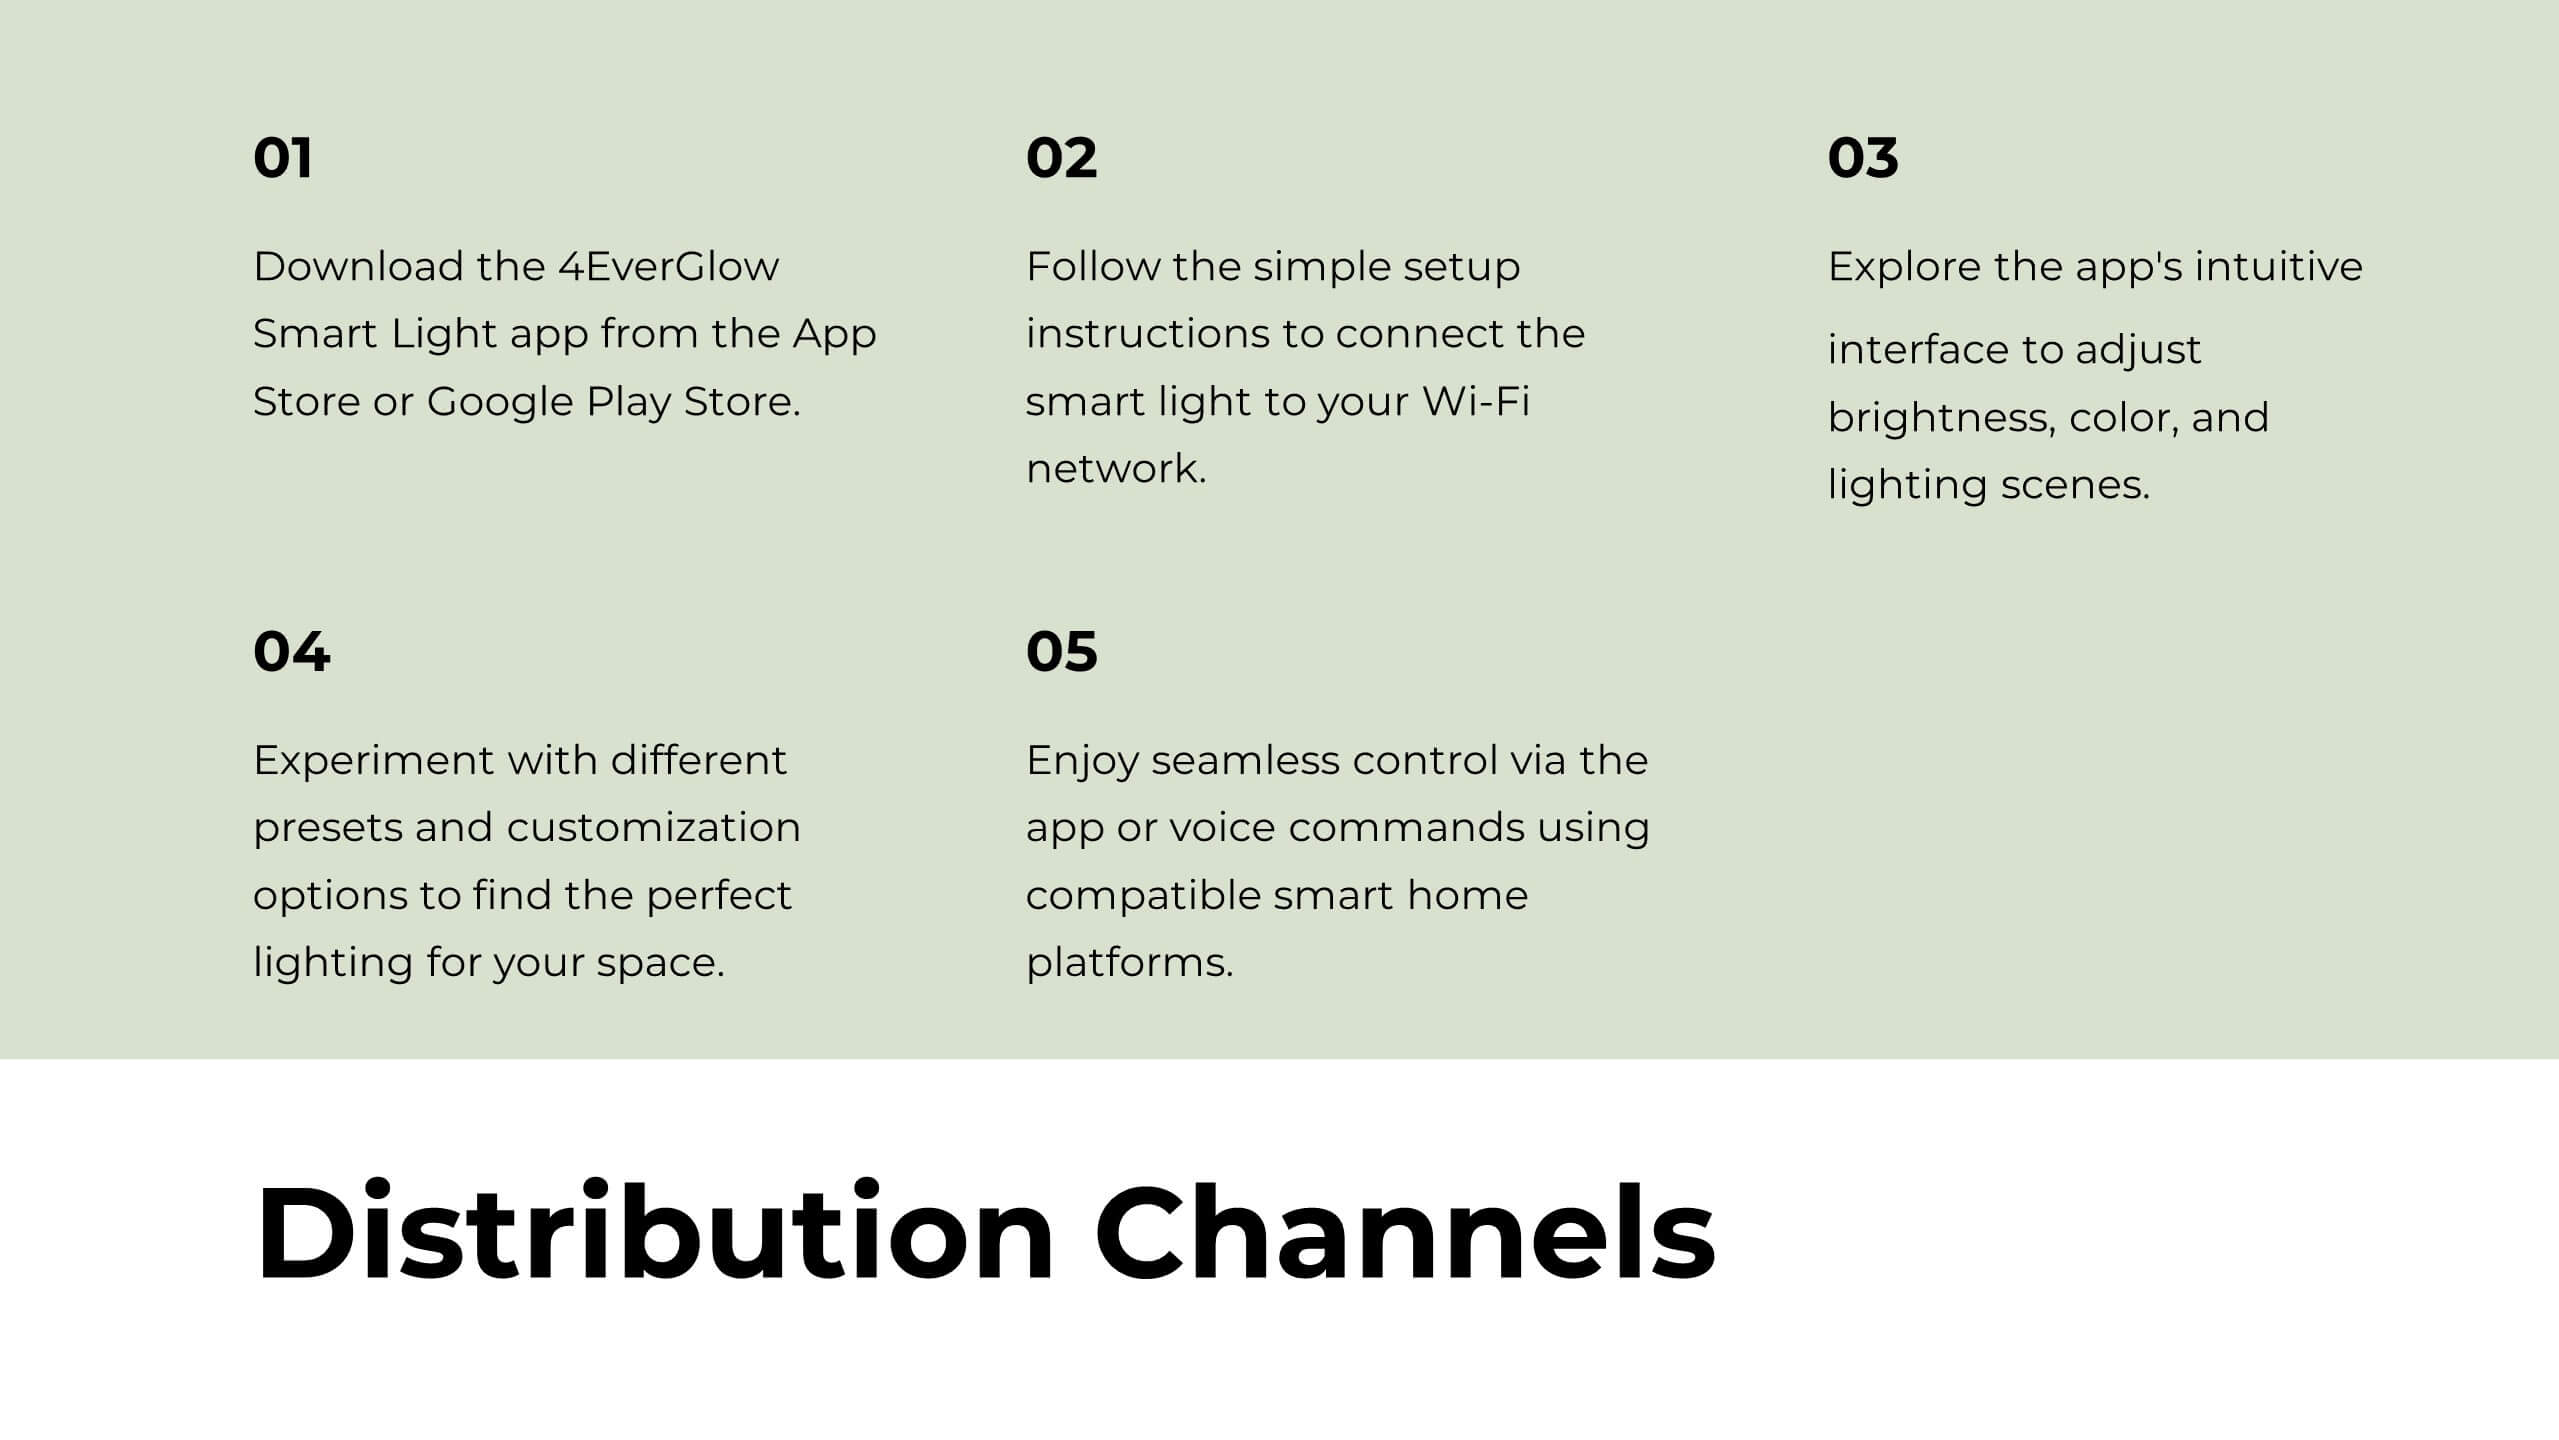
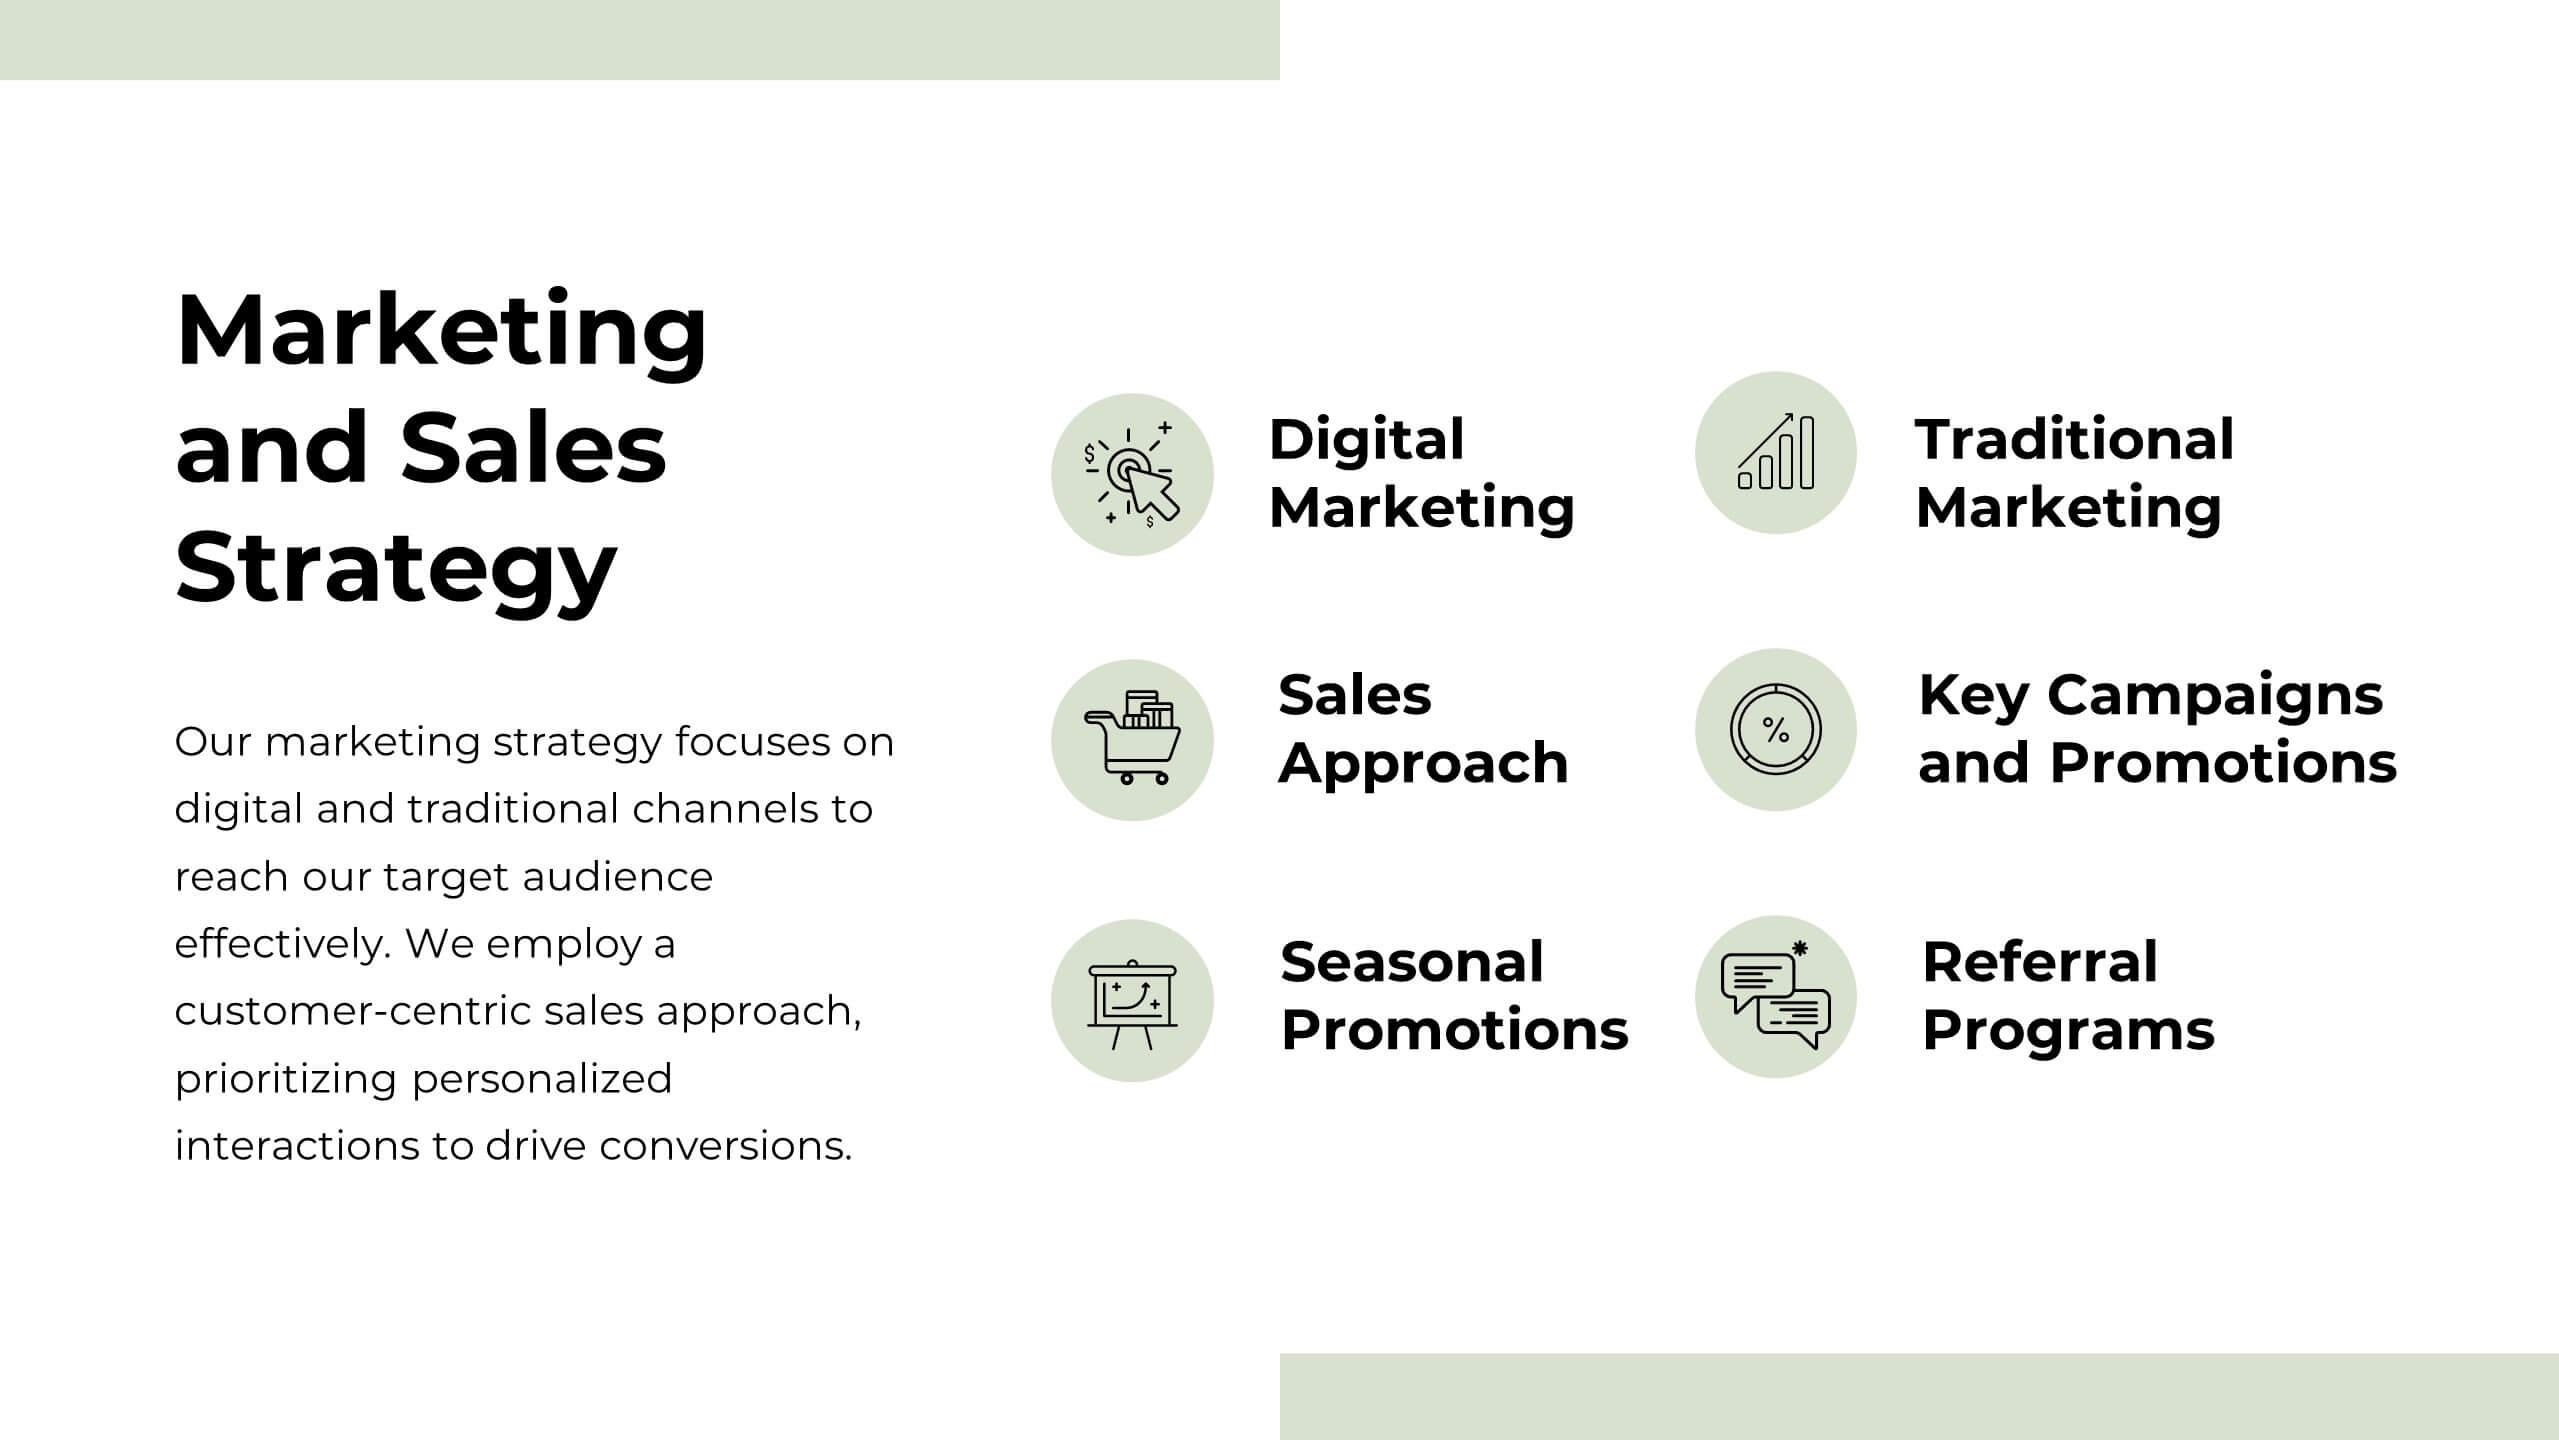
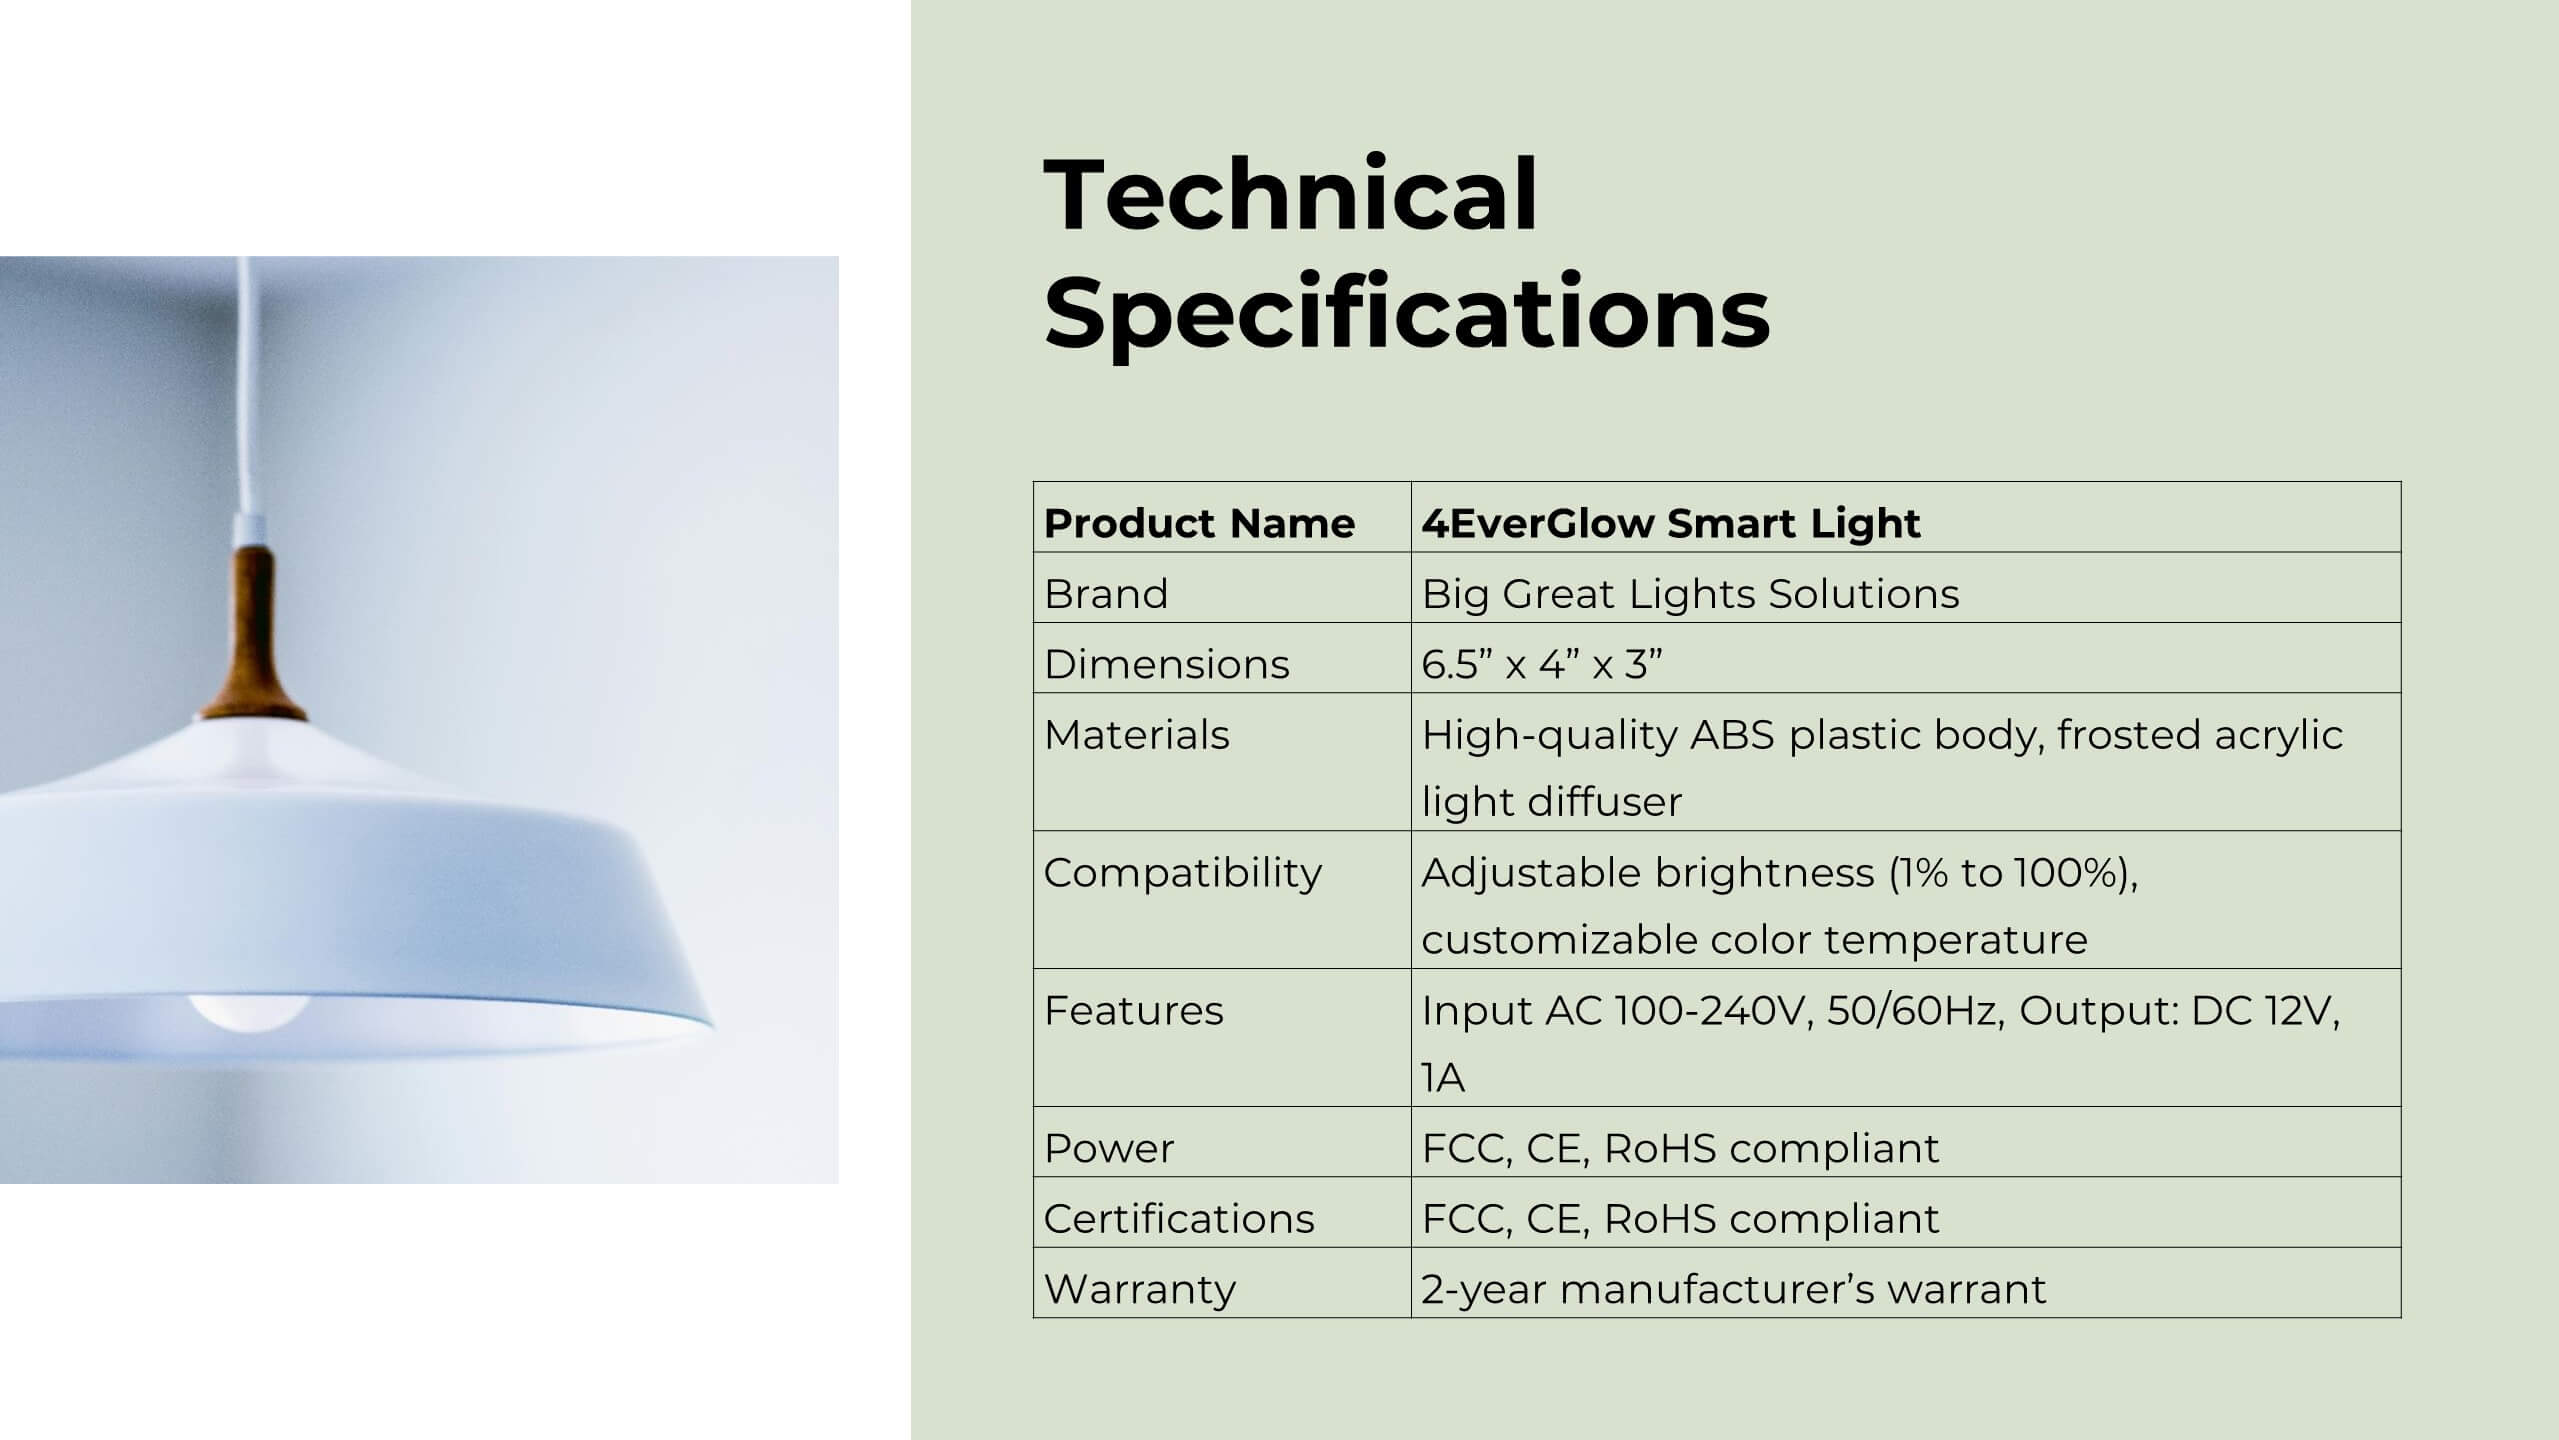
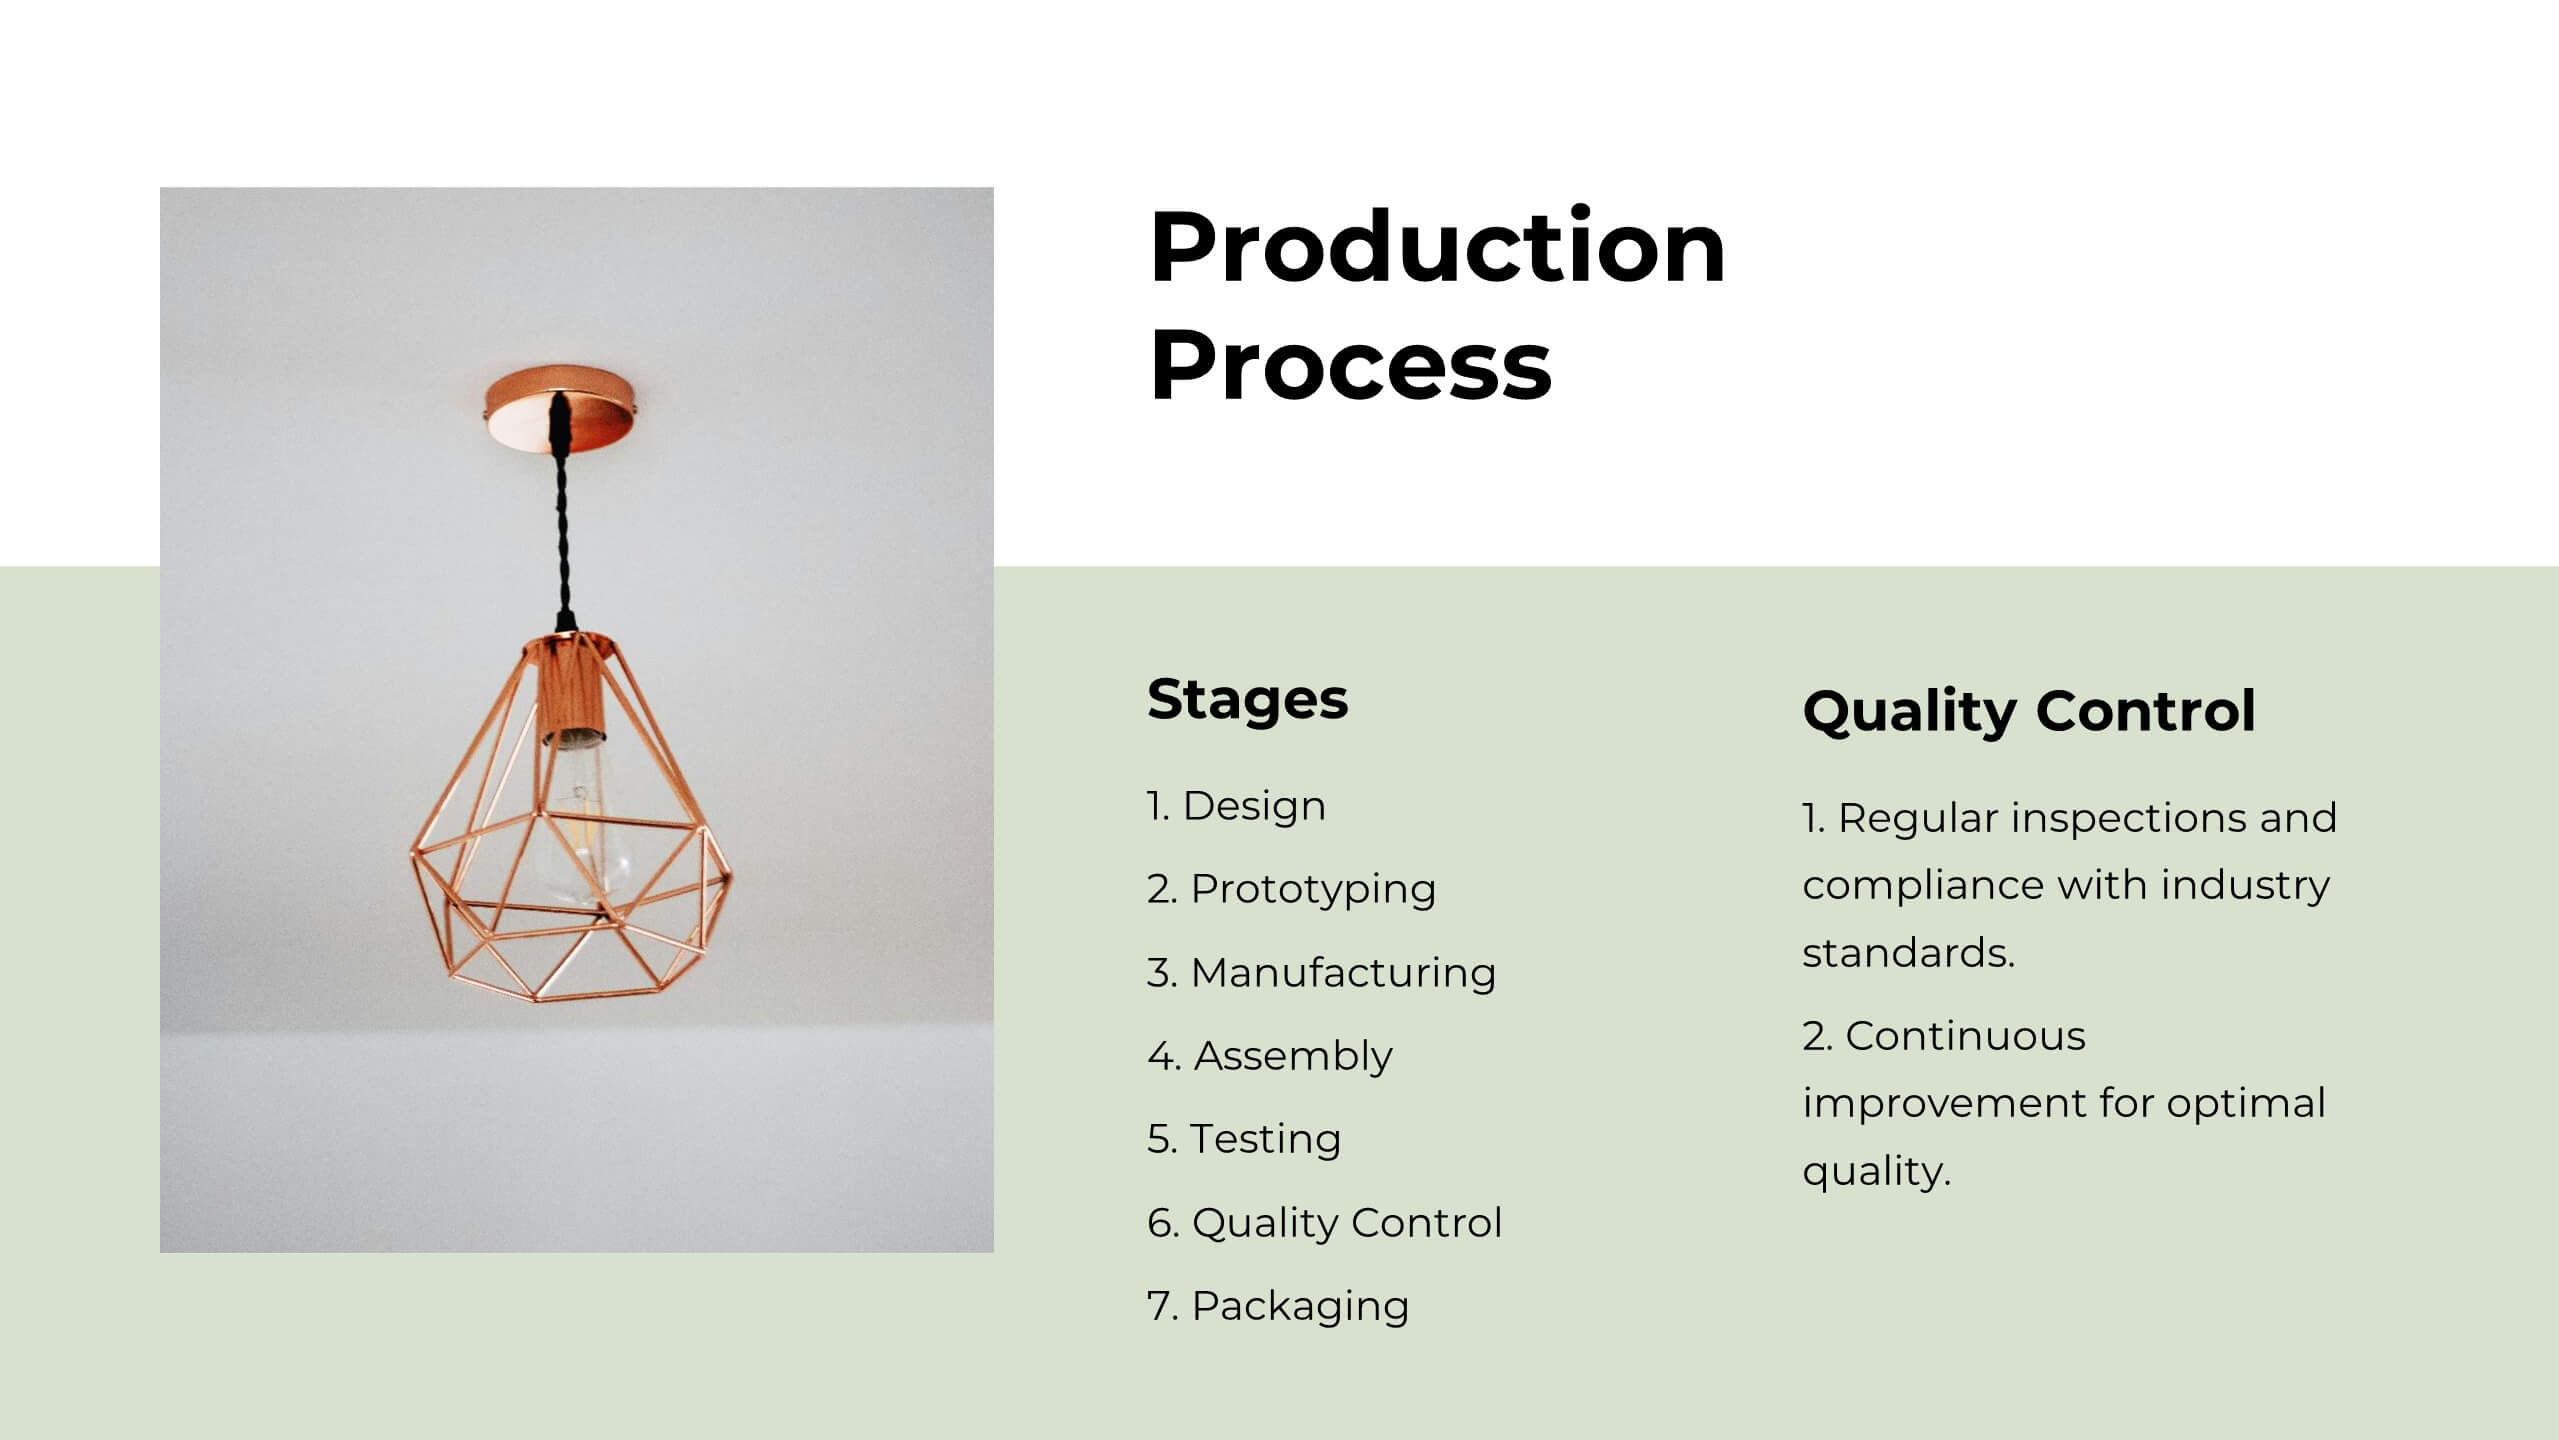
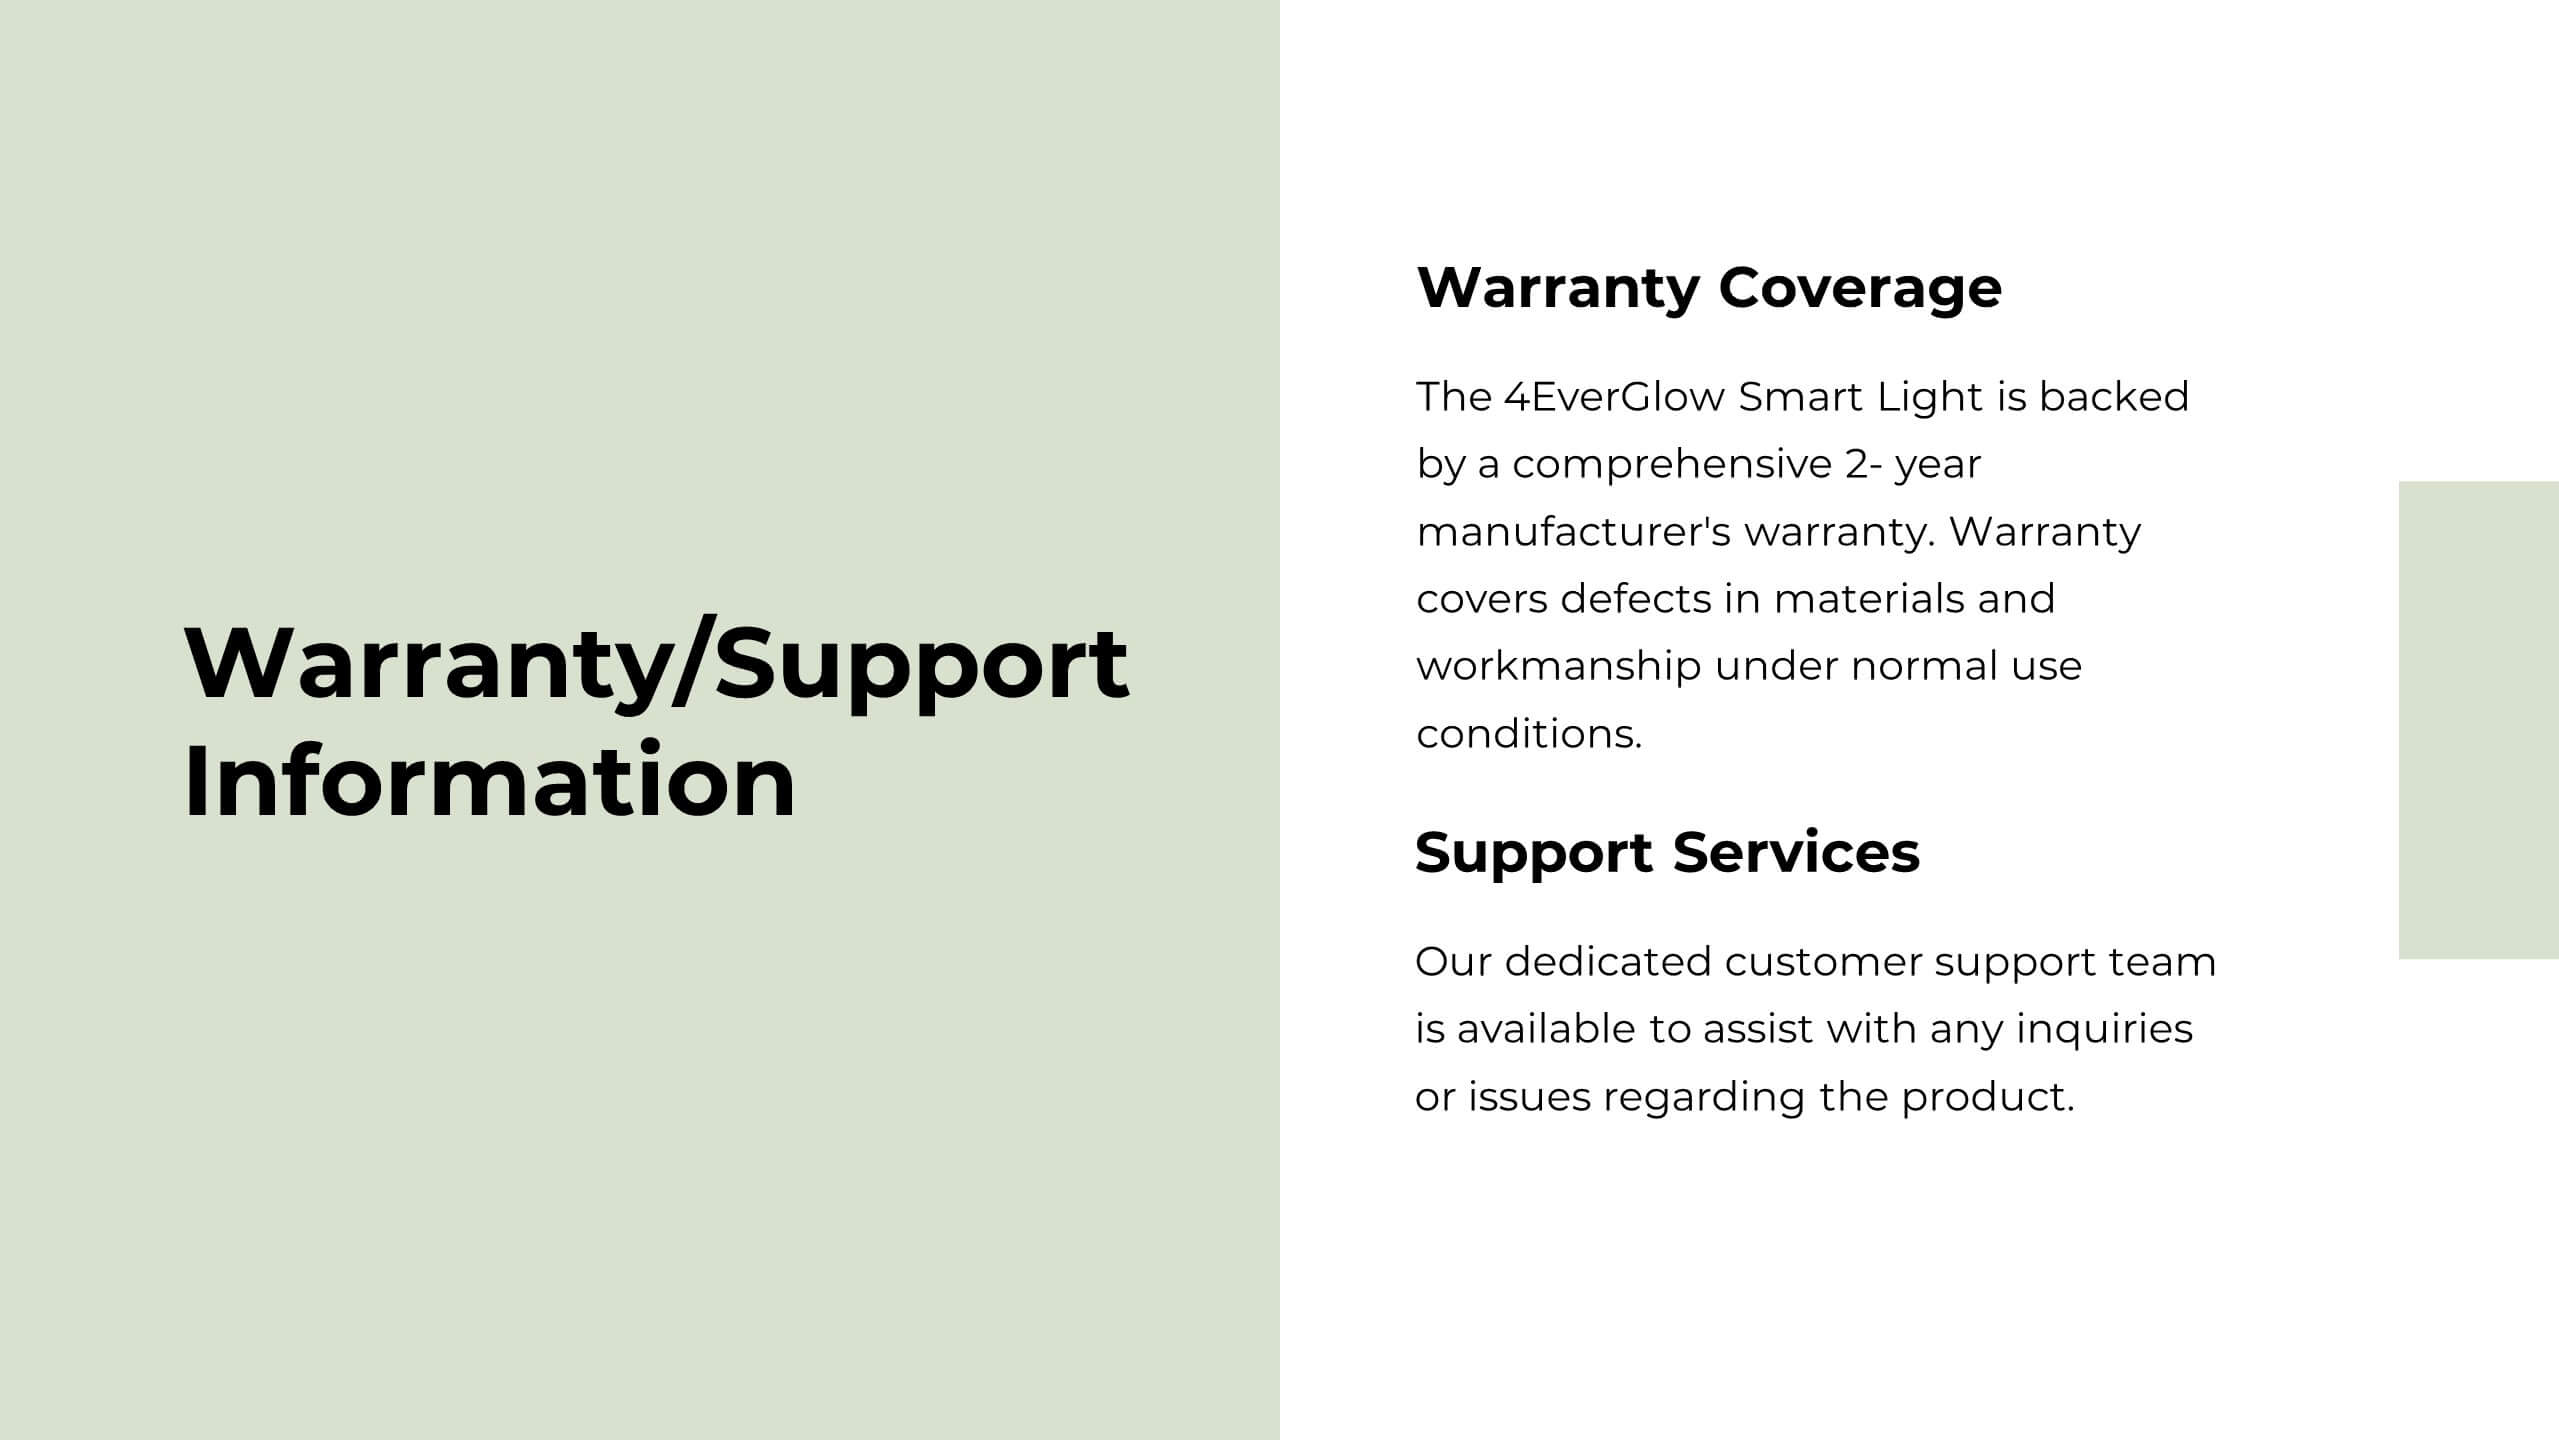
Versa Product Development Plan Presentation
Bring your product ideas to life with this sleek and professional presentation template. It covers every stage of the development process: from product overviews, features, and competitive analysis to pricing strategies, marketing plans, and technical specifications. Visually striking sections like distribution channels and production processes ensure a clear and structured roadmap for your team and stakeholders. Fully customizable and compatible with PowerPoint, Keynote, and Google Slides.


21 diapositivas
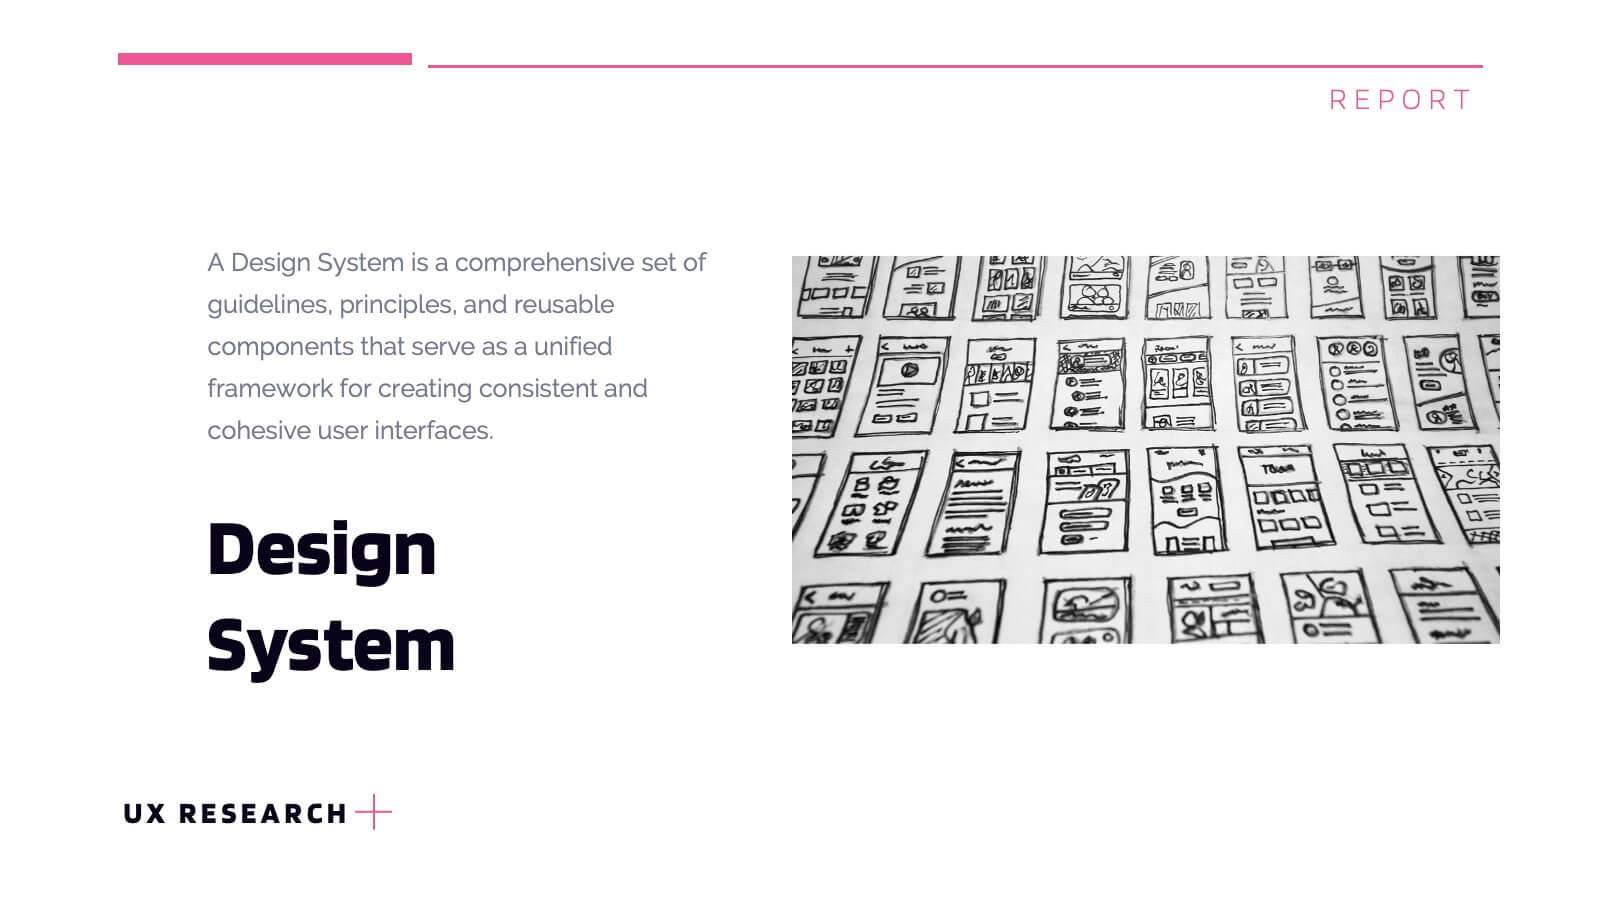
Lumascend UX Research Report Presentation
Present your UX research findings with clarity using this engaging and organized template! Covering key areas like user personas, wireframes, testing, and interaction design, it ensures all aspects of your design process are communicated effectively. Perfect for UX teams, stakeholders, or client presentations, this template works seamlessly with PowerPoint, Keynote, and Google Slides.


5 diapositivas
Sustainable Growth and Green Policy Presentation
Showcase your eco-initiatives with the Sustainable Growth and Green Policy Presentation. This unique leaf-shaped diagram highlights four key environmental pillars—ideal for presenting climate strategies, energy policies, or green development goals. With a sleek and modern design, it’s perfect for NGOs, government briefings, or corporate sustainability reports. Editable in Canva, PowerPoint, Keynote, and Google Slides.


8 diapositivas
Creative SWOT Breakdown for Business Insight
Analyze your business from every angle with the Creative SWOT Breakdown for Business Insight Presentation. This bold, suitcase-style layout visually separates Strengths, Weaknesses, Opportunities, and Threats with color-coded blocks and percentage highlights for quick comparisons. Designed to simplify strategic analysis, it’s ideal for planning meetings, team workshops, or executive reviews. Fully customizable in PowerPoint, Keynote, and Google Slides.


5 diapositivas
Employee Training Roadmap Presentation
Take your team on a visual journey that maps out success, one milestone at a time. This roadmap presentation is perfect for outlining employee training stages in a clear, engaging way. Each point leads naturally to the next. Fully editable and compatible with PowerPoint, Keynote, and Google Slides for seamless use.


22 diapositivas
Vivid Creative Agency Pitch Deck Presentation
This sleek creative agency template is ideal for presenting your company's mission, services, and success stories. With a minimalist design, it offers a professional yet stylish approach to showcase case studies, industry trends, and partnership opportunities. It’s perfect for PowerPoint, Keynote, and Google Slides, making your agency stand out with every slide.


8 diapositivas
Success Strategy Triangle Presentation
Craft a winning strategy with the Success Strategy Triangle template. This structured design helps visualize key business components in a step-by-step format, making it ideal for growth planning, decision-making, and performance analysis. Fully customizable and easy to use, it’s compatible with PowerPoint, Keynote, and Google Slides for seamless integration.


4 diapositivas
Restaurant Menu Design Showcase Presentation
Showcase your food offerings with this stylish Restaurant Menu Design Template. Divided into clear sections—Menu, Drinks, and Desserts—it’s perfect for restaurants, cafés, or pop-up events. Fully editable in PowerPoint, Keynote, and Google Slides, this layout lets you present items cleanly with bold titles and organized structure for easy viewing.


26 diapositivas
Jenzen Presentation Template
Jenzen is a modern multi-purpose template with warm tones for coaching and investing. Jenzen is suitable for all types of businesses Its slide designs can be used in conjunction with each other, making it perfect for sharing information about the various services available to customers. It's easy to use, resulting in high quality presentations. Its slide designs can be used with each other to create more elaborate presentations complete with charts, images and text boxes. It's simple yet stylish design makes it easy for anyone to use and is for both personal use as well as professional use.