


Características


¿Tienes alguna pregunta?
Recomendar


7 diapositivas
Pricing Comparison Table Infographic
Dive into the strategic world of pricing with our intricately designed pricing table infographic. Imbued with the trustworthiness of blue, the crisp clarity of white, the optimism of yellow, and the urgency of red, our template visualizes pricing strategies in an engaging manner. Furnished with detailed infographics, distinct icons, and adaptable image placeholders, it translates complex pricing data into an easy-to-grasp format. Seamlessly crafted for Powerpoint, Keynote, or Google Slides. A vital asset for business analysts, marketers, sales professionals, or any brand strategizing its pricing model. Engage your audience; let every slide be a value proposition.


4 diapositivas
Artificial Intelligence Use Cases Overview Presentation
Navigate a maze of insights with this creative template designed to showcase real-world tech applications in a visually engaging way. Whether you're covering machine learning in healthcare or automation in customer service, this AI use case infographic keeps your points clear and organized. Works seamlessly in PowerPoint, Keynote, and Google Slides.


5 diapositivas
Banking Benefits Infographics
Banking offers several benefits that contribute to the efficient functioning of the economy and the financial well-being of individuals and businesses. These vertical infographics highlight the advantages and benefits of banking services. They are designed to help you communicate the value of banking to your audience in a clear and engaging manner. With these templates you can effectively communicate the value of banking services to your audience. The infographics are compatible with Powerpoint, Keynote, and Google slides, making them easily customizable to match your brand and data.


6 diapositivas
Strategic Project Proposal Overview
Present your project priorities with clarity using this bold and colorful Strategic Project Proposal slide. With five stacked segments, it’s ideal for outlining phases, features, or deliverables in a structured format. Fully editable in PowerPoint, Keynote, and Google Slides to suit any industry or workflow.


6 diapositivas
Social Comparison Infographics
The "Social Comparison" infographic template is a thought-provoking and detailed tool, expertly crafted for PowerPoint, Keynote, and Google Slides. This template is particularly useful for psychologists, sociologists, and educators who wish to explore and present the concept of social comparison, its impacts on individual behavior, and its role in society. This template delves into the various dimensions of social comparison, including upward and downward comparisons, the influence on self-esteem, and the effects on social cohesion. It's structured to provide a nuanced understanding of how individuals assess themselves relative to others, making it a valuable resource for educational seminars, psychological workshops, or social research presentations. The design is both engaging and reflective, with a color scheme that is subtle yet impactful. This ensures the presentation is not only visually appealing but also resonates with the complex and multifaceted nature of social comparison. Whether used in academic settings, counseling sessions, or social research meetings, this template ensures that the intricacies of "Social Comparison" are presented in a clear, insightful, and visually compelling manner.


22 diapositivas
Eclipser Qualitative Research Findings Presentation
This Qualitative Research Findings Presentation is designed to effectively showcase research insights with a clean and modern layout. It covers key areas such as research objectives, methodology, data analysis, findings, and recommendations. Fully customizable and compatible with PowerPoint, Keynote, and Google Slides for seamless editing and professional results.


8 diapositivas
Responsibility Assignment Overview Presentation
The Responsibility Assignment Overview Presentation is a practical and visually structured RACI matrix layout, ideal for clarifying team roles across multiple tasks. Featuring a clear grid system, it highlights who is Responsible, Accountable, Consulted, and Informed for each task—ensuring project accountability and team alignment. Each letter is color-coded for easy scanning, with editable placeholders for up to six tasks and roles. Perfect for project managers, HR professionals, and operations teams. Fully customizable in PowerPoint, Keynote, and Google Slides.
22 diapositivas
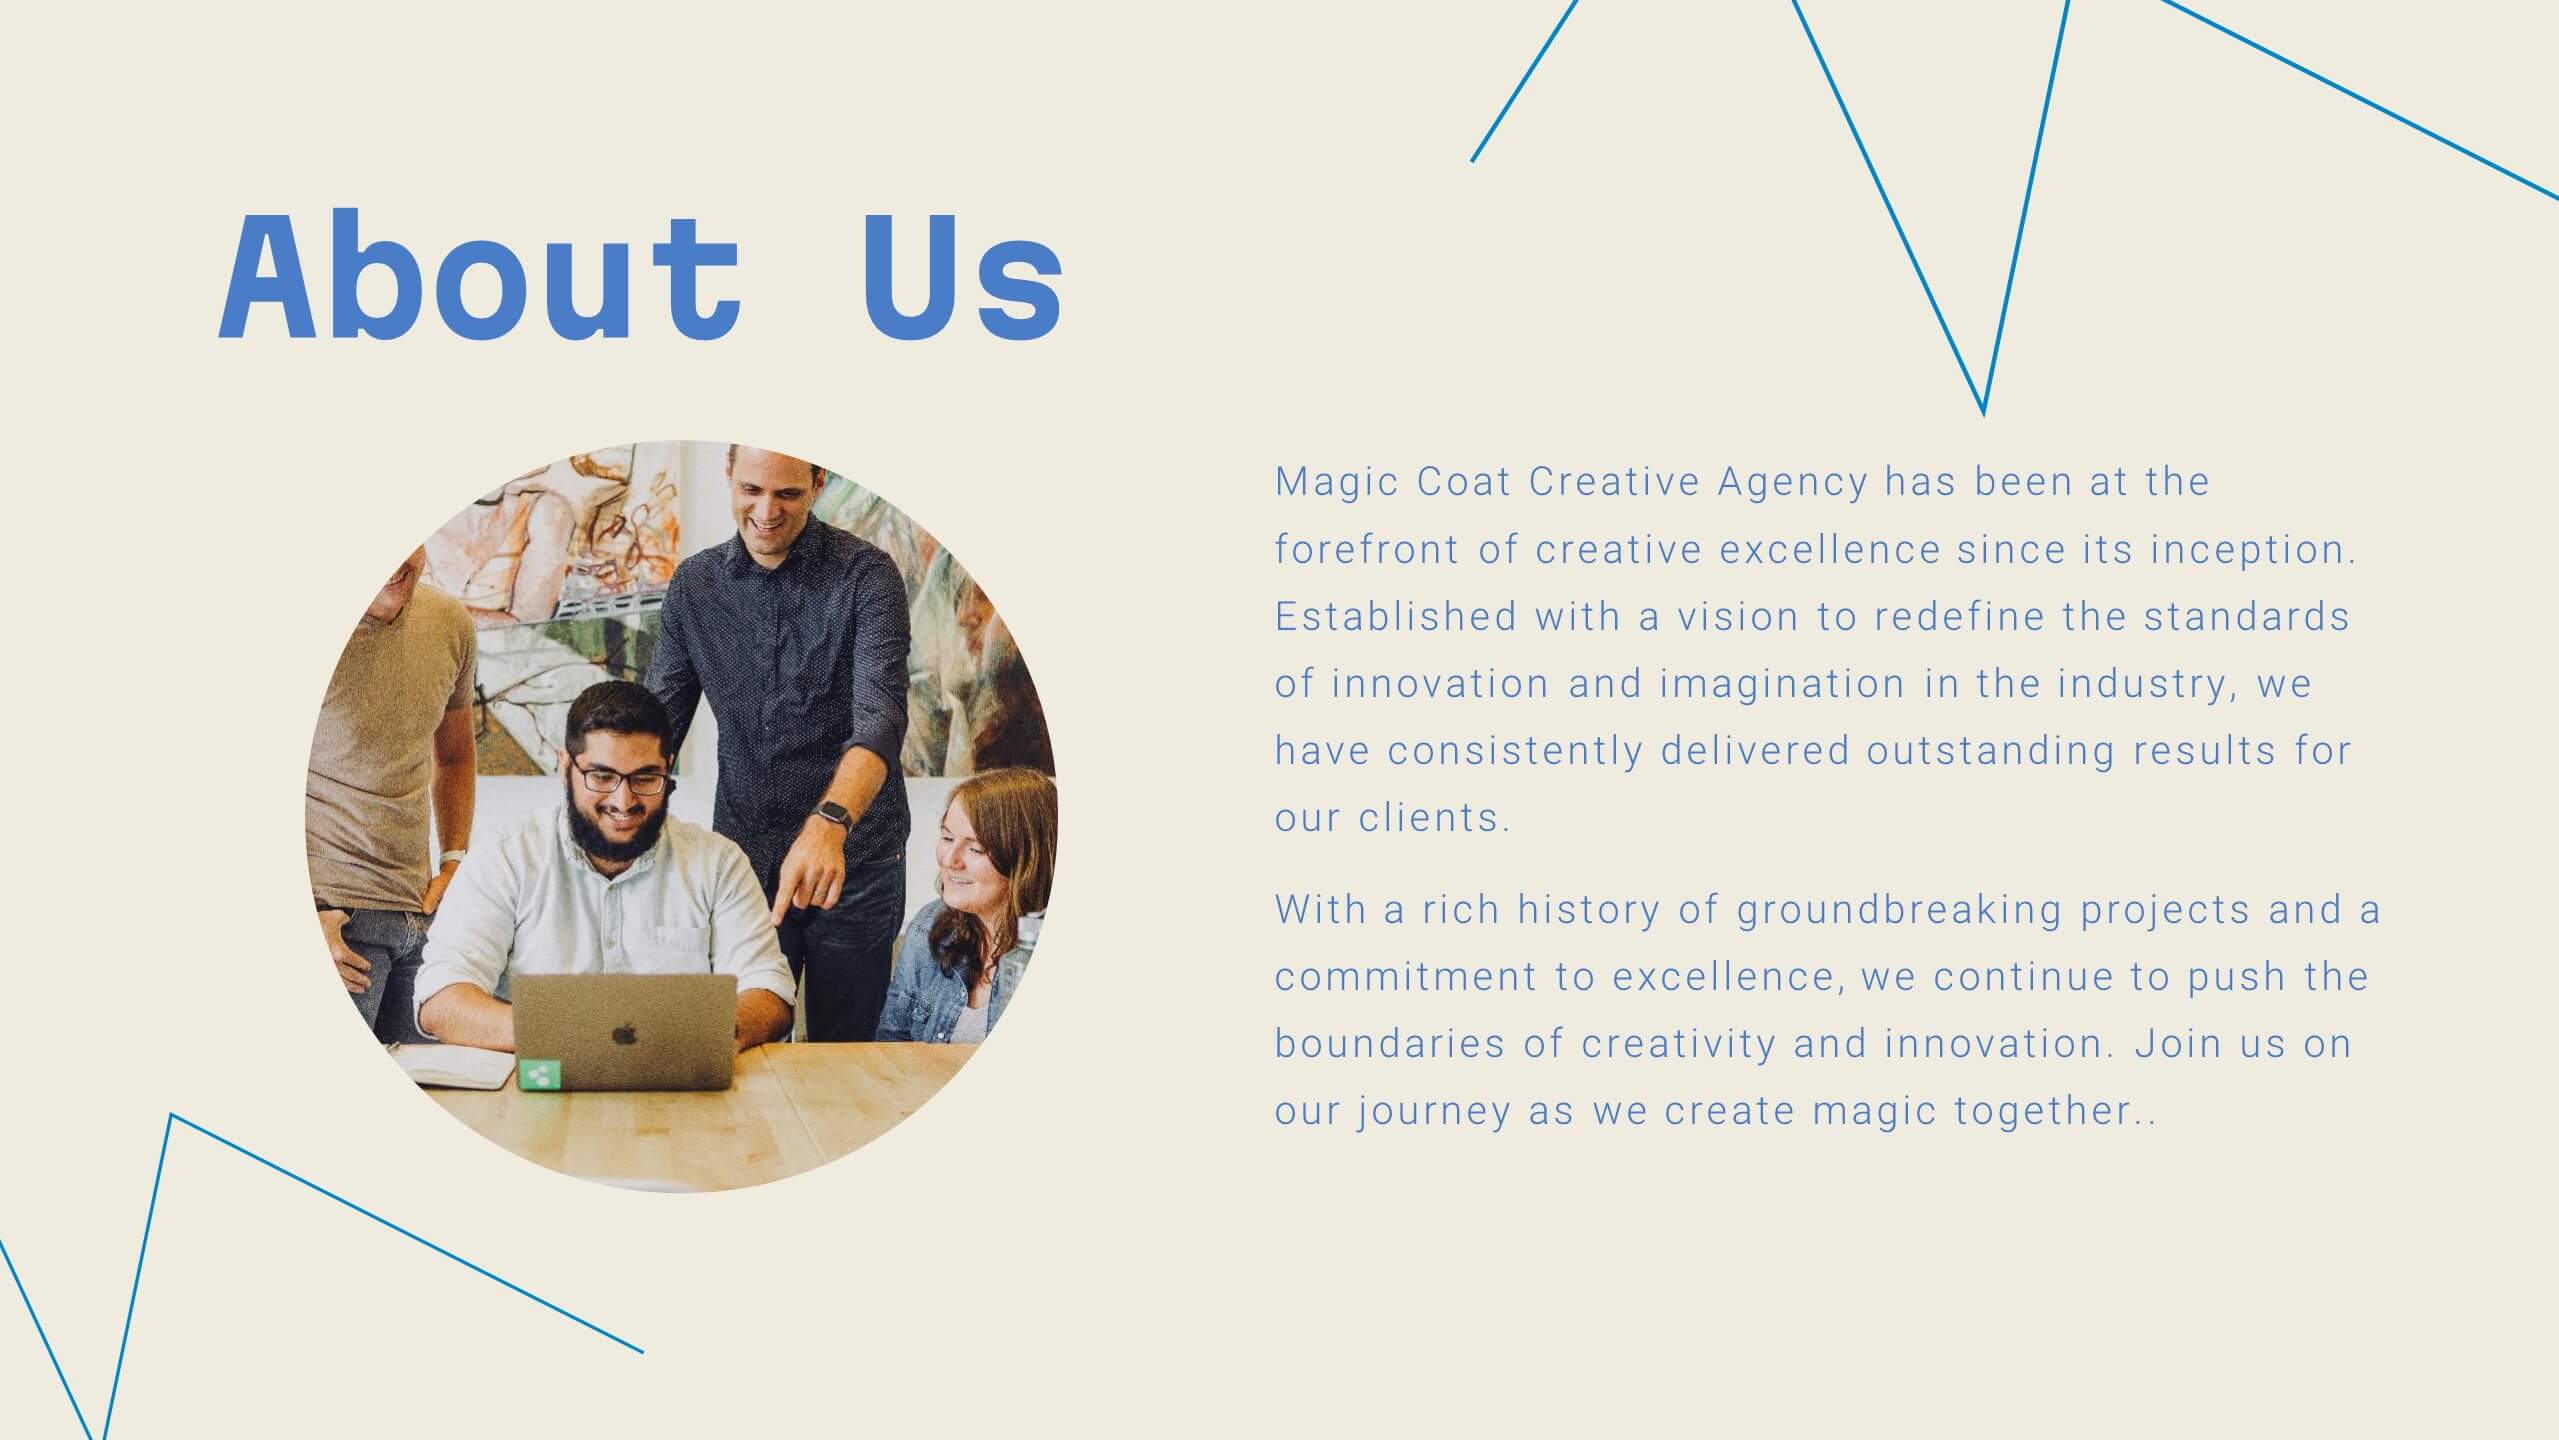
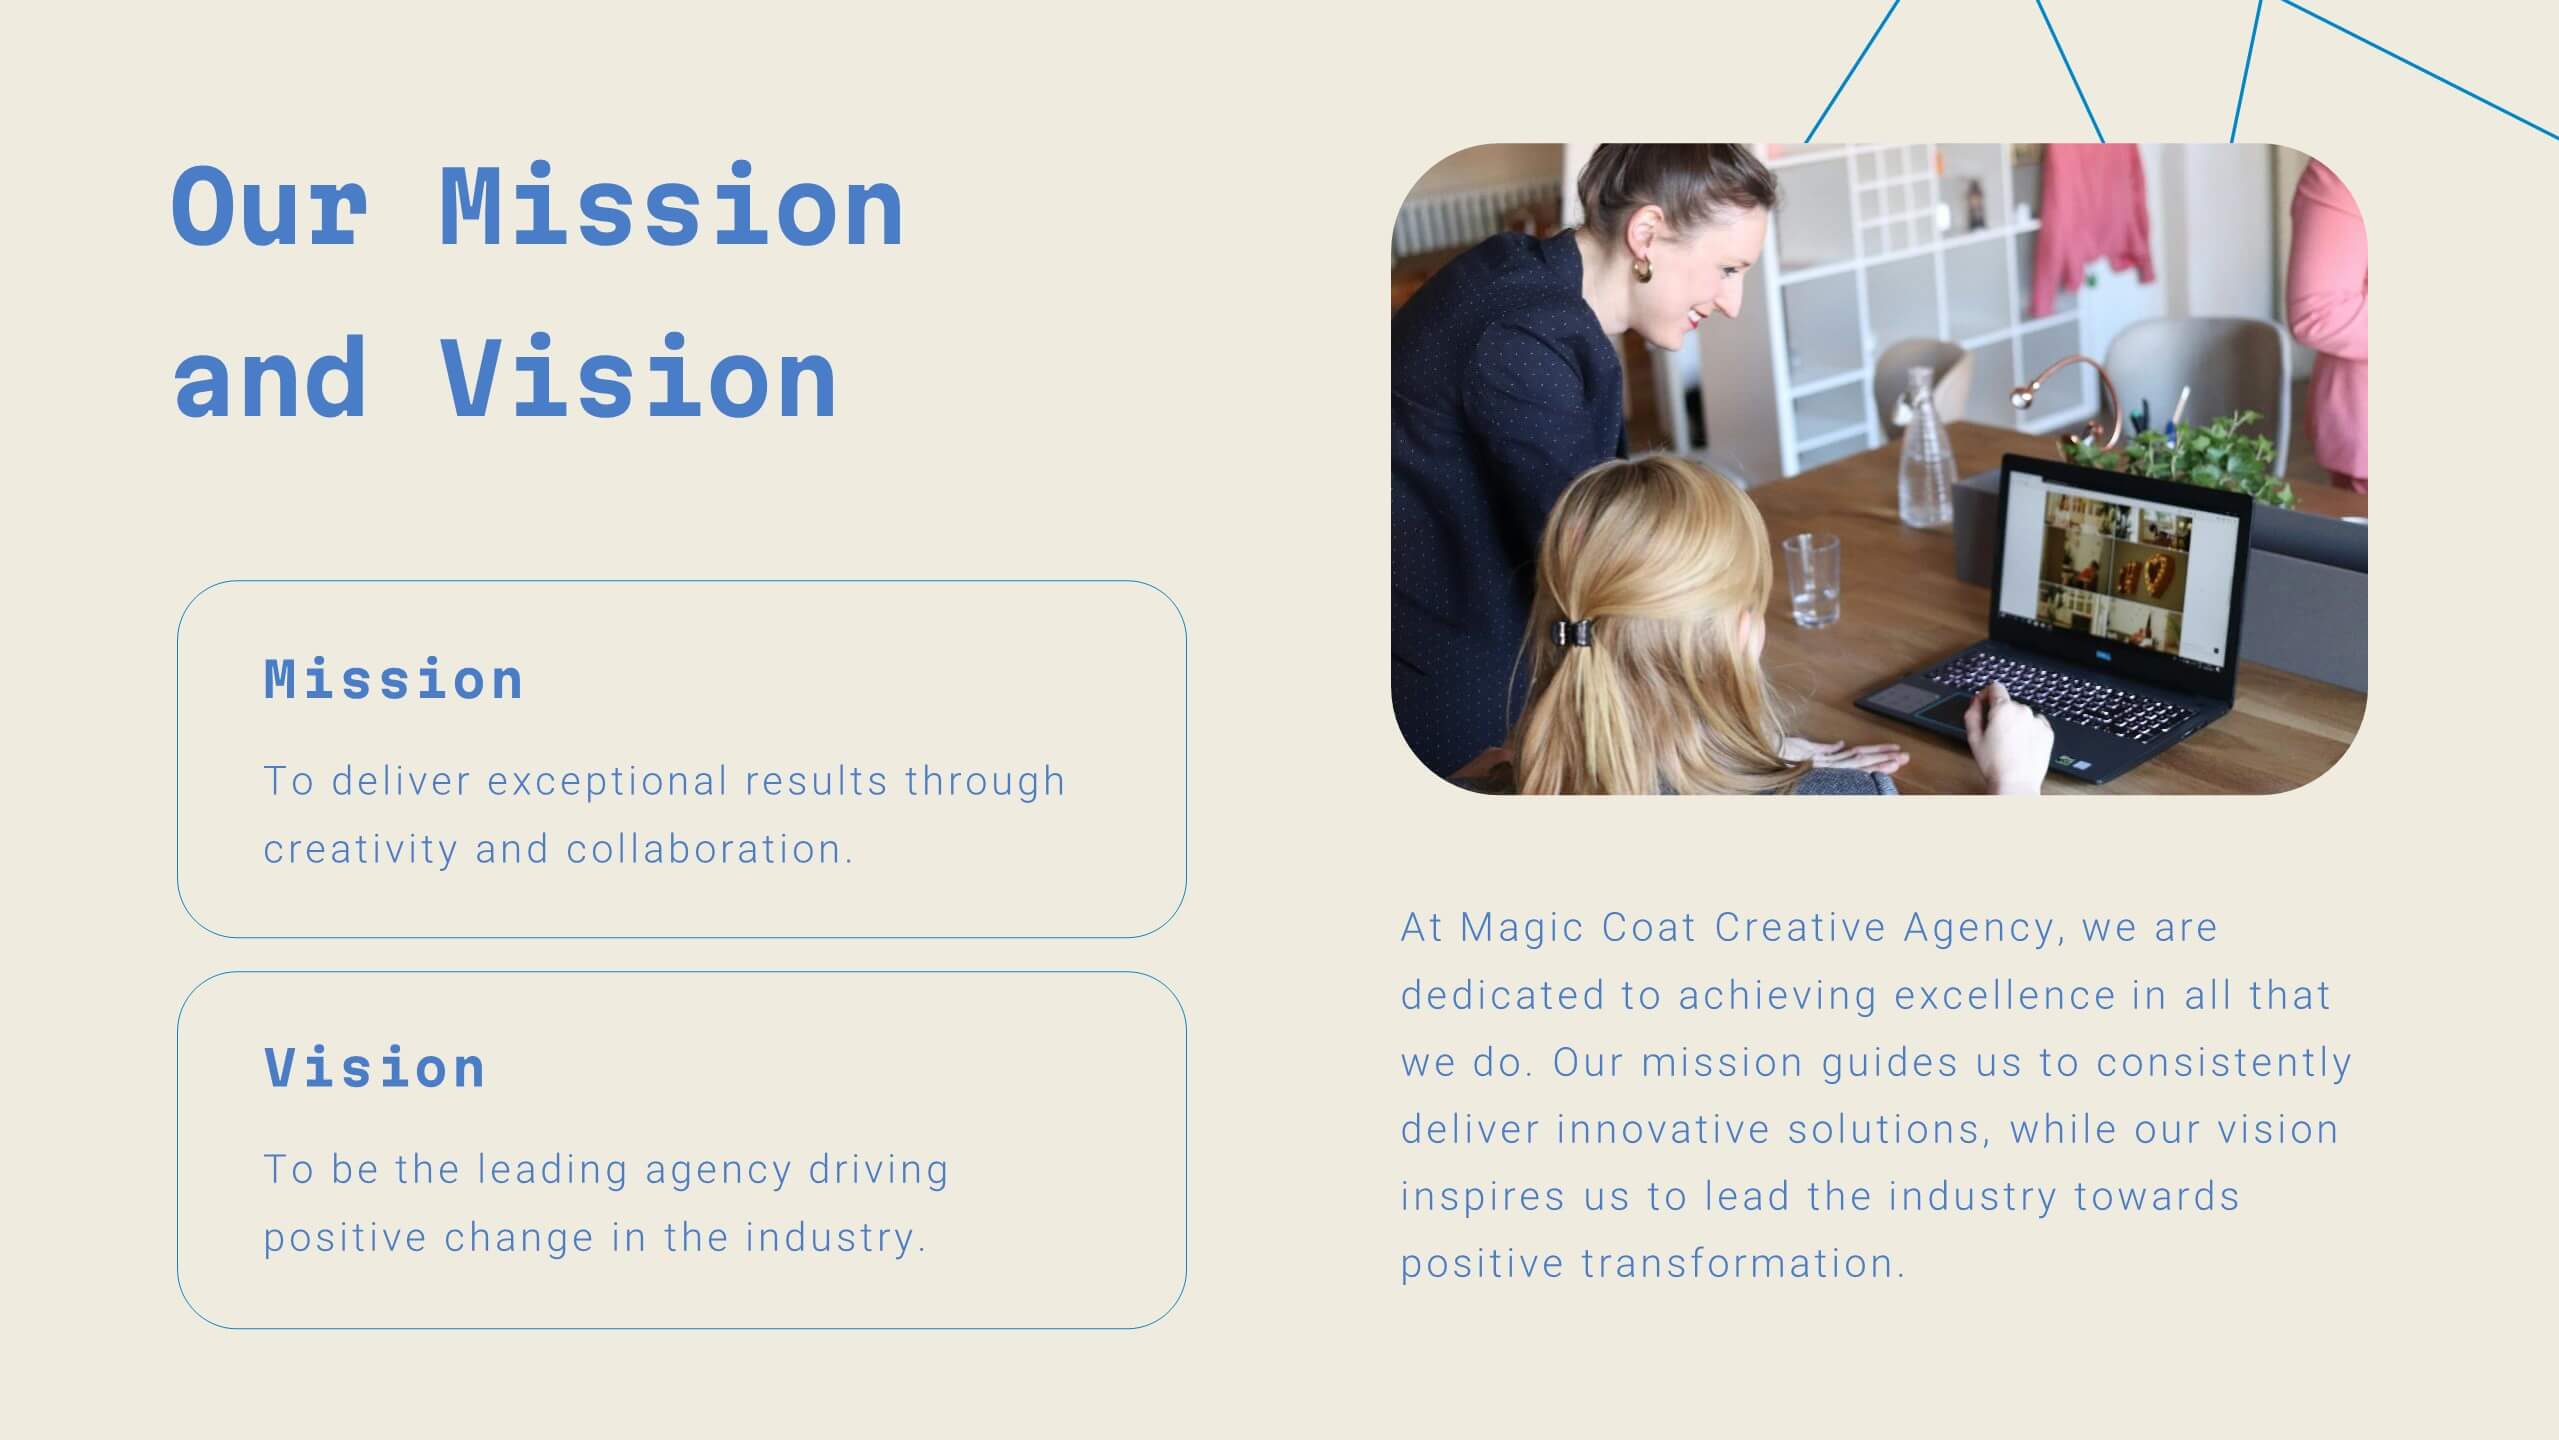
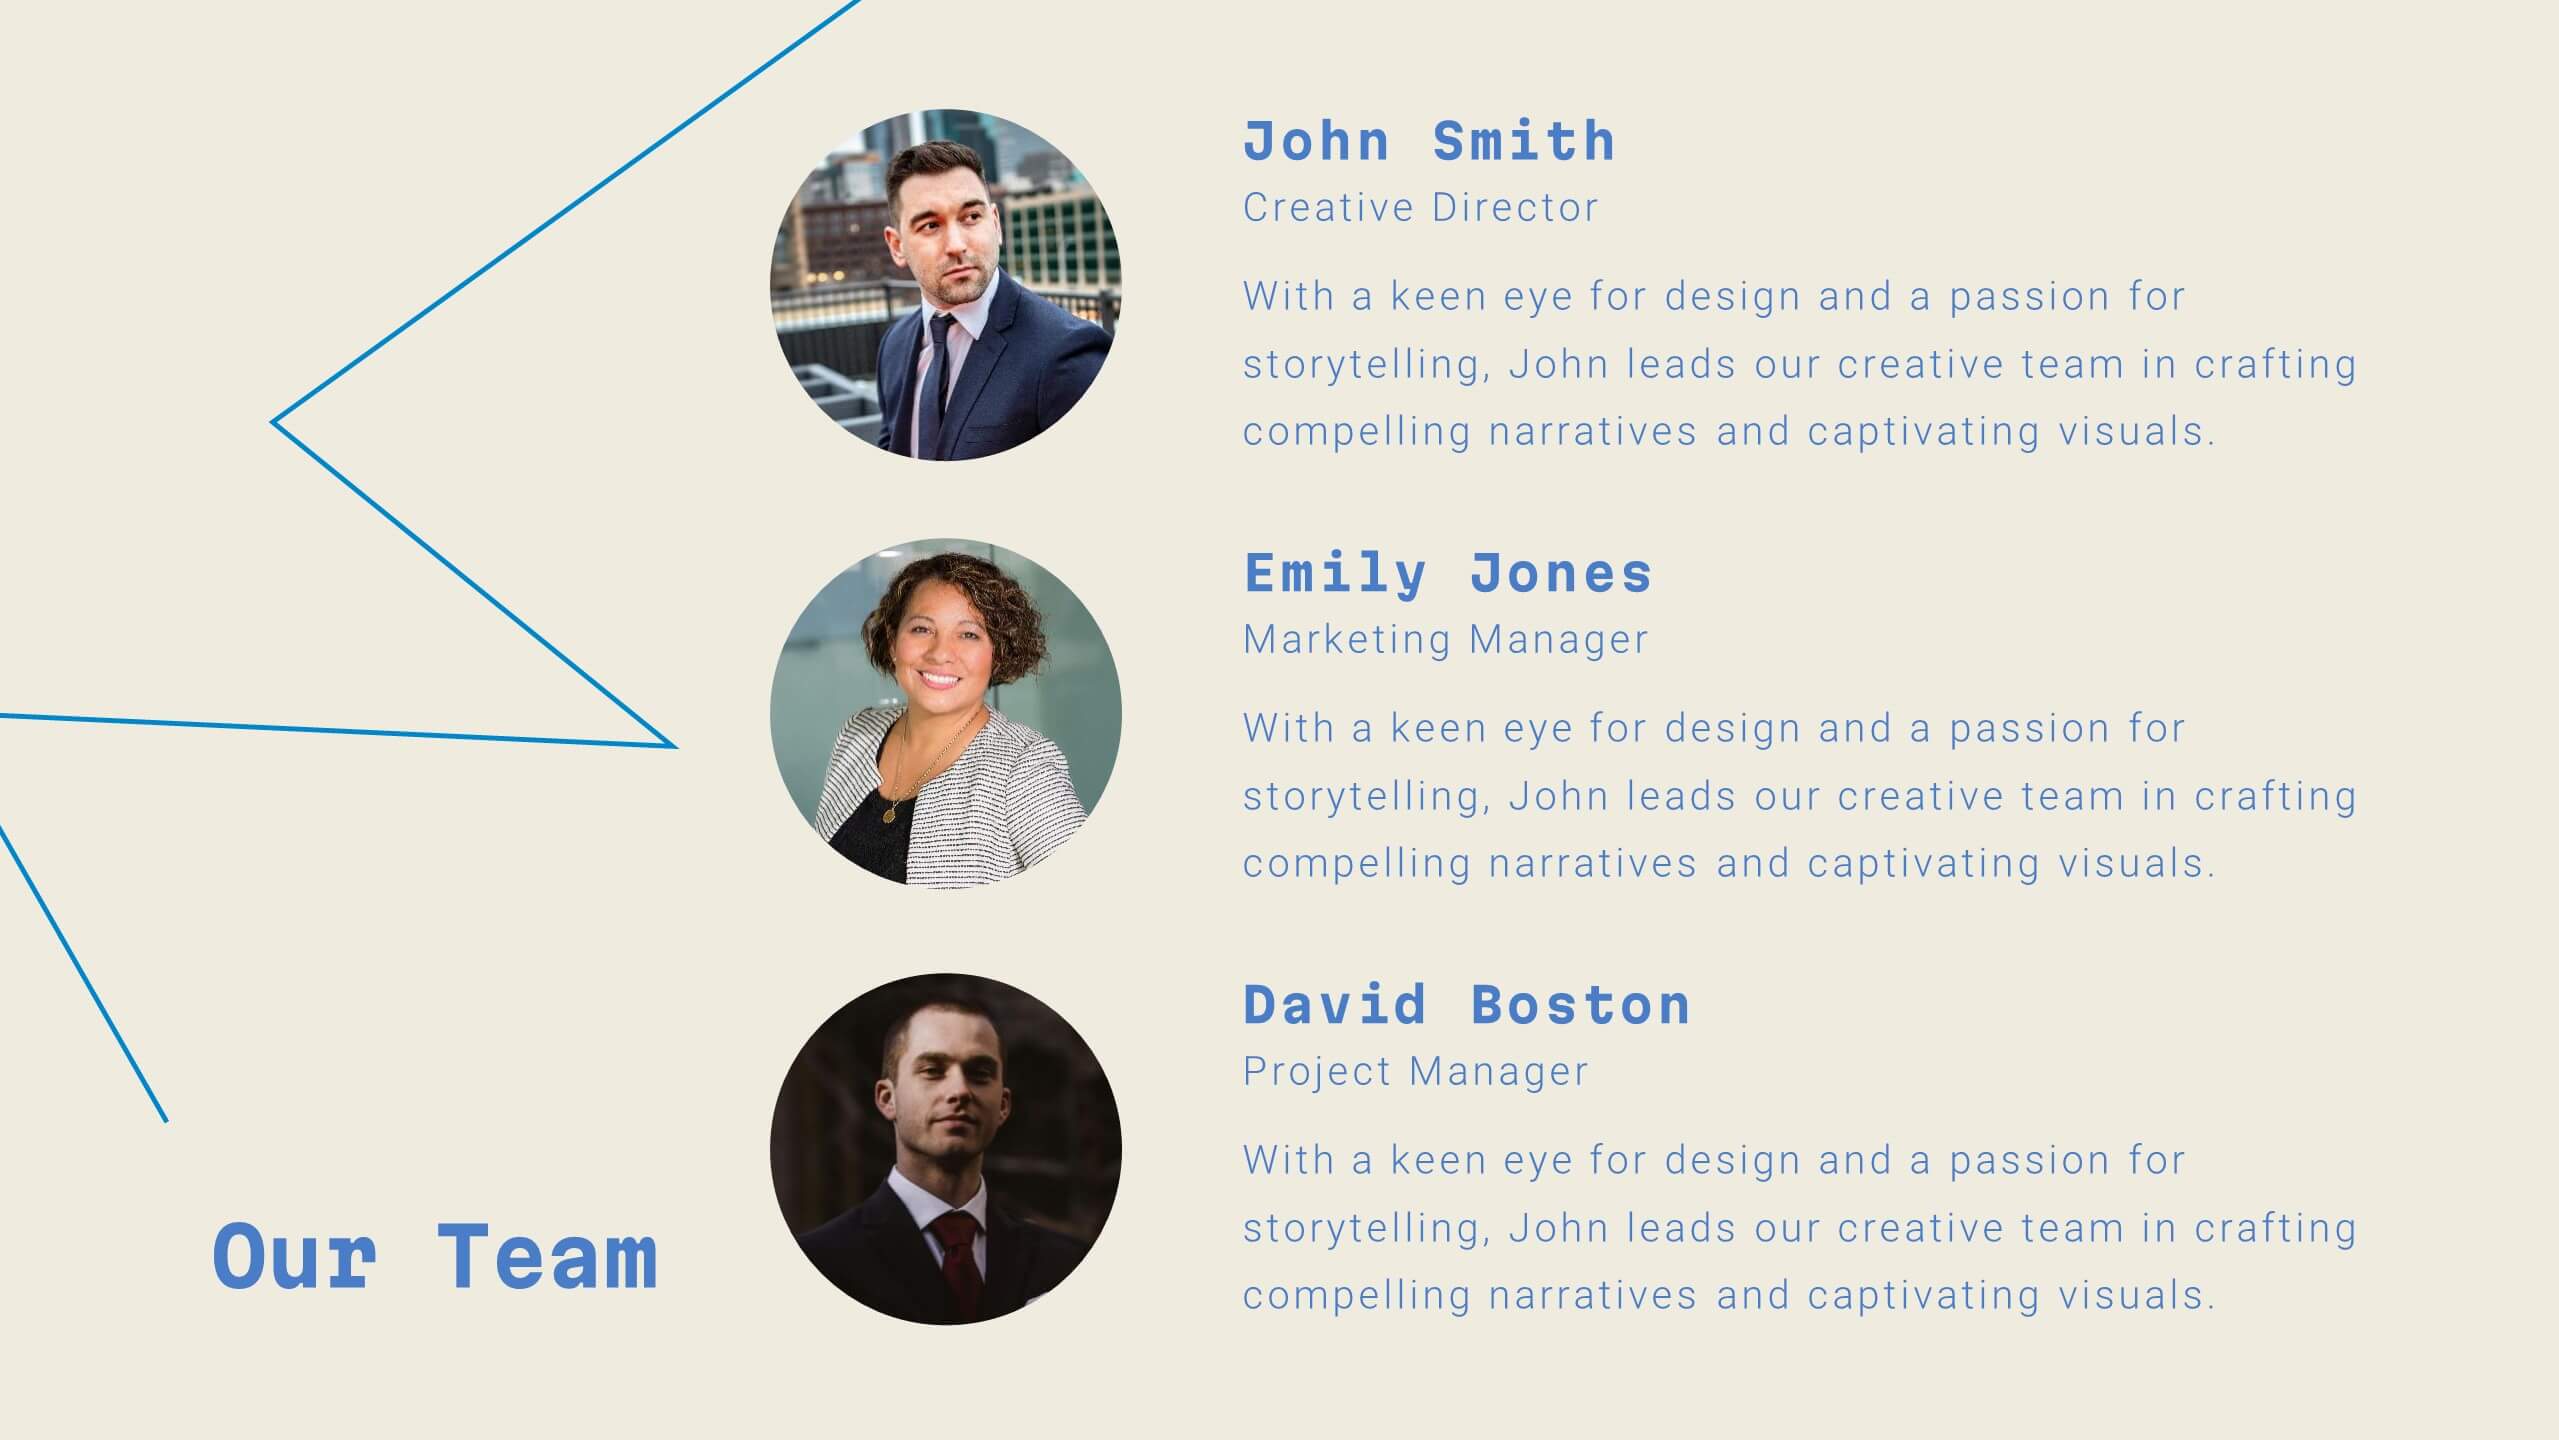
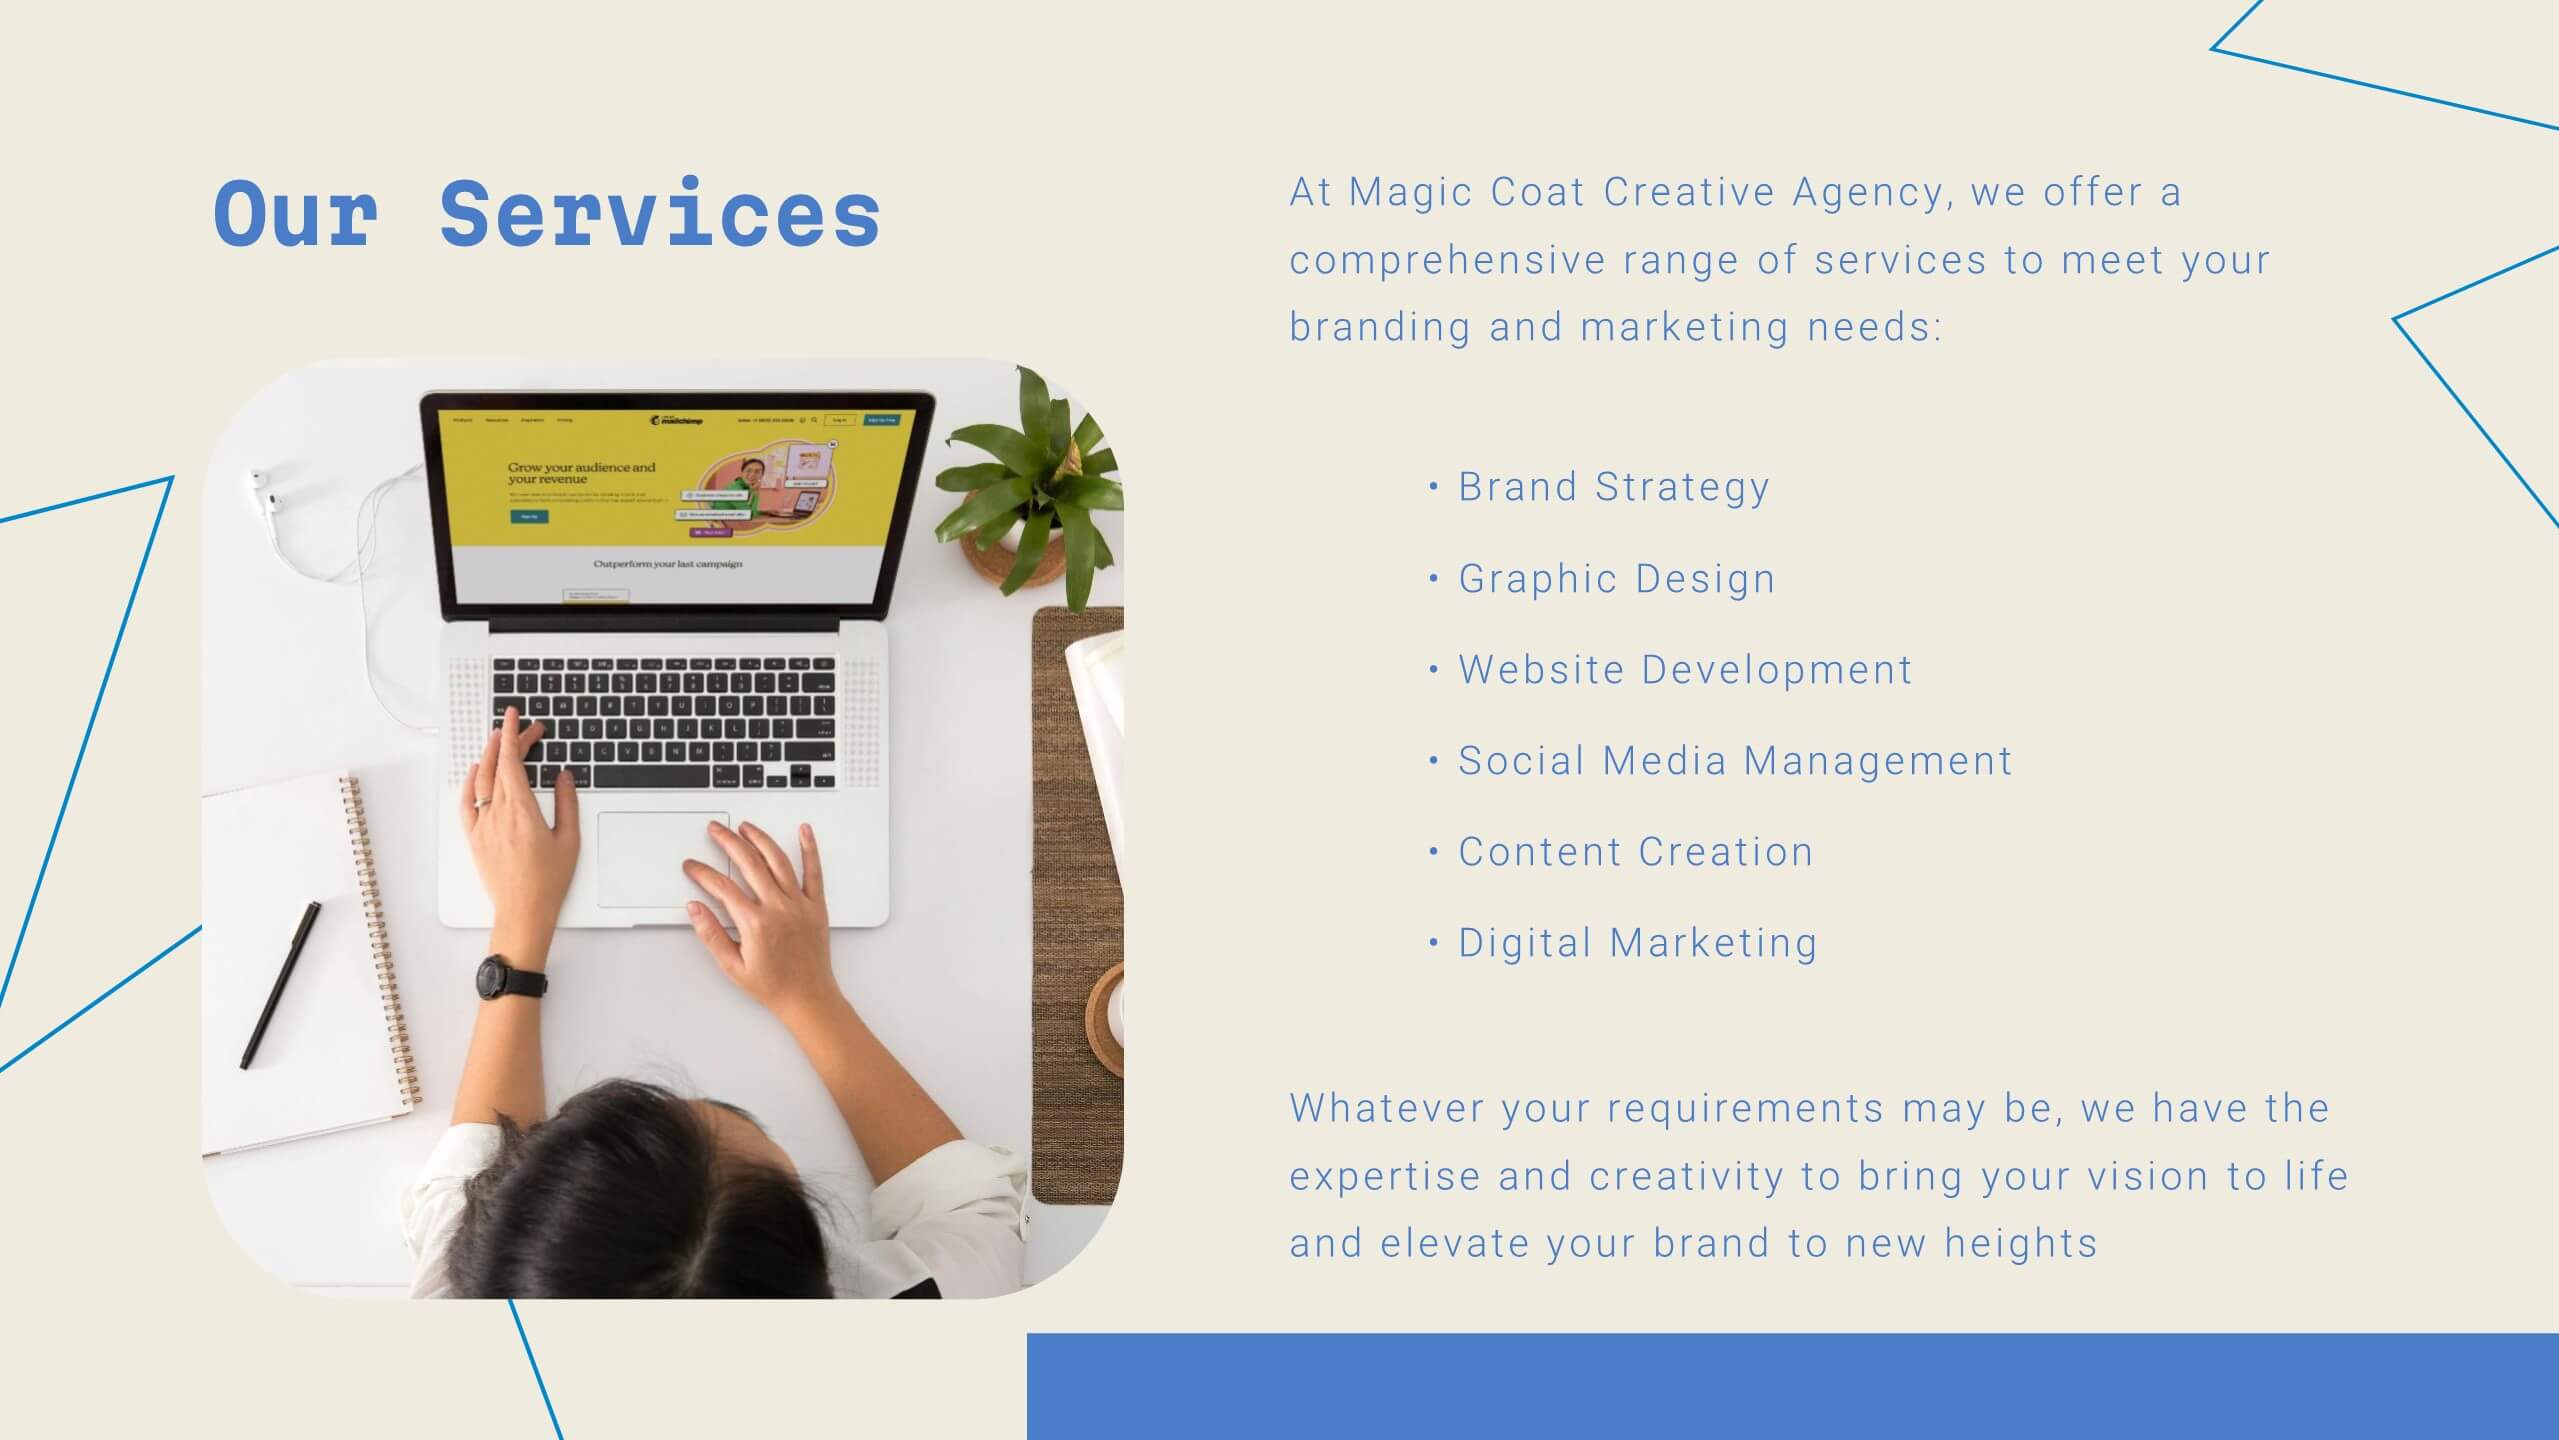
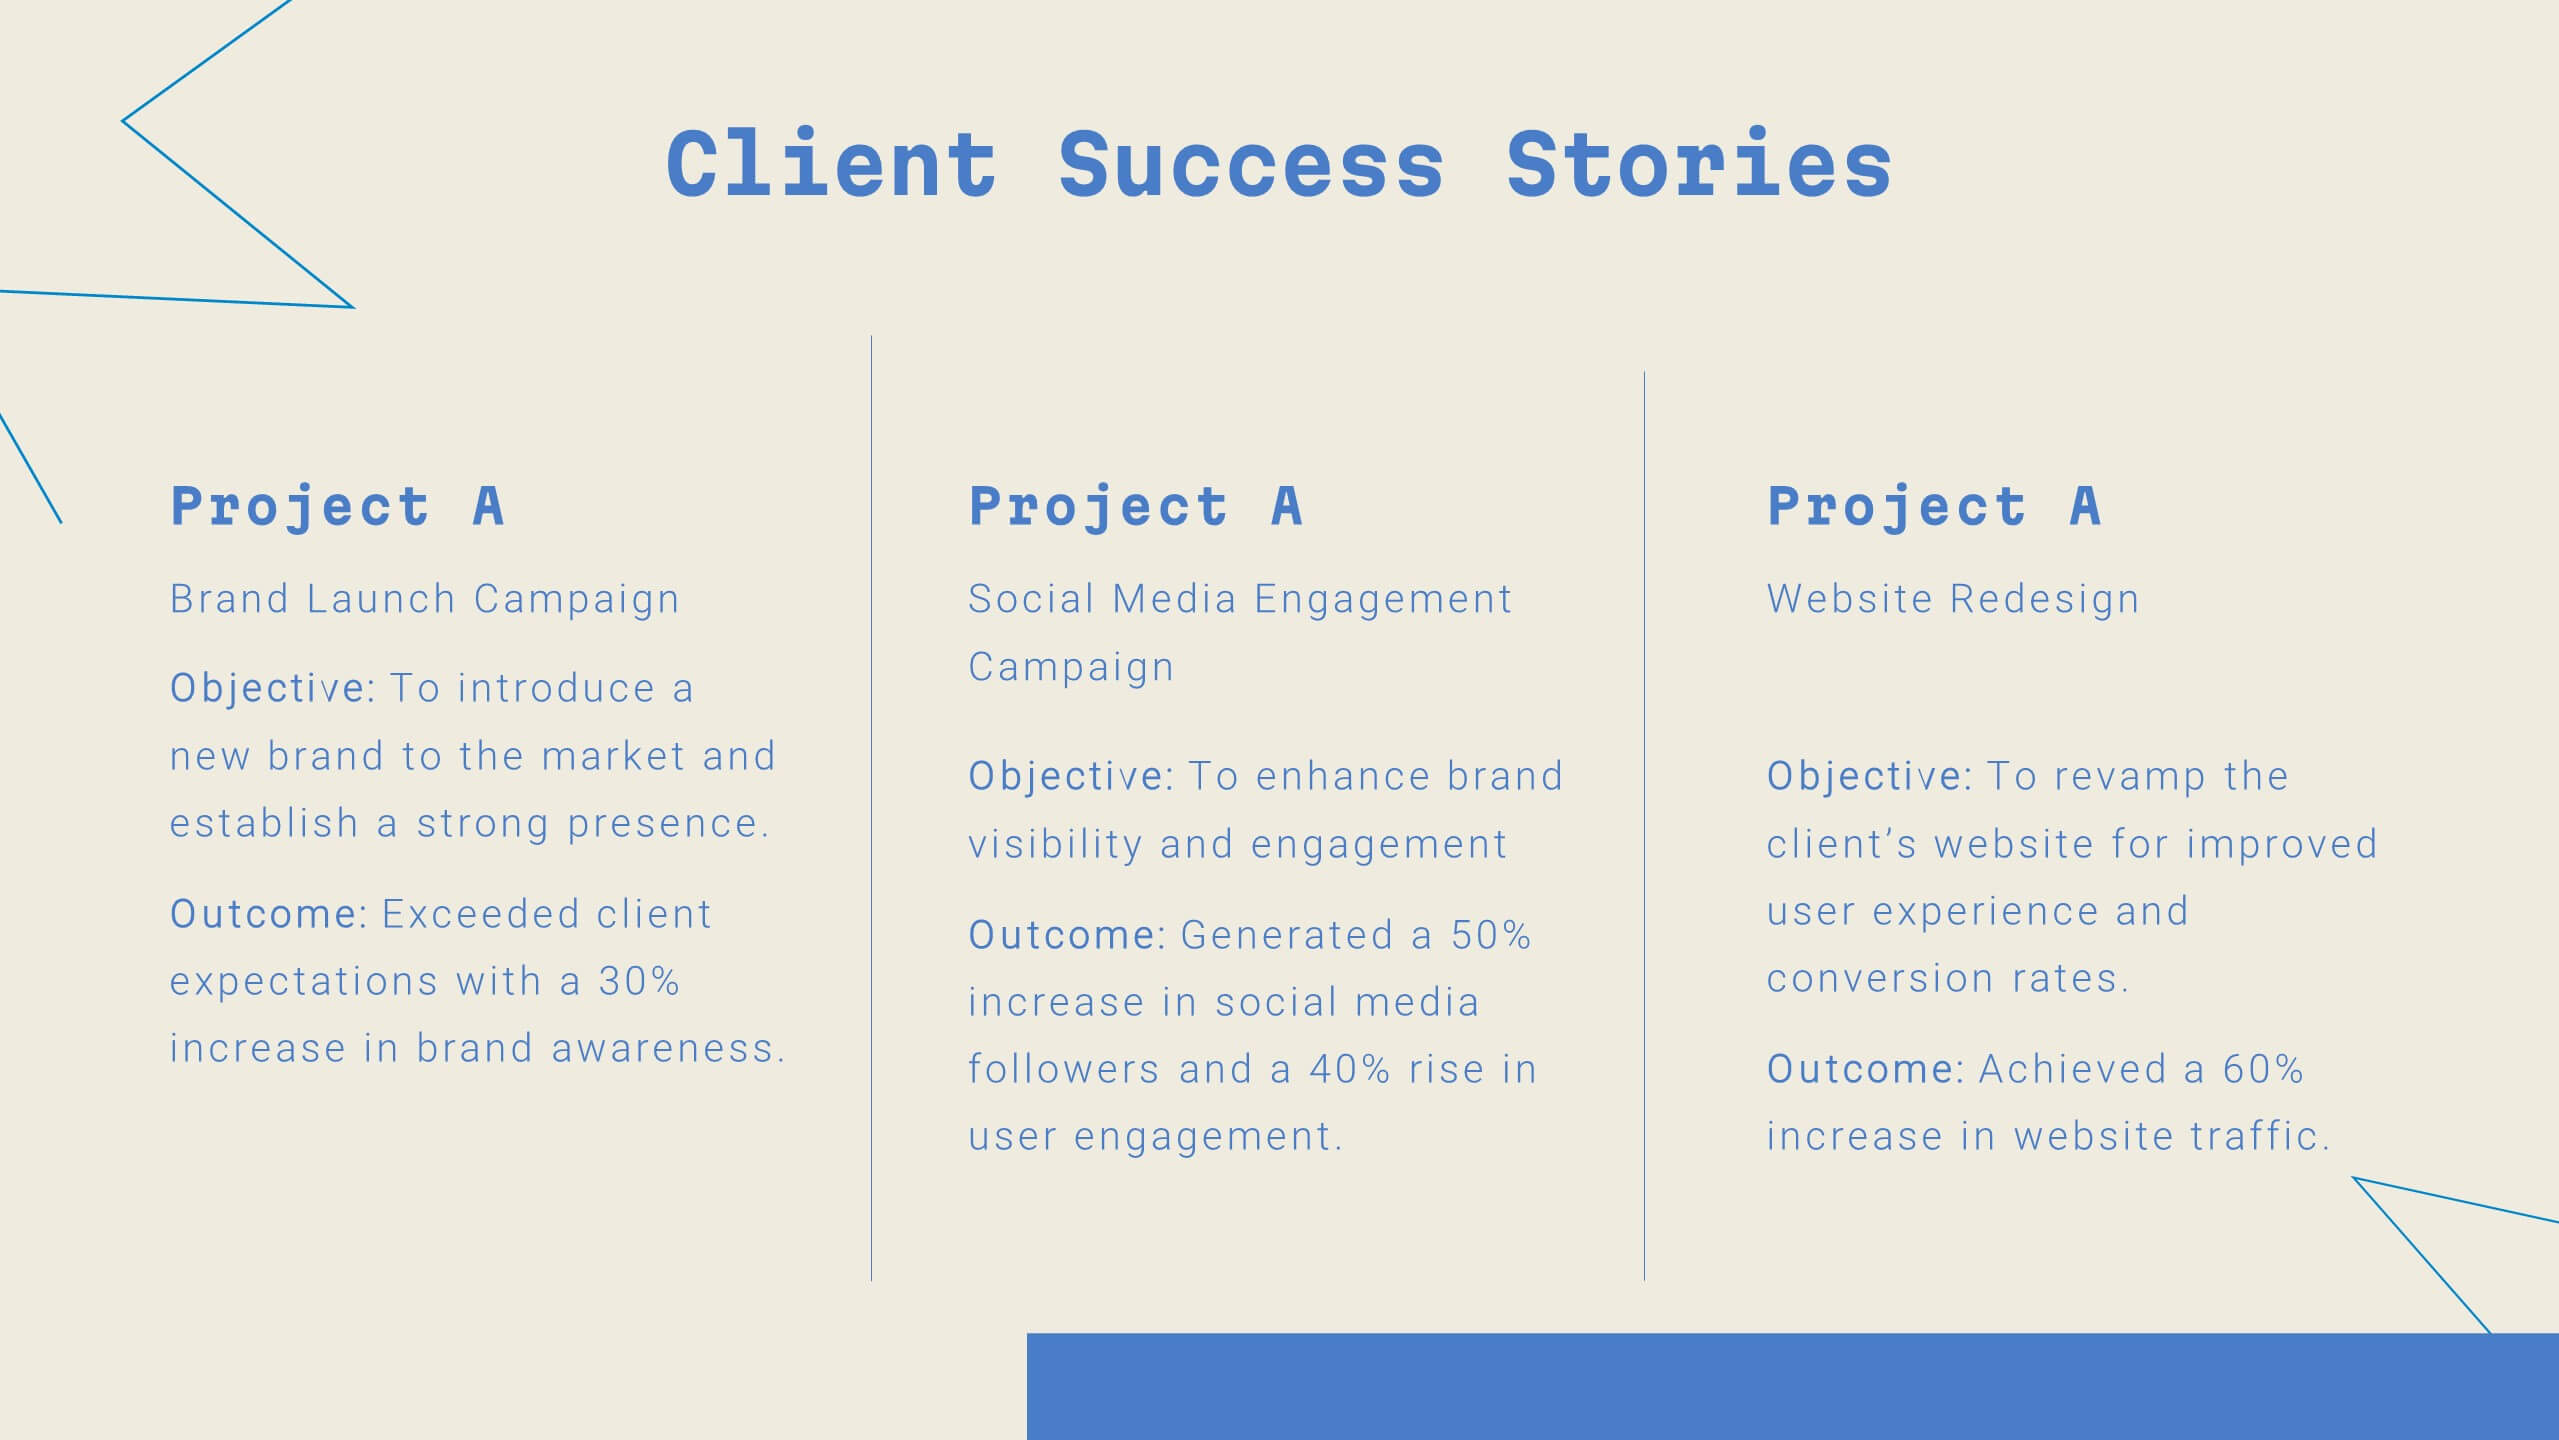
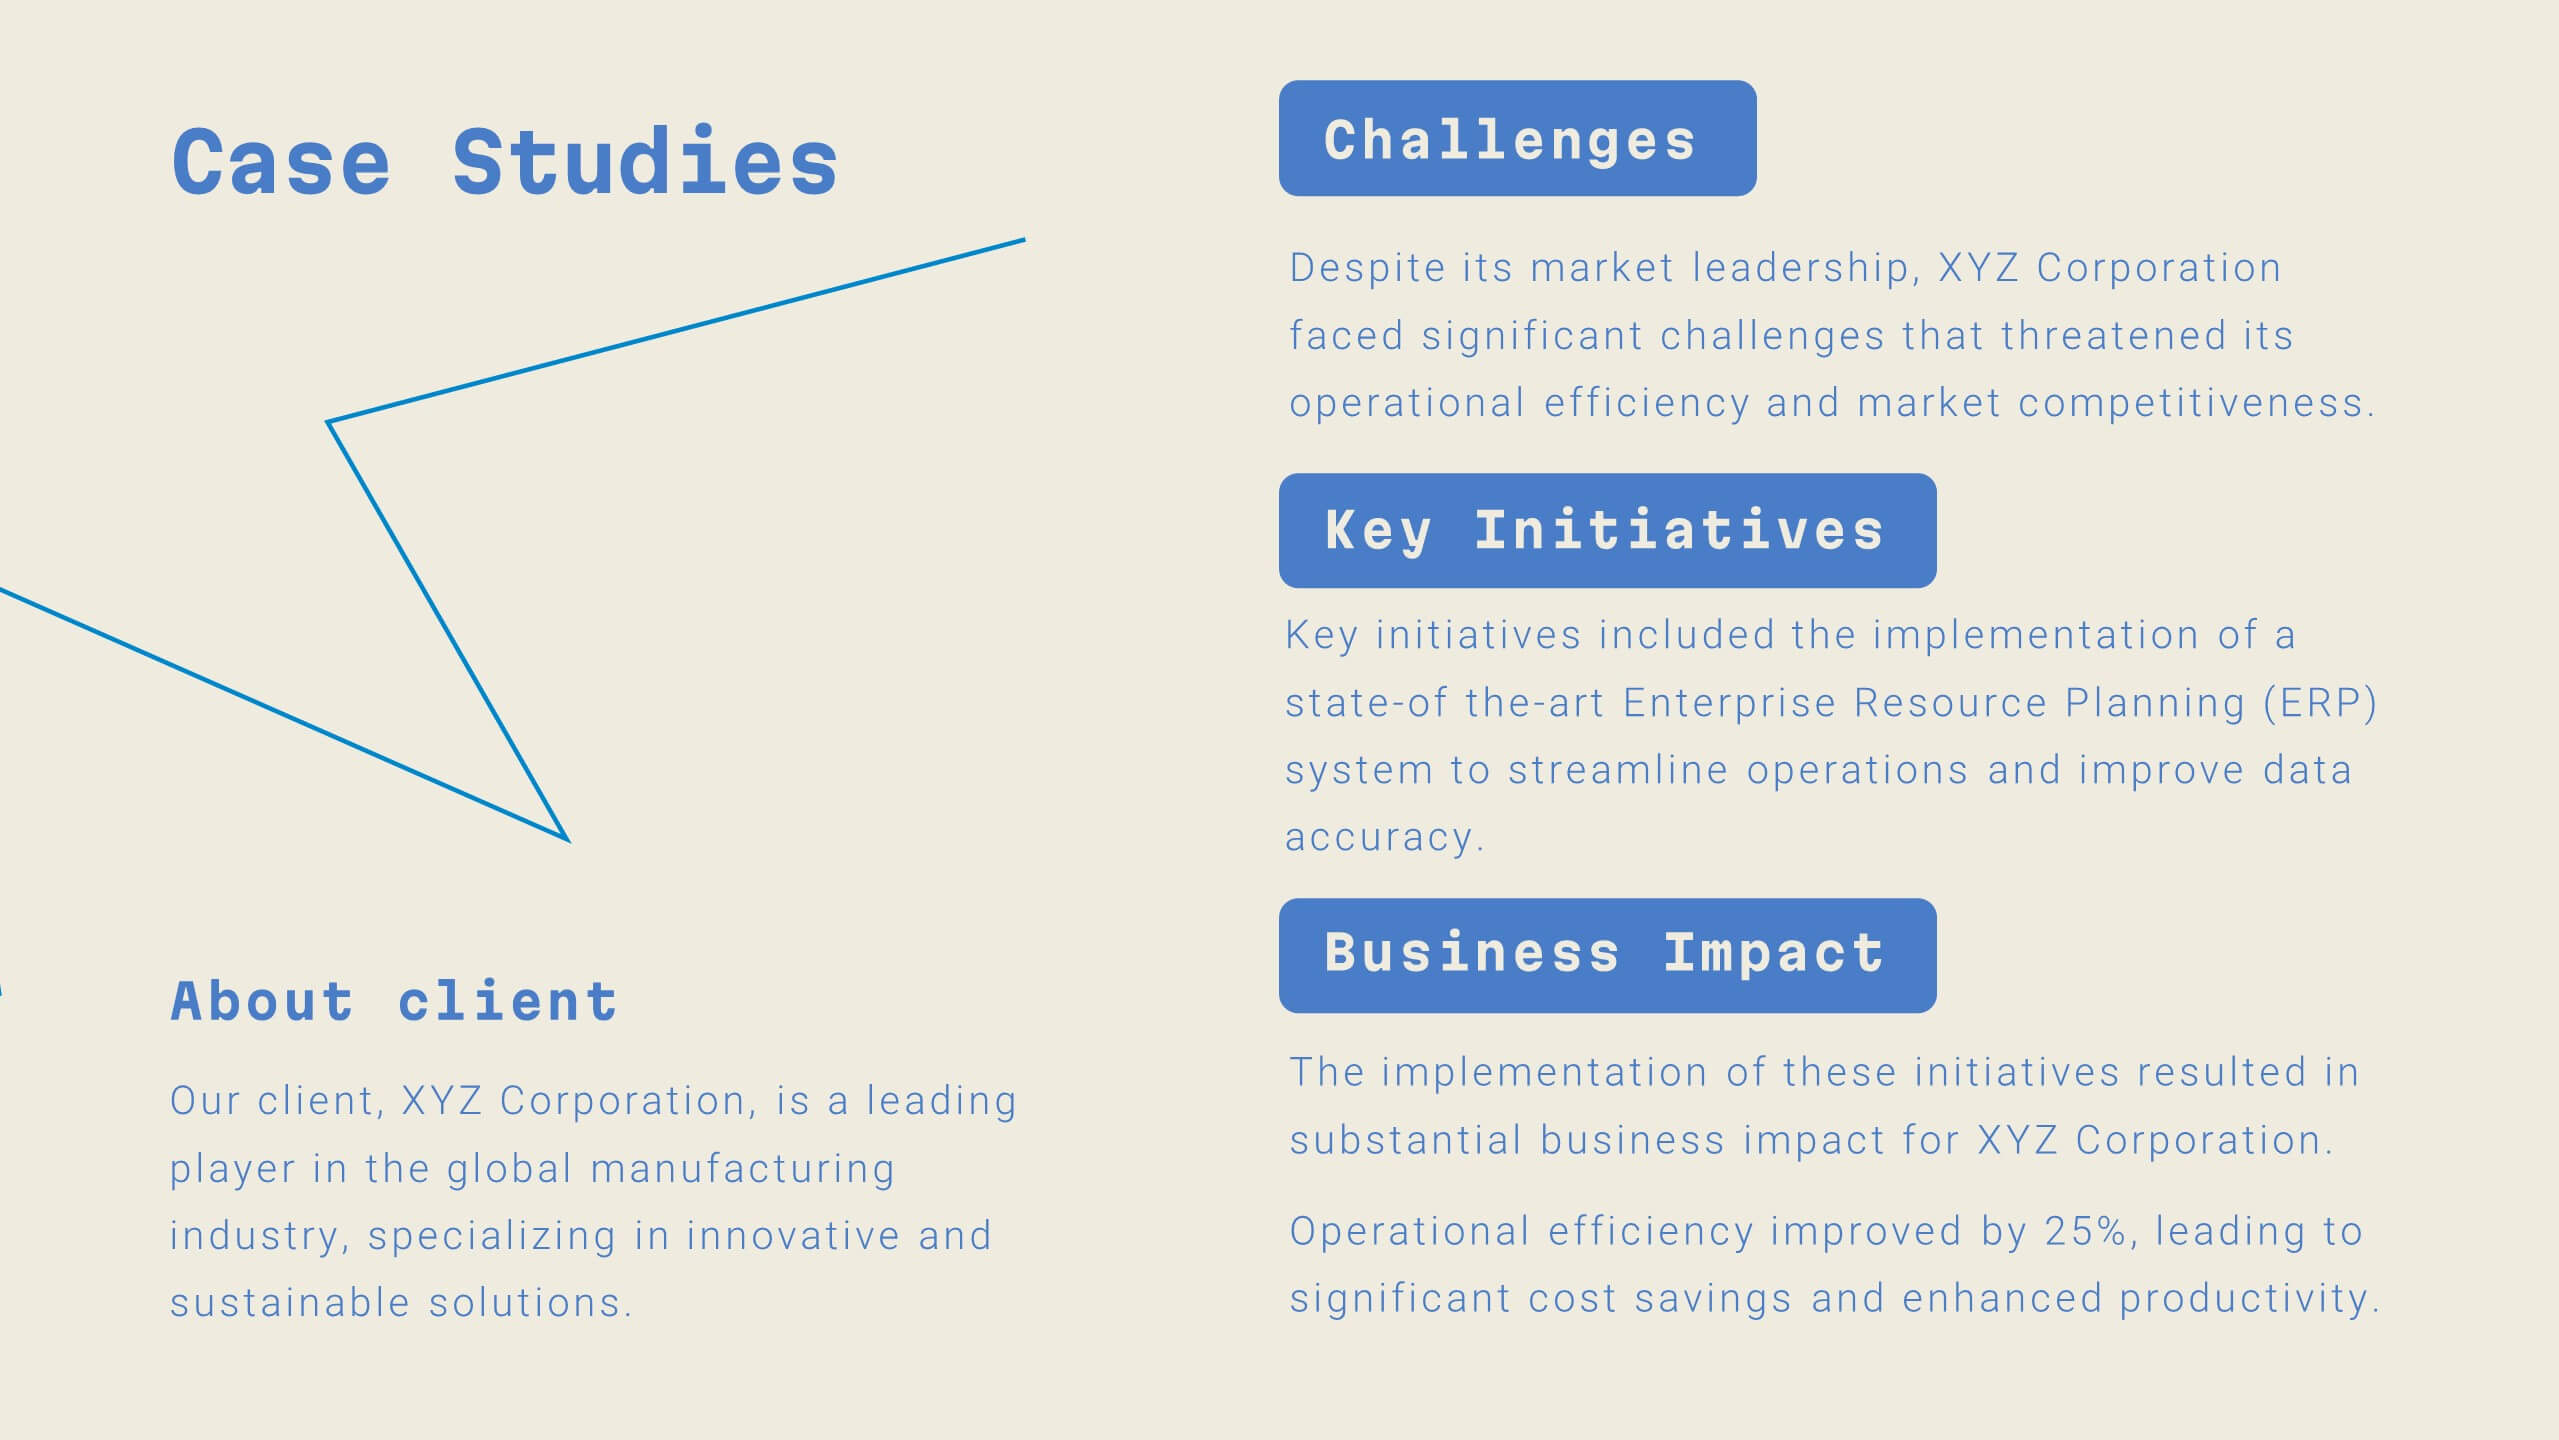
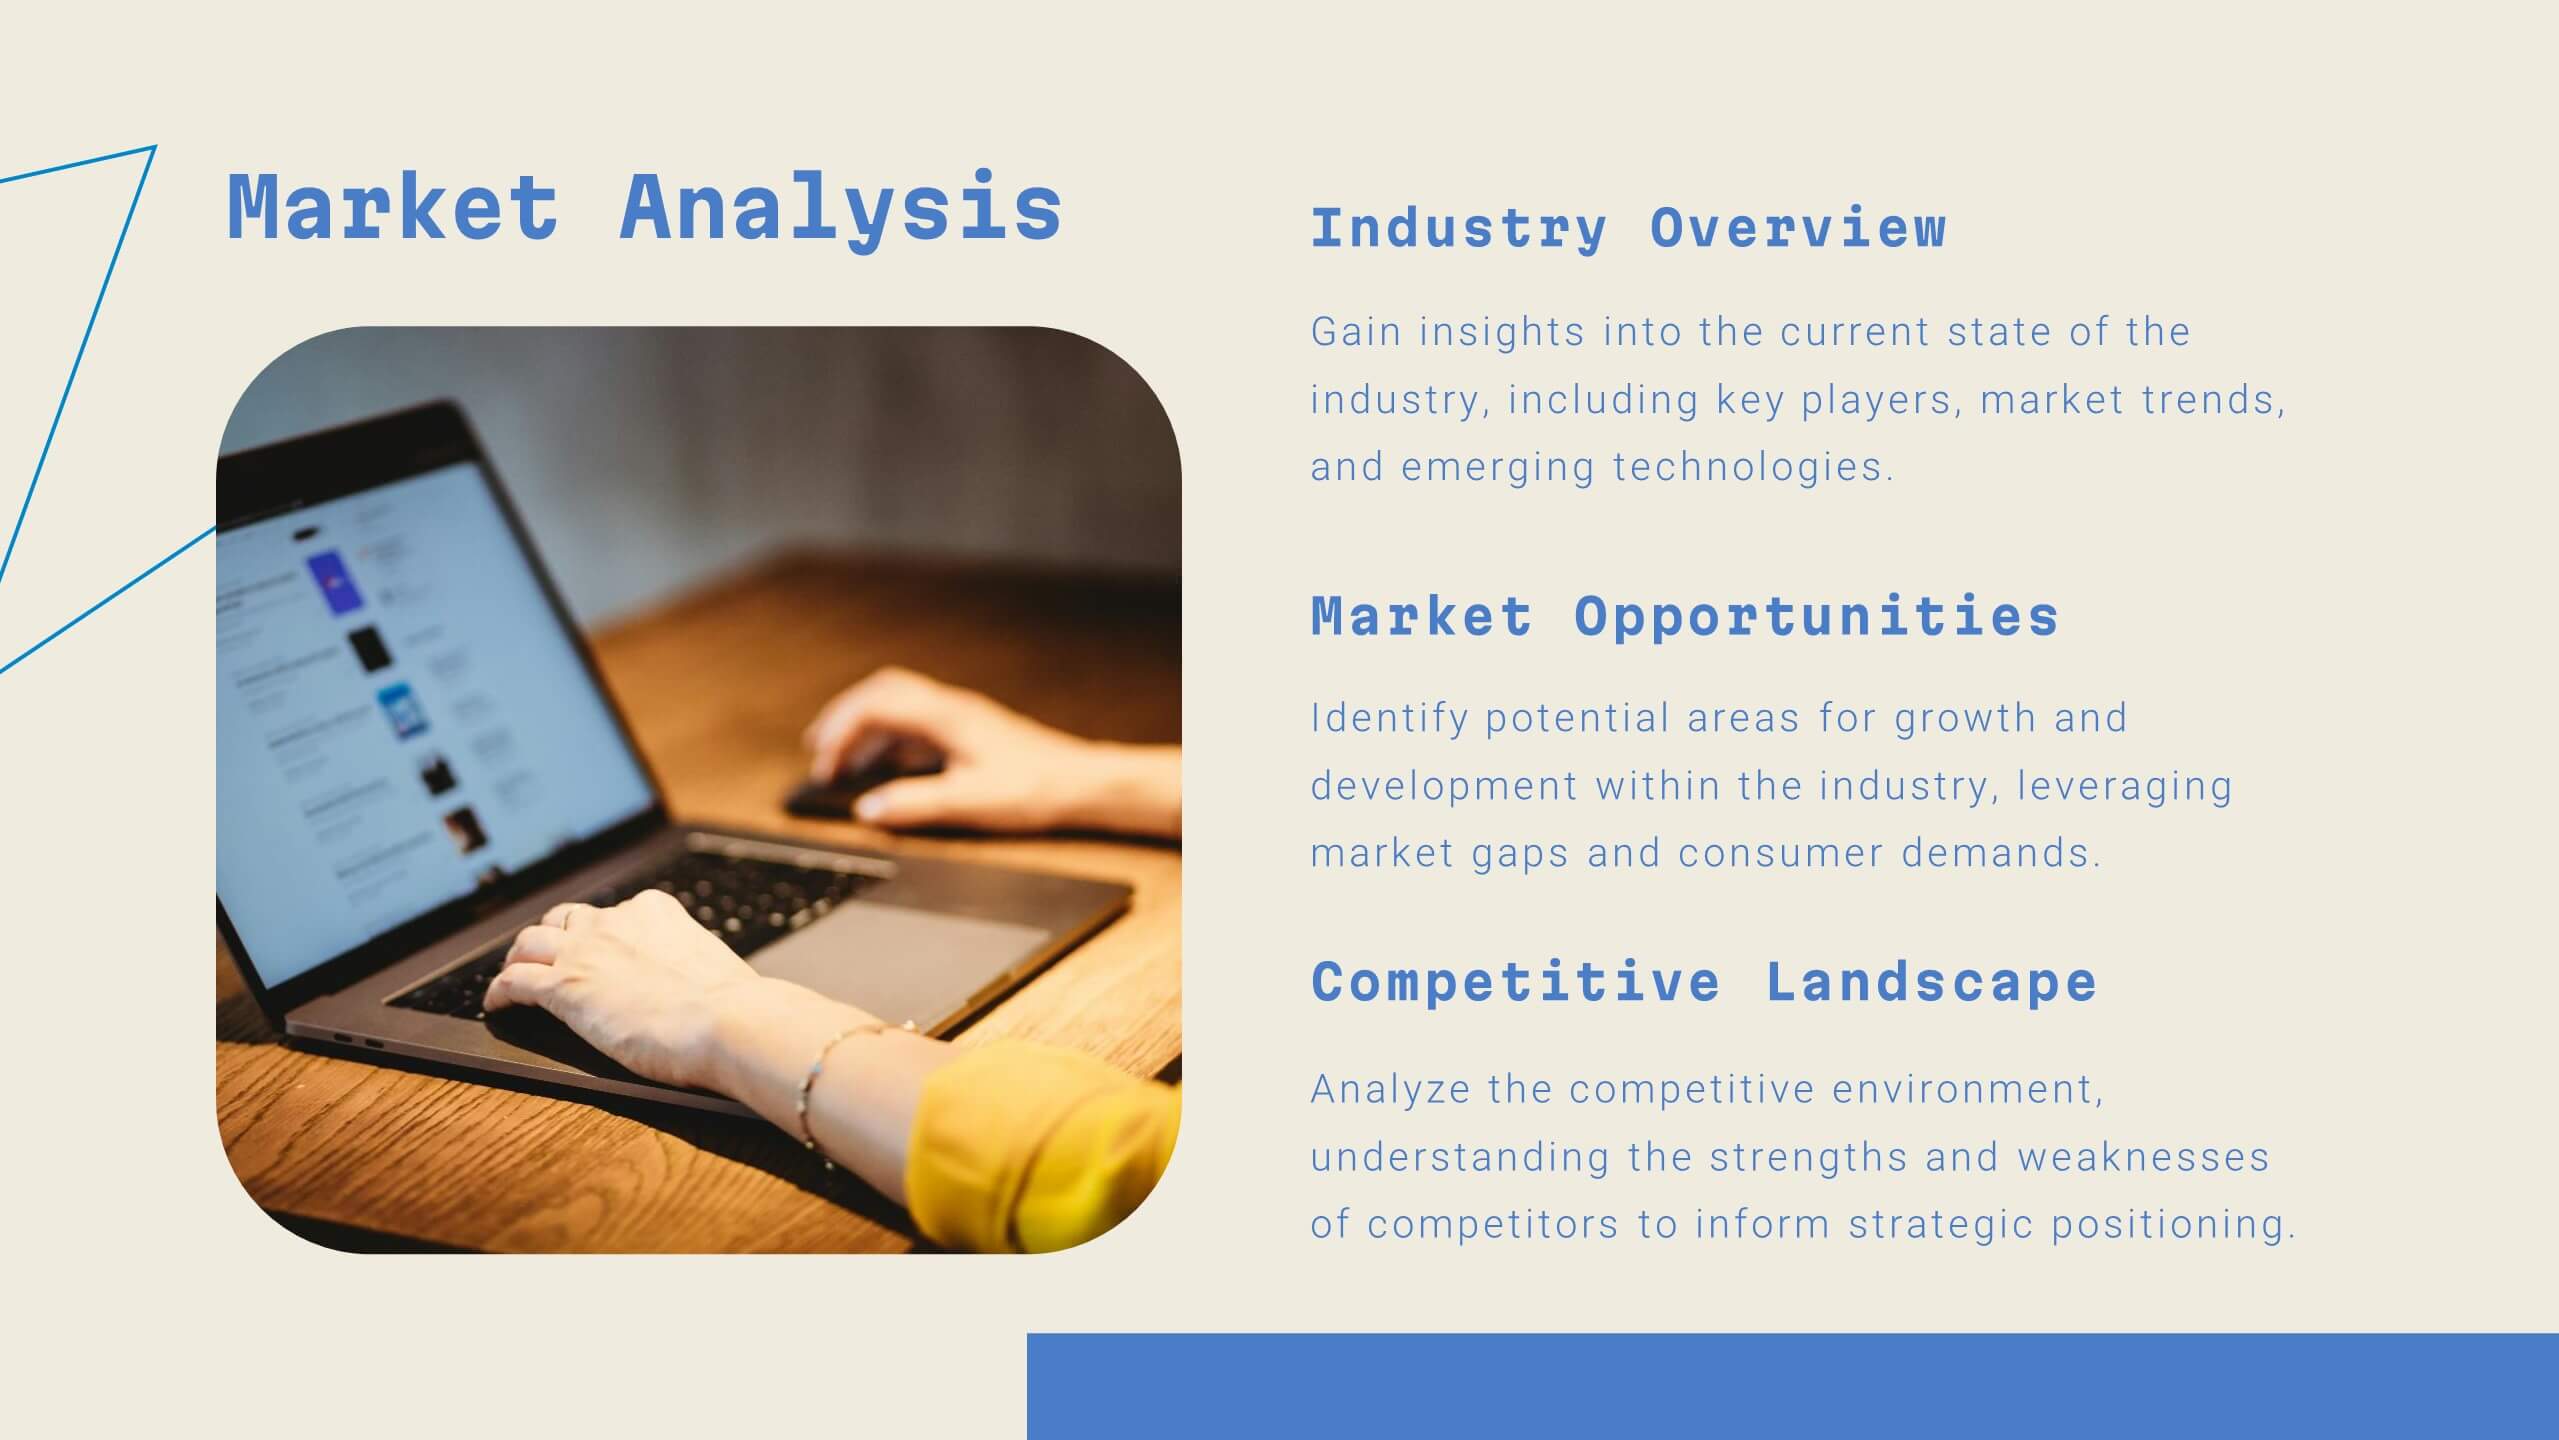
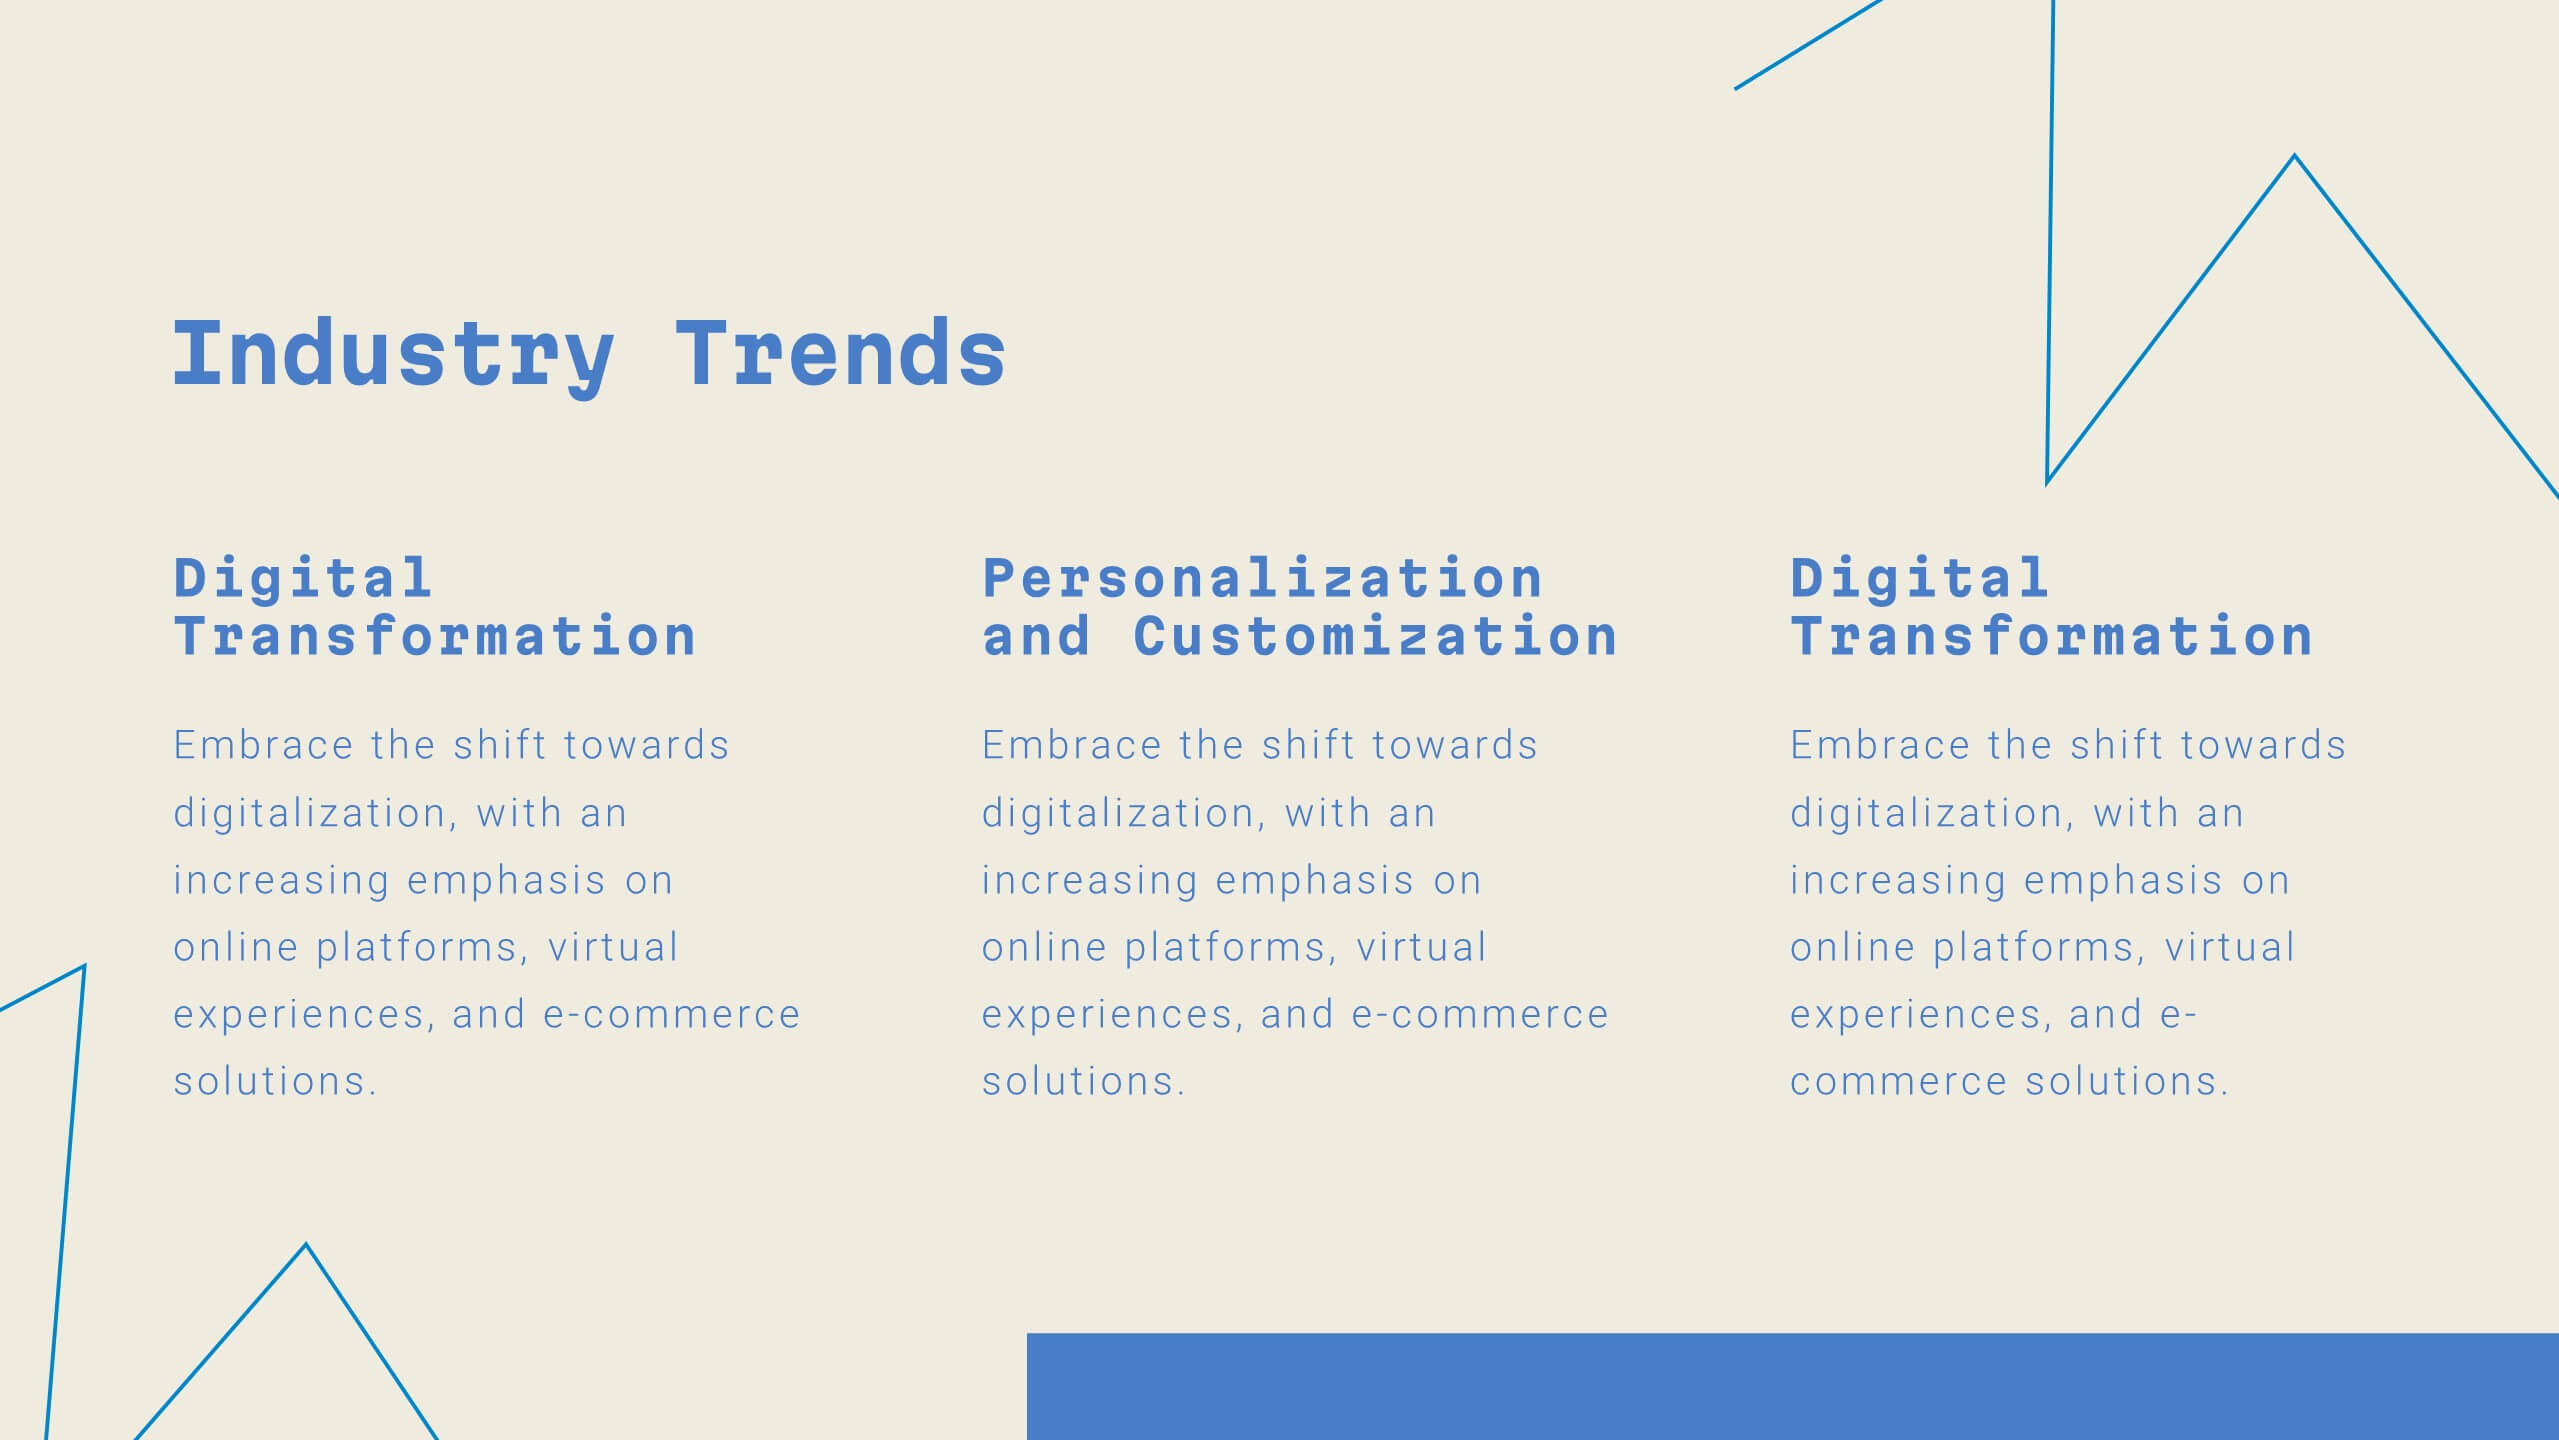
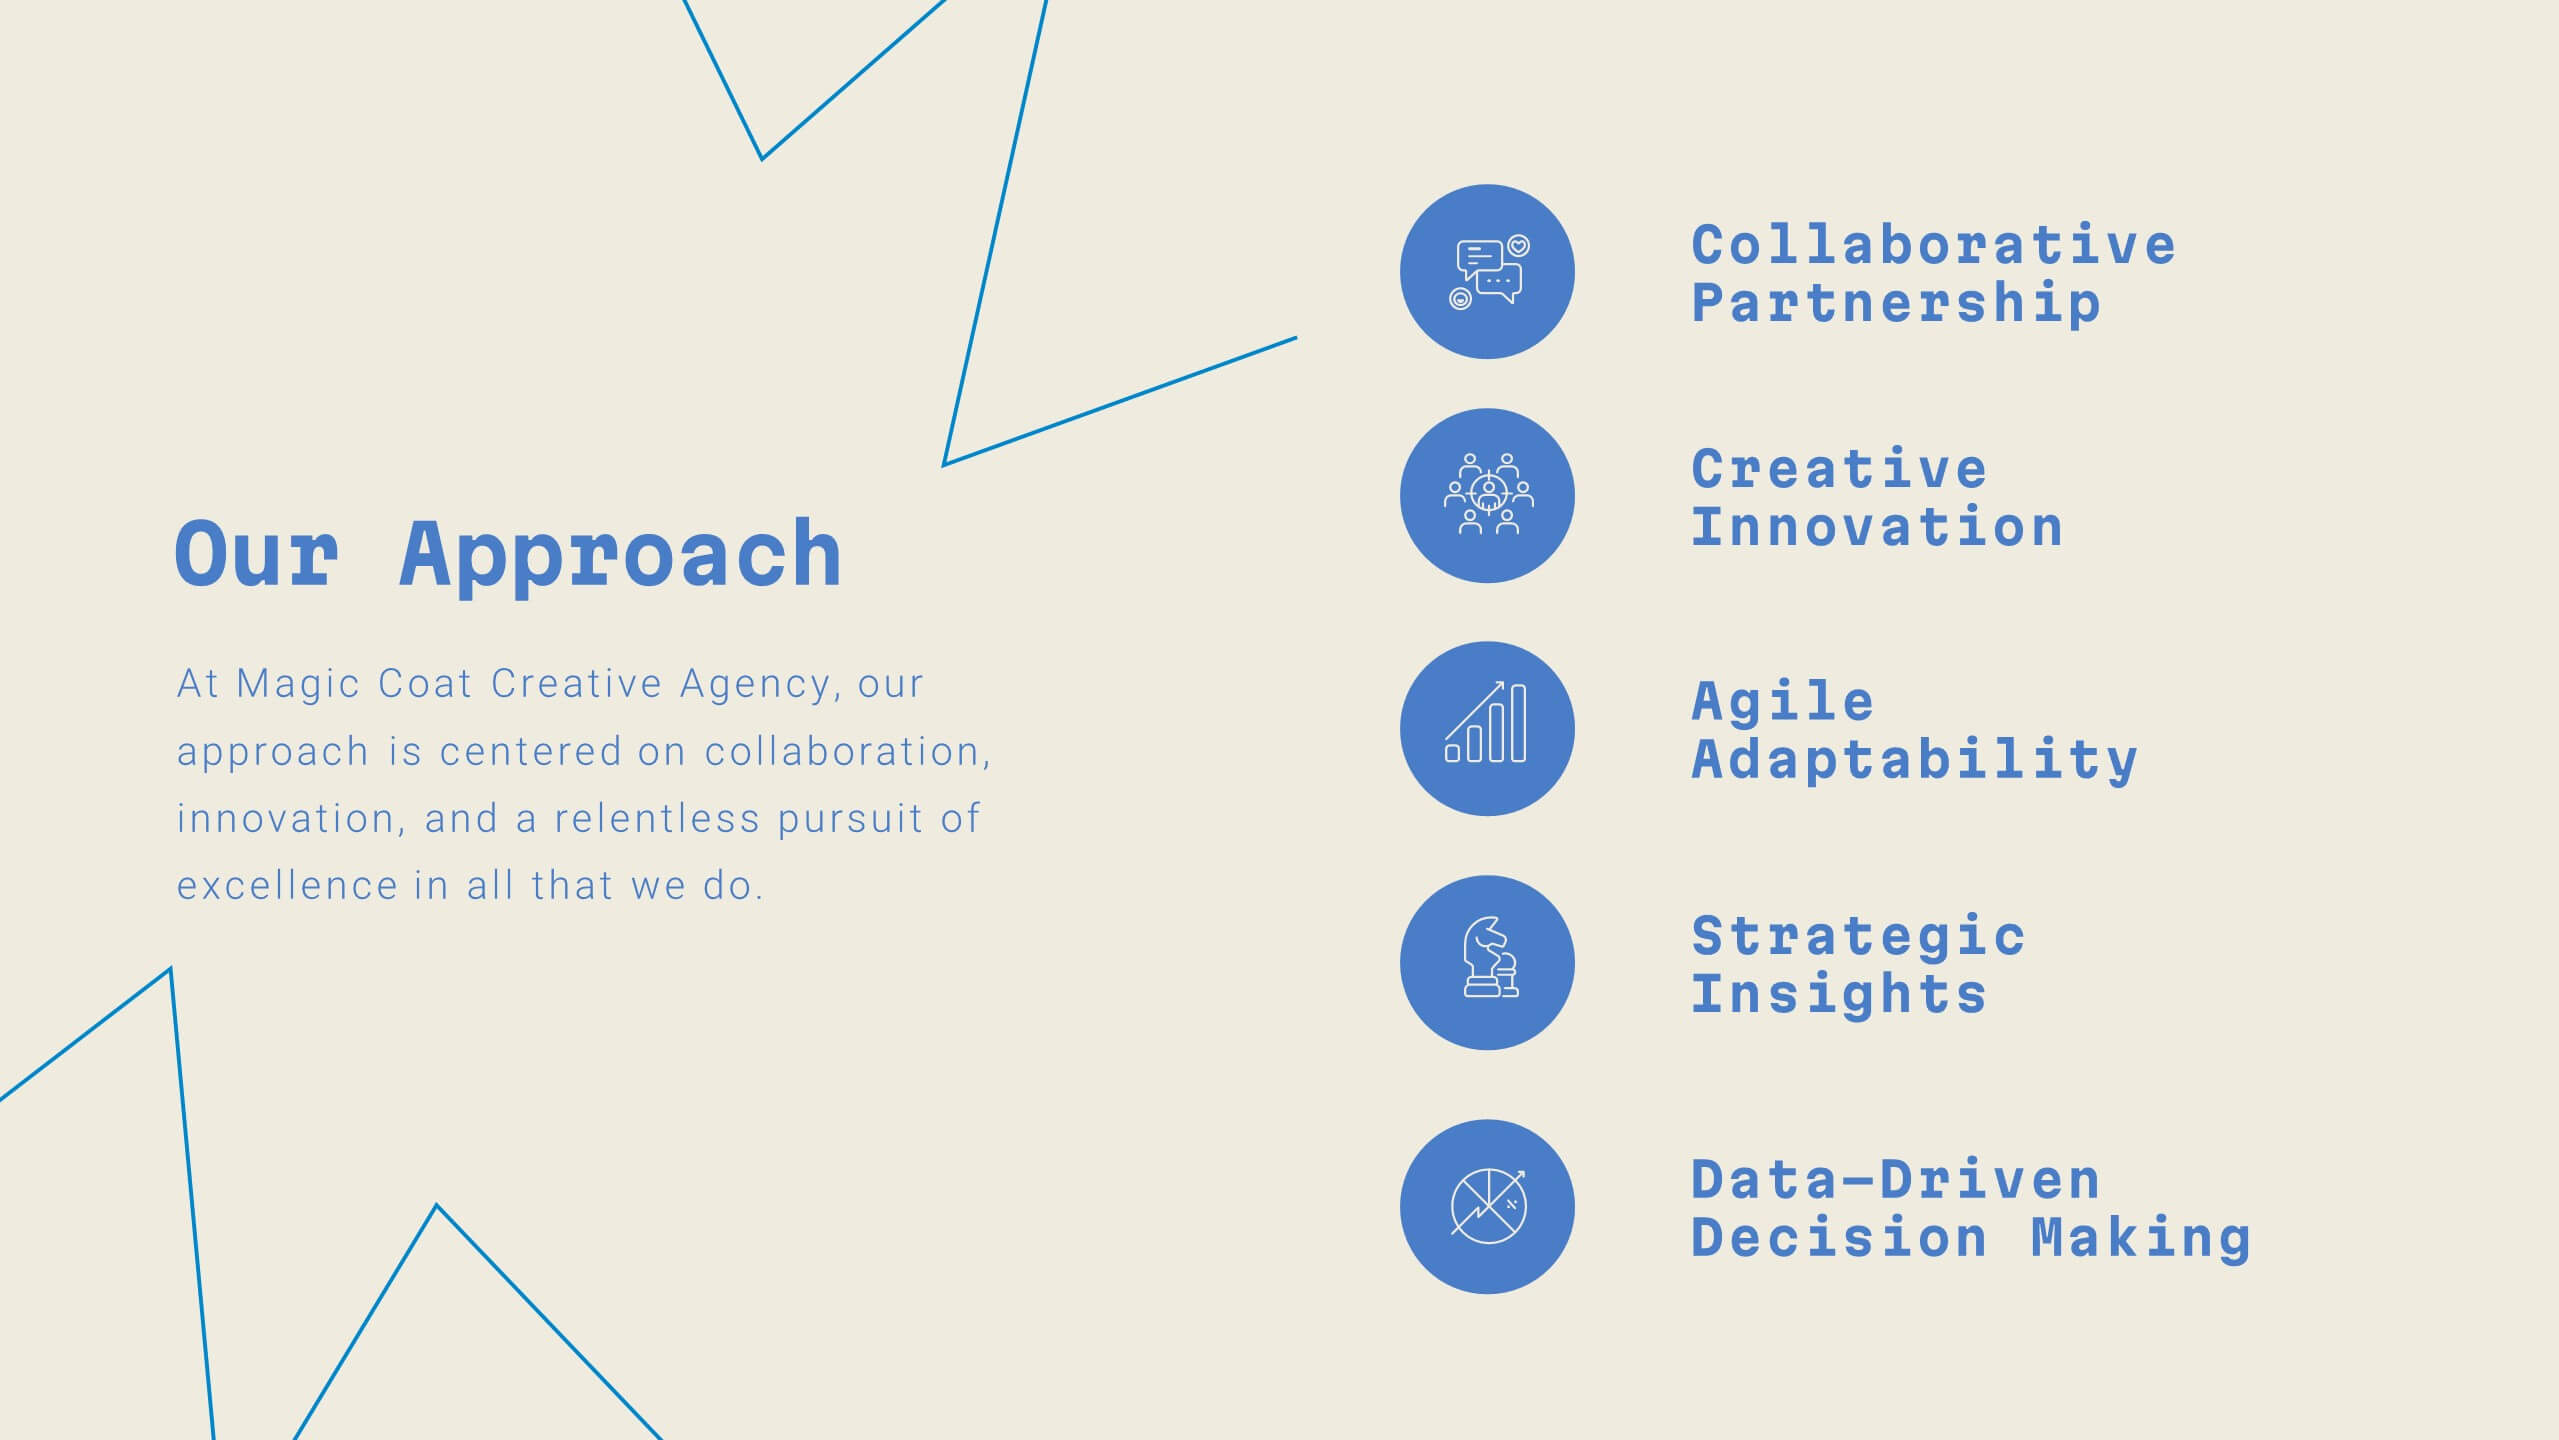
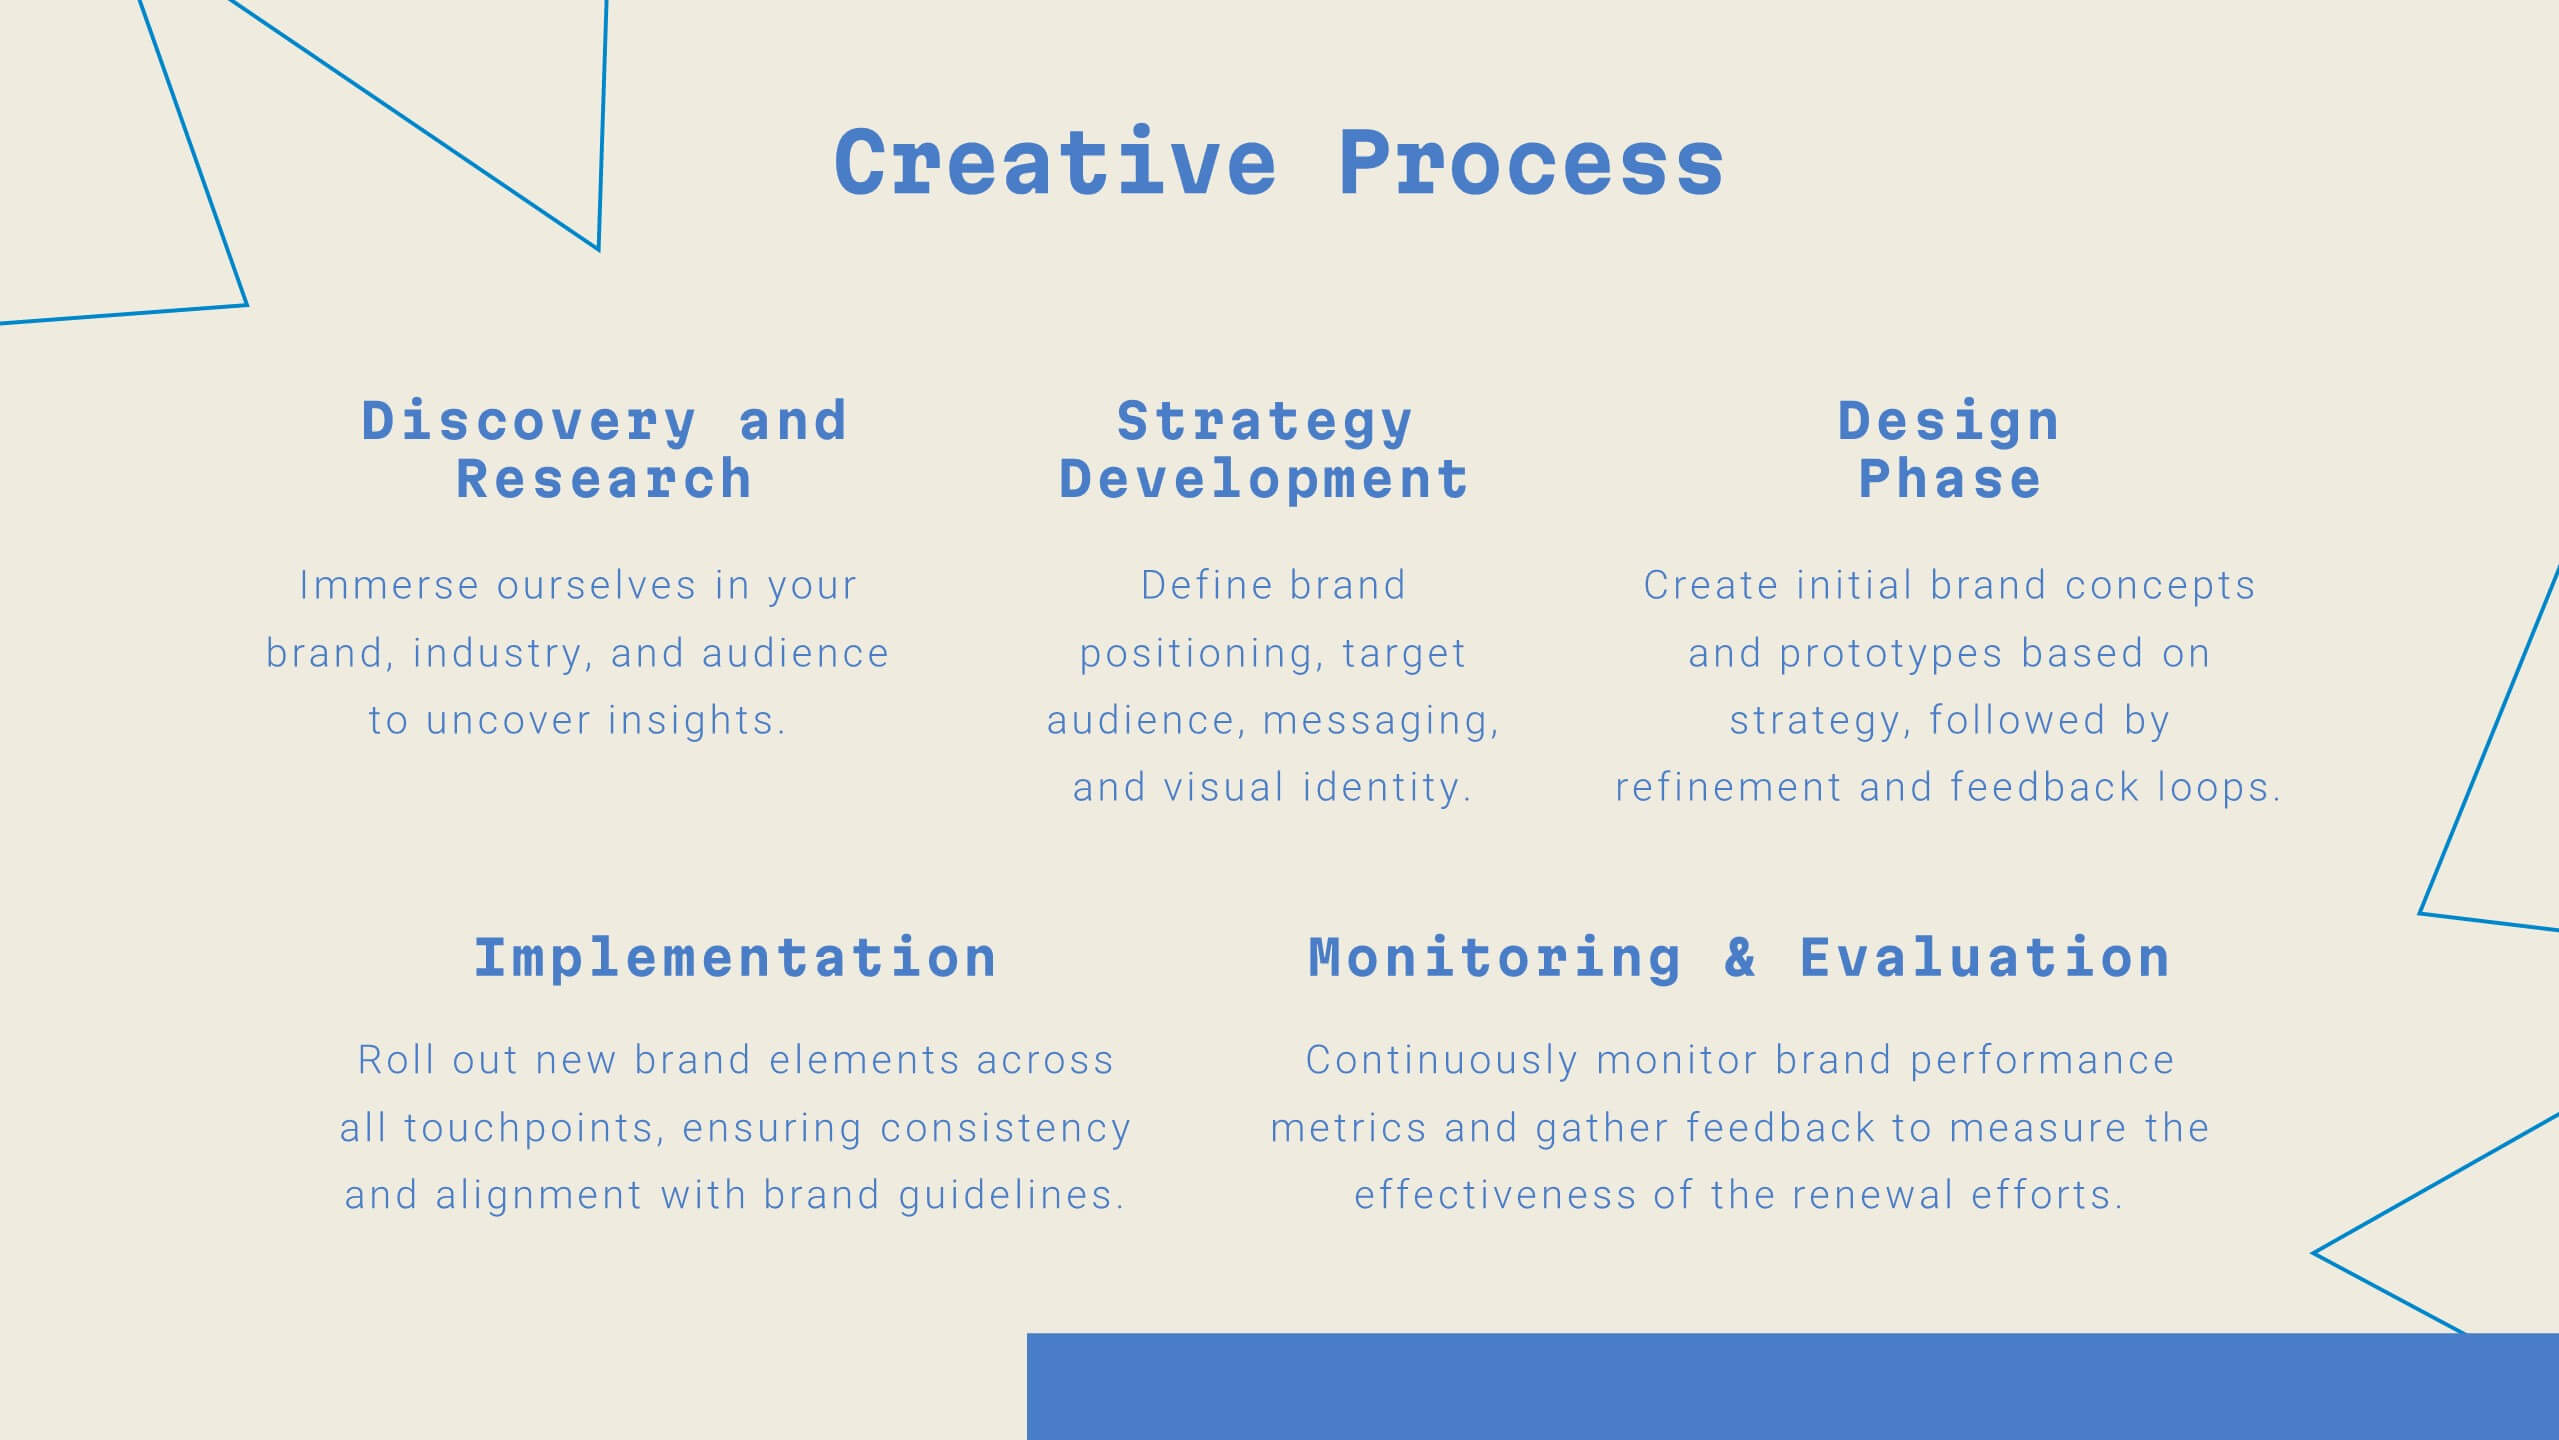
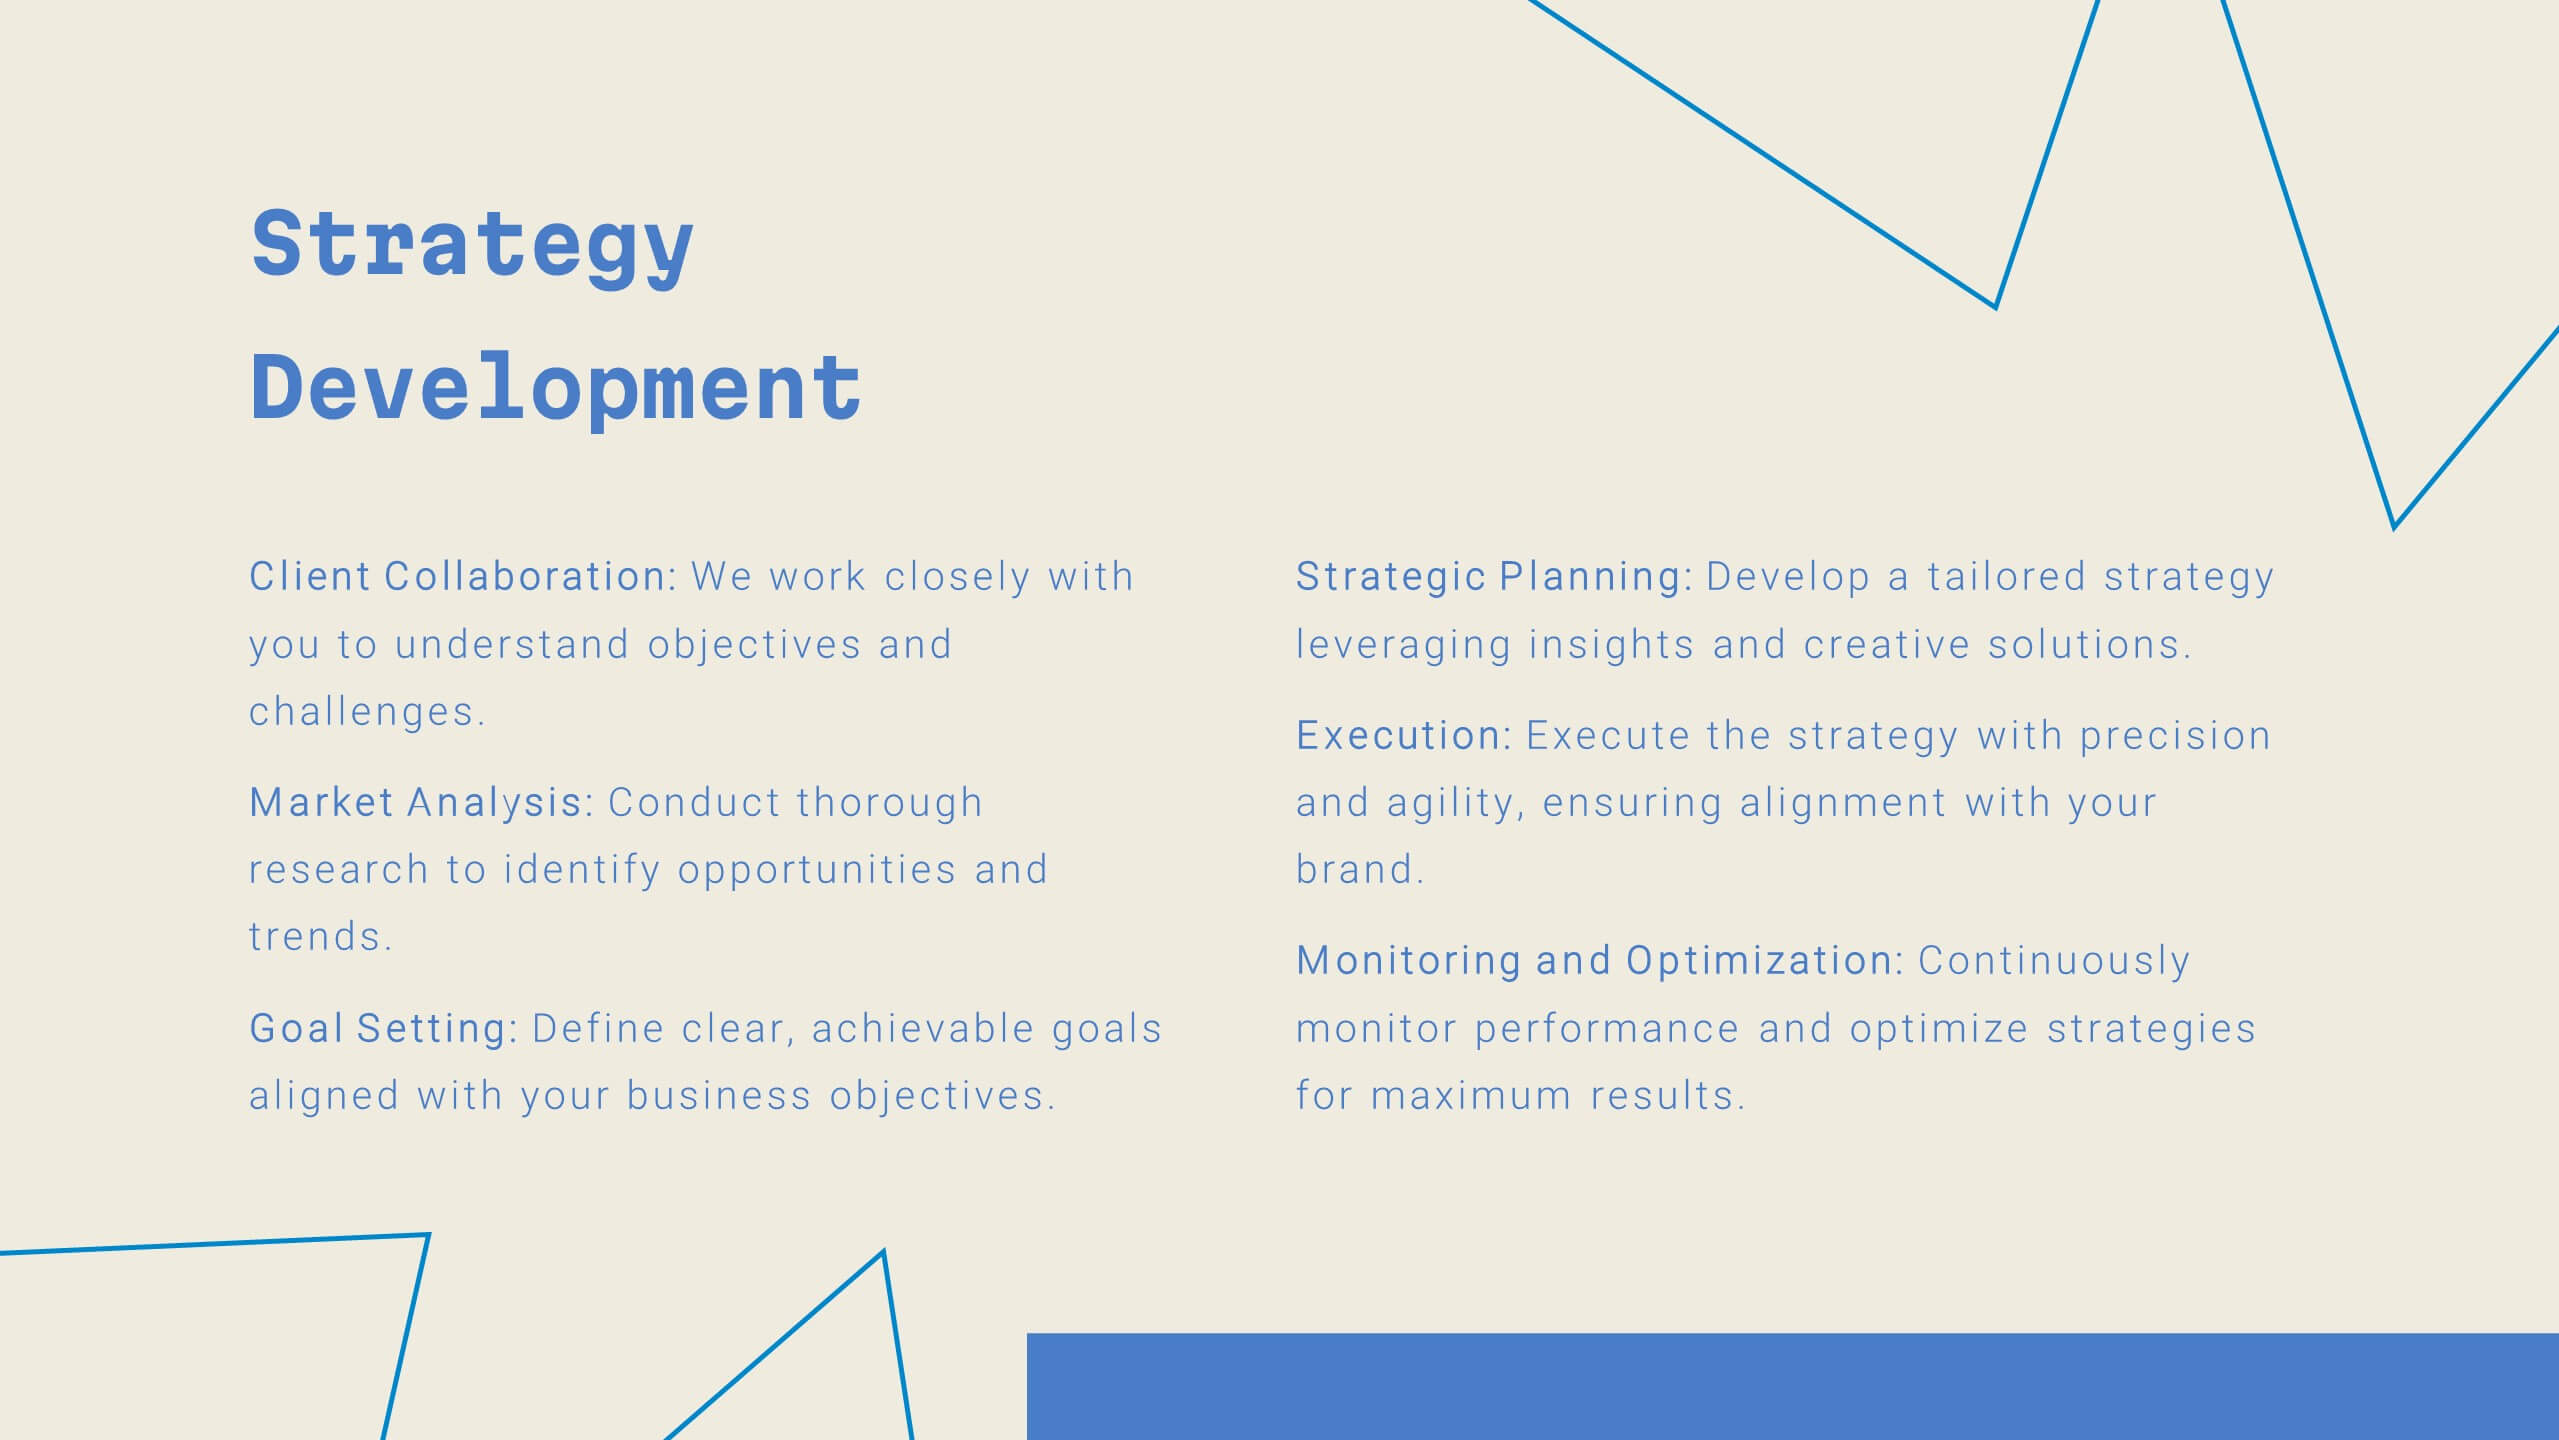
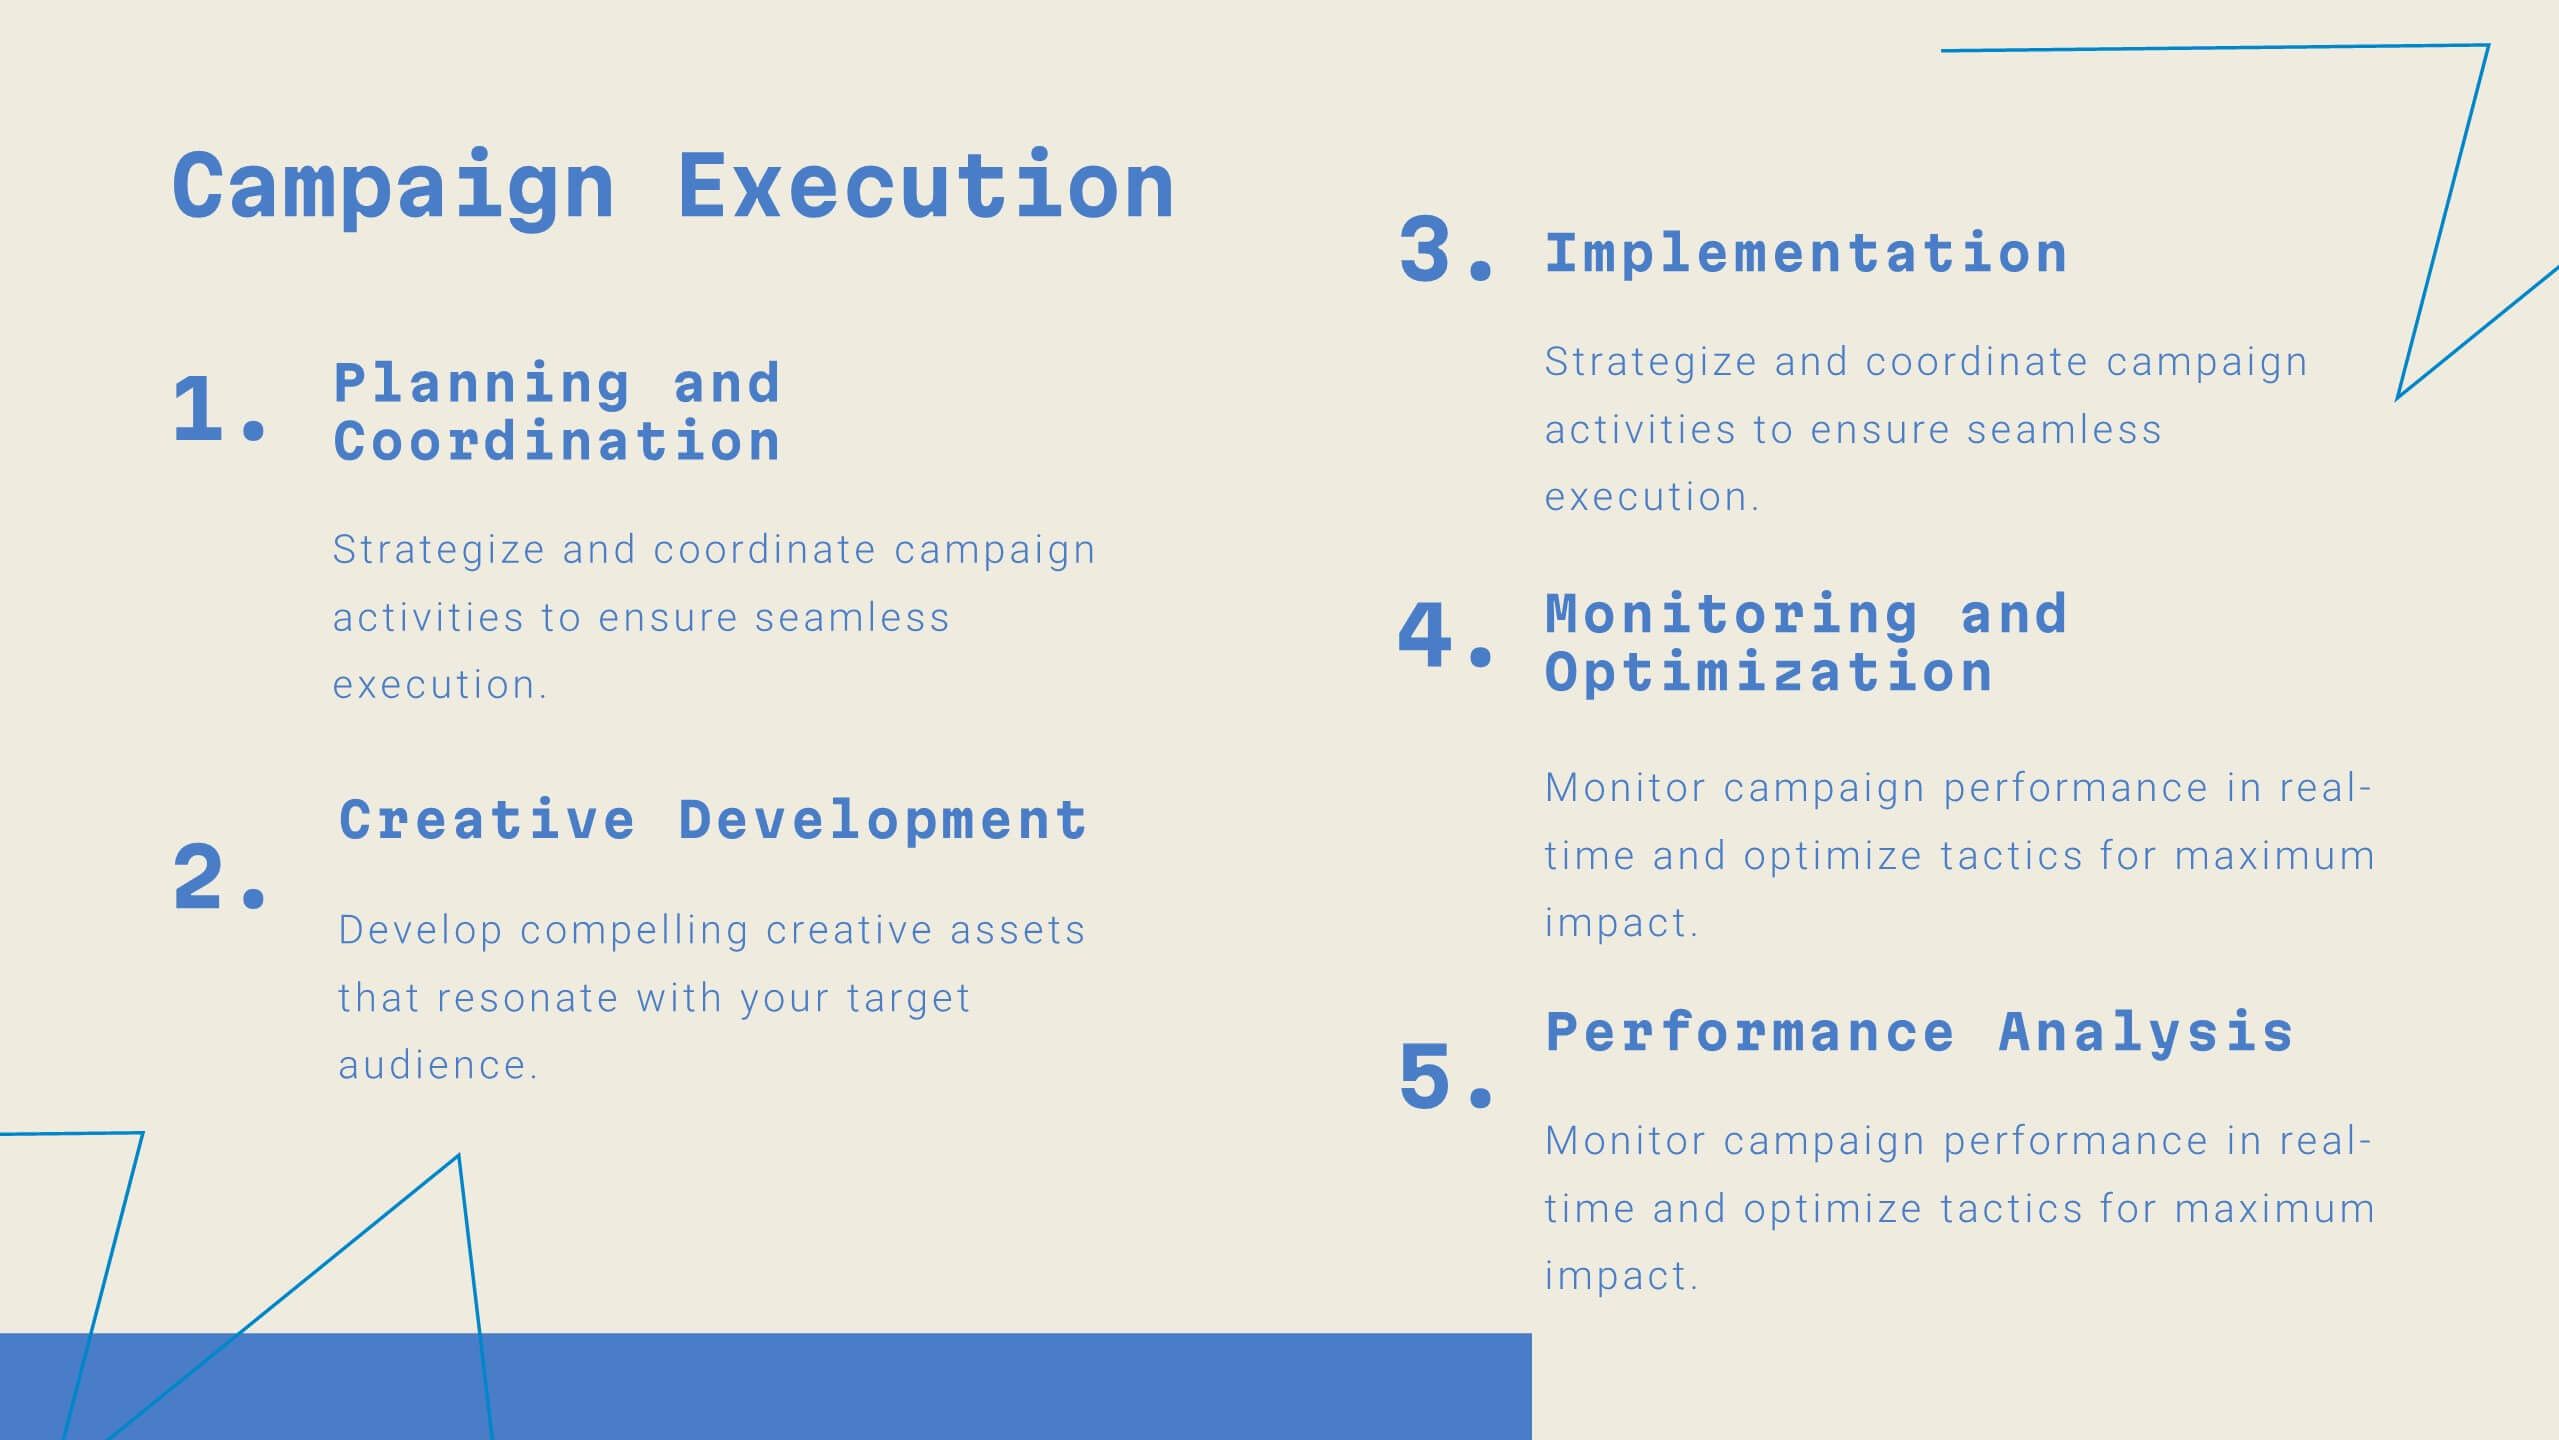
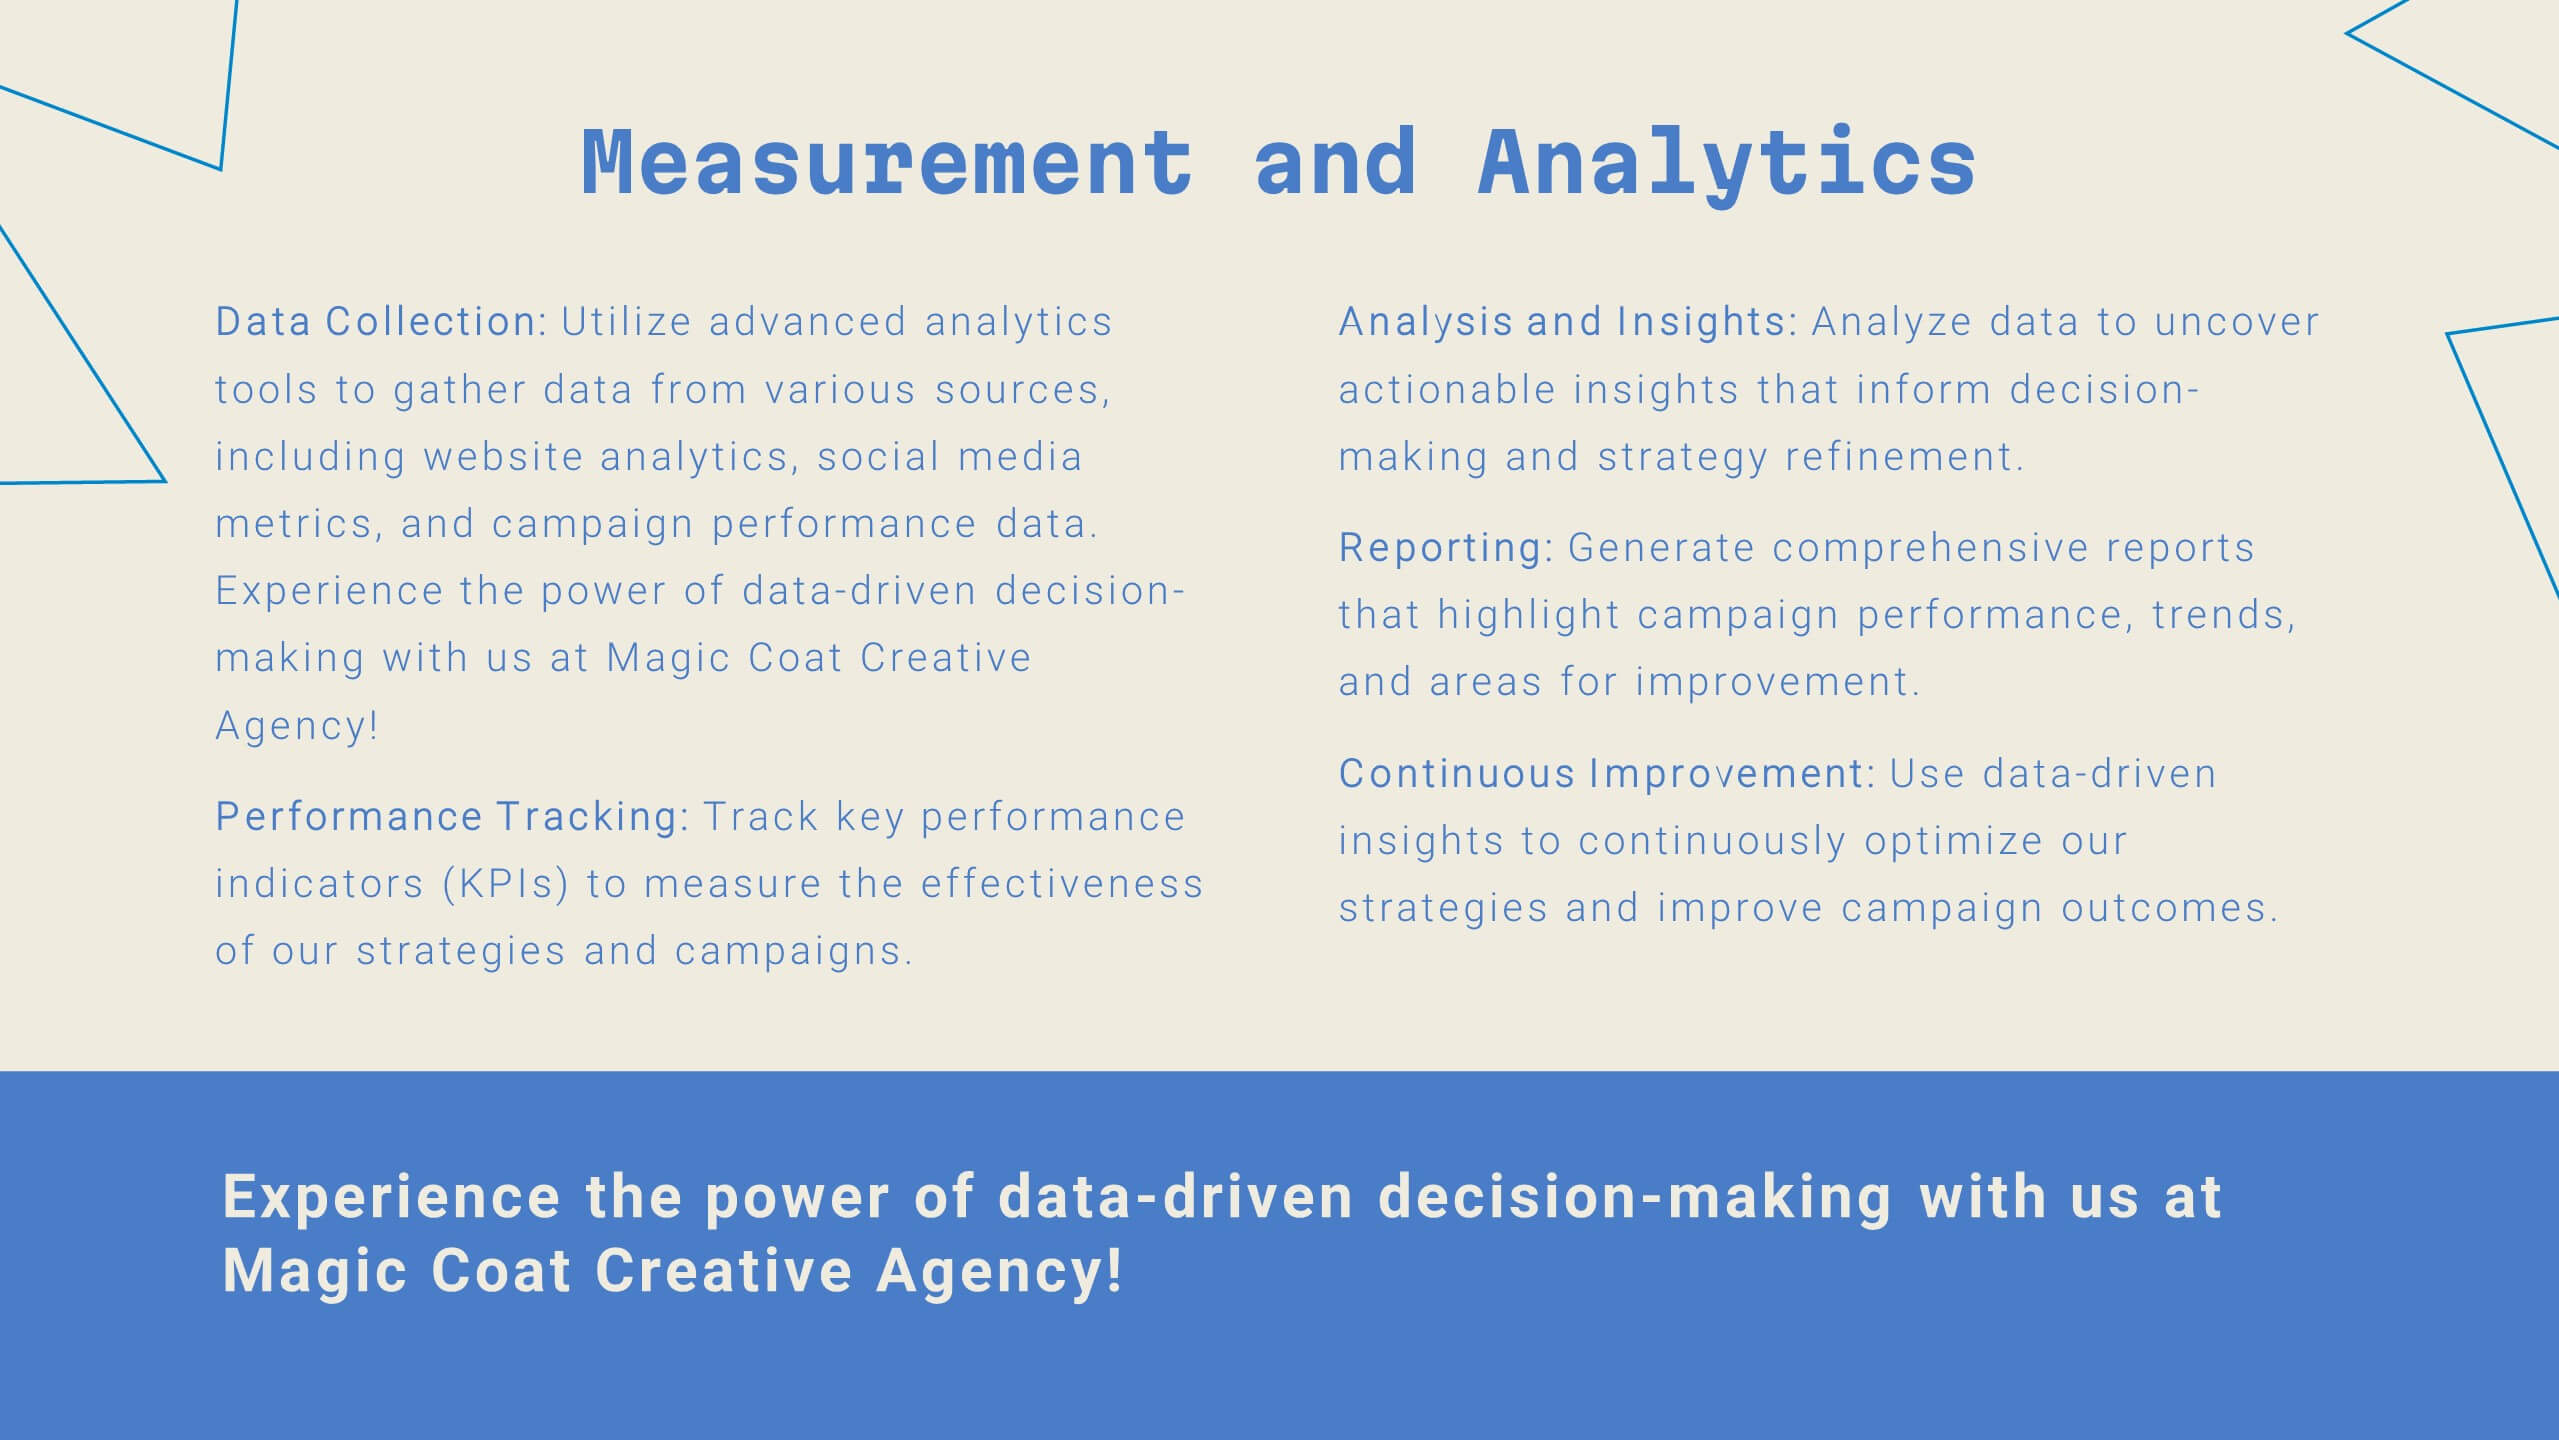
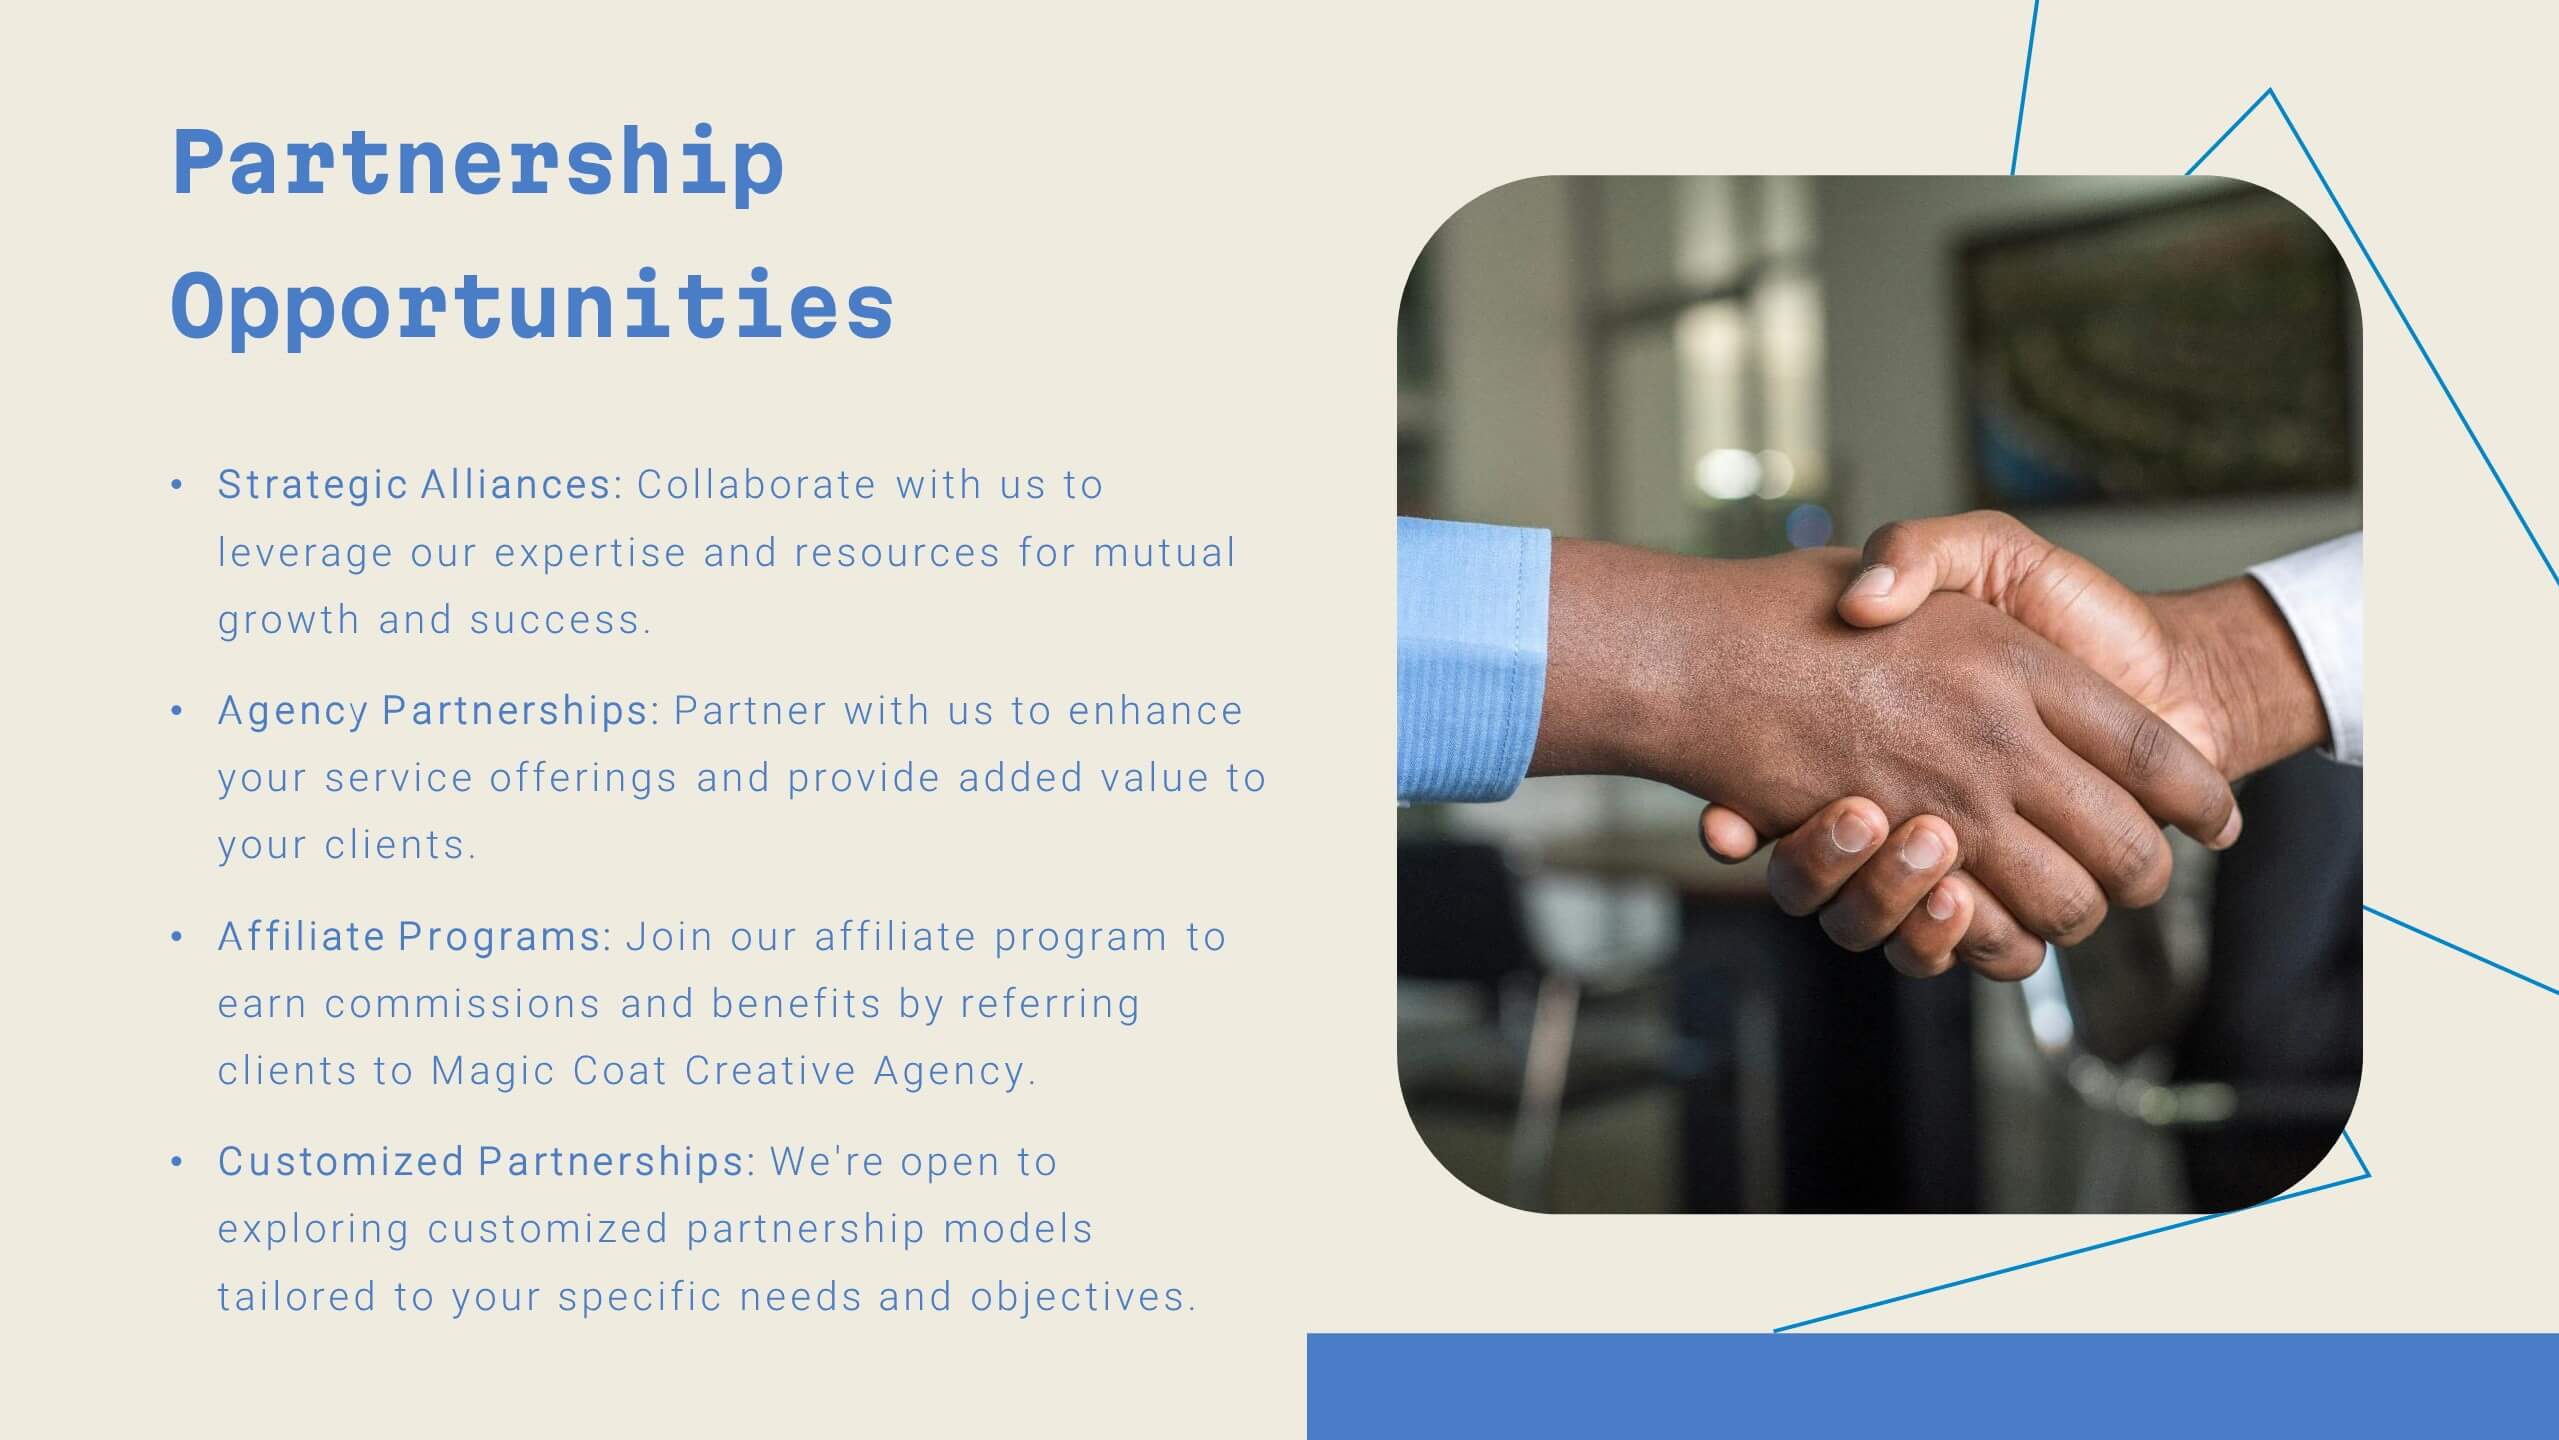
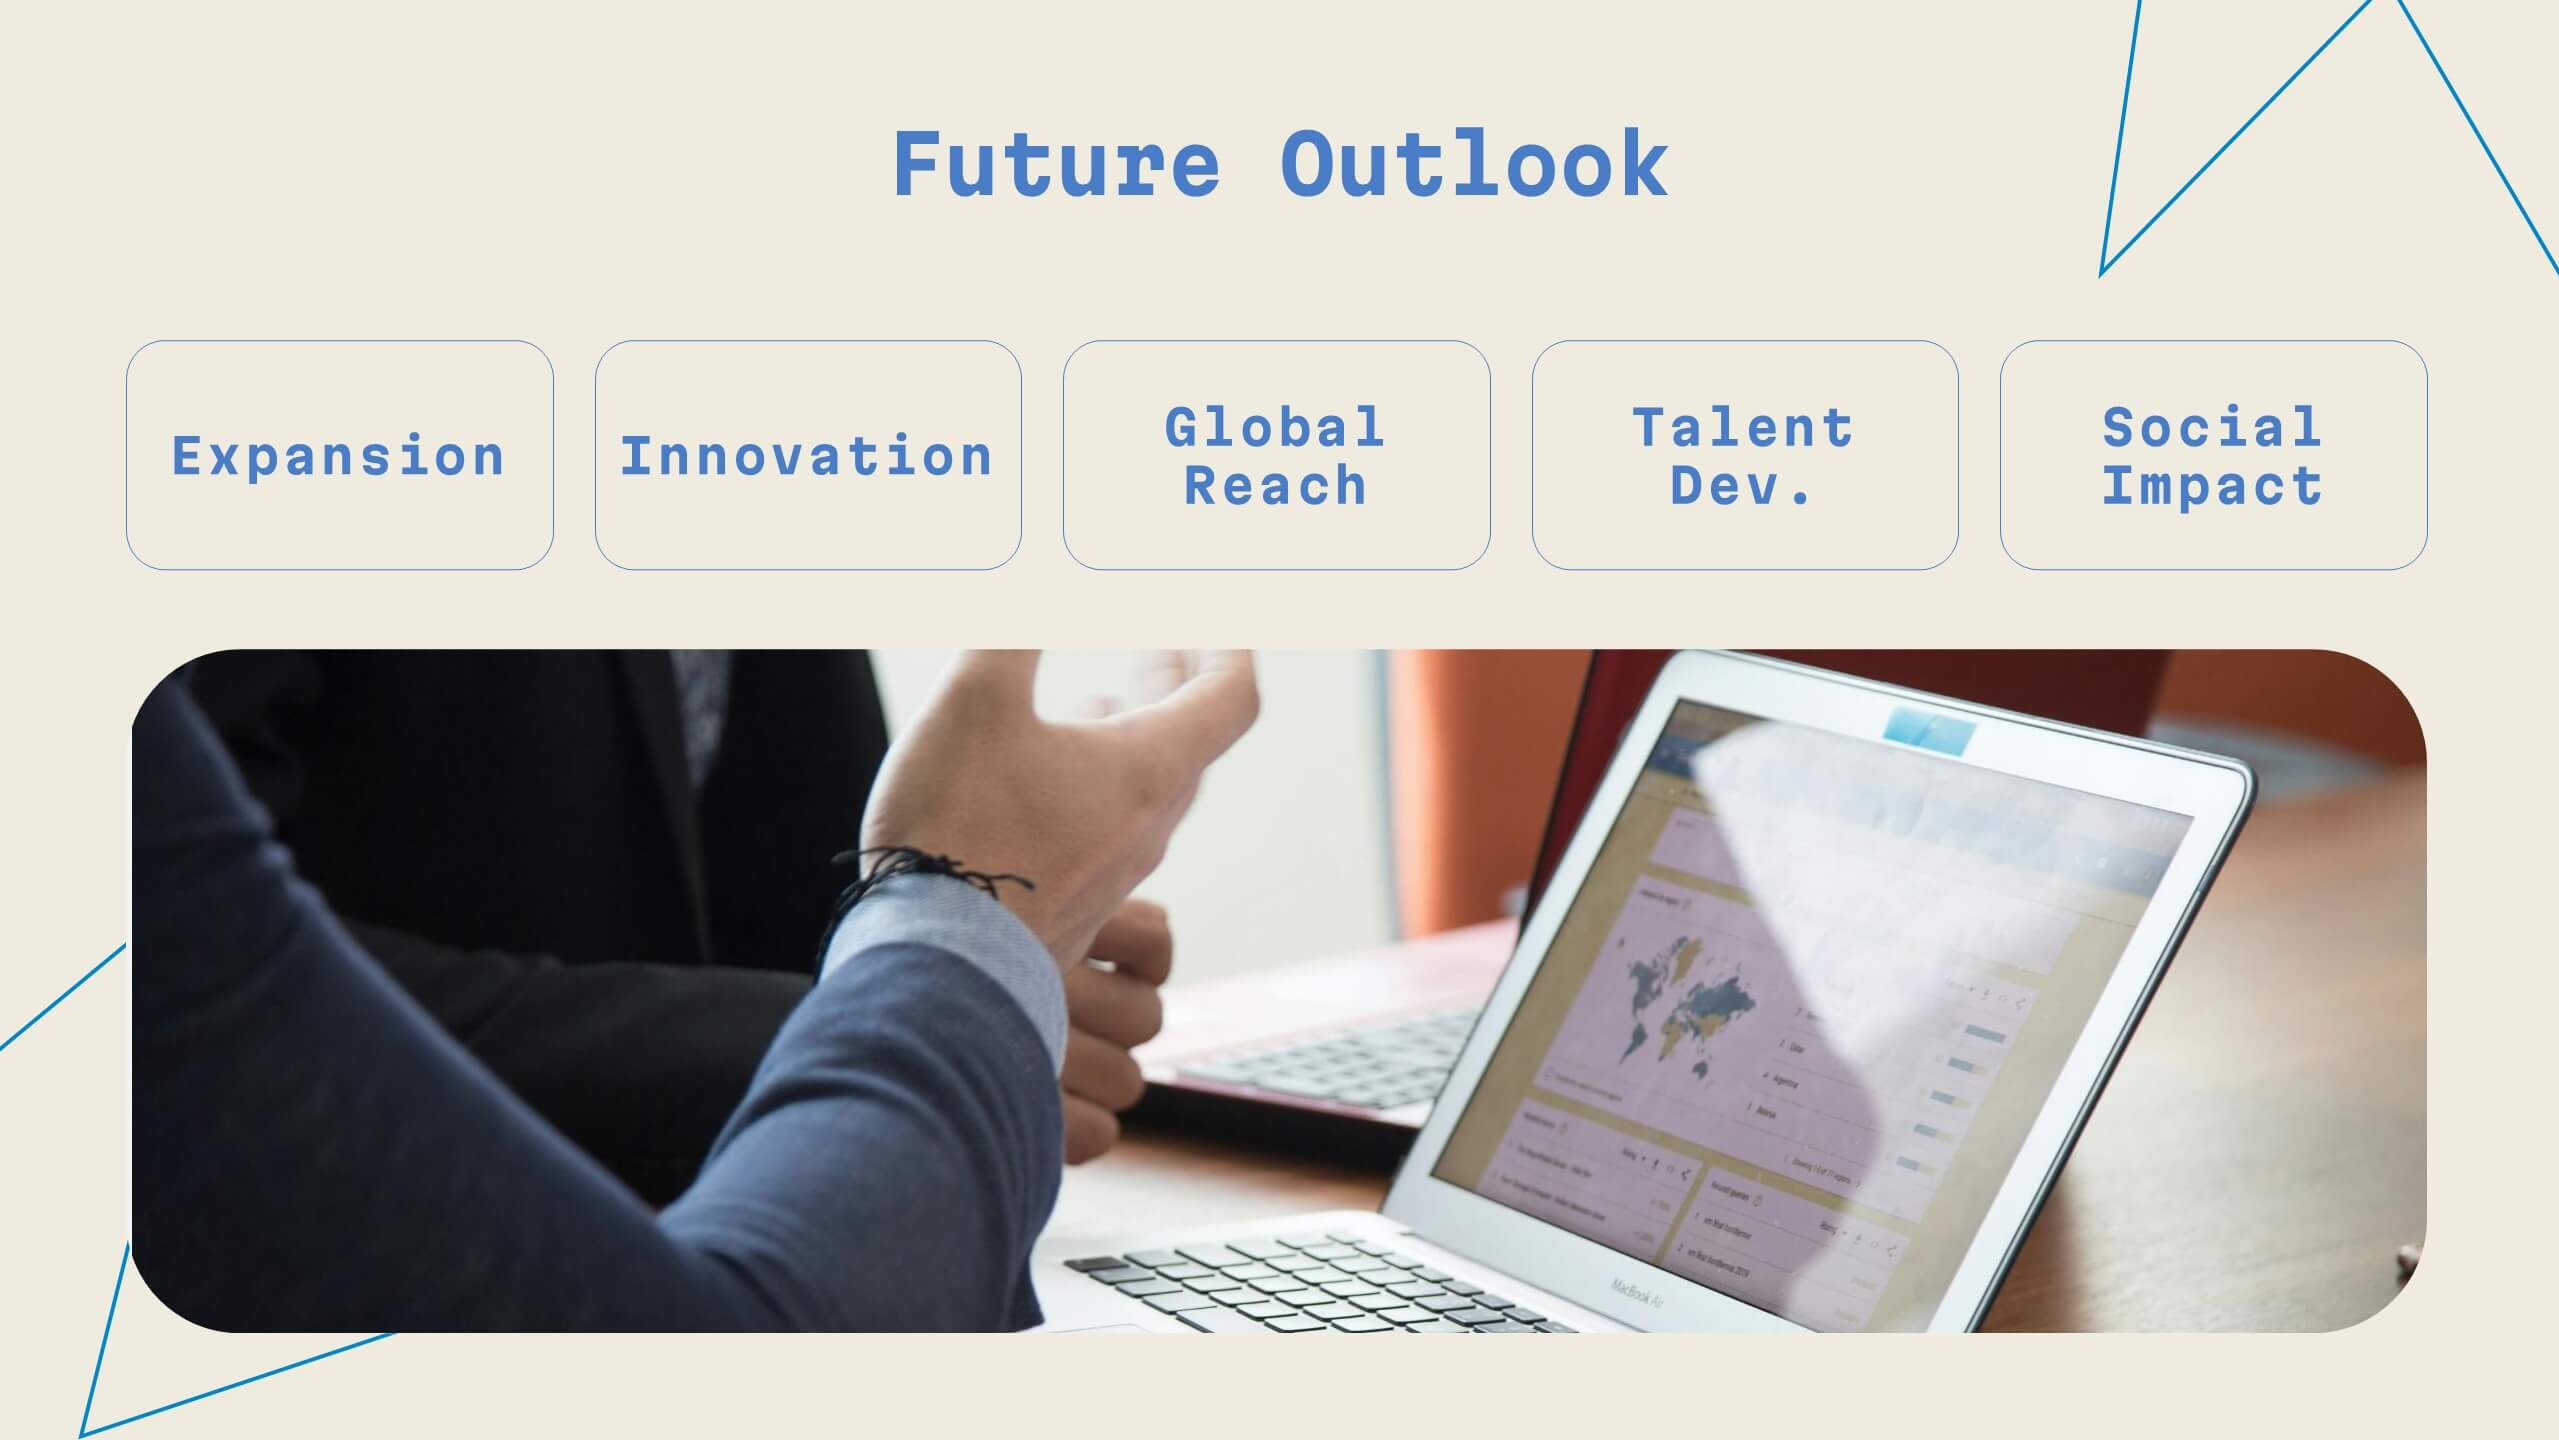
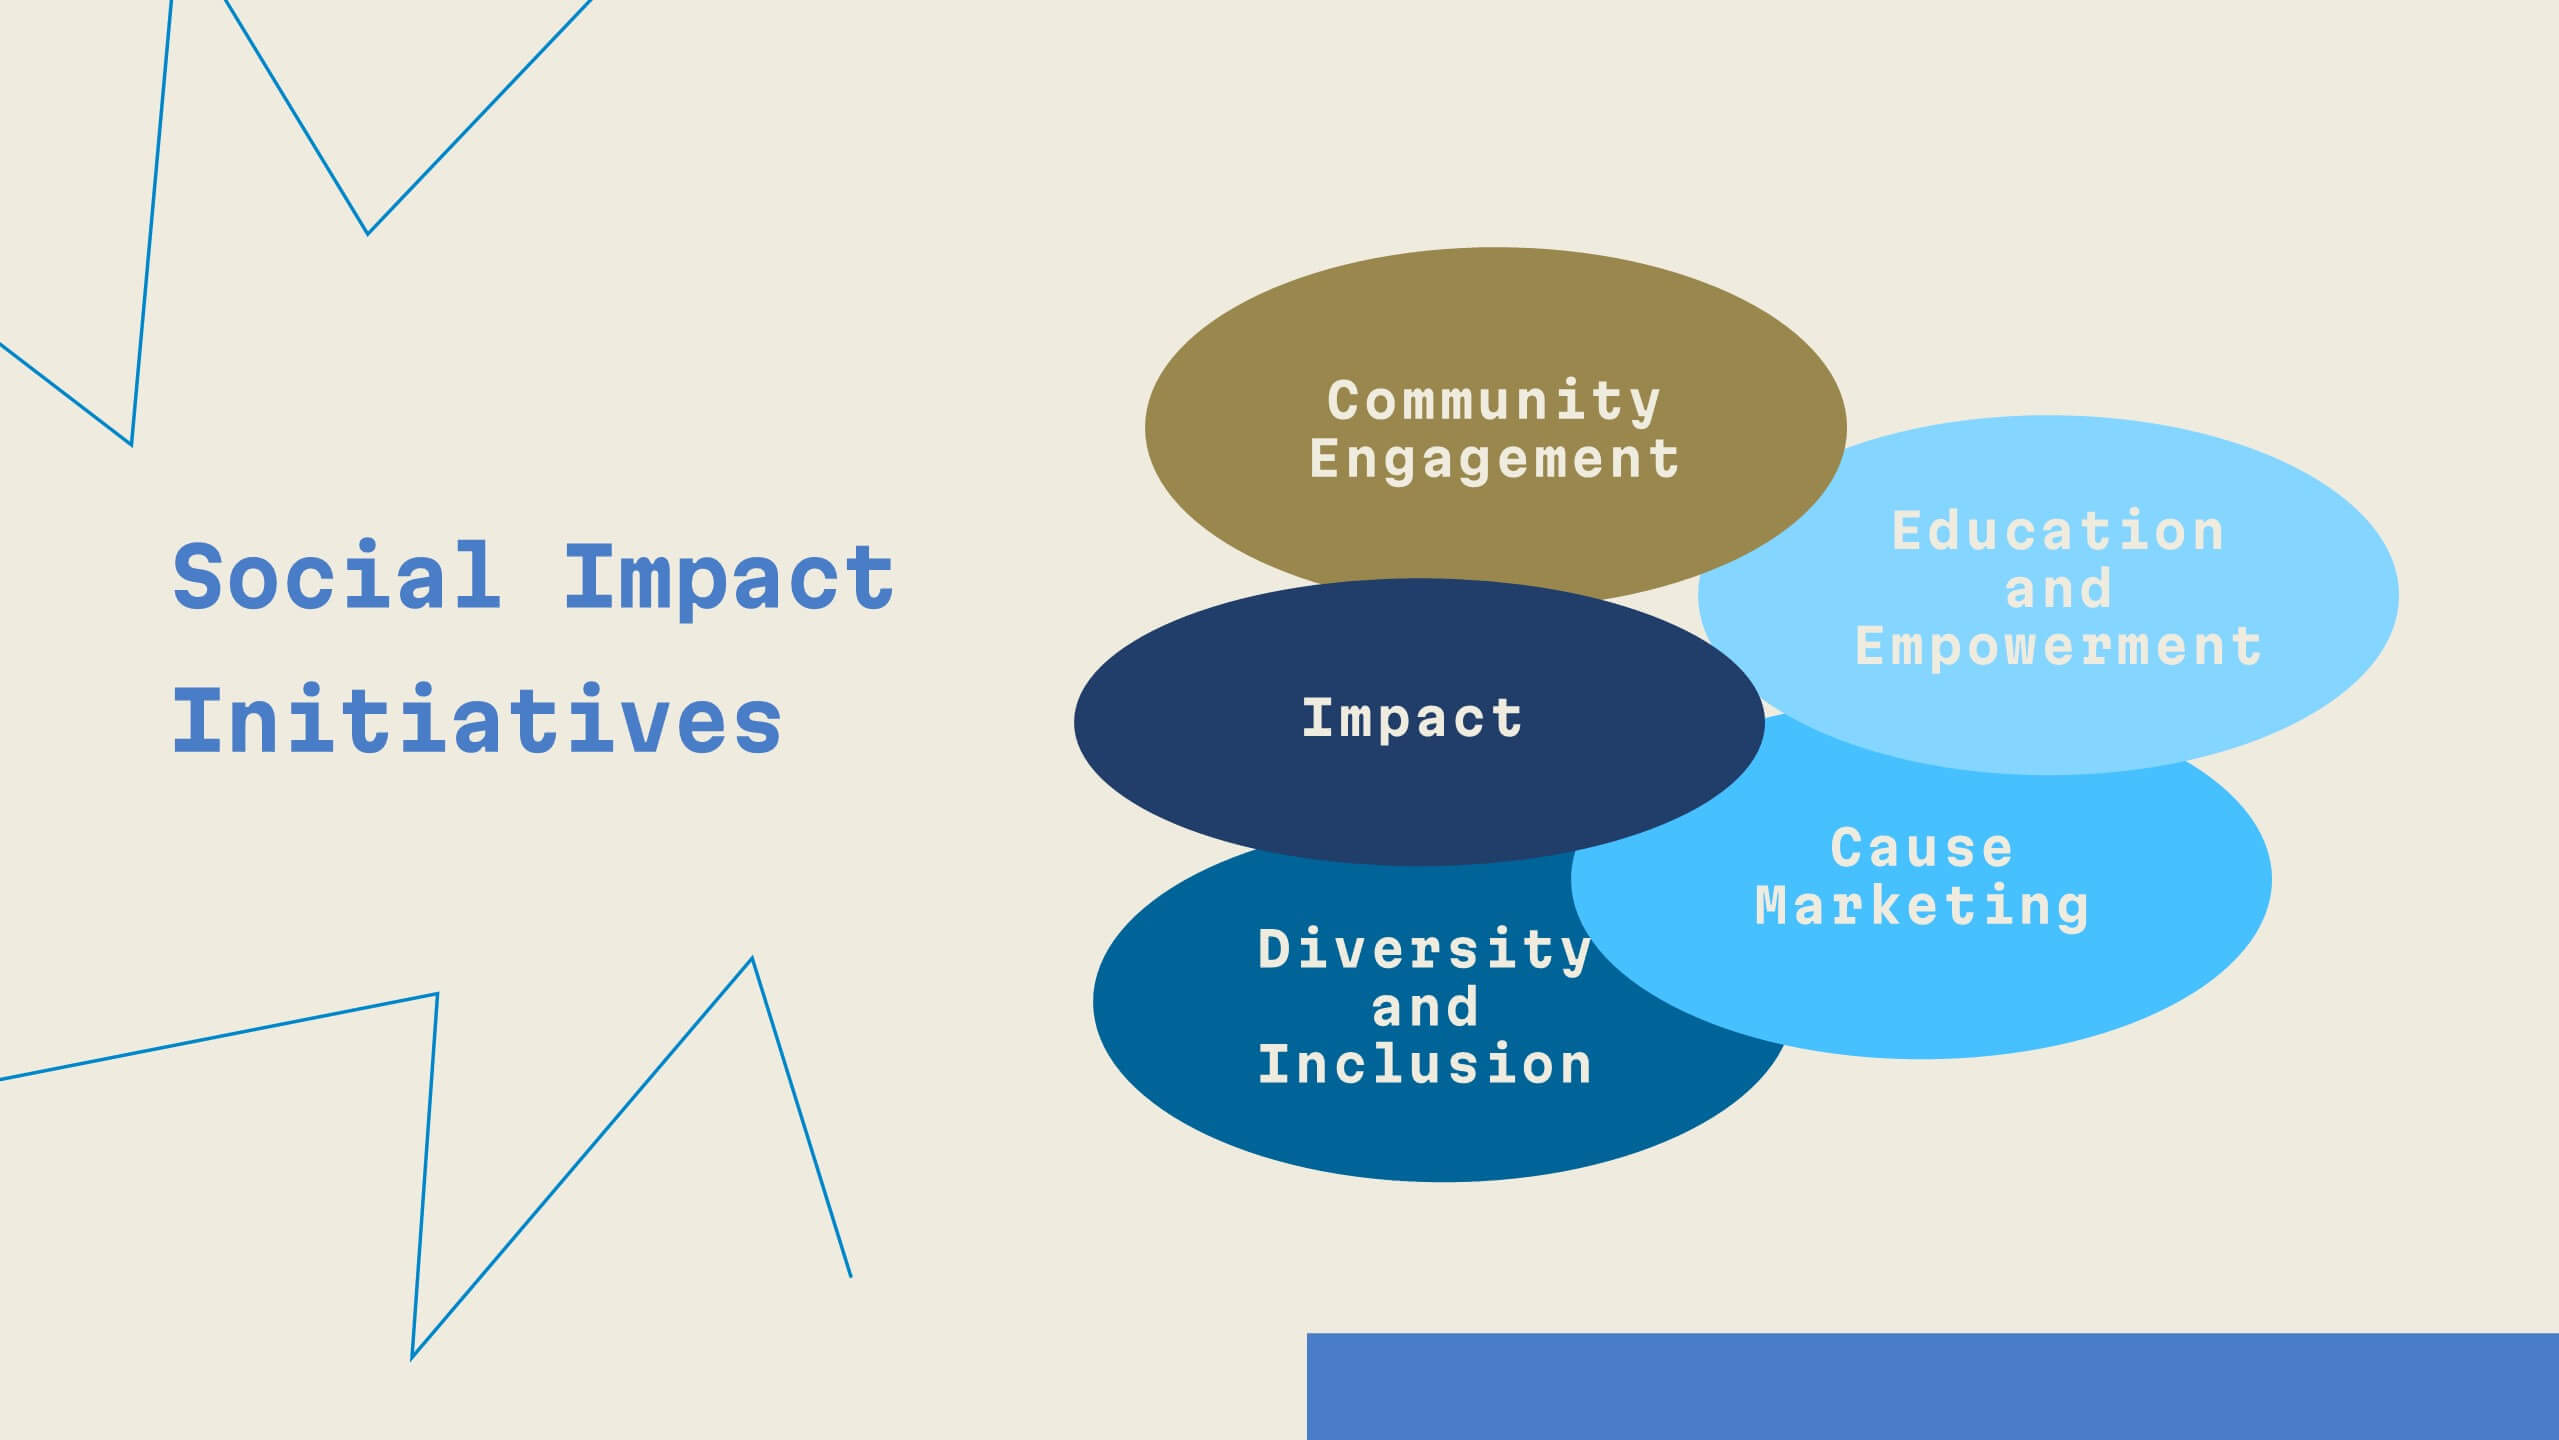
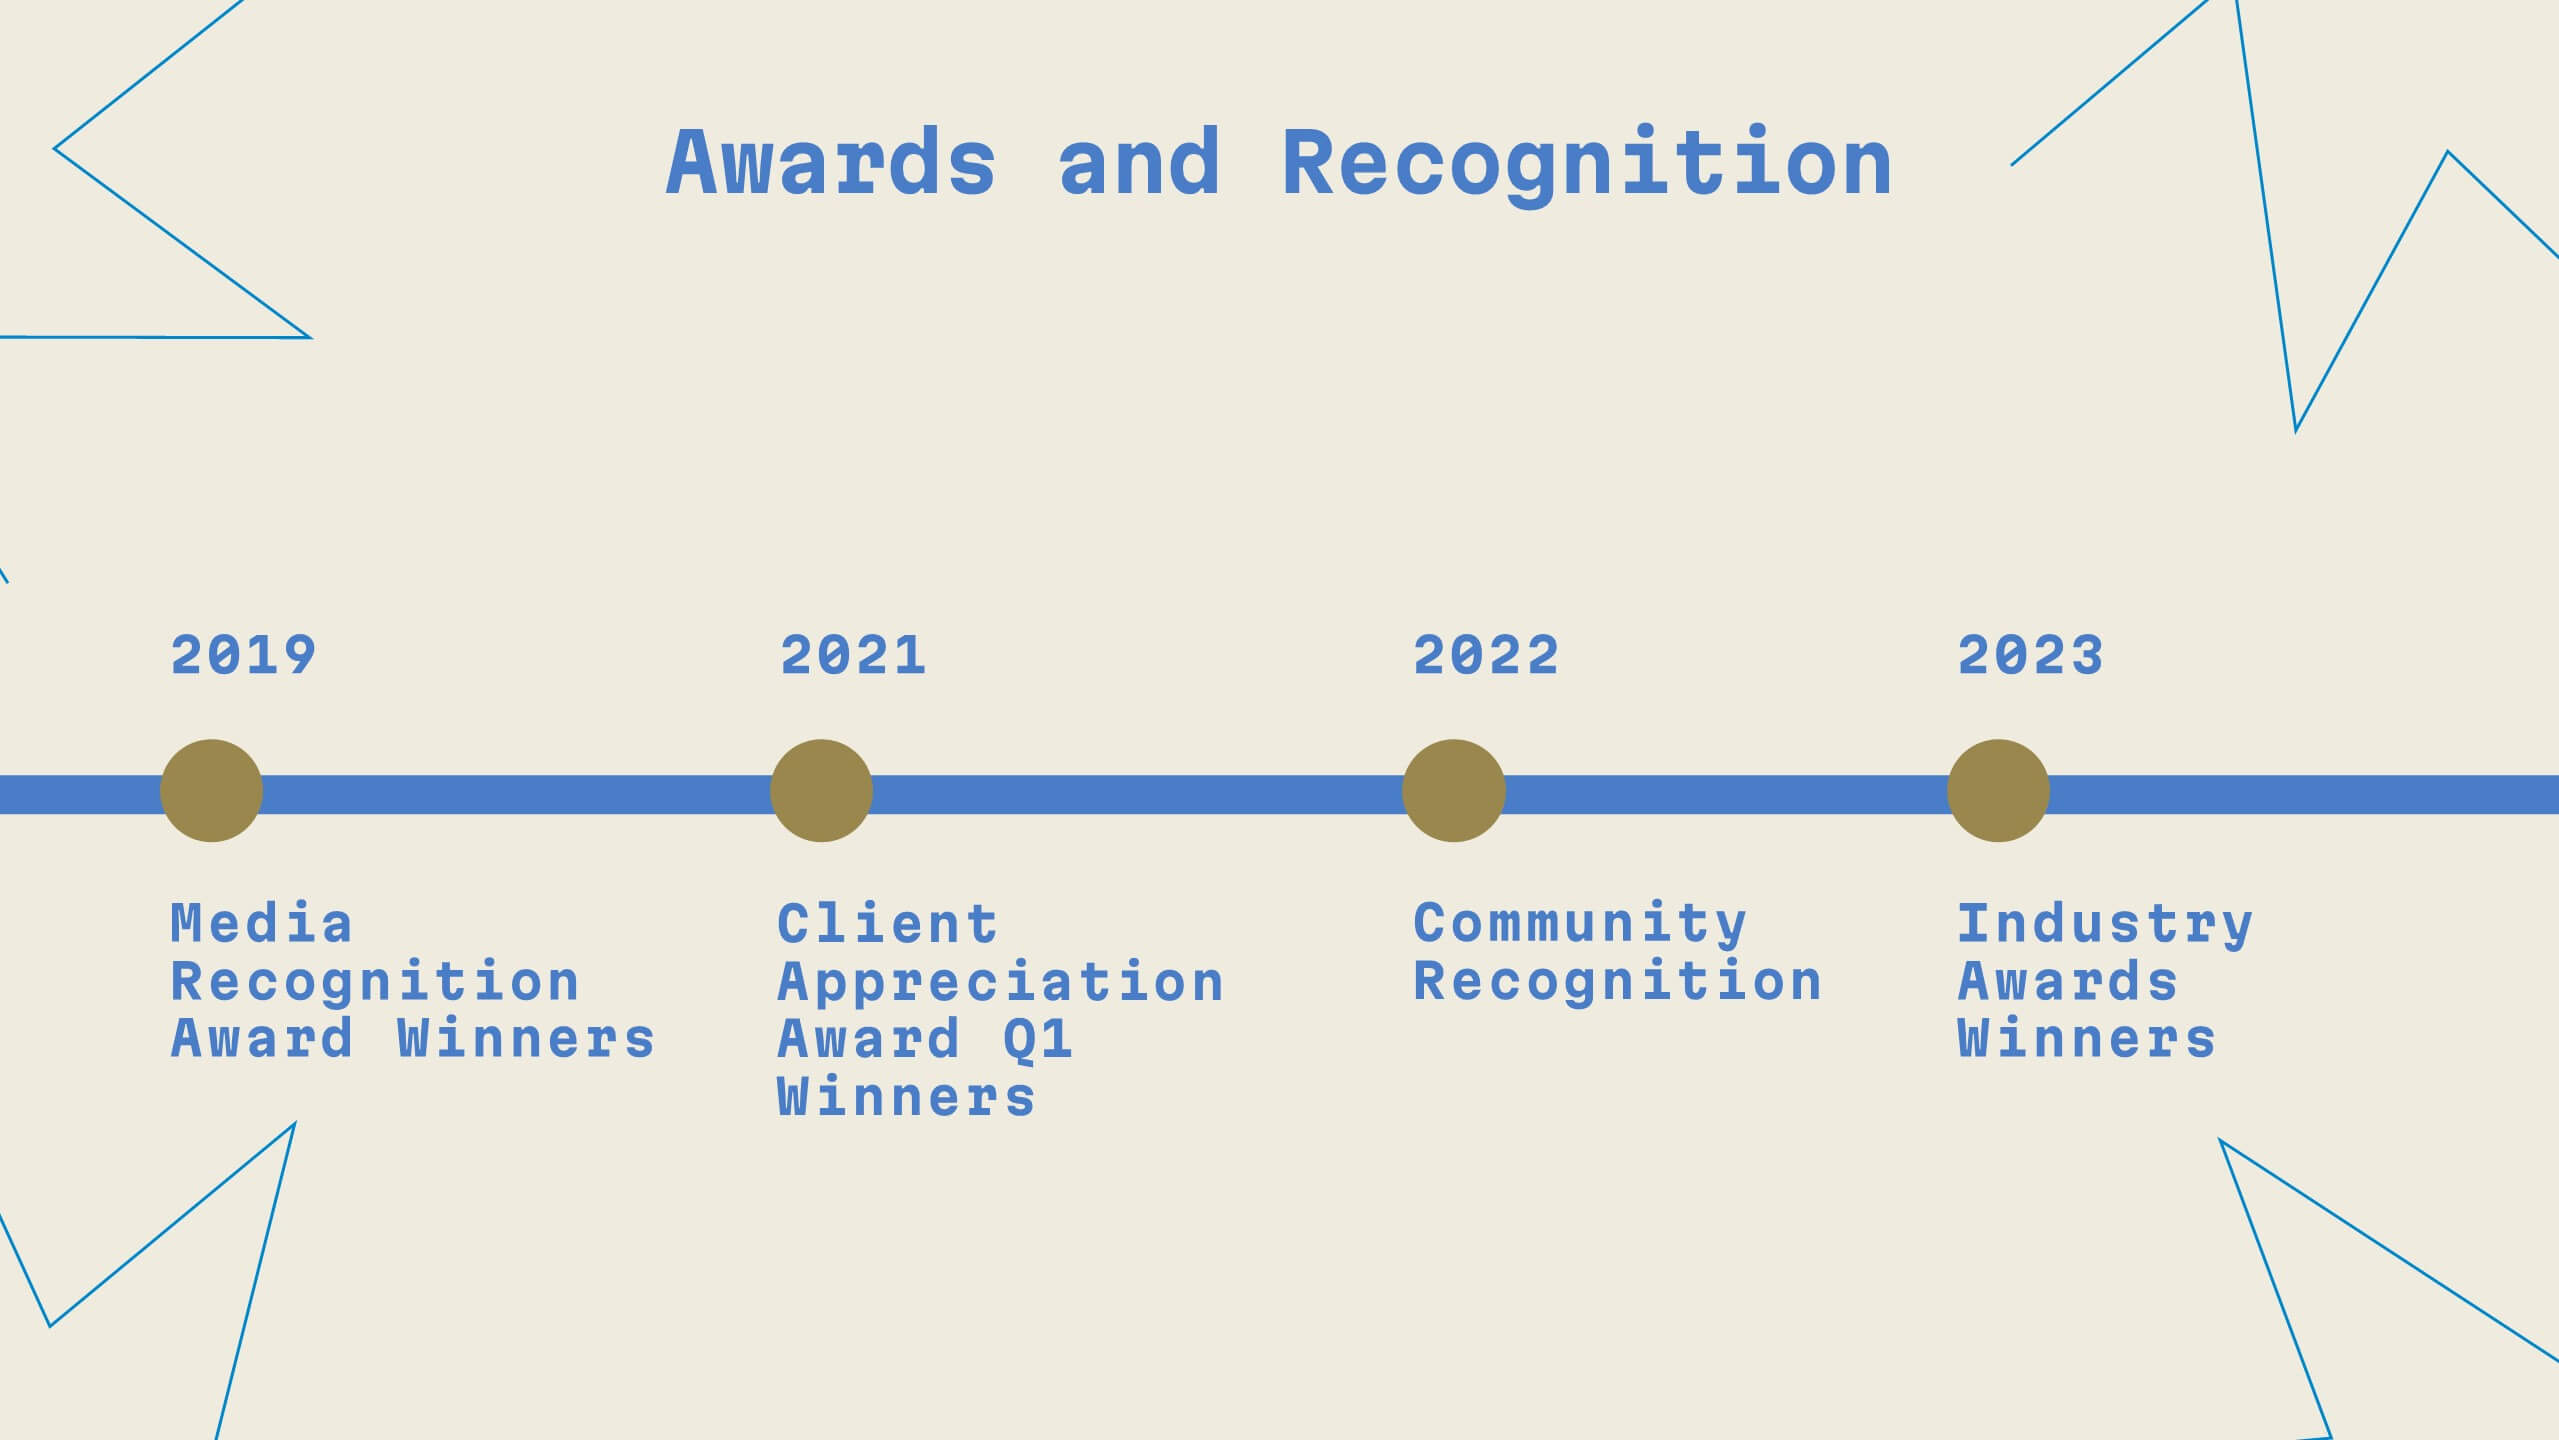
Unity Digital Agency Strategy Plan Presentation
Step into the future of digital marketing with this sleek template! From case studies to strategy development, it offers a comprehensive guide for creating impactful presentations. Highlight client success stories, industry trends, and creative processes with ease. Perfect for showcasing your agency's expertise. Compatible with PowerPoint, Keynote, and Google Slides.


6 diapositivas
Medical School Infographics
The "Medical School" infographic template is a meticulously curated and visually sophisticated tool, expertly tailored for PowerPoint, Keynote, and Google Slides. This template is an indispensable asset for medical educators, students, and healthcare professionals, aiming to illustrate the rigorous and multi-faceted journey of medical education. This template masterfully outlines key components of medical school, including curriculum structure, clinical rotations, research opportunities, and key milestones like exams and residencies. Its organized and detailed layout is perfect for guiding prospective students, orienting new enrollees, or showcasing medical programs during educational fairs and open houses. The design is as professional as it is educational, with a color scheme that is both serene and scholarly. This not only ensures your presentation is visually appealing but also aligns with the serious and life-changing nature of medical education. Whether it's used for orientation, academic presentations, or informational seminars, this template ensures that the journey through "Medical School" is presented in a manner that's both comprehensive and visually compelling.


7 diapositivas
Law Infographics Presentation Template
Featuring our Law Infographic template it is a modern and stylish template for making a presentation about law. It comes with a clean design, typography and plenty of space for annotations and is compatible with powerpoint. This template is suitable for a presentation about business, management, finance or marketing. It contains a one page design, illustrations and many different elements to help you build a strong and compelling presentation. Essential and easy to use, this law Infographic template is a great tool for anyone who wants to make an attractive and professional presentation.


4 diapositivas
Lab Research Data Analysis Layout Presentation
Present your scientific findings with clarity using this Lab Research Data Analysis Layout Template. Featuring molecular, lab flask, and data icons in a connected node design, it's ideal for researchers and analysts. Fully editable in PowerPoint, Keynote, and Google Slides, this clean layout ensures your data is both visual and professional.


20 diapositivas
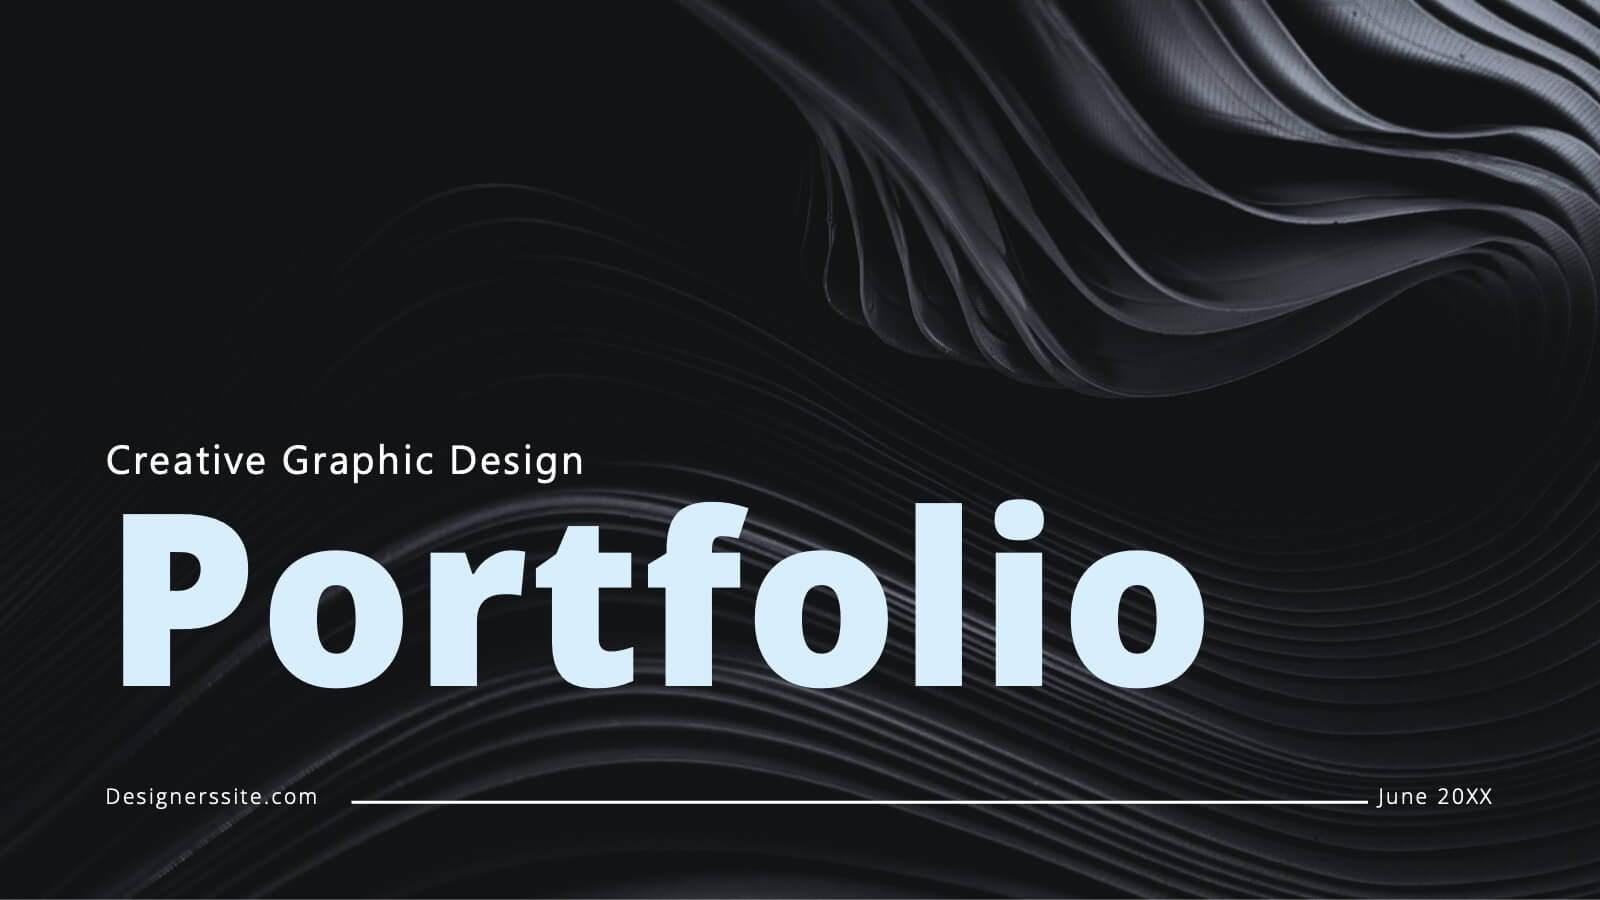
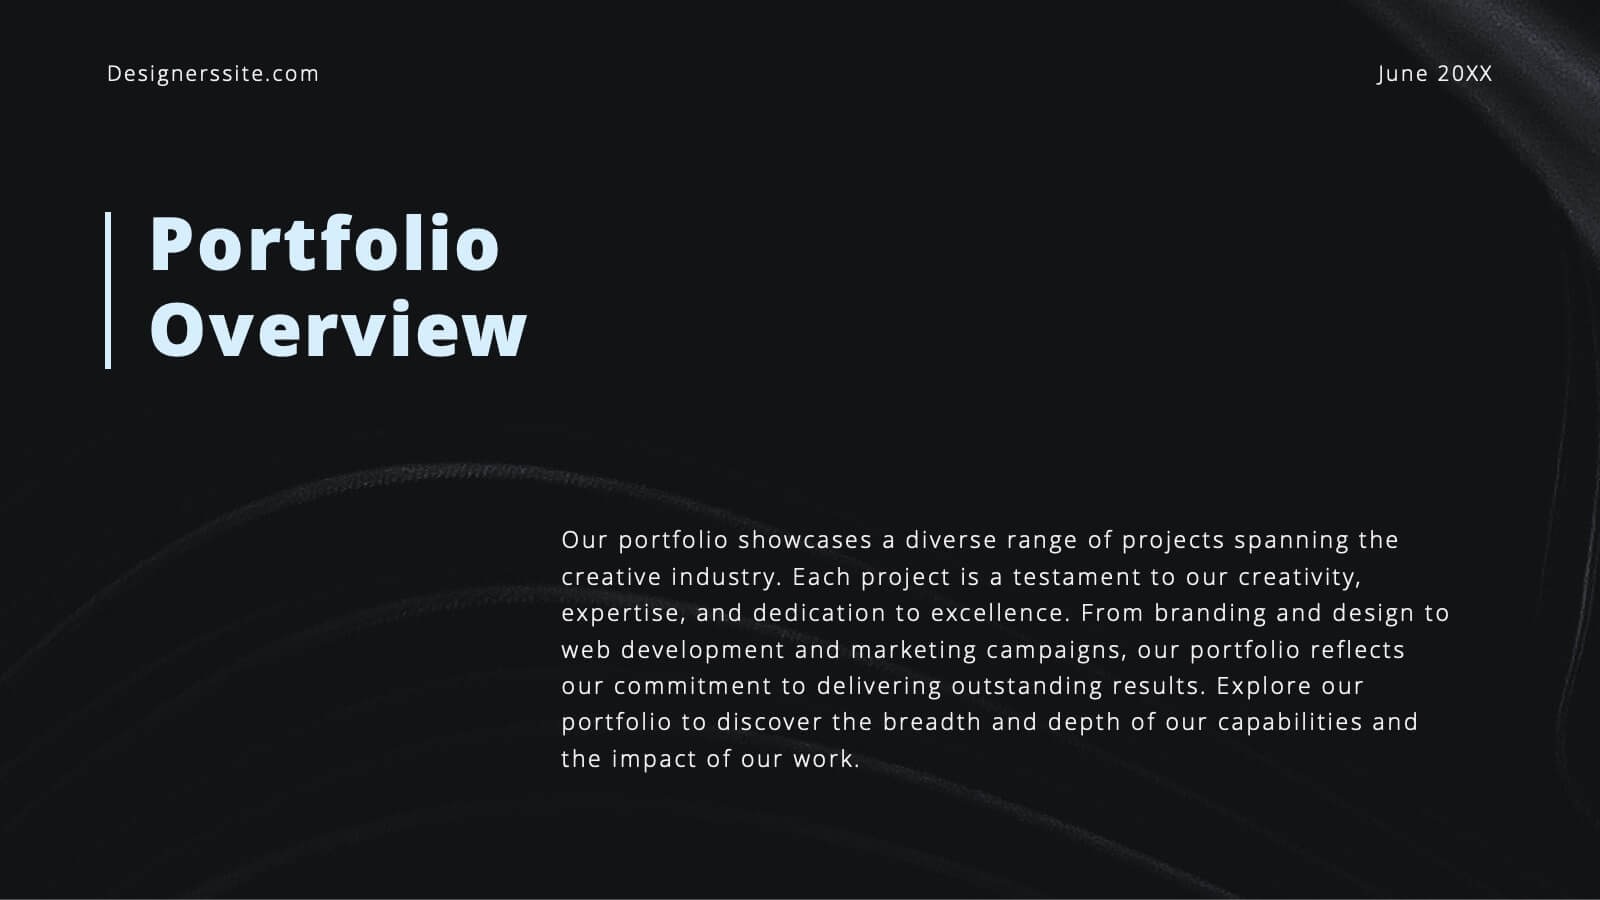
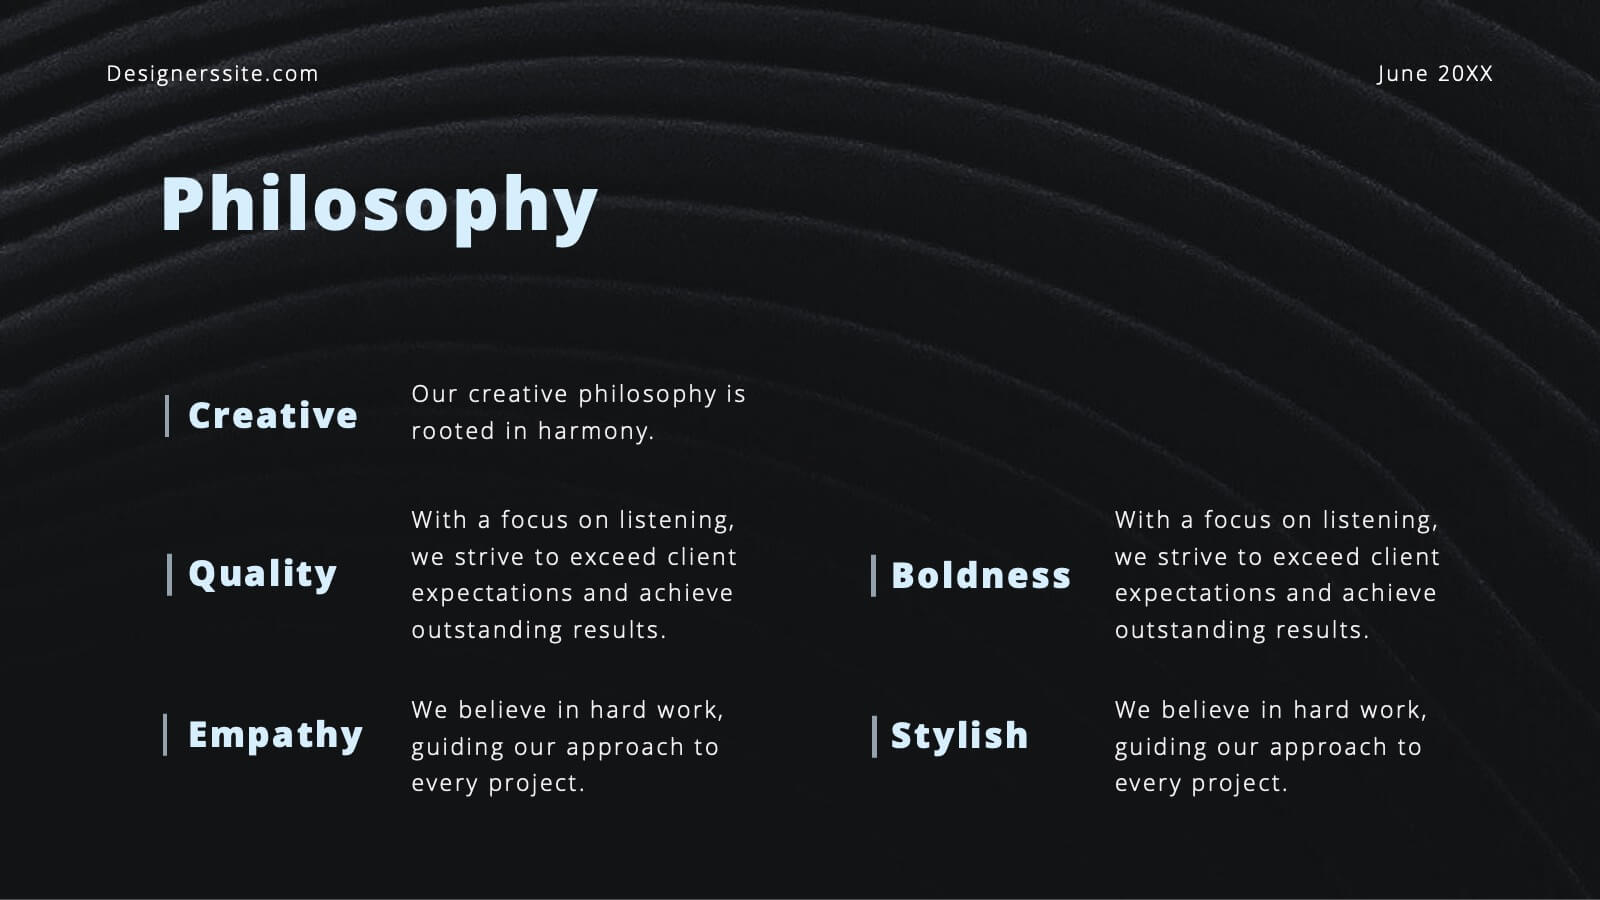
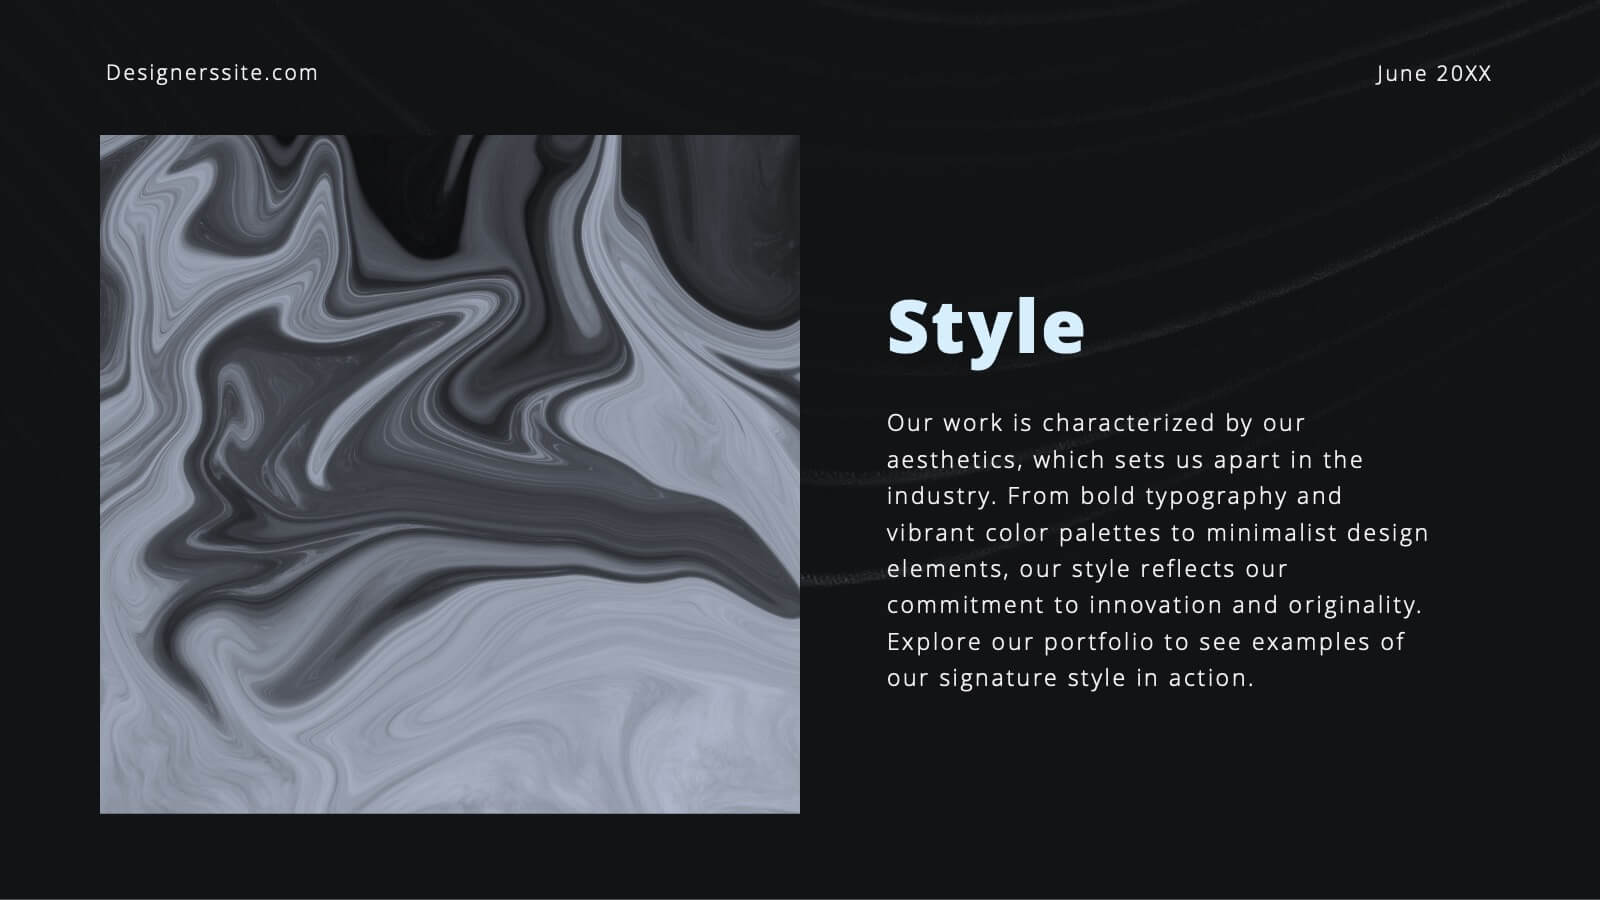
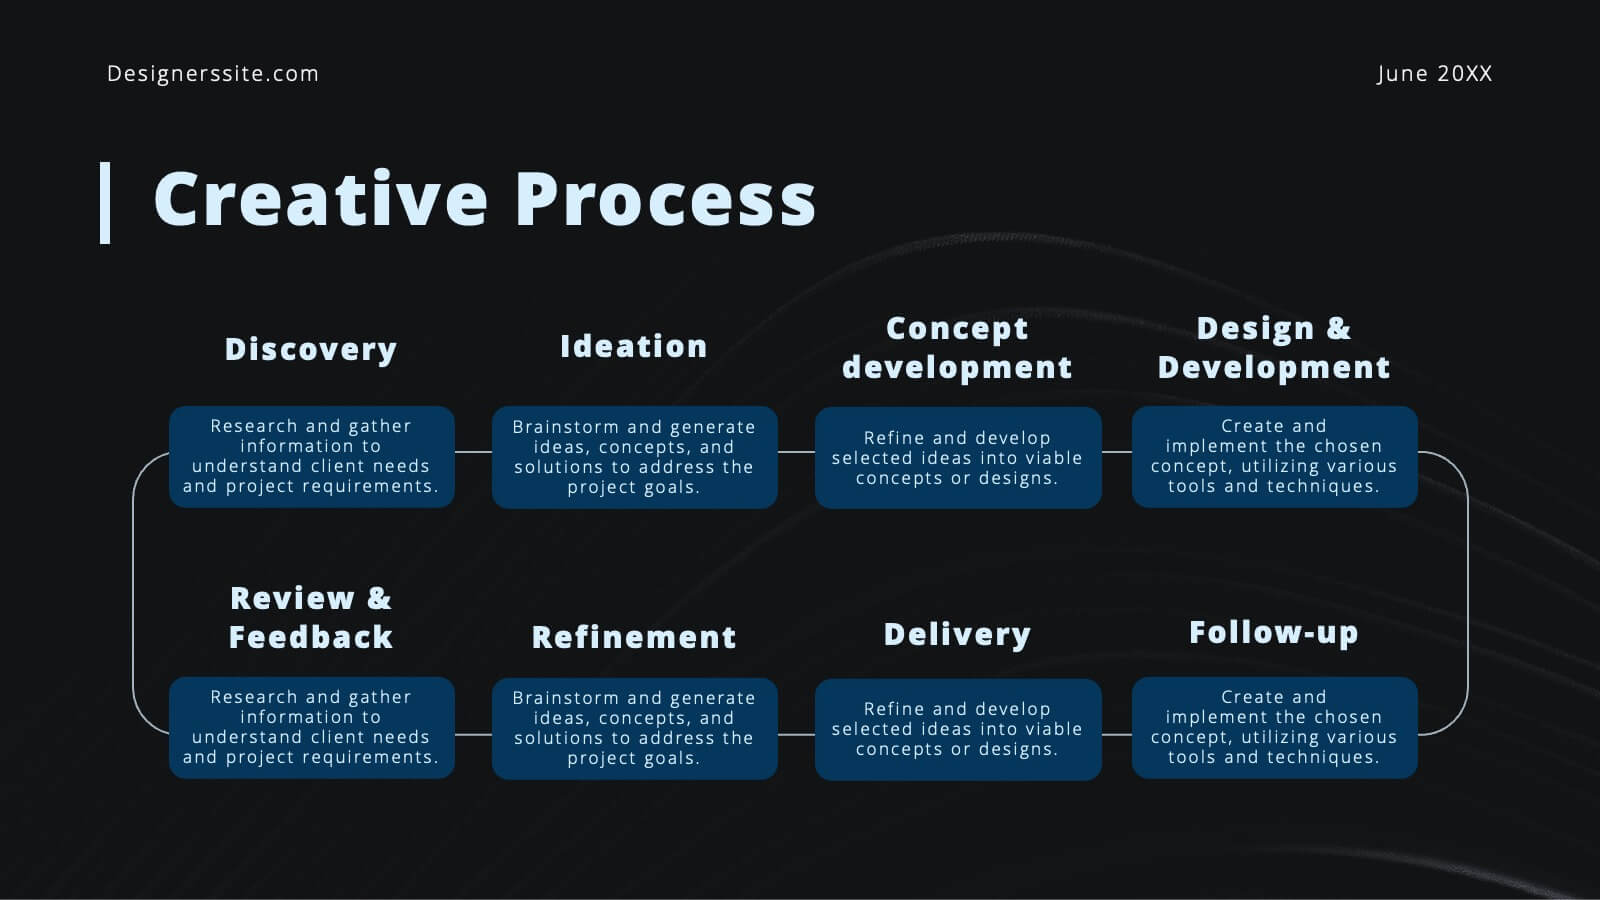
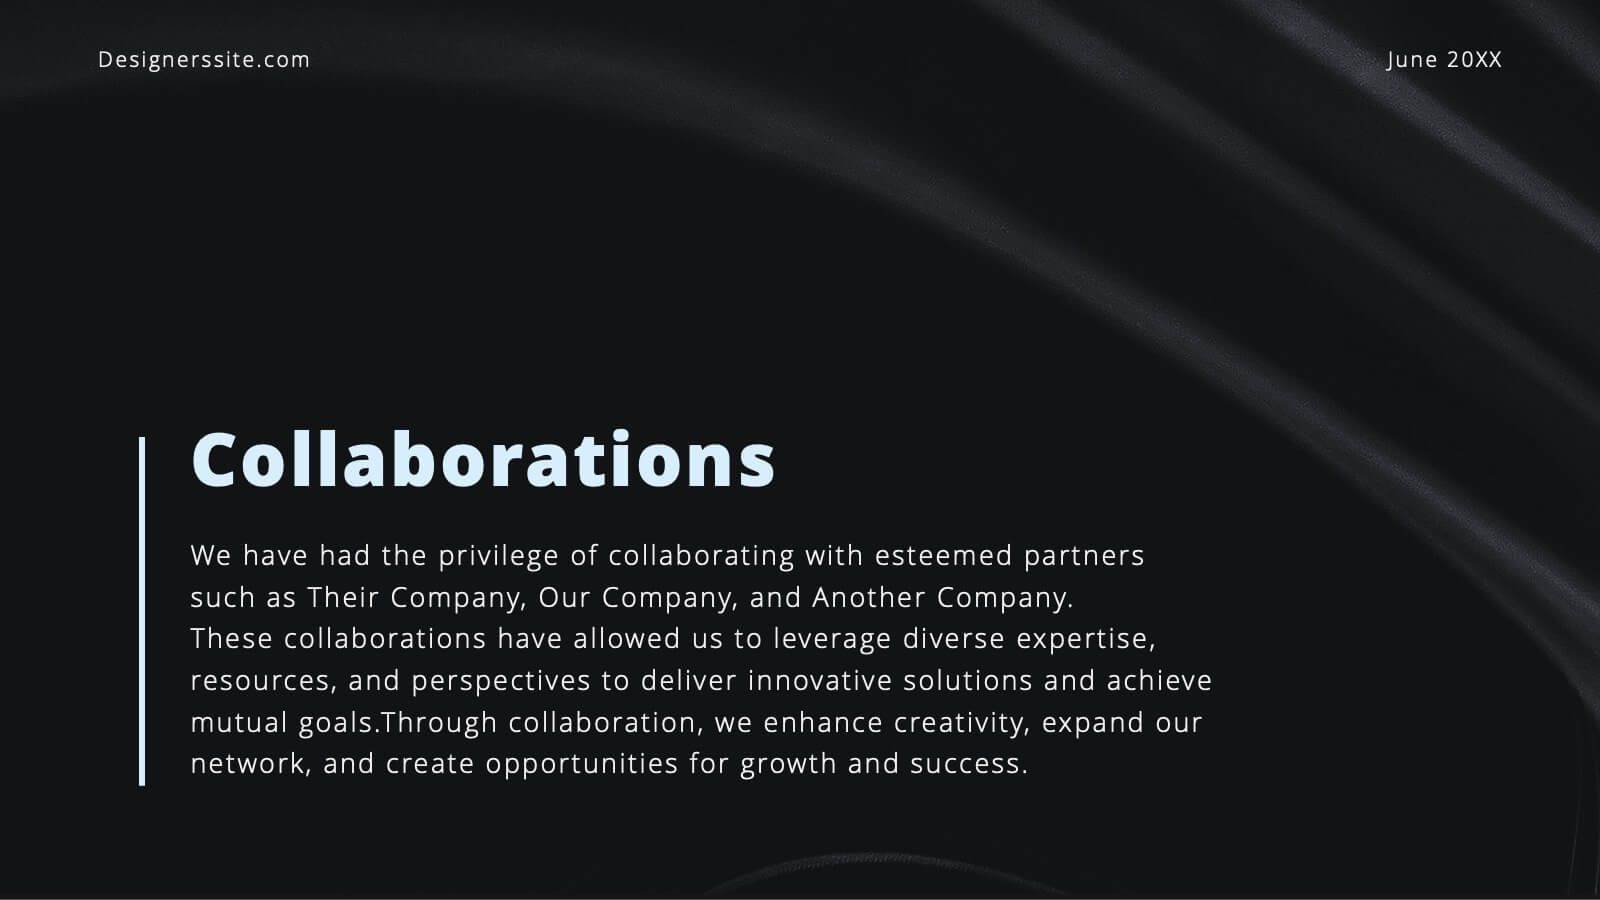
Bravo Creative Portfolio Presentation
Showcase your creative prowess with this sleek, modern portfolio presentation template. Perfect for highlighting featured projects, client testimonials, and your creative process, this template ensures your work shines. Its stylish design and professional layout make it ideal for impressing potential clients and collaborators. Compatible with PowerPoint, Keynote, and Google Slides, it's versatile for any platform.


8 diapositivas
Inbound and Outbound Value Chain Strategy Presentation
Streamline your supply chain insights with the Inbound and Outbound Value Chain Strategy Presentation. This structured layout highlights the key components of internal and external logistics—from sourcing and procurement to product delivery. Use this template to showcase strategic operations, process optimization, and value-adding activities. Fully editable in PowerPoint, Keynote, Canva, and Google Slides.


5 diapositivas
Health Care Infographics
Taking care of your health is an investment in your future self and can lead to a happier and more fulfilling life. These vertical health care infographics are visual representations of information related to health care. They can cover a wide range of topics, such as disease prevention, medical treatments, and patient care. These are designed to be easily understandable and engaging for a general audience. They use colorful graphics and illustrations to convey complex information in an eye-catching manner. These also include graphs, diagrams text boxes, and other design elements to highlight key information.


6 diapositivas
Travel Insurance Infographics
Our "Travel Insurance" infographic template, compatible with PowerPoint, Keynote, and Google Slides, is crafted for insurance companies, travel agencies, and financial advisors. This template is an excellent tool for explaining the benefits and details of travel insurance to clients and customers. The template comprehensively covers vital elements such as coverage options, emergency assistance services, and claim procedures. Its clear and organized layout makes it easy to convey complex insurance information in a manner that is both accessible and engaging. This is particularly useful for presentations aimed at educating travelers about the importance and benefits of travel insurance. Designed with a bright and inviting travel-themed color scheme, the template incorporates elements that reflect global travel and security. This not only makes the presentation visually appealing but also resonates with the theme of travel and protection. Whether used in client consultations, marketing materials, or informational workshops, this template ensures that the key aspects of travel insurance are presented clearly and attractively.


4 diapositivas
Differentiation through Blue Ocean Framework Presentation
Make waves with this bold, eye-catching layout built to show what sets your strategy apart. This presentation template explores how to stand out in untapped markets using a simple comparison framework, perfect for teams shifting from competition to innovation. Easily editable and ready for PowerPoint, Keynote, and Google Slides.


7 diapositivas
Prime Numbers Infographic Presentation
A numbers infographic is a visual representation of information using graphical elements such as charts, graphs, and diagrams. A well-crafted template is a powerful tool for conveying insights into your data. Numbers have the ability to transform your data into useful insights that can help you make an informed decision. This numbers infographics is made with different type of charts and diagrams, which will help you establish a relation between numbers and words. This fully editable template is designed to present numbers, data and statistics in a creative way unique to your brand.