


Características


¿Tienes alguna pregunta?
Recomendar


10 diapositivas
Key Business Insights Executive Summary Presentation
Showcase your strategic insights effectively with the 'Key Business Insights Executive Summary' template. This visually appealing tool highlights critical data points and metrics, enabling a clear presentation of business achievements and forecasts. Perfectly tailored for use in PowerPoint, Keynote, and Google Slides, it ensures your executive summaries are both comprehensive and compelling.


26 diapositivas
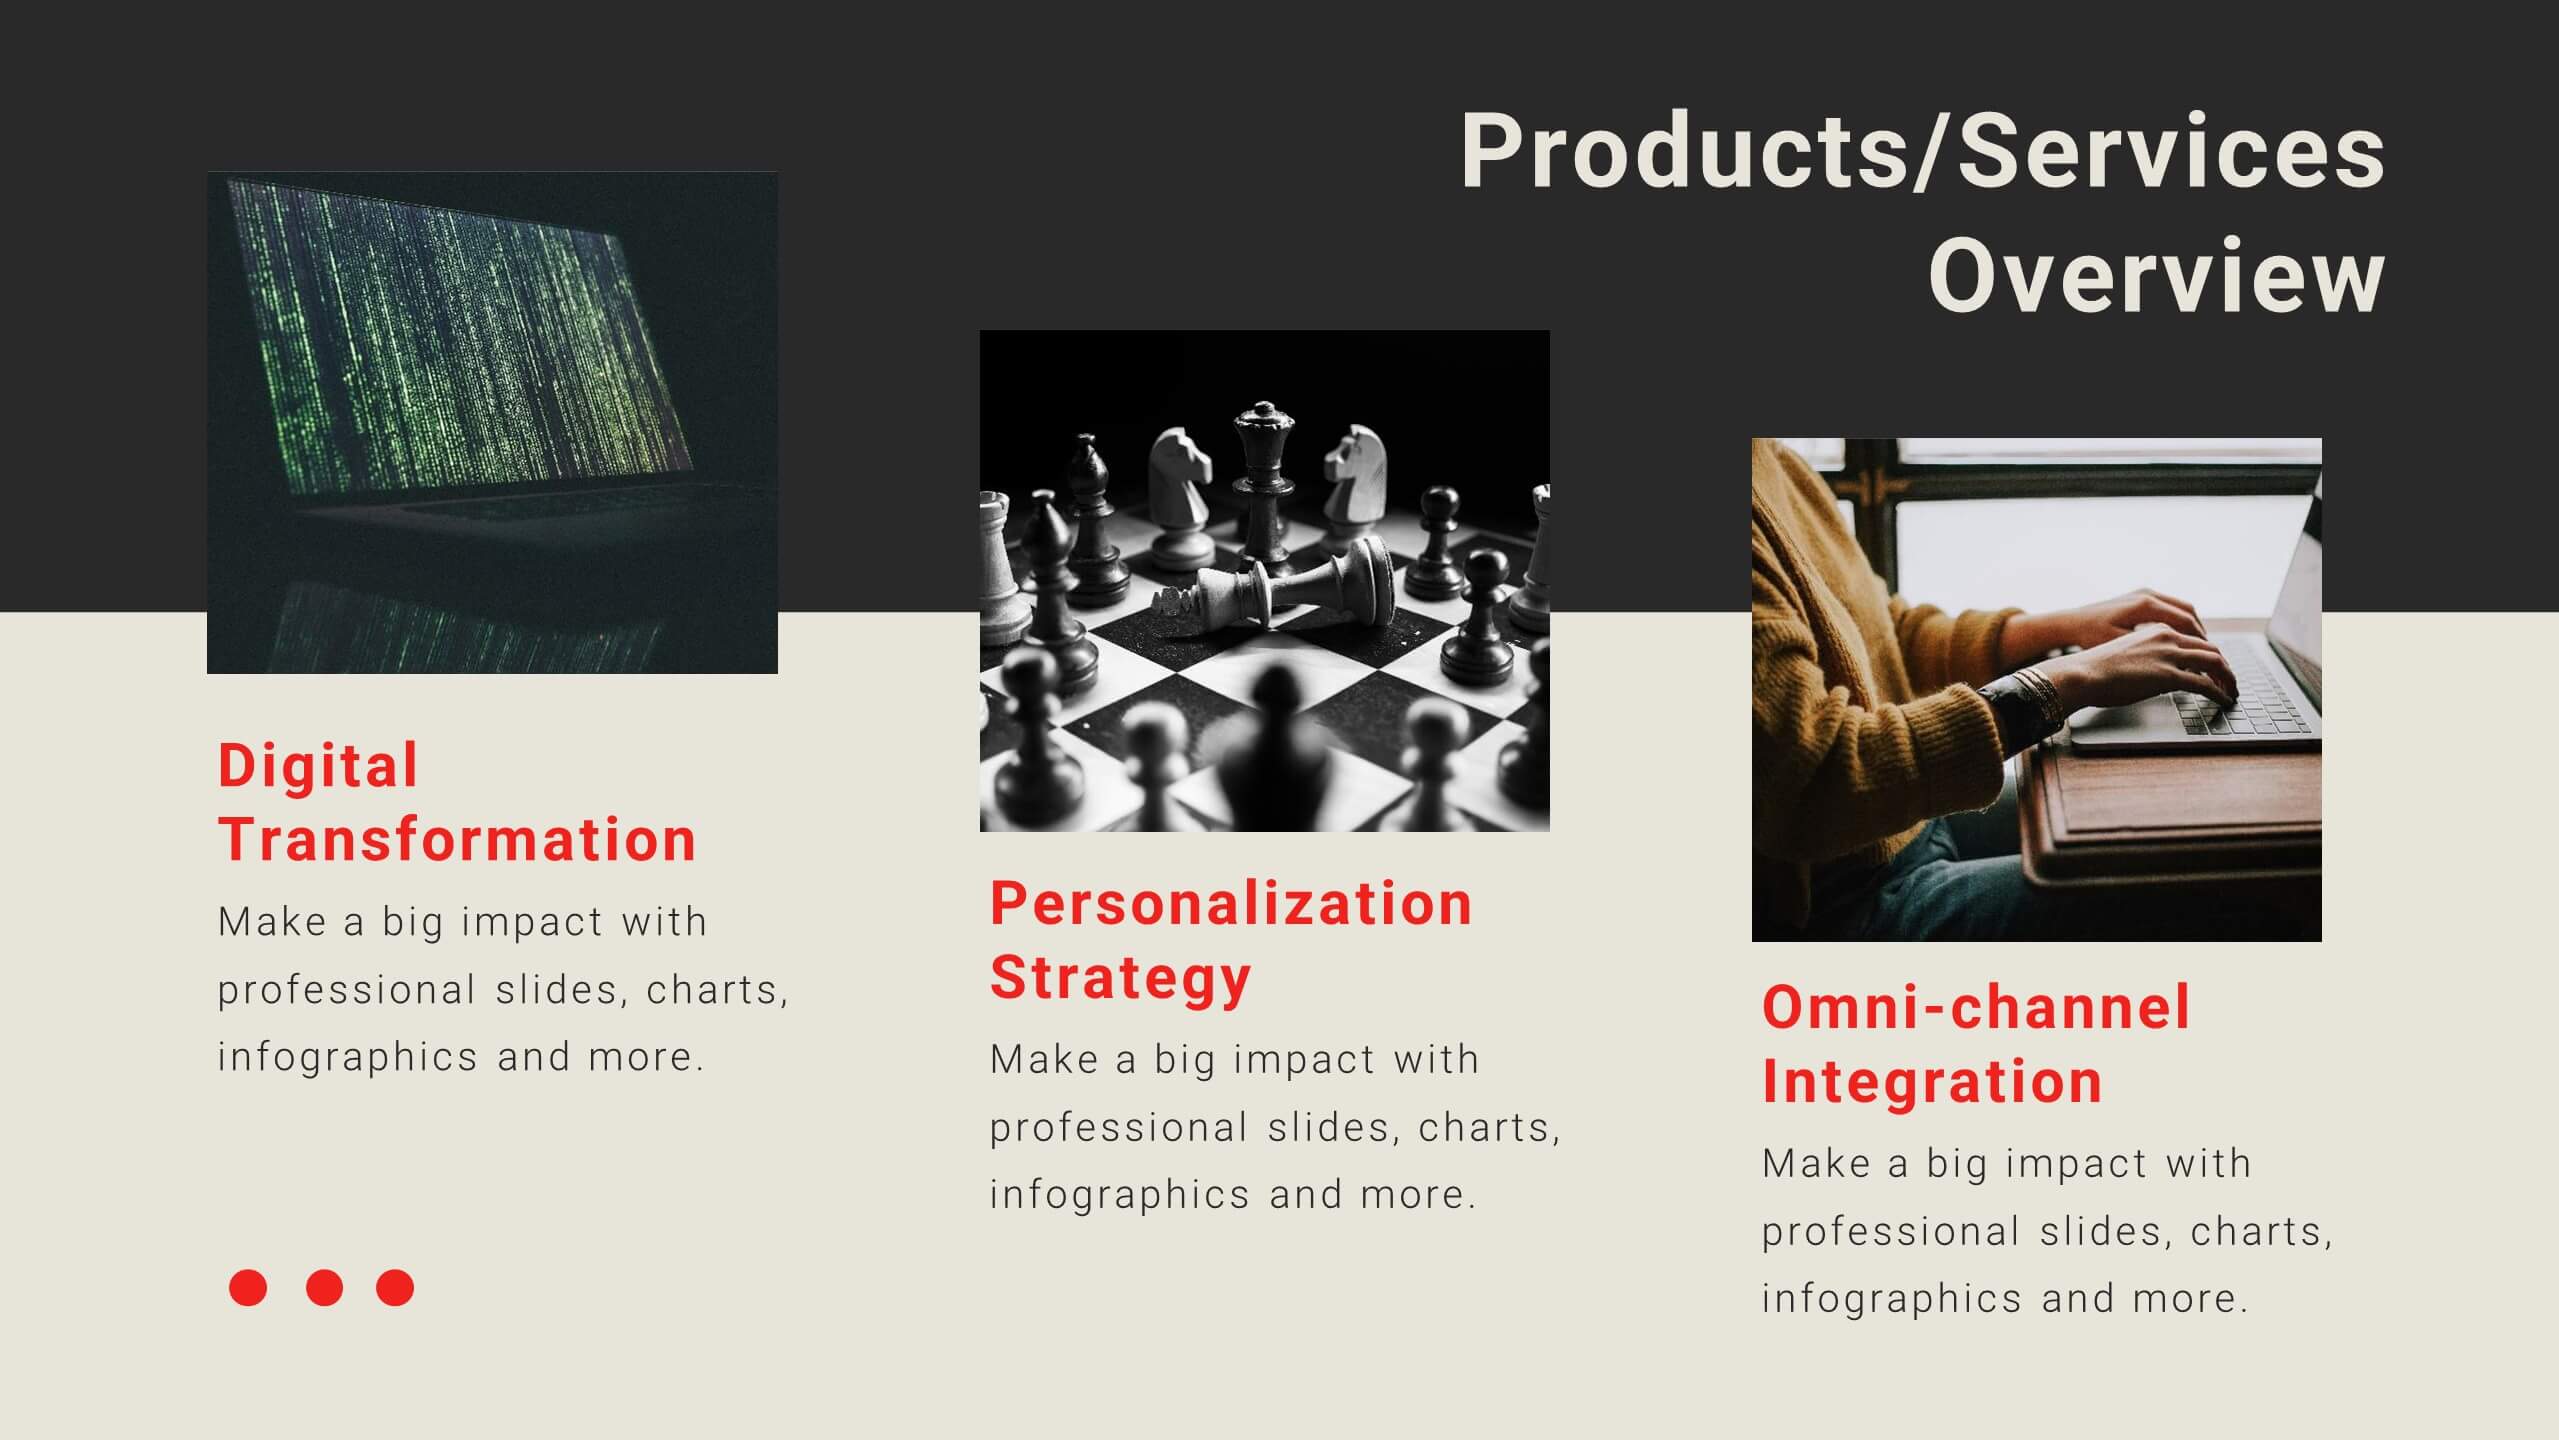
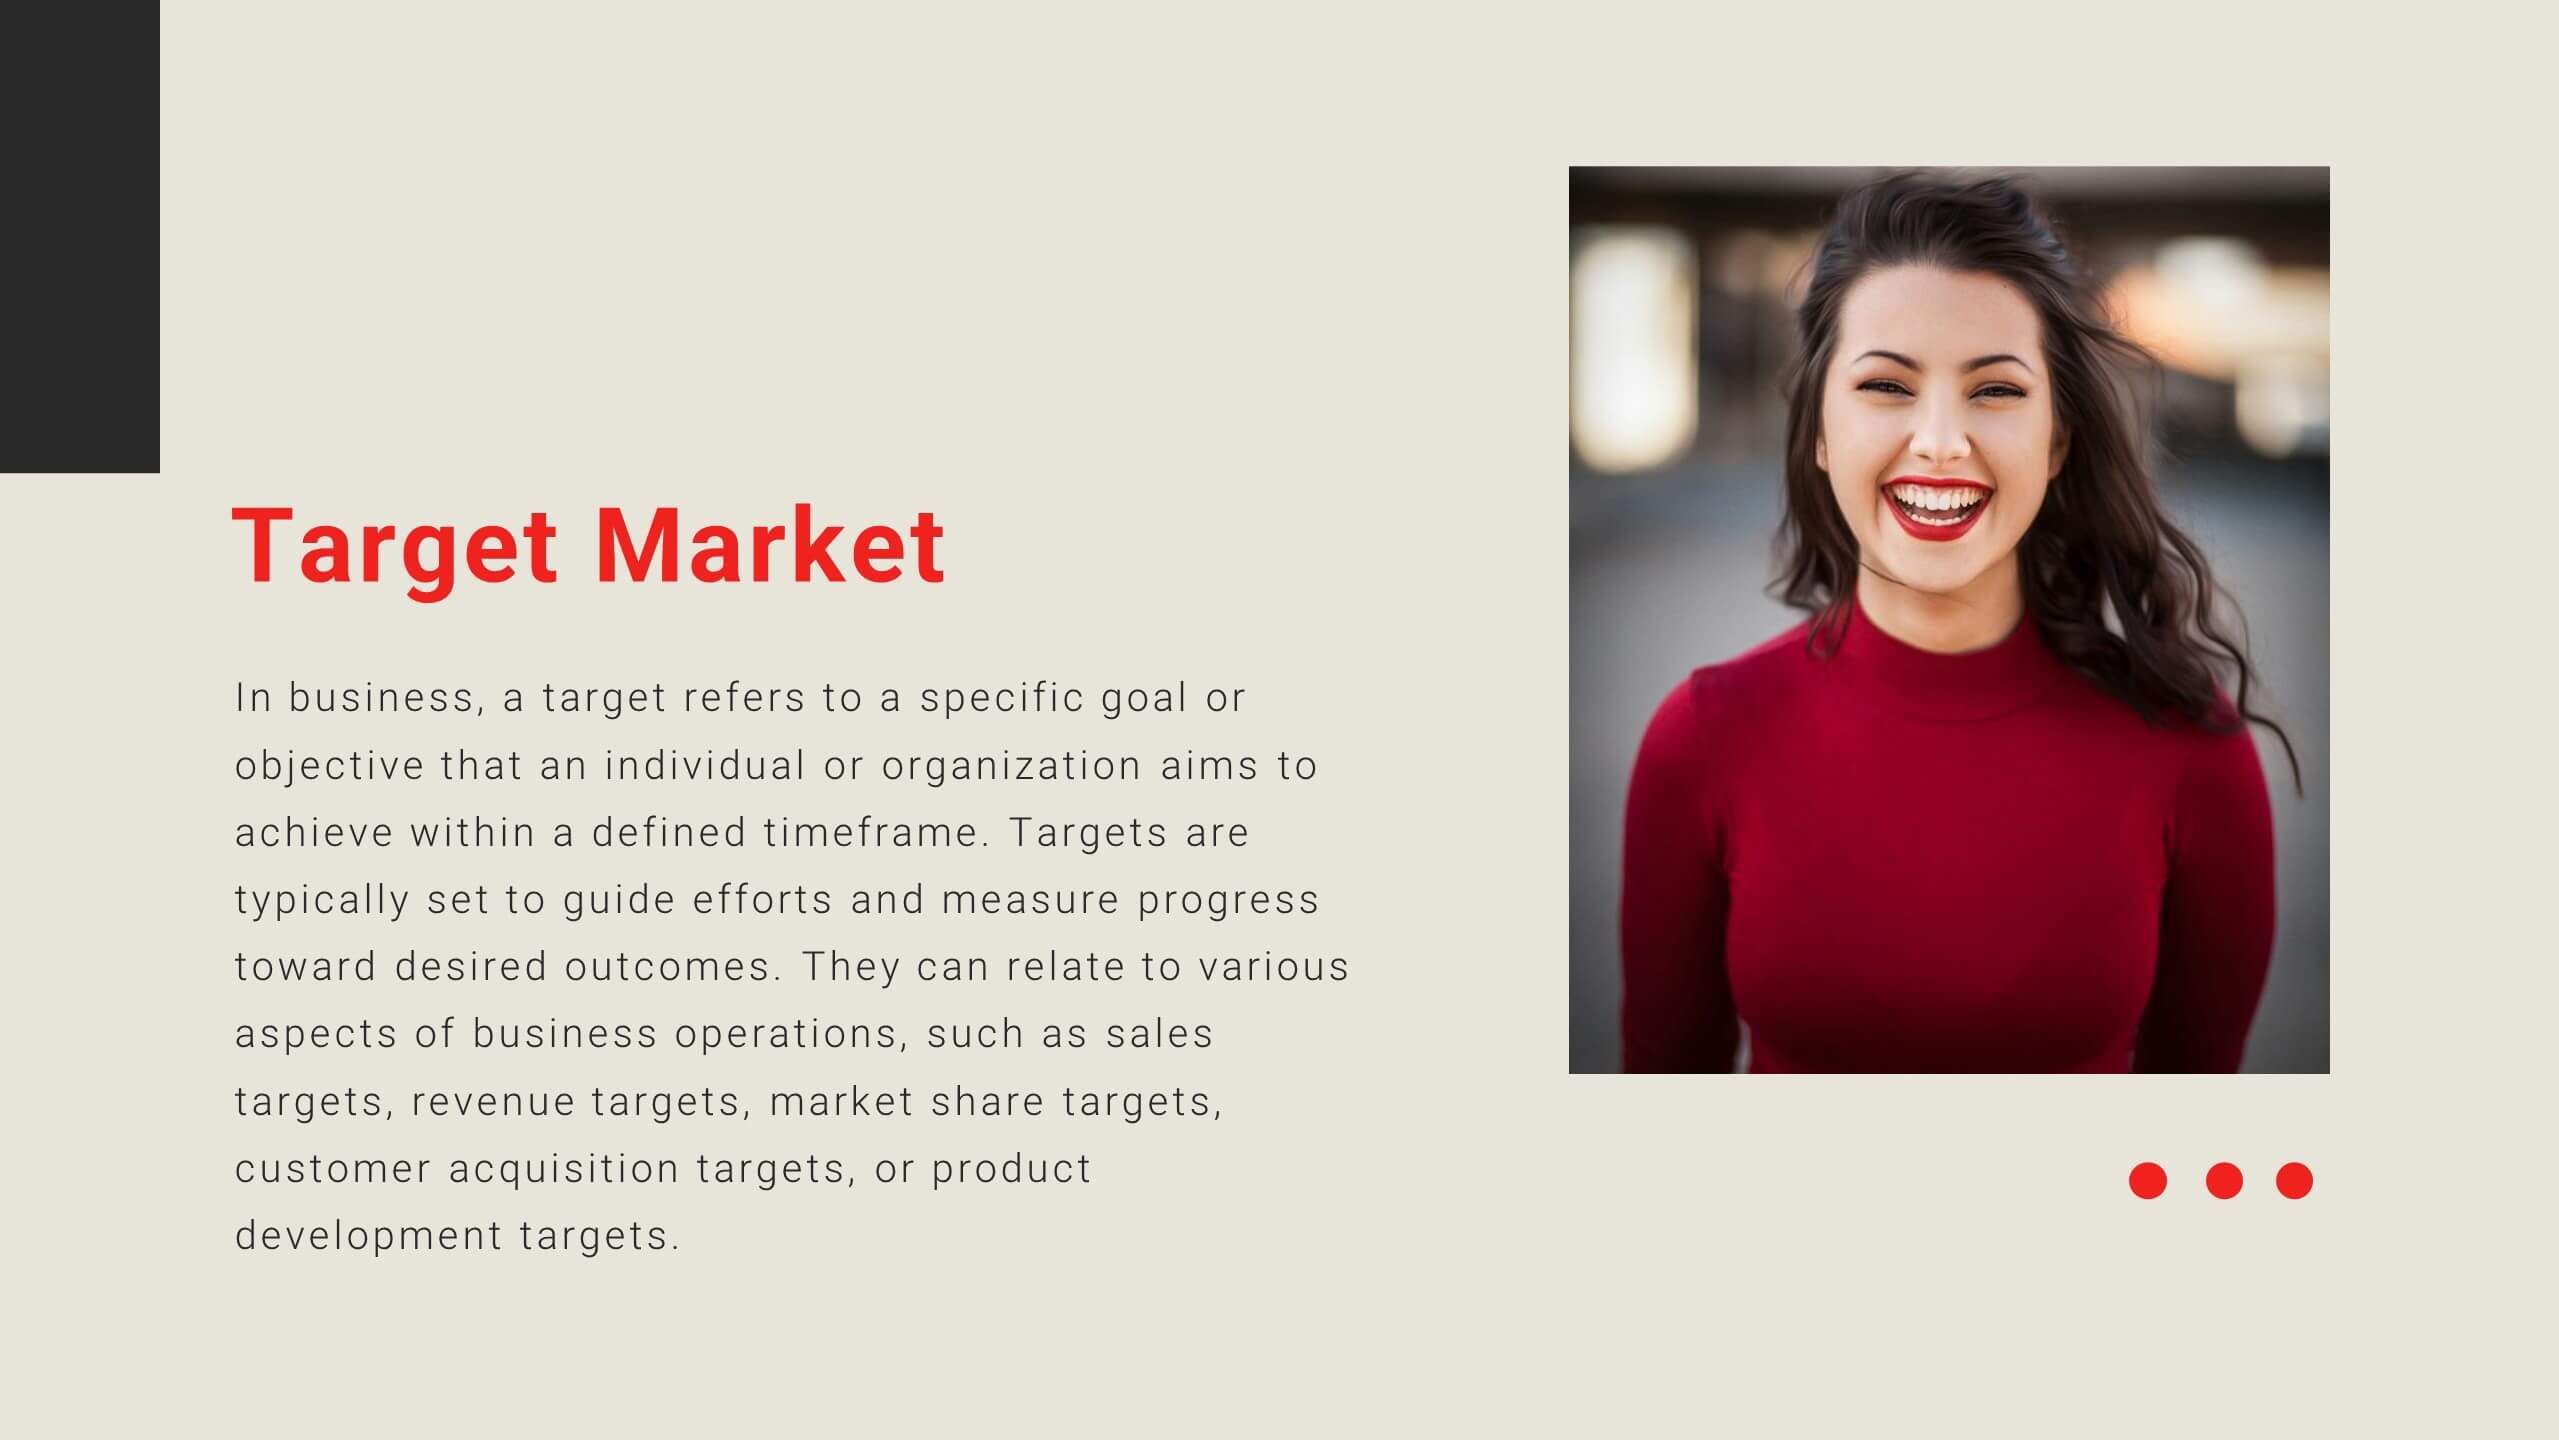
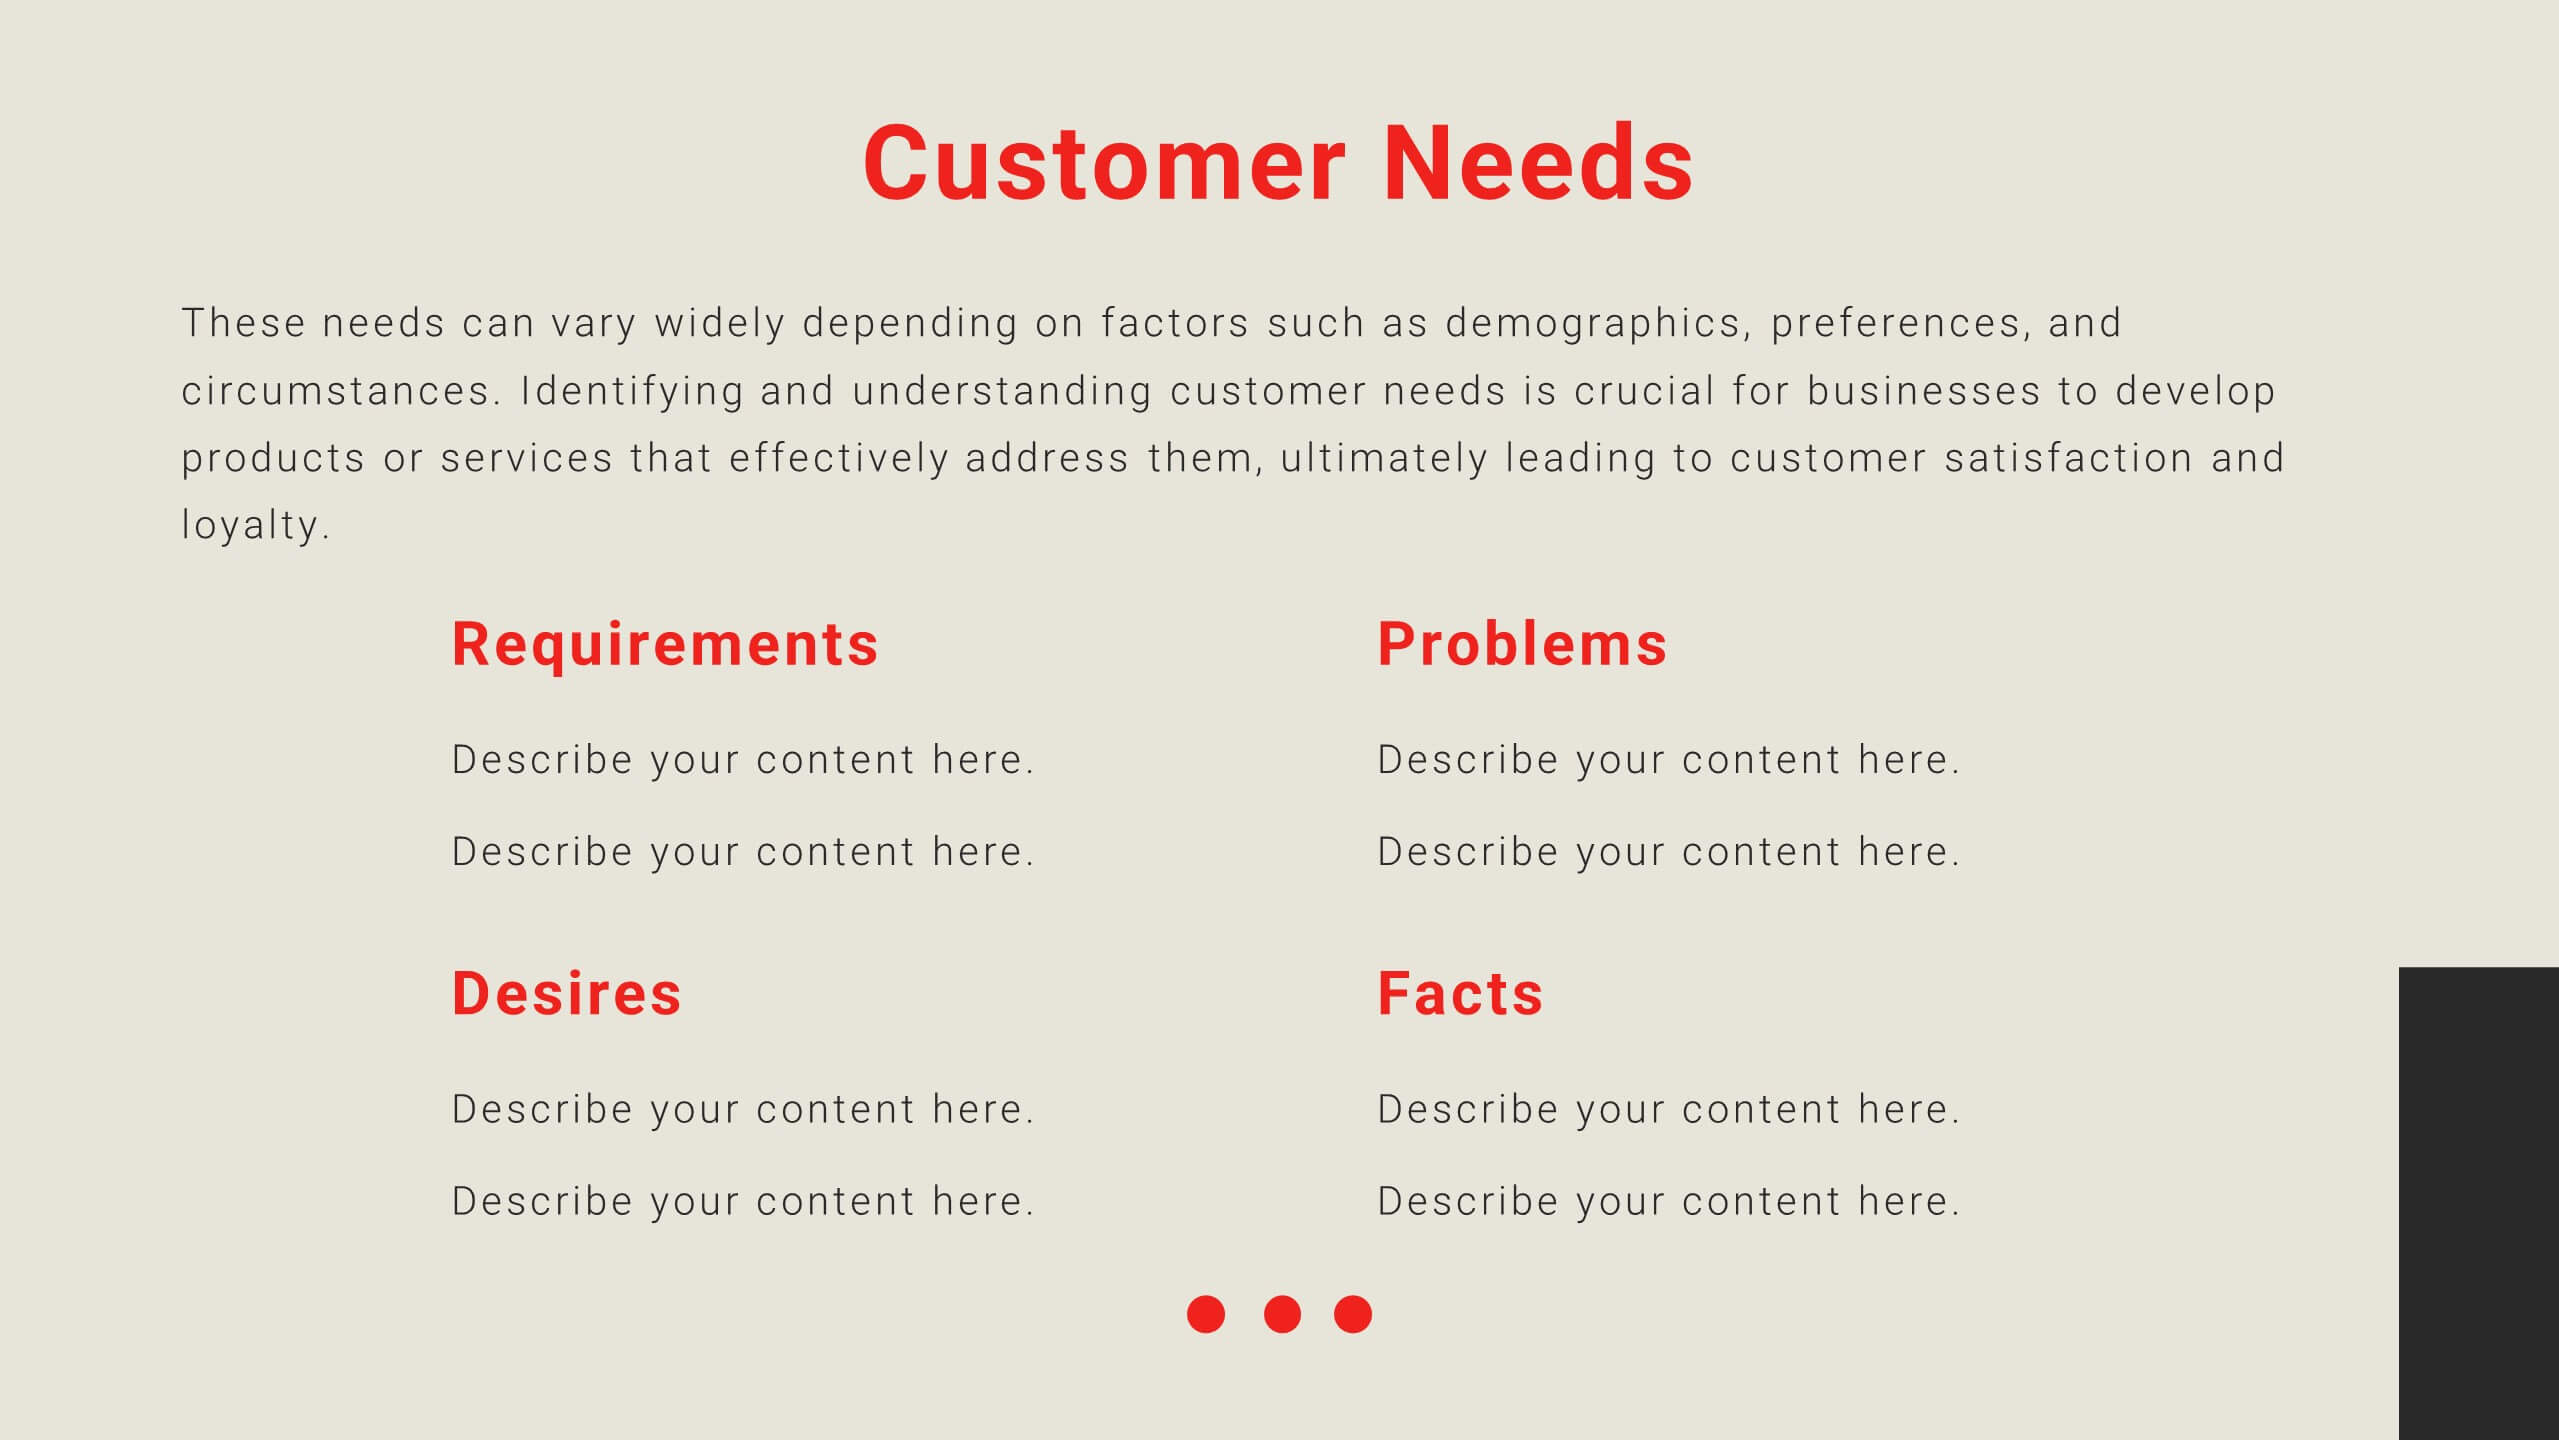
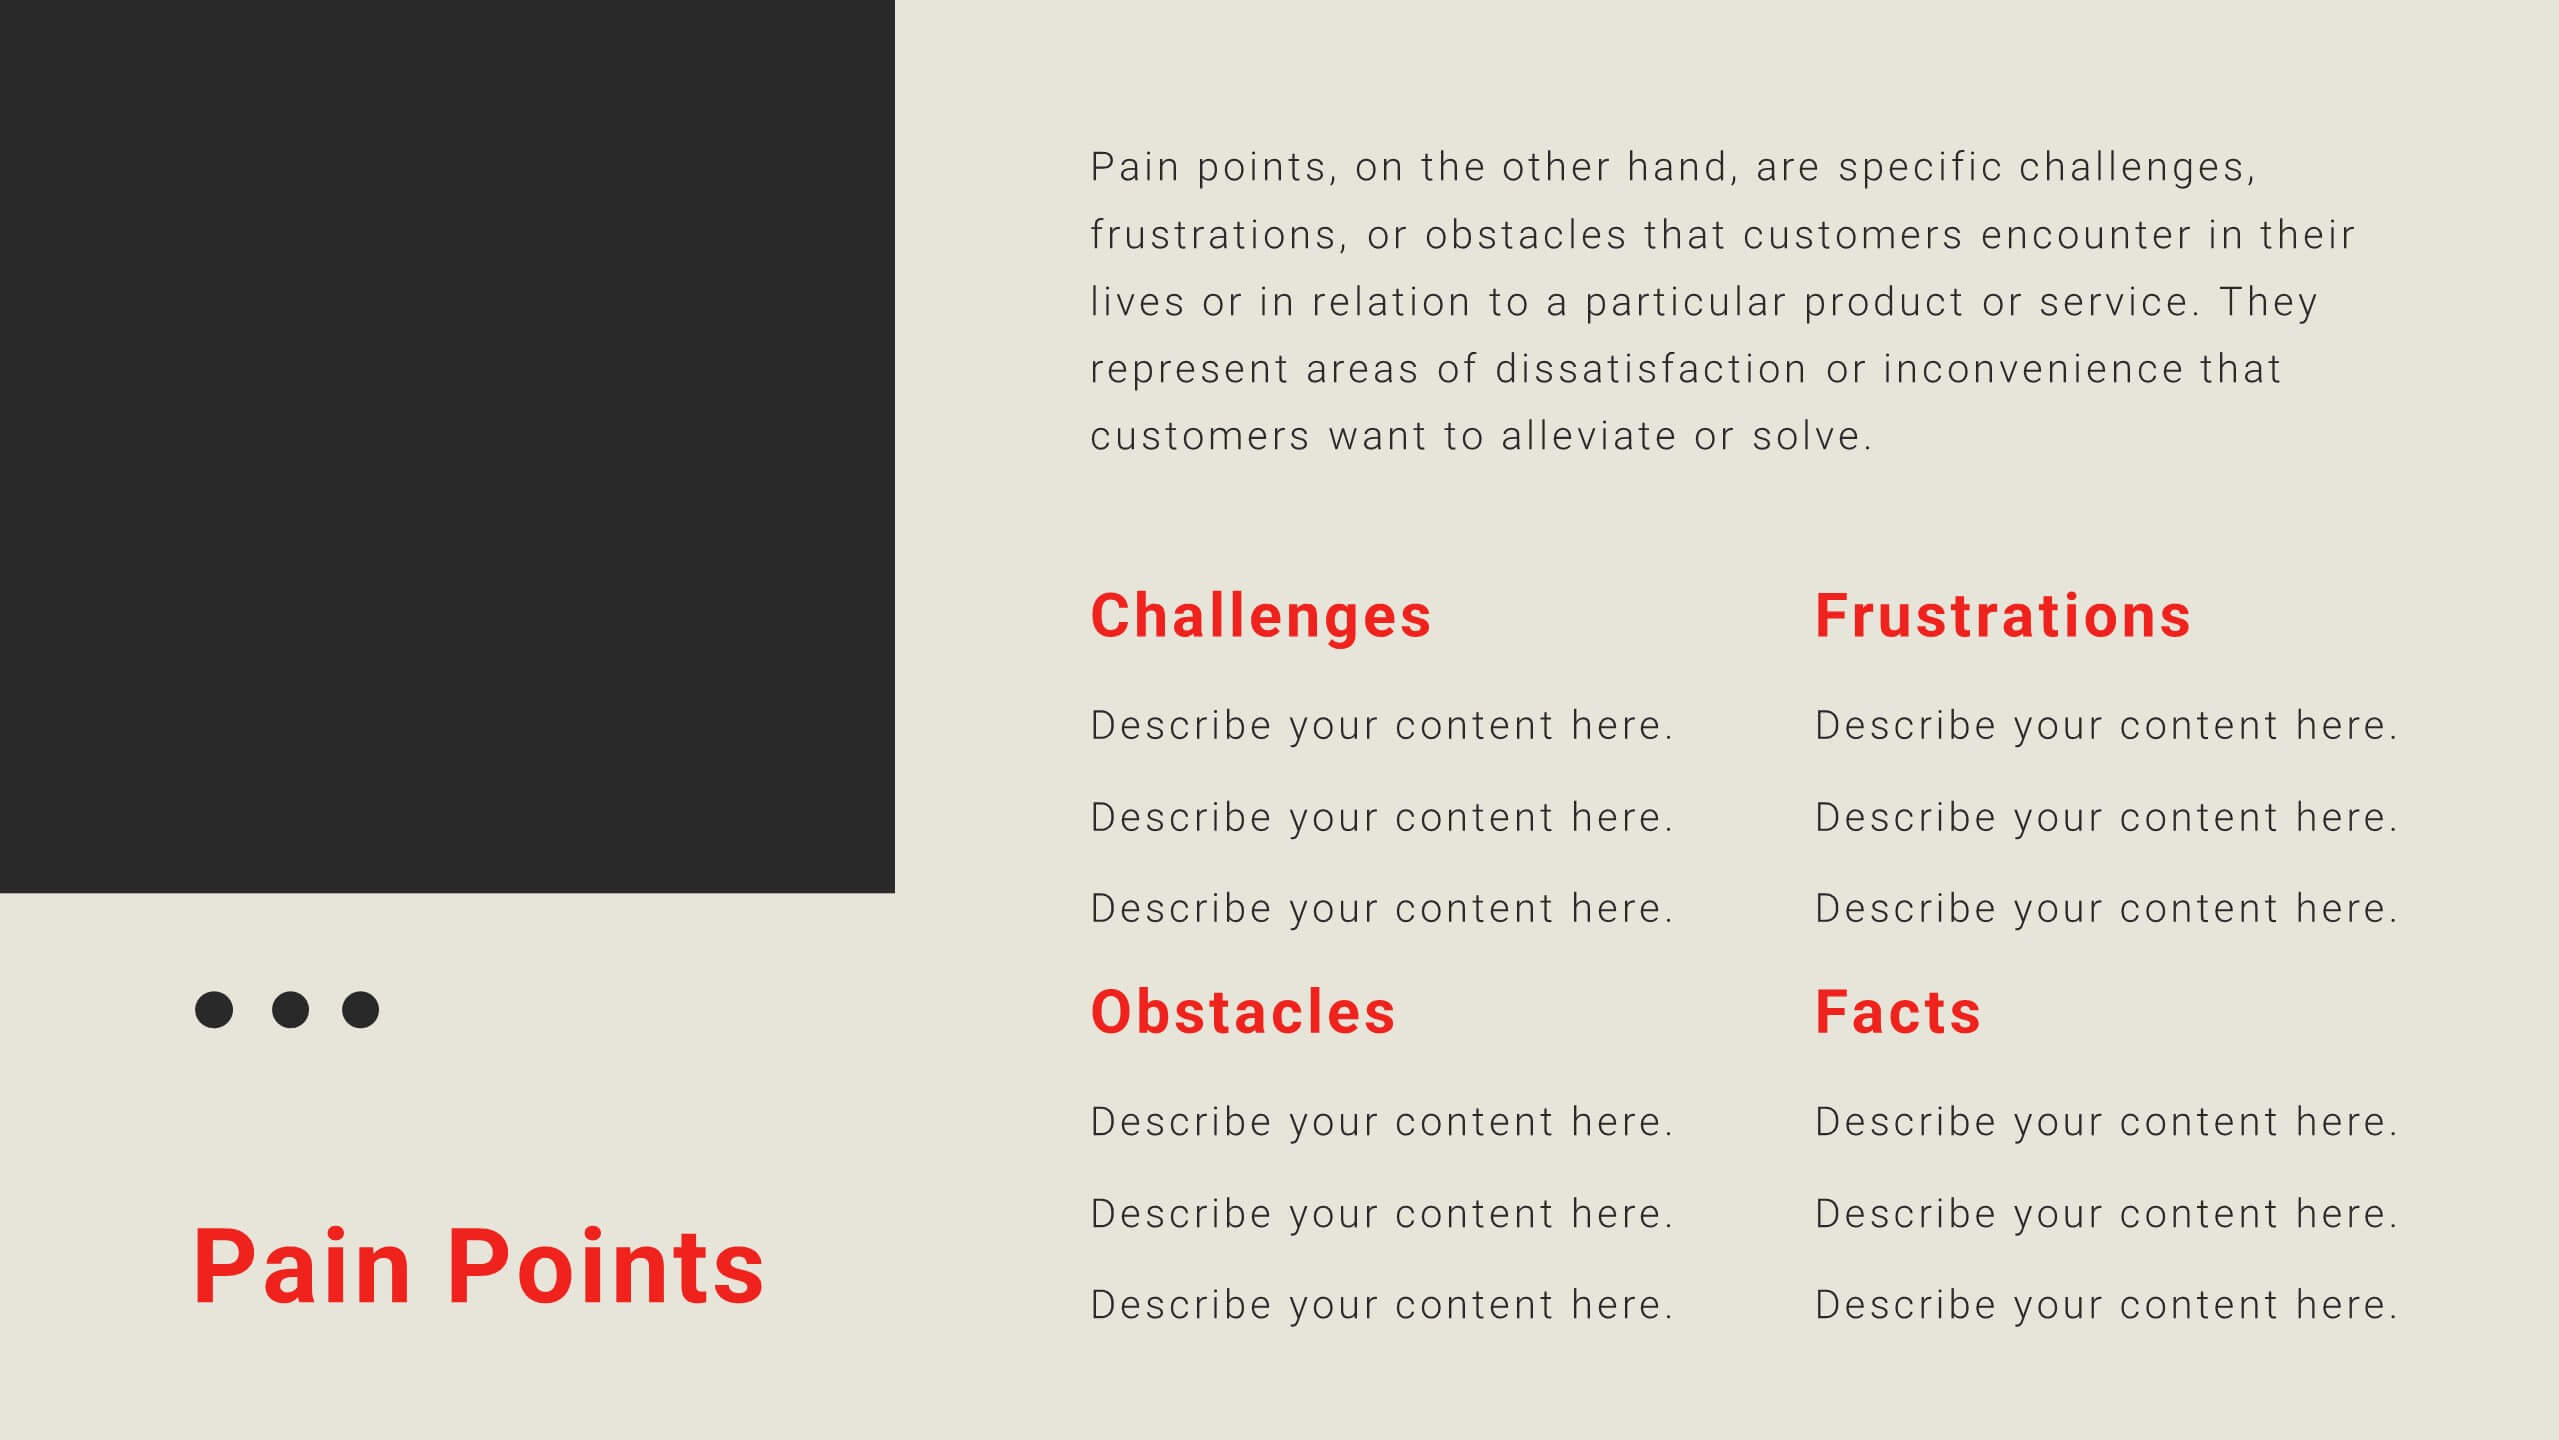
Casey Presentation Template
Casey is a professionally designed modern, clean, and bold PowerPoint template that’s a great way to show off your data or highlight your services. This product is perfect for corporate customers who need an easy-to-edit template with bold colors and clean designs. With its easy to read charts, visible text, and bright colors this template will really captivate your audience. A perfect way to visualize your data and present your company in style to keep your audience engaged. Whether you are trying to get attention or just make your business stand out, this template will help you achieve that.


6 diapositivas
Personal Skills Gap Infographics
Bridge the Personal Skills Gap effectively with our customizable infographic template. This template is fully compatible with popular presentation software such as PowerPoint, Keynote, and Google Slides, enabling you to easily tailor it to address specific skills gaps and development strategies. The Personal Skills Gap infographic template provides a visually appealing platform for identifying and closing gaps in your skillset, whether personal or professional. Whether you're a career-minded individual, a manager, or an educator, this template offers a user-friendly canvas to create informative presentations and self-improvement plans. Boost your personal and professional growth with this SEO-optimized Personal Skills Gap infographic template, thoughtfully designed for clarity and ease of use. Customize it to pinpoint skills in demand, set goals, and outline actionable steps to bridge the gap, ensuring your continuous development and success. Start crafting your personalized infographic today to thrive in a rapidly evolving world.


3 diapositivas
Business Project Proposal Pitch Presentation
Win Your Next Big Deal! The Business Project Proposal Pitch Presentation is designed to impress, featuring sleek data visuals, key insights, and a structured layout for persuasive storytelling. Ideal for startups, corporate pitches, and investment proposals, this template is fully customizable and works with PowerPoint, Keynote, and Google Slides for seamless editing.


4 diapositivas
Sales Performance Dashboard Report Presentation
Track progress and showcase trends with the Sales Performance Dashboard Report Presentation. This template features a clean monthly line chart to visualize product growth, alongside three metric boxes for highlighting KPIs or category performance. Ideal for quarterly recaps, revenue reporting, or product analysis. Fully editable in Canva, PowerPoint, and Google Slides.


5 diapositivas
Sales Pipeline and Forecast Overview Presentation
Keep your sales strategy clear and forward-focused with the Sales Pipeline and Forecast Overview Presentation. This sleek, icon-based slide walks viewers through five key stages—each represented by a bold, color-coded ring and customizable title. Perfect for showcasing sales funnels, forecasting performance, or illustrating workflow phases. Fully editable in Canva, PowerPoint, and Google Slides.
5 diapositivas
Tracking Milestones and SMART Goals Presentation
Visualize your SMART goals with clarity using this arrow-based infographic template. Each step—Specific, Measurable, Achievable, Relevant, and Time-bound—is clearly segmented to track progress and prioritize objectives. Fully editable in Canva, PowerPoint, and Google Slides, it’s perfect for planners, project managers, and strategists seeking to streamline goal achievement.


5 diapositivas
Risk and Return Investment Presentation
Navigate the high seas of finance with our captivating infographic presentation template, designed to visually break down the complex relationship between risk and return in investments. This template simplifies presenting key data points, making it ideal for financiers and investors looking to make informed decisions. Each slide is meticulously crafted to ensure clarity and impact, highlighting the balance of potential rewards against possible risks. Perfect for use in PowerPoint, Keynote, and Google Slides, this template is a must-have tool for anyone in the financial sector aiming to convey their strategy with precision and flair.


24 diapositivas
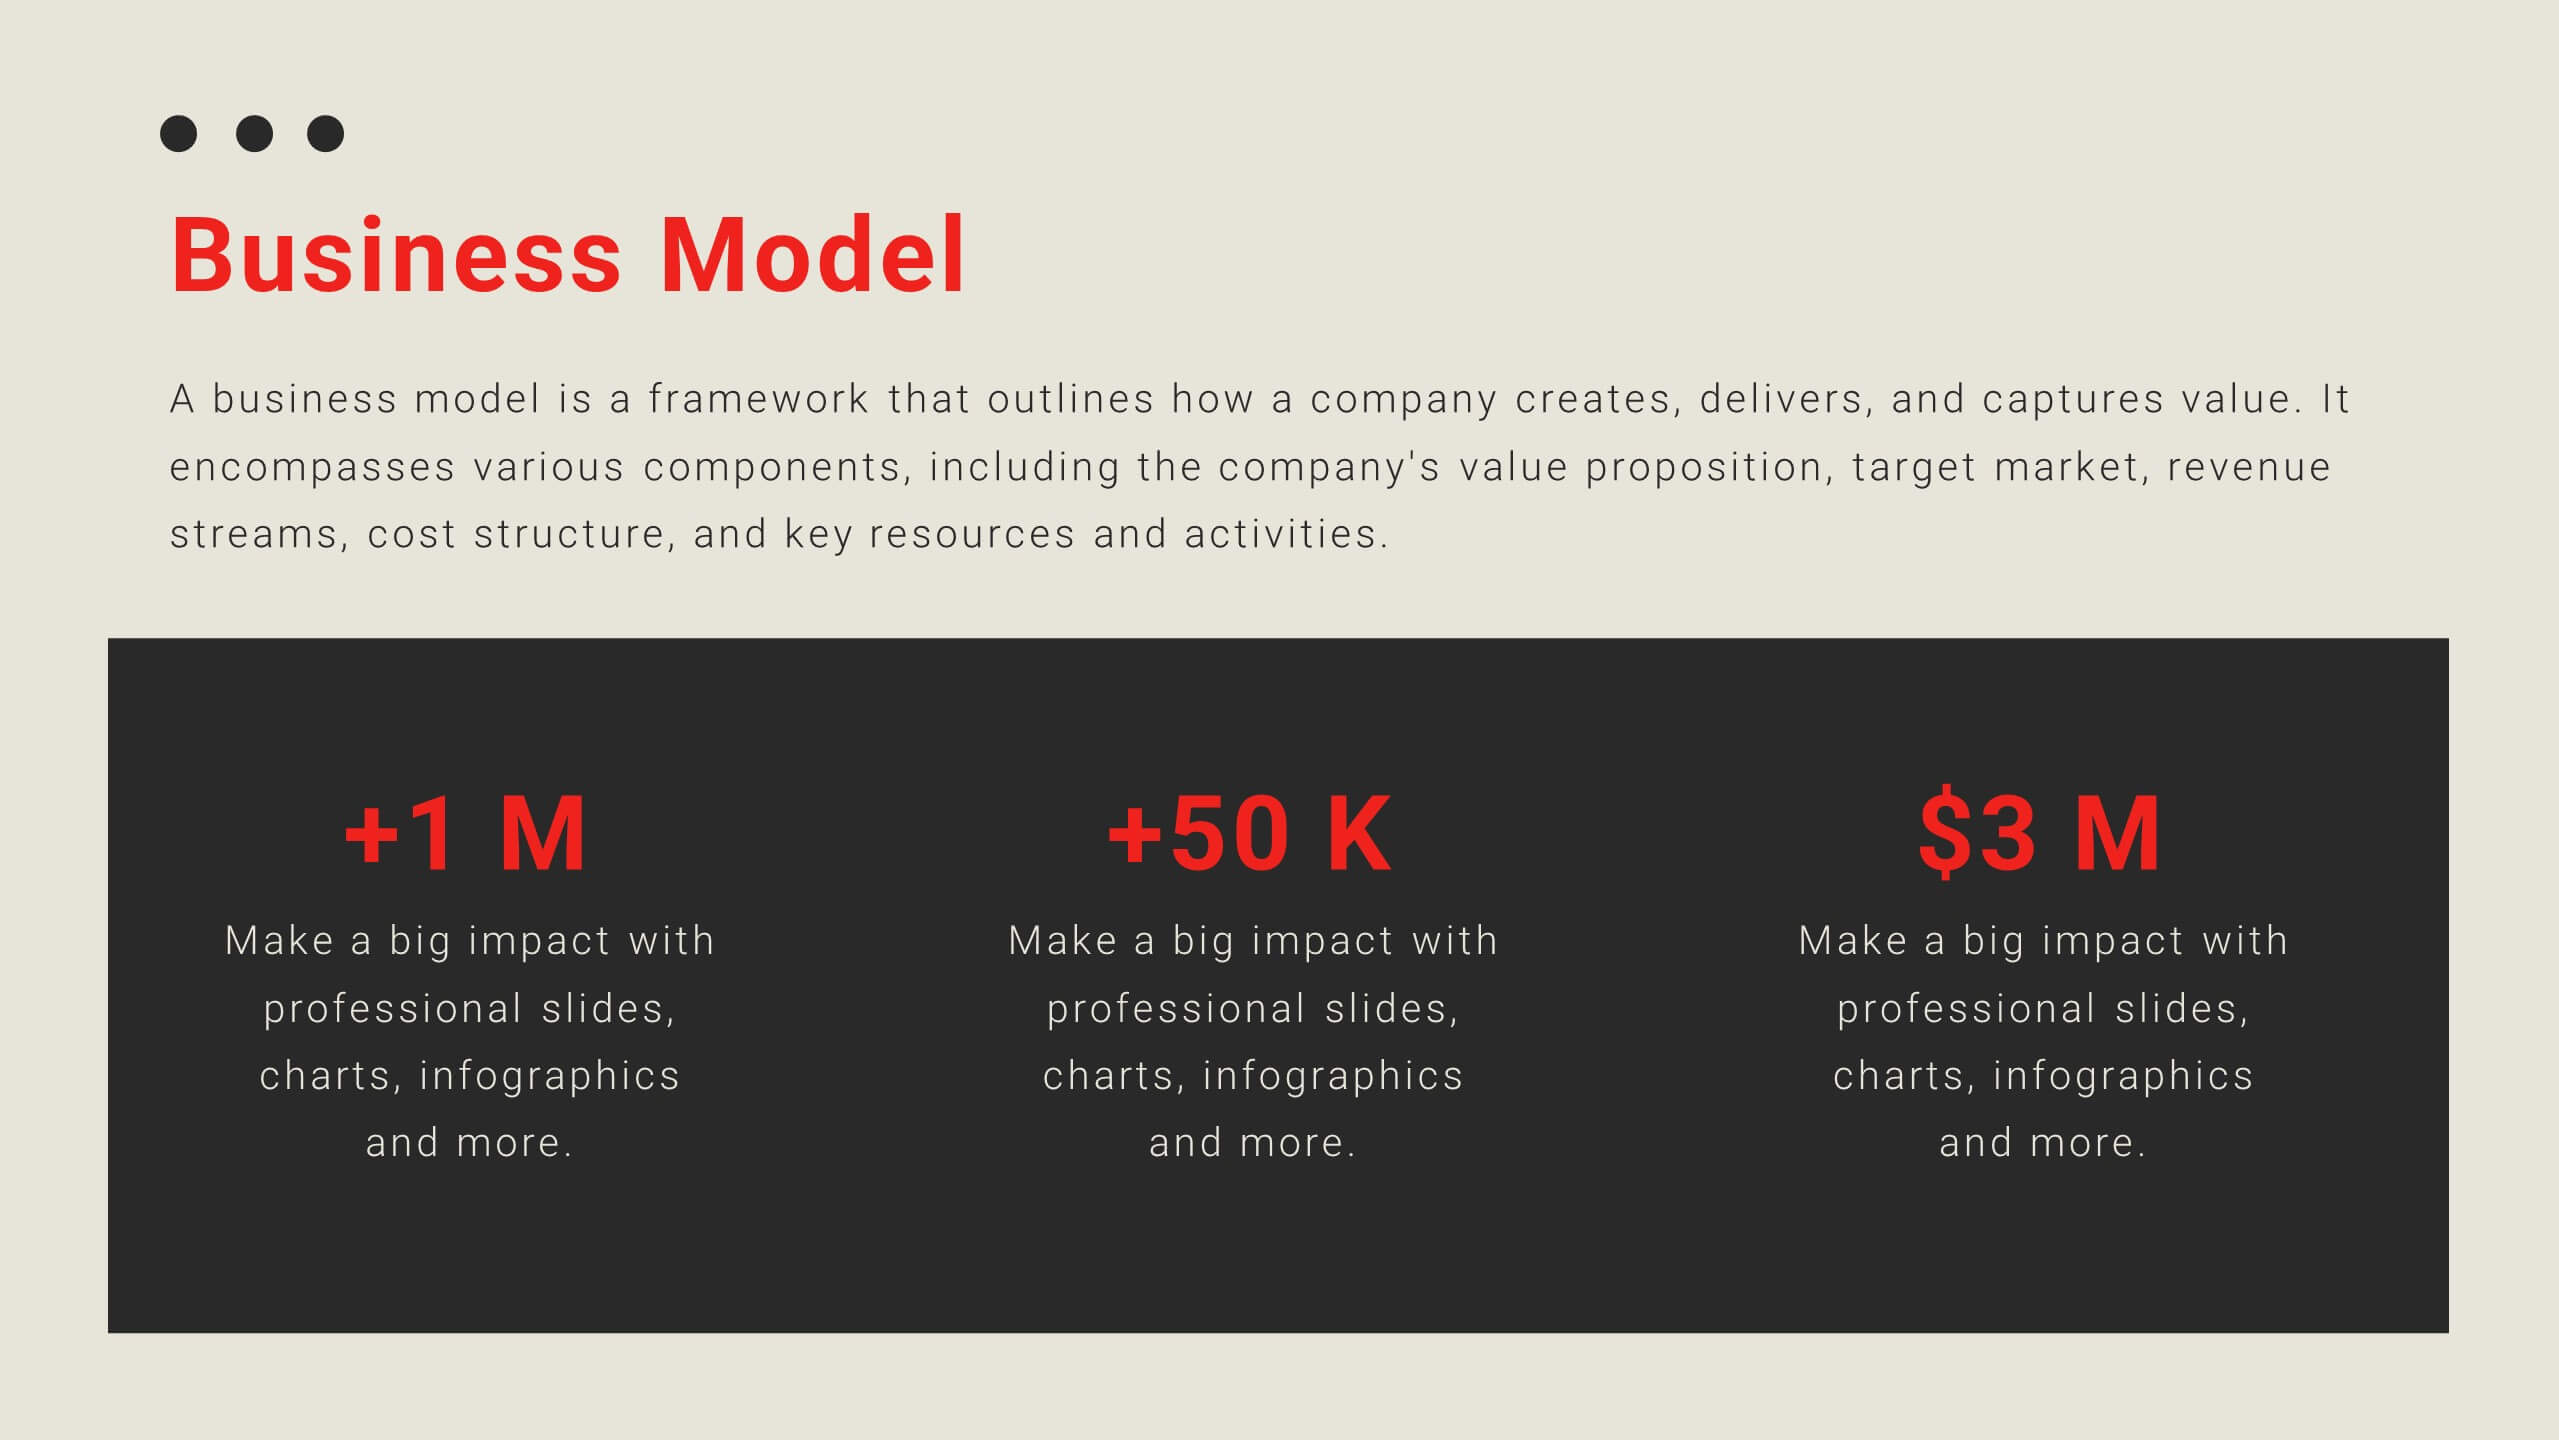
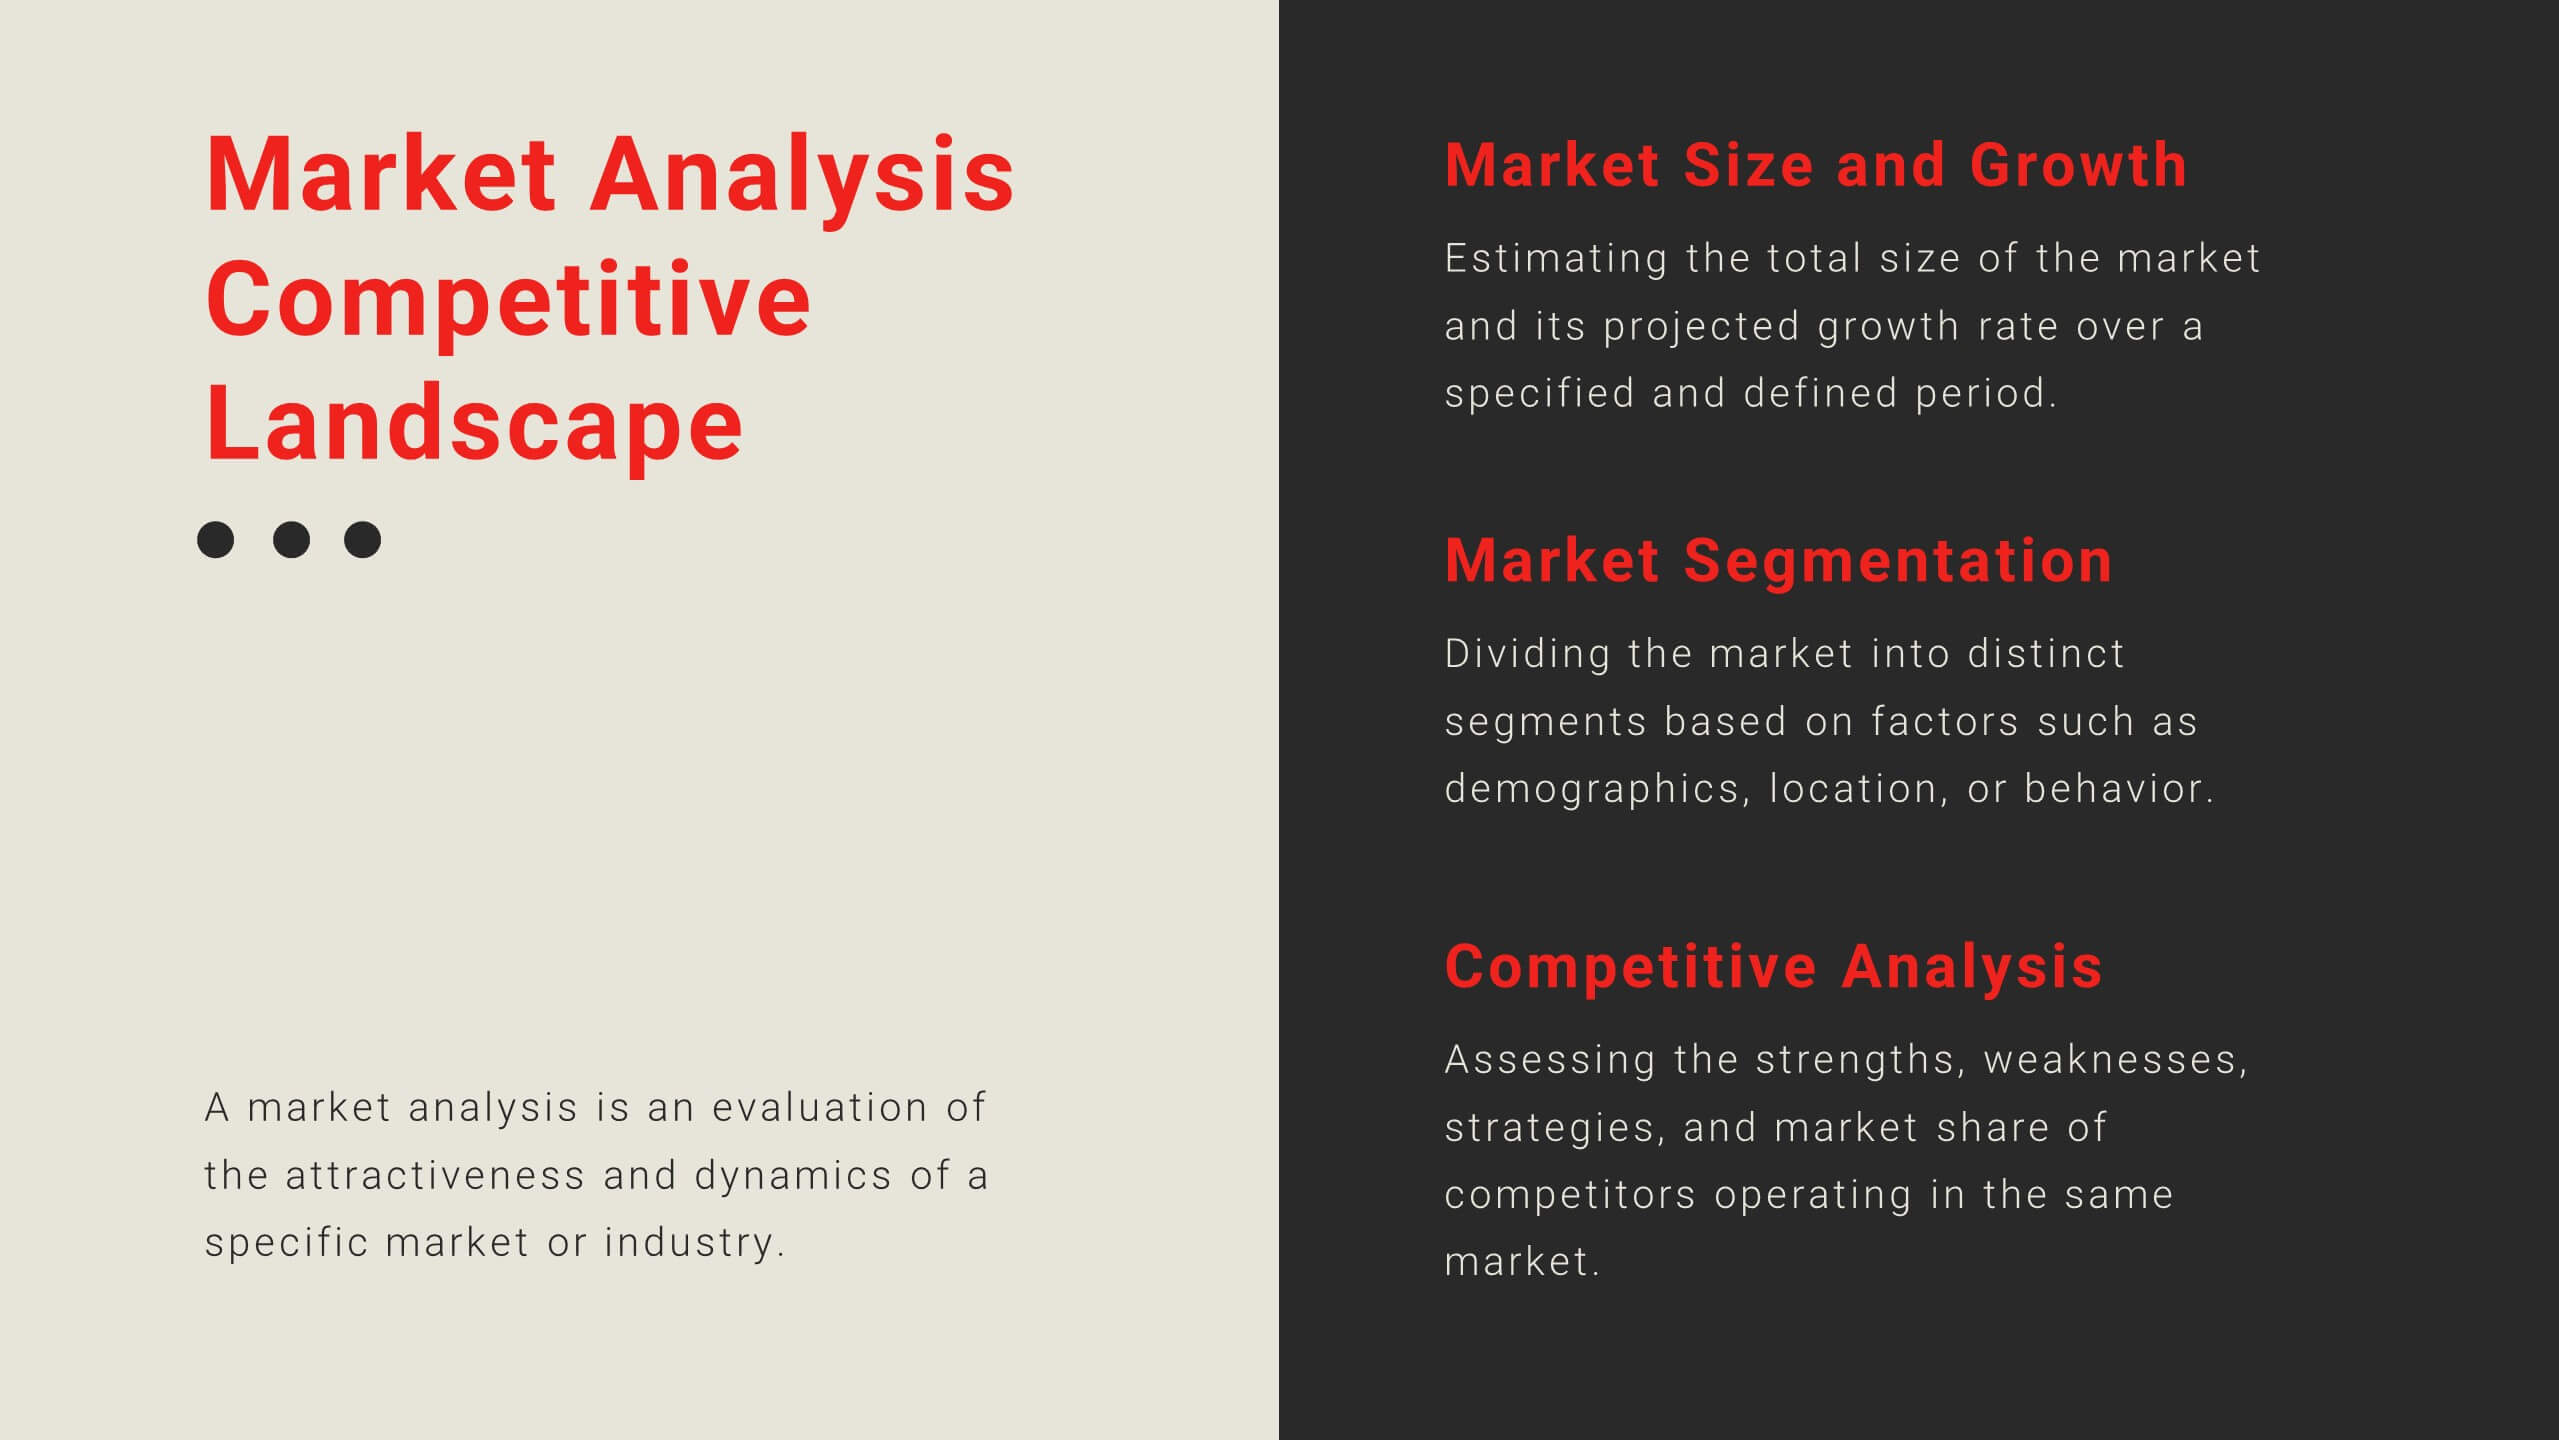
Momentum Investor Pitch Presentation
The Momentum Pitch Deck is your ultimate tool for propelling your business ideas into action! This vibrant and dynamic template is crafted to captivate your audience and clearly convey your company's vision, strategy, and growth potential. Start with an engaging overview, followed by a problem statement that pinpoints the core challenges your solution addresses. Use the market opportunity and competitive landscape slides to showcase the potential for success. The business model canvas and unique selling proposition sections help illustrate how your business stands out from the competition. Highlight your revenue model, marketing strategy, and sales approach to show your path to profitability. Additionally, the template includes sections for technology and innovation, team introduction, and risk analysis, ensuring a comprehensive presentation. Whether you're pitching to investors or stakeholders, this template is fully compatible with PowerPoint, Keynote, and Google Slides, making it the perfect choice for any pitch deck.


20 diapositivas
Alchemy Sales Forecast Presentation
Elevate your sales strategy with this sleek and modern sales forecast presentation template. Featuring sections for sales objectives, pricing strategies, performance metrics, and future opportunities, it’s perfect for teams aiming to analyze and plan effectively. Fully compatible with PowerPoint, Keynote, and Google Slides for seamless professional presentations.


8 diapositivas
Attention-Interest-Desire-Action Presentation
Enhance your marketing presentations with this Attention-Interest-Desire-Action (AIDA) Model Presentation template. Designed with a modern, structured pyramid layout, this template clearly illustrates the four key stages of consumer decision-making. Ideal for marketers, sales teams, and business strategists, it’s fully customizable and compatible with PowerPoint, Keynote, and Google Slides.


7 diapositivas
McKinsey 7S Framework Presentation
Dive into organizational alignment with our McKinsey 7S Framework infographic presentation template, perfect for consultants and business managers. This visually appealing template organizes your discussion around Structure, Strategy, Systems, Skills, Staff, Style, and Shared Values, ensuring a comprehensive overview. Crafted for clarity and effectiveness, it's ready to use in PowerPoint, Keynote, and Google Slides, helping you present complex interdependencies with ease and style.


6 diapositivas
Public Healthcare System Strategy Presentation
Present key components of your medical or government plan with the Public Healthcare System Strategy Presentation. This clean and modern slide design uses a heart-centered layout with five surrounding icons to highlight core pillars—perfect for policy updates, strategy overviews, or health service workflows. Fully editable in Canva, PowerPoint, Keynote, and Google Slides.


21 diapositivas
Velocity Startup Growth Plan Presentation
Accelerate your startup's growth with this dynamic plan template! Perfect for outlining your mission, vision, business model, and marketing strategy. Ideal for entrepreneurs aiming to secure funding and drive success. Compatible with PowerPoint, Keynote, and Google Slides, this template ensures your growth plan is clear, professional, and compelling. Achieve your startup goals today!


4 diapositivas
Healthcare Procedure and Diagnosis Presentation
Simplify medical communication with the Healthcare Procedure and Diagnosis Presentation. Featuring clean visuals like syringes, hearts, and med kits, this layout is ideal for outlining treatment stages, clinical processes, or patient care steps. Perfect for hospitals, clinics, or healthcare startups. Fully editable in PowerPoint, Keynote, Google Slides, and Canva.


6 diapositivas
Geometric Patterns Infographics
Step into the fascinating realm of geometric patterns! This infographic invites you to explore the captivating world of shapes and symmetries. From the mesmerizing allure of intricate designs to the mathematical precision behind each pattern, we'll reveal the secrets that make geometric patterns a timeless art form. Delve into the core principles of geometric patterns. Gain insights into the geometry behind these intricate designs, from basic shapes like circles and squares to more complex constructions. Uncover the history and cultural significance of these patterns, from ancient civilizations to contemporary art and design. With this captivating infographic, compatible with PowerPoint, Keynote, and Google Slides, sharing your enthusiasm for geometric patterns has never been easier. Empower yourself with the knowledge to appreciate and create these mesmerizing designs. Dive into the world of geometric patterns and embark on a journey of artistic exploration and appreciation.


7 diapositivas
Stock Market Infographic Presentation Template
The stock market is a global system that operates through electronic communication and trading. It allows buyers and sellers to meet, interact, and transact. This template is perfect if you want to become informed or want to inform someone how the stock market operates. This template comes packed with all the information you need. The market allows for price discovery and serve as a barometer for the overall economy. The stock market is highly transparent, allowing sellers to seek the best price. The illustrations provided are made to help you and your viewer understand the bull and bear market.