


Características


¿Tienes alguna pregunta?
Recomendar


6 diapositivas
Building High-Performing Teams Presentation
Unlock your team's full potential with this dynamic Building High-Performing Teams template. Featuring a sleek 3-part circular layout, it's perfect for showcasing leadership roles, collaboration pillars, or performance drivers. Use it for HR meetings, training sessions, or team development plans. Fully editable in PowerPoint, Keynote, and Google Slides.


25 diapositivas
Draco Photography Portfolio Template Presentation
Showcase your photography portfolio with this dynamic template! Highlight your projects, style, client testimonials, and awards. Includes sections for pricing, services offered, and social media links. Ideal for photographers to create impactful presentations. Compatible with PowerPoint, Keynote, and Google Slides.


18 diapositivas
Riftbound Creative Design Report Presentation
Unleash your creative vision with this beautifully structured design presentation! It covers essential aspects like concept development, typography, moodboards, wireframes, and final design, ensuring a comprehensive journey from idea to execution. Perfect for creative teams or client presentations, this template is fully compatible with PowerPoint, Keynote, and Google Slides.


7 diapositivas
Benefits vs Features Slide Presentation
Make your message stand out by clearly distinguishing what your product does from why it matters. This clean and structured layout helps you explain features and highlight their real-world benefits, keeping audiences engaged and informed. Fully customizable and compatible with PowerPoint, Keynote, and Google Slides for smooth presentation use.


7 diapositivas
E-Learning Modules Structure Presentation
Design engaging learning experiences with a presentation that feels structured, modern, and easy to follow. Ideal for educators, trainers, or course creators, it helps organize e-learning content into clear, modular sections that enhance comprehension. Fully customizable and compatible with PowerPoint, Keynote, and Google Slides for effortless presentation design.


6 diapositivas
12-Month Calendar Overview Presentation
Kick off your planning with a clean, colorful layout that makes every month easy to visualize at a glance. This presentation helps you map timelines, milestones, and deadlines in a structured format ideal for yearly planning. Fully editable and compatible with PowerPoint, Keynote, and Google Slides.


5 diapositivas
Creative Problem Solving with Design Thinking Presentation
Bring your innovation process to life with the Creative Problem Solving with Design Thinking Presentation. This visual layout uses gear and bulb icons to highlight four essential stages in the design thinking approach. Perfect for brainstorming sessions, innovation pitches, and product development workshops. Easily editable in Canva, PowerPoint, Google Slides, and Keynote.


5 diapositivas
Minimal Watercolor Aesthetic Presentation
Bring a soft artistic touch to your ideas with this clean, watercolor-inspired layout designed for simple, modern storytelling. The slide helps you highlight key points with gentle color accents that feel elegant yet professional, making complex insights easier to follow. Fully compatible with PowerPoint, Keynote, and Google Slides.


3 diapositivas
Medical Report Summary and Review Deck Presentation
Present health data clearly with this Medical Report Summary and Review Deck. Designed for healthcare professionals, this layout features checklist icons, charts, and clinical visuals to highlight reports or patient insights. Fully editable in PowerPoint, Keynote, and Google Slides, it ensures your medical updates remain professional, concise, and easy to follow.


5 diapositivas
Professional Company Overview Slide Presentation
Showcase your business story with confidence using this sleek and structured layout designed for clarity and professionalism. Ideal for introducing teams, services, and company milestones, it helps you communicate key insights effectively. Fully customizable and compatible with PowerPoint, Keynote, and Google Slides for effortless presentation creation and editing.


6 diapositivas
Professional Business Portfolio Presentation
Present your work with confidence using this sleek Professional Business Portfolio presentation. Designed to showcase your project highlights, performance data, and key insights, this layout features a clean two-column structure with space for visuals, icons, and statistics. Perfect for consultants, agencies, or entrepreneurs wanting to highlight business outcomes. Fully customizable and compatible with PowerPoint, Keynote, and Google Slides.


21 diapositivas
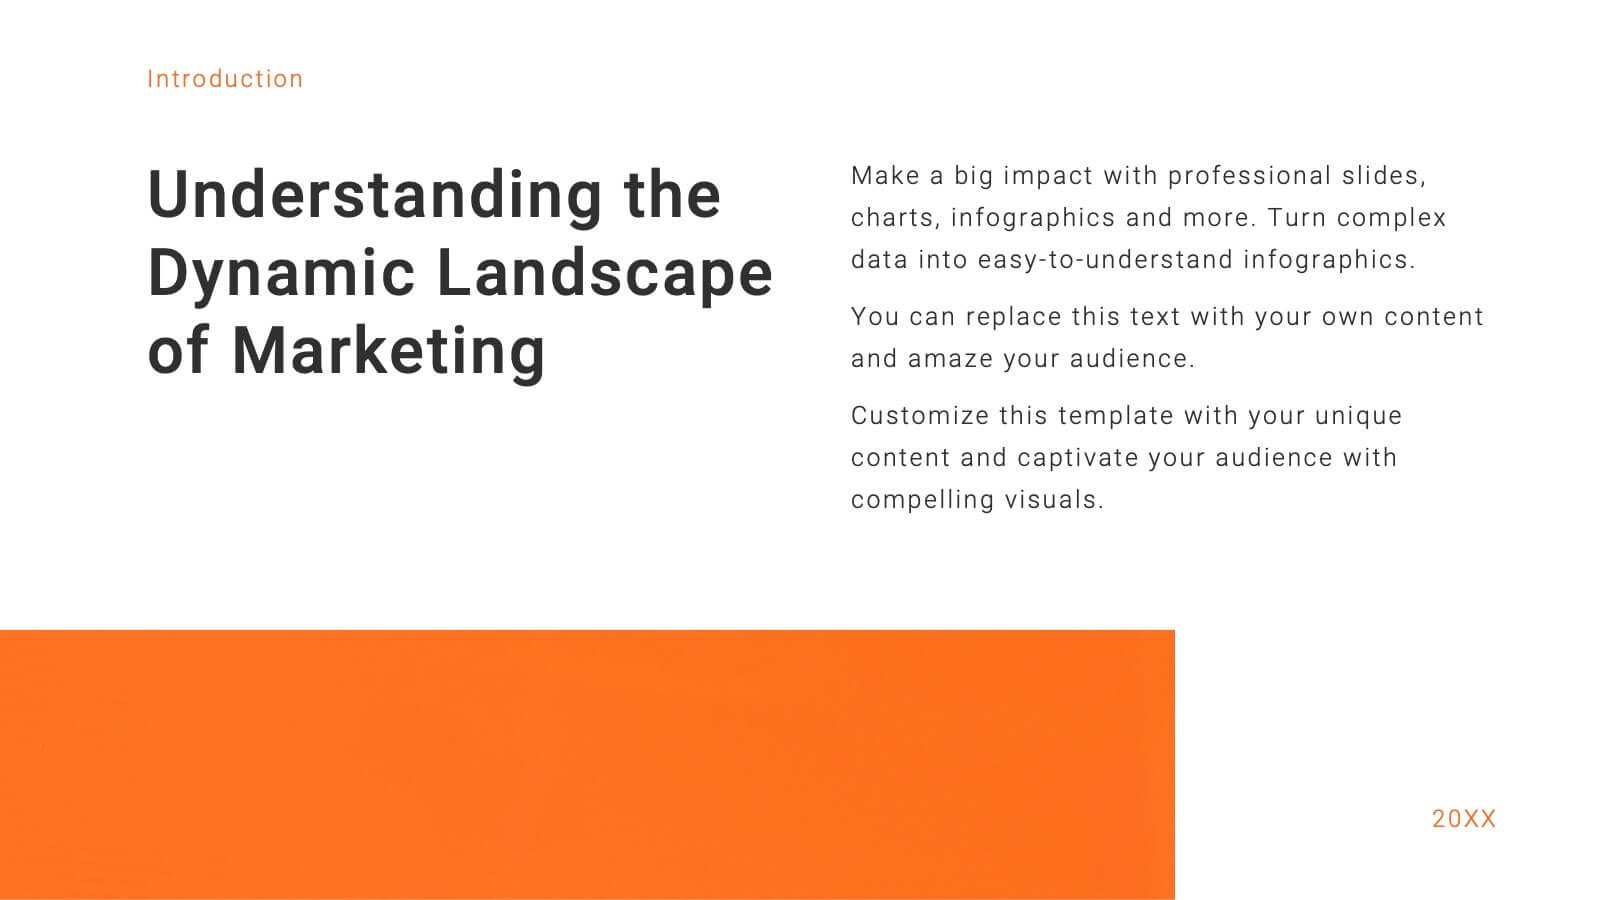
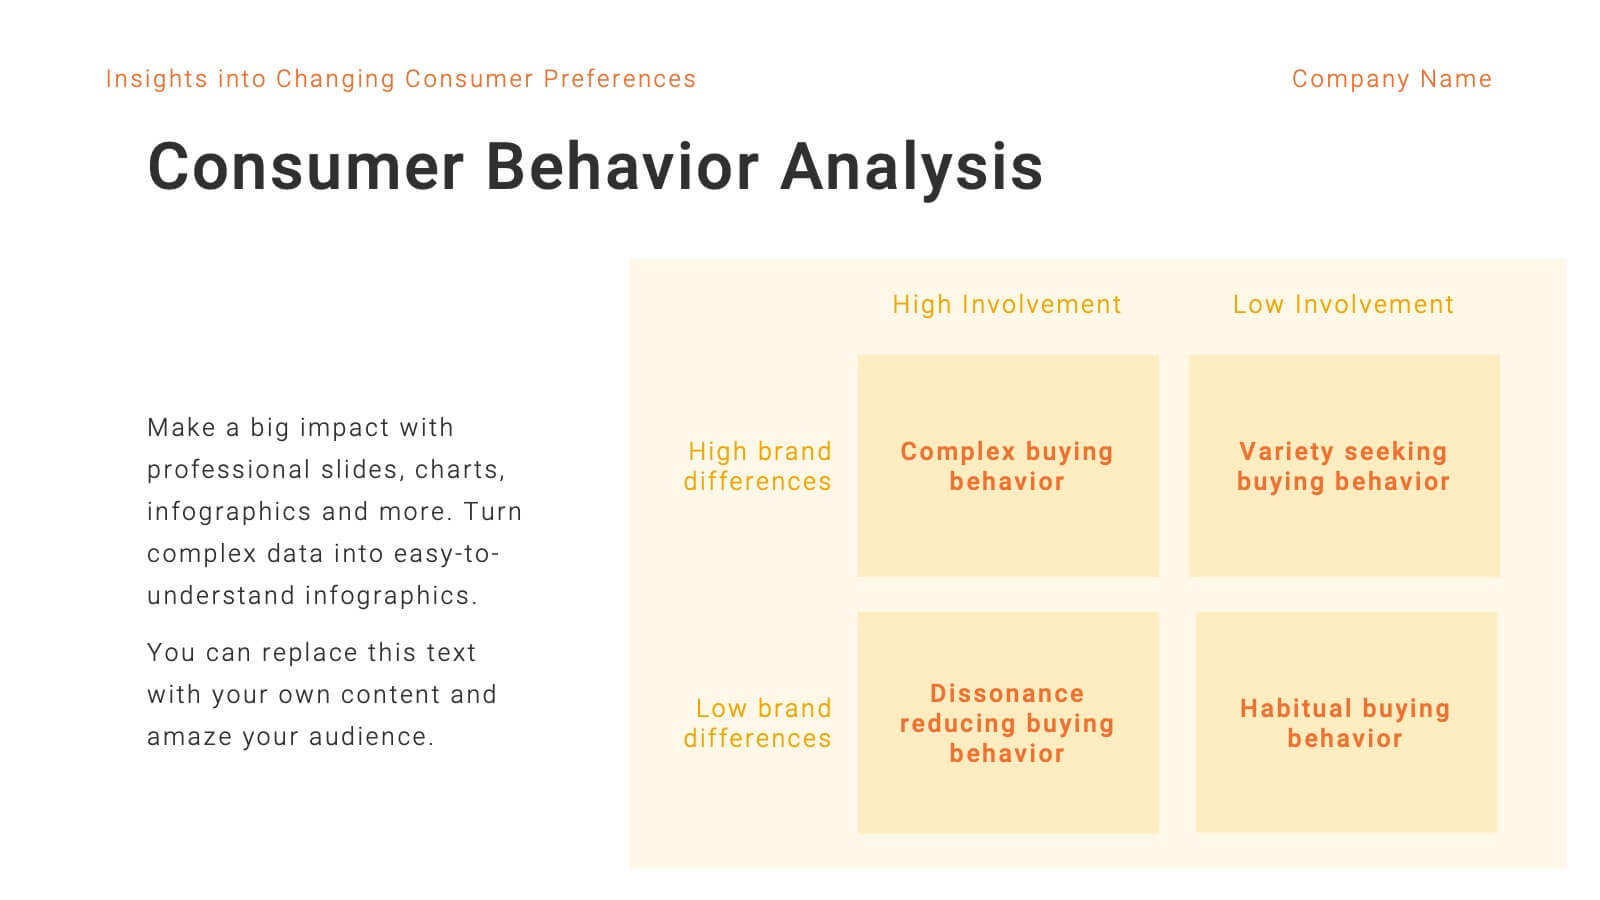
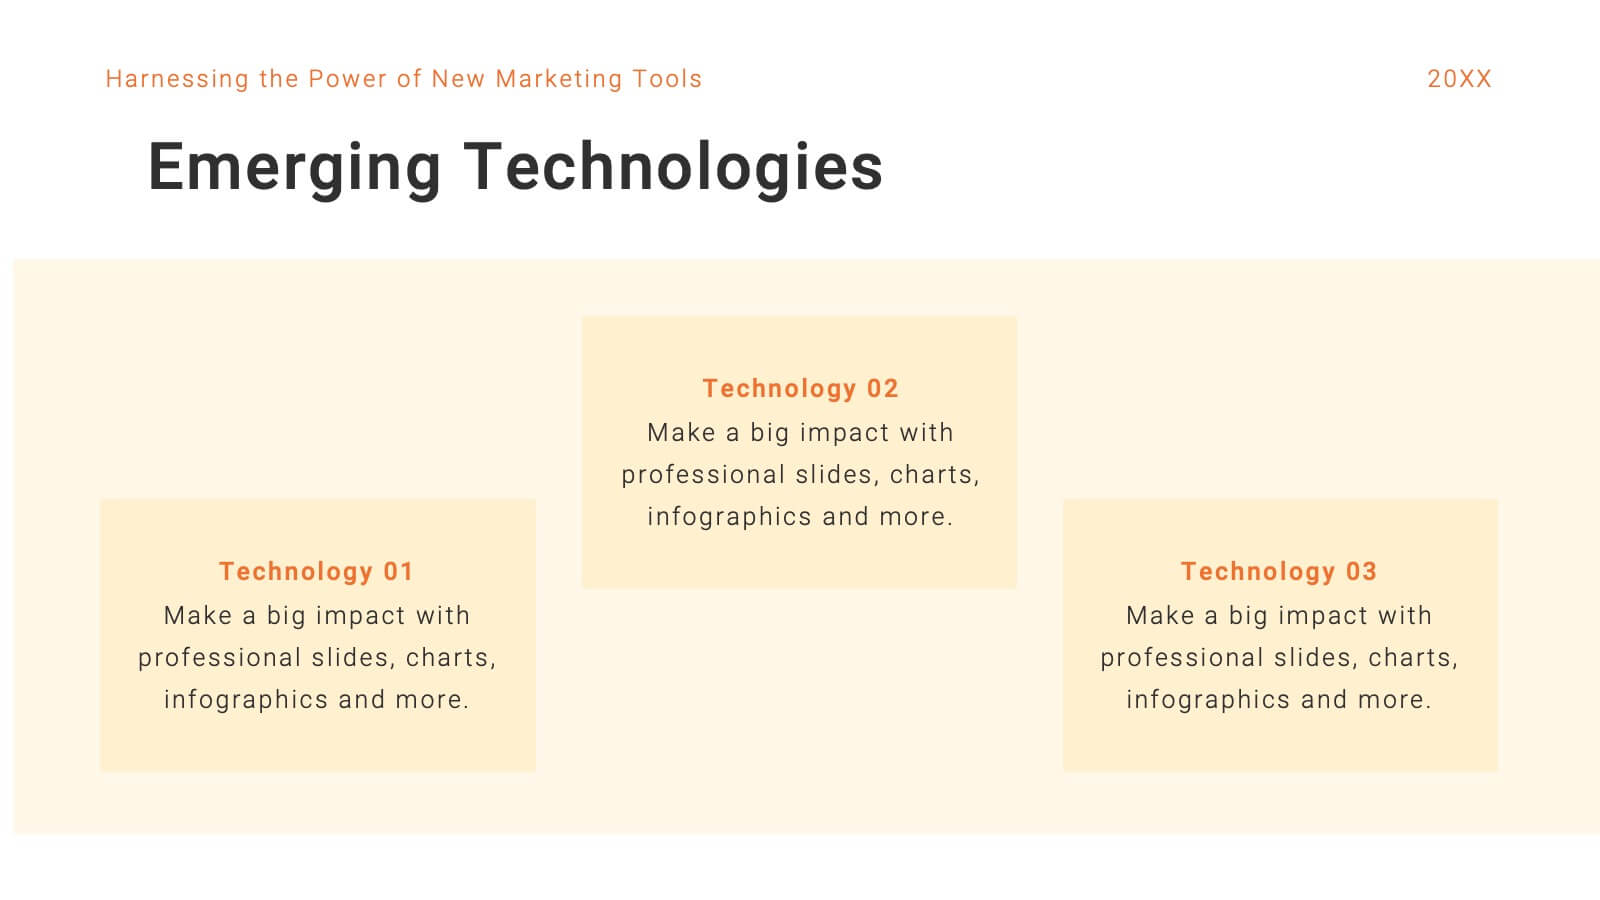
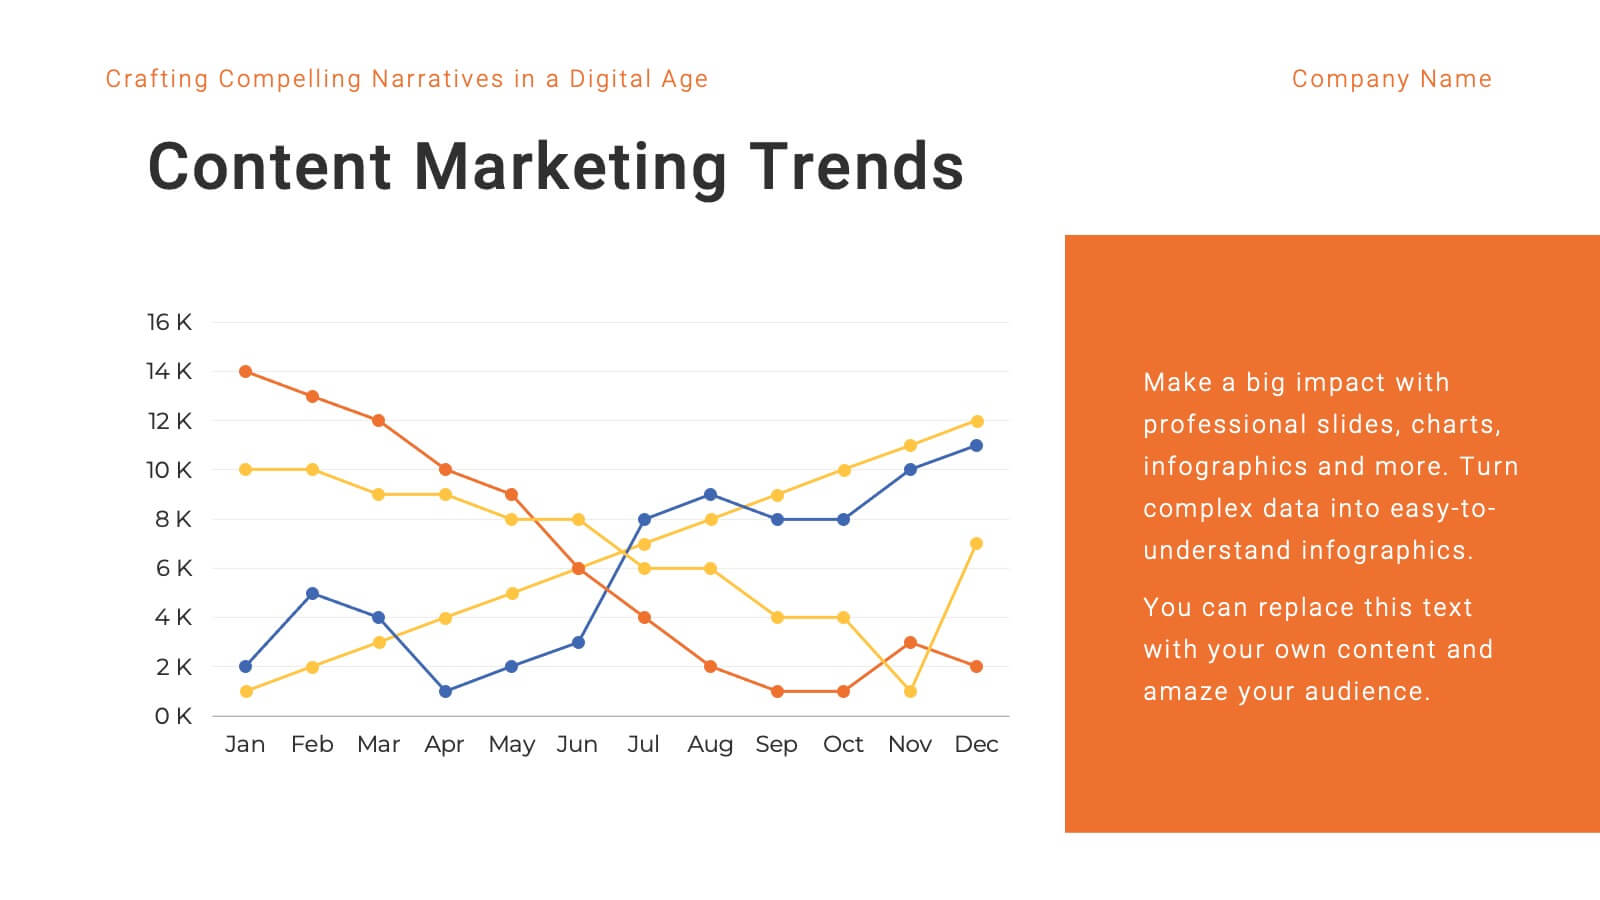
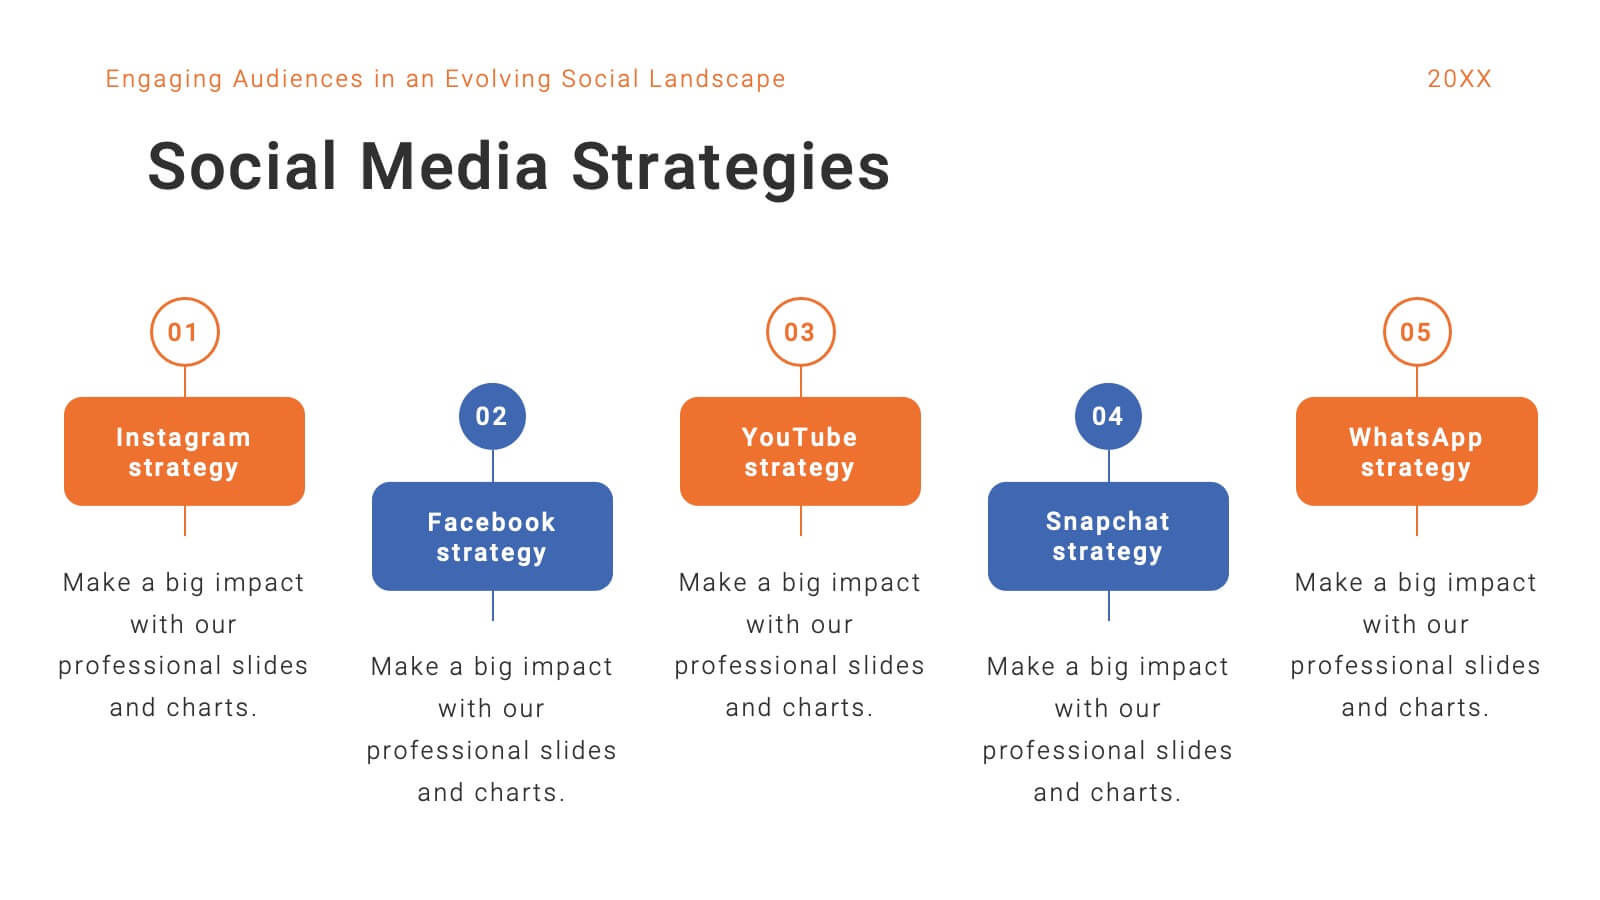
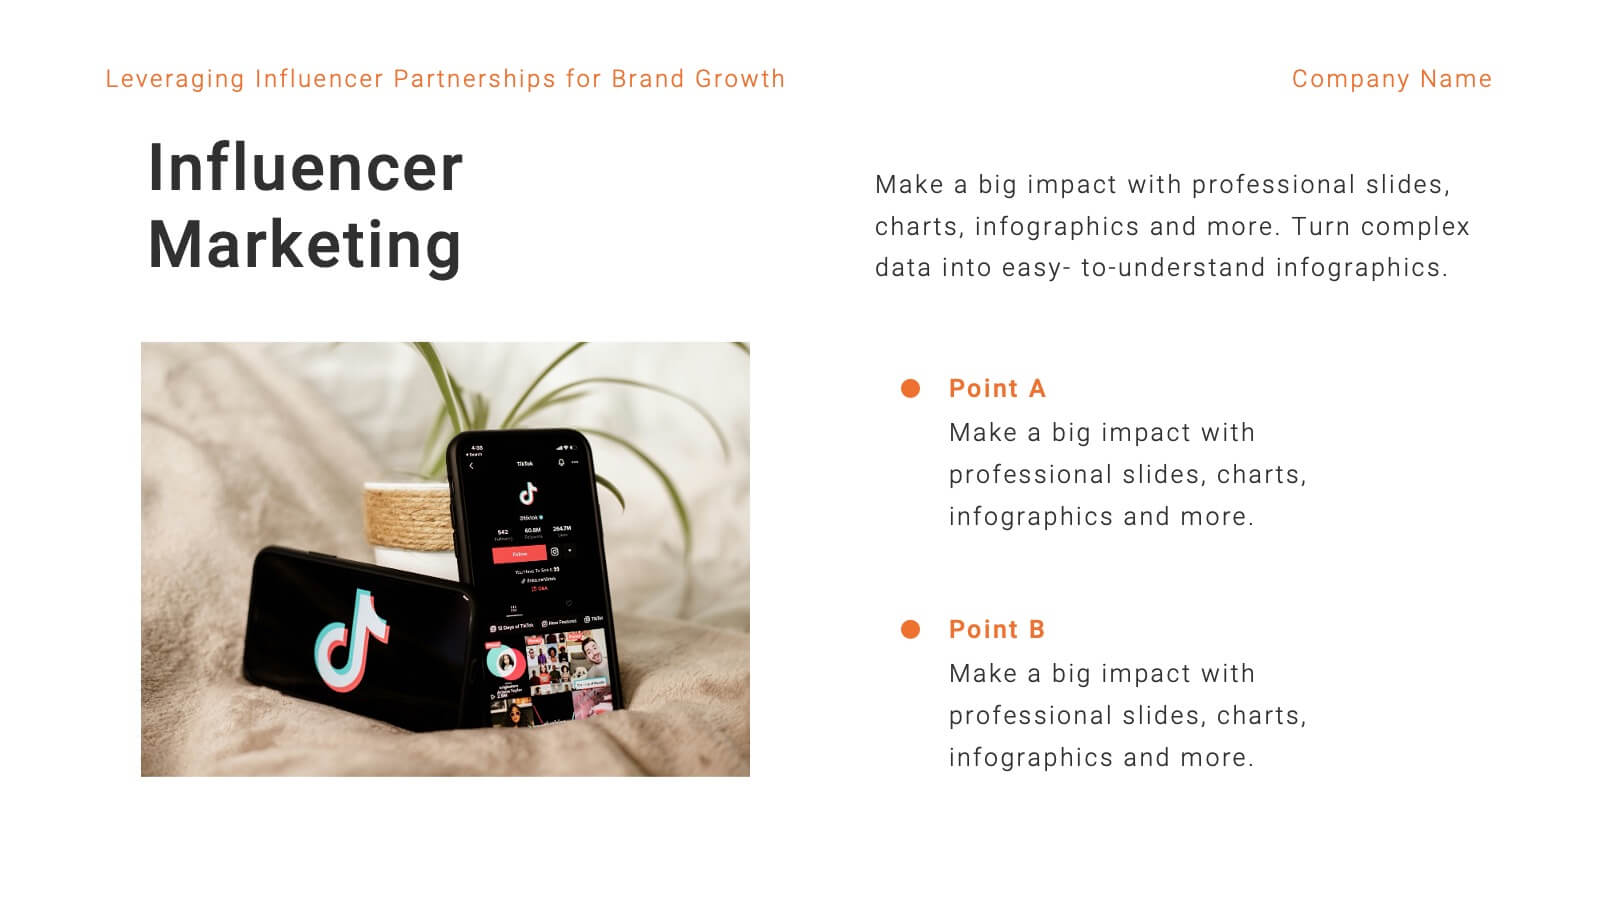
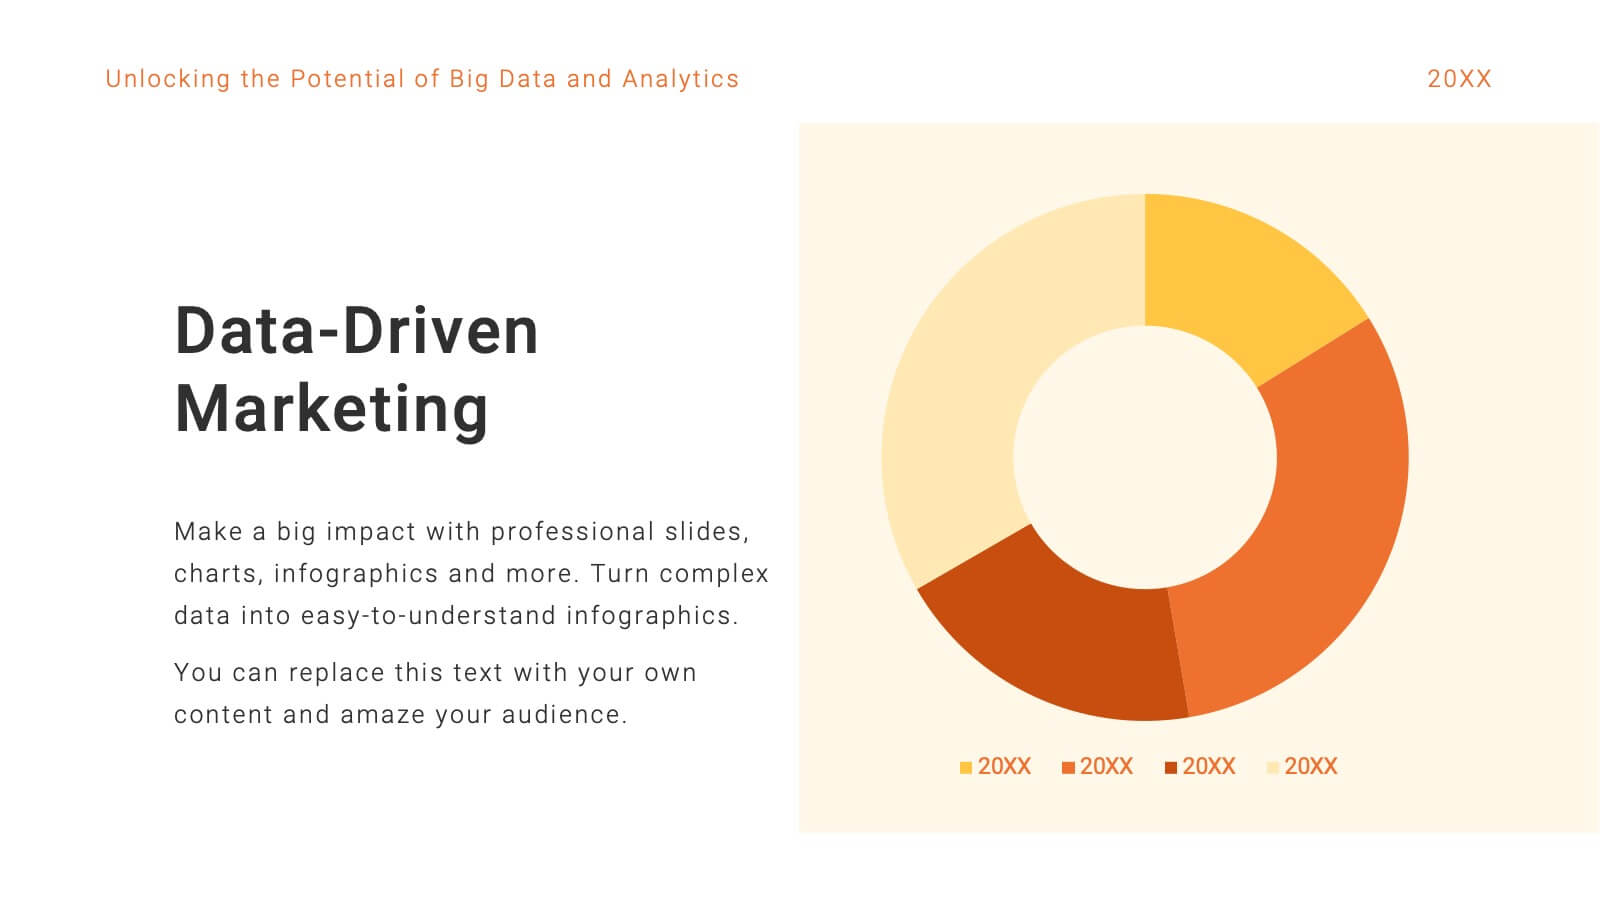
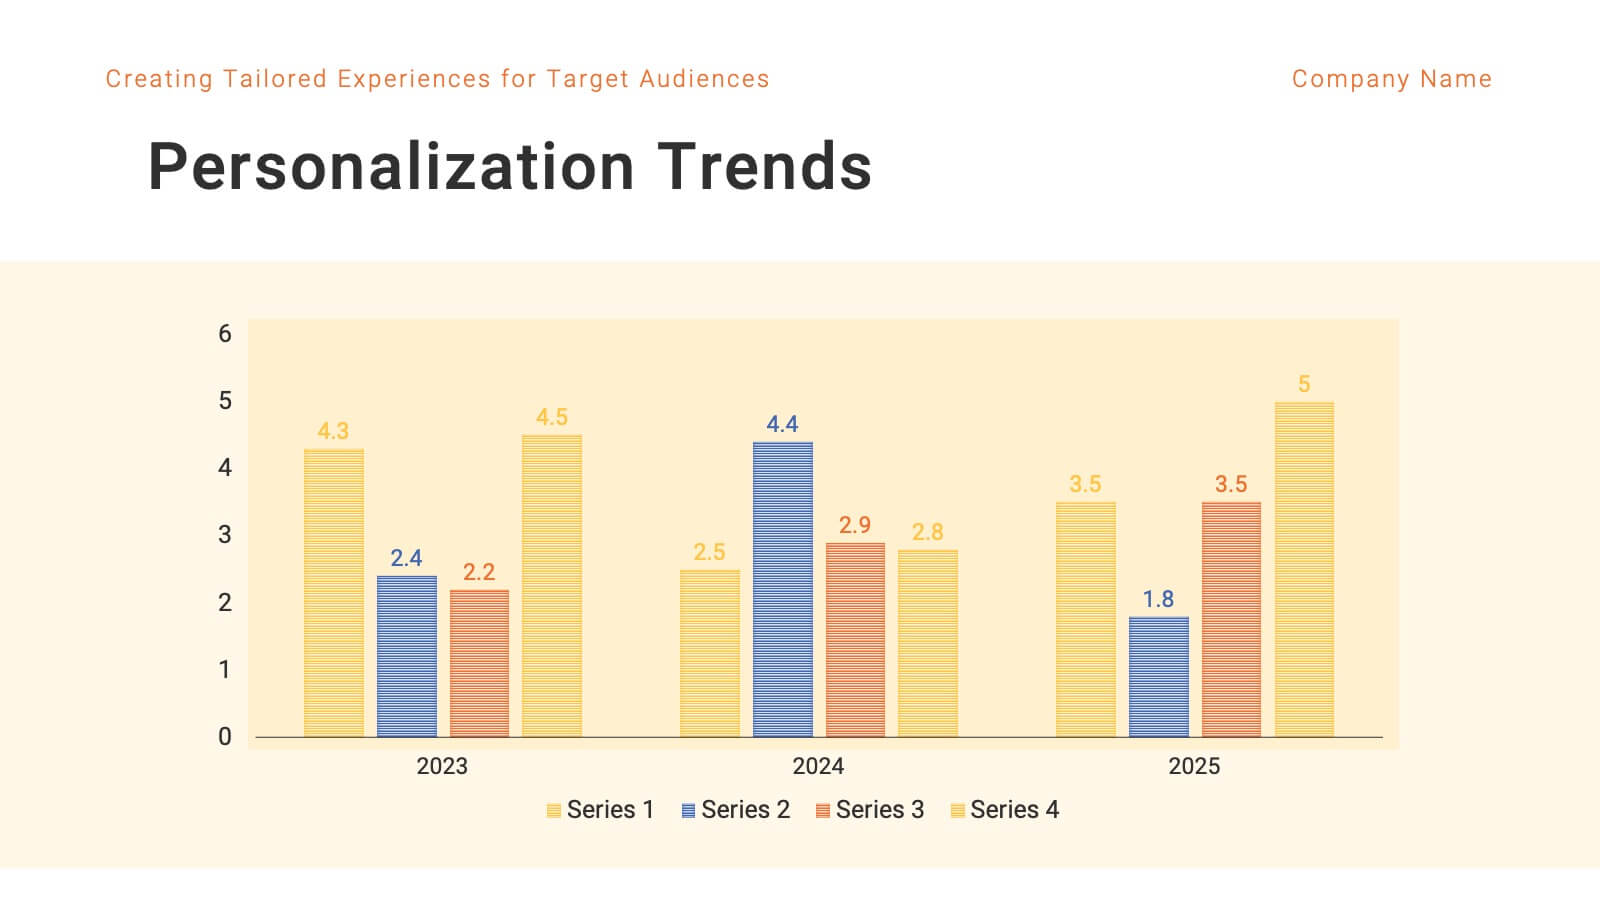
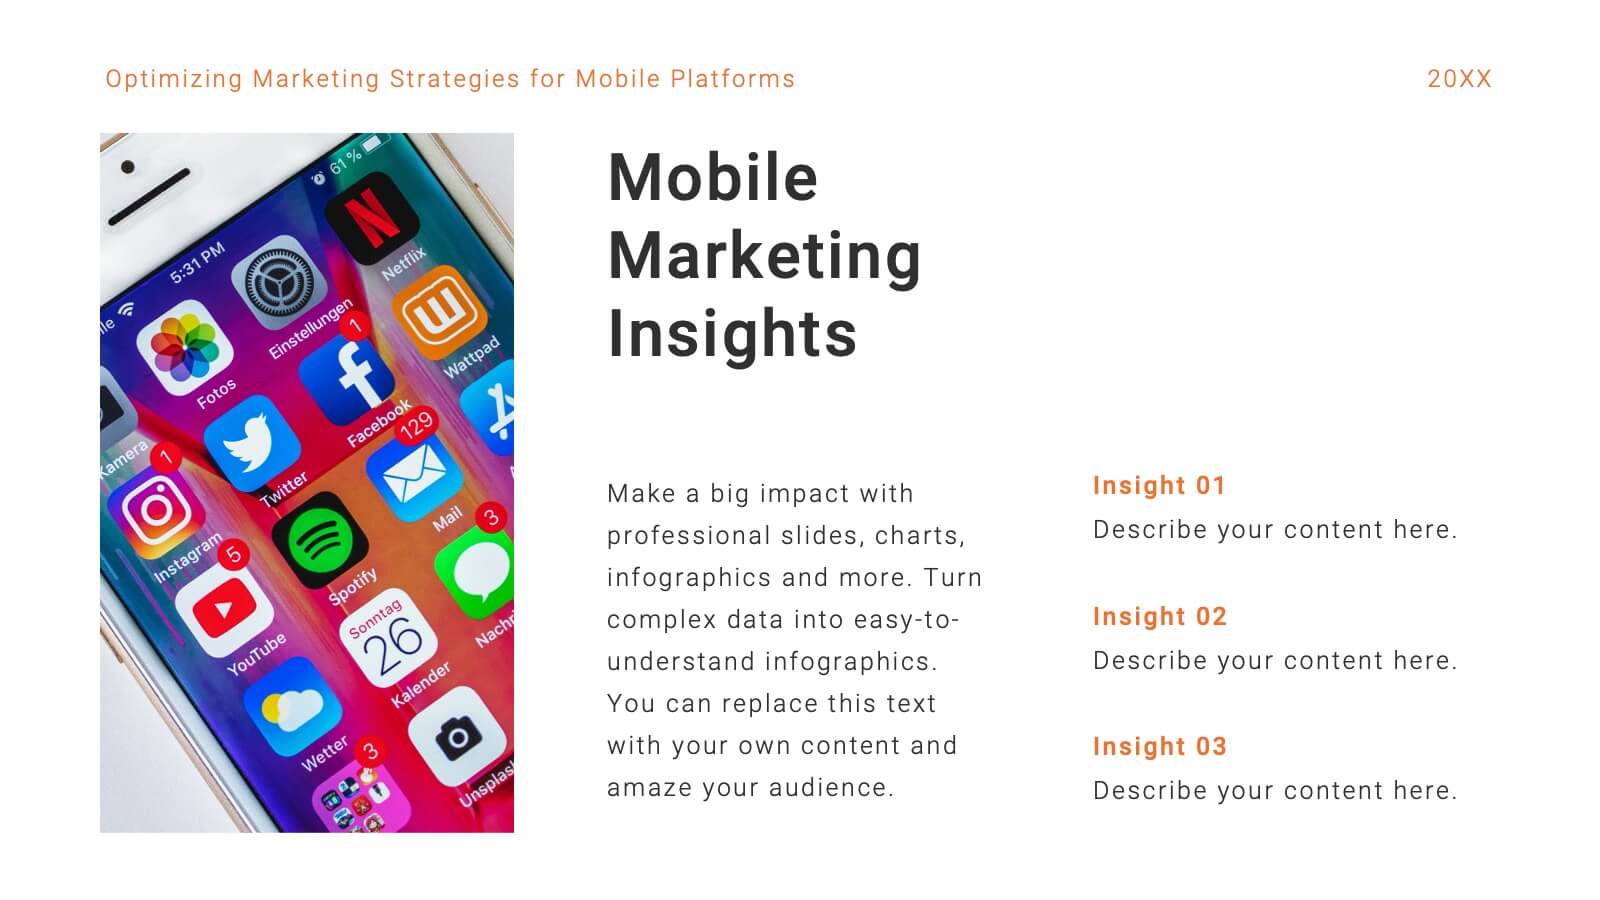
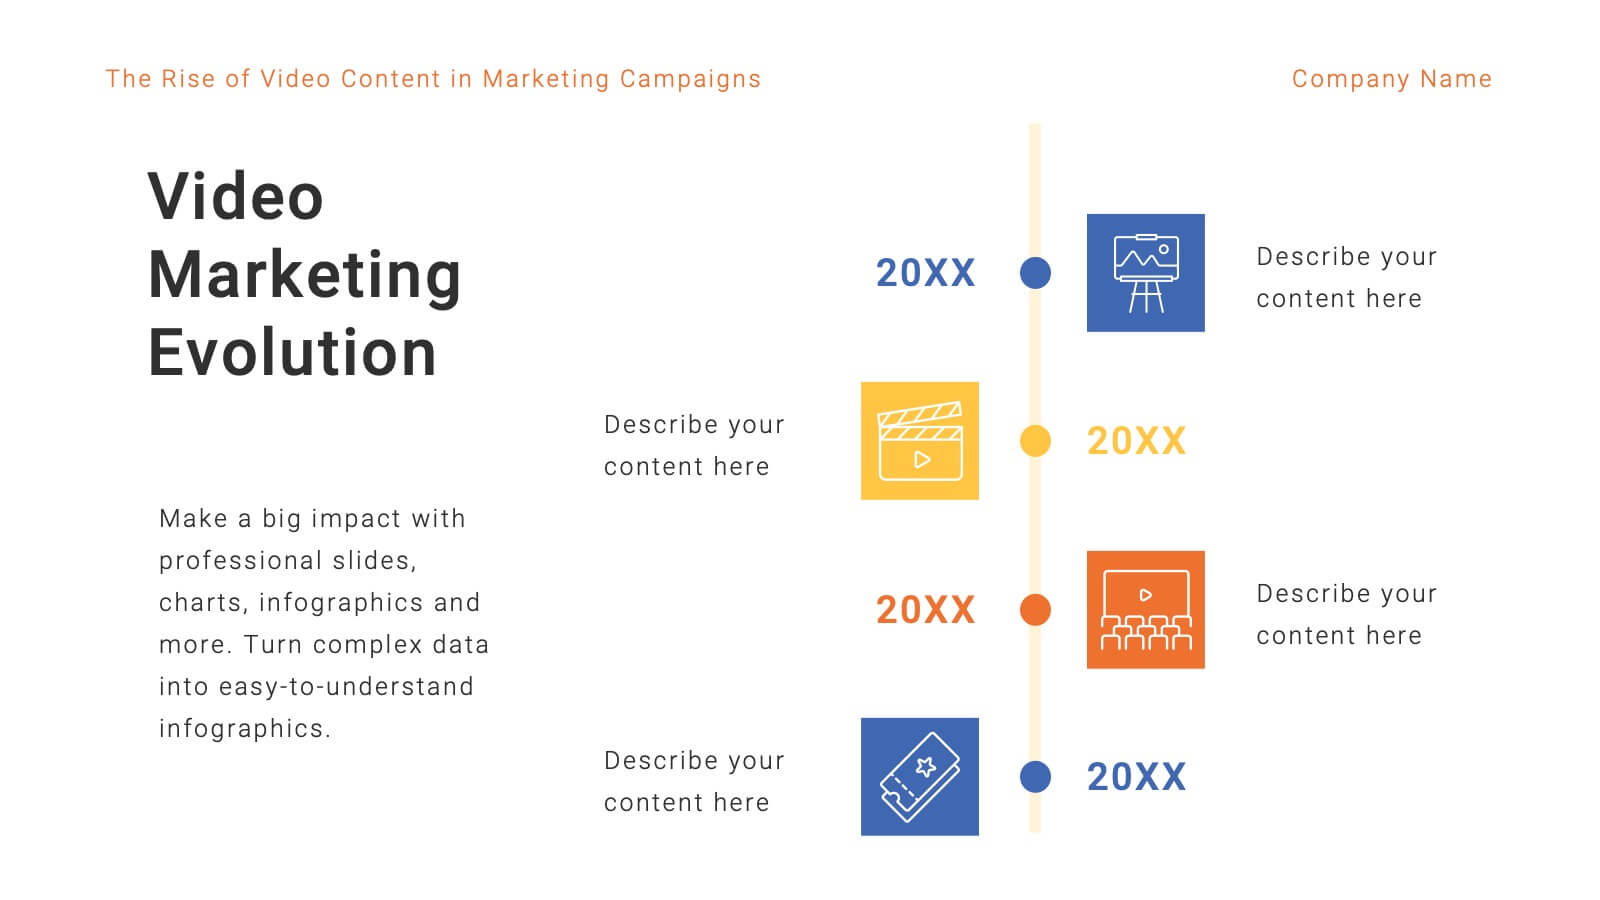
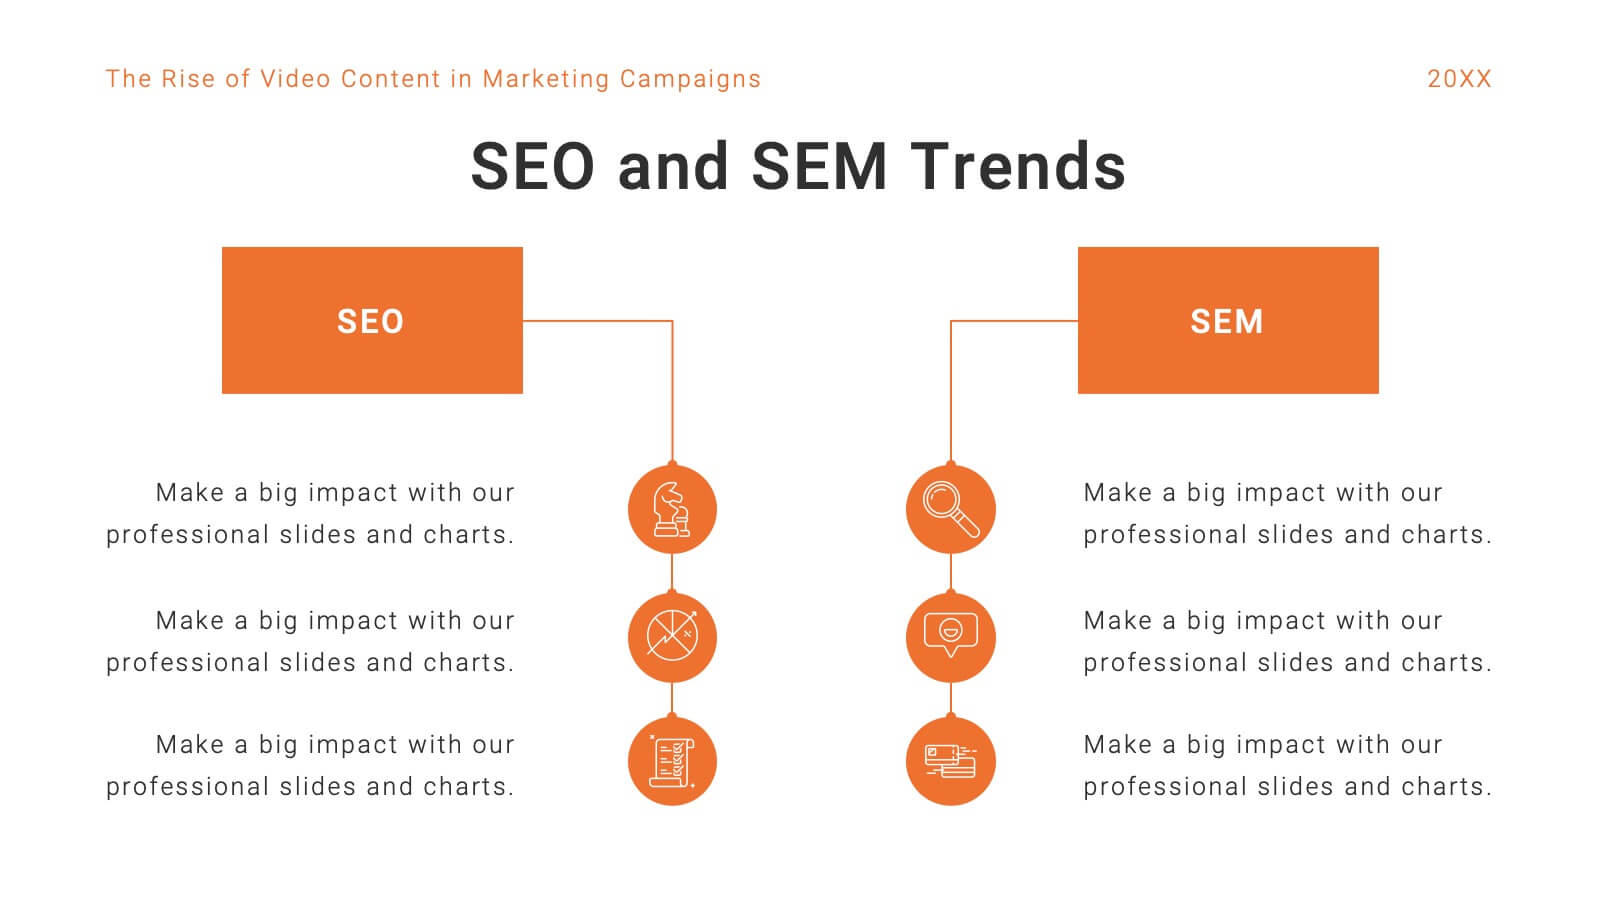
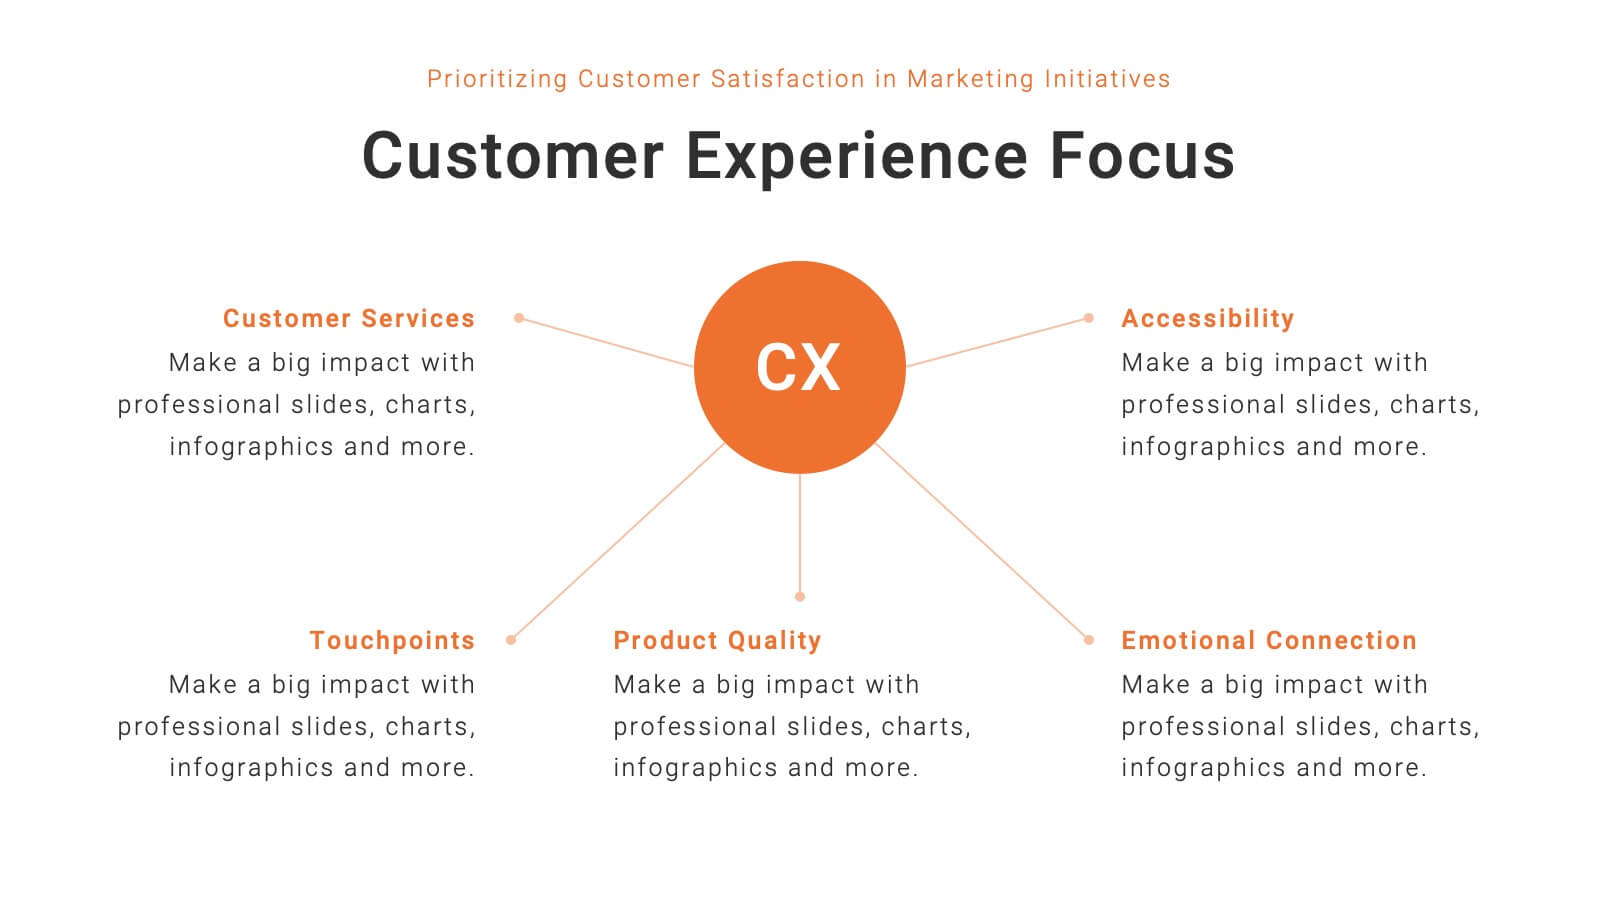
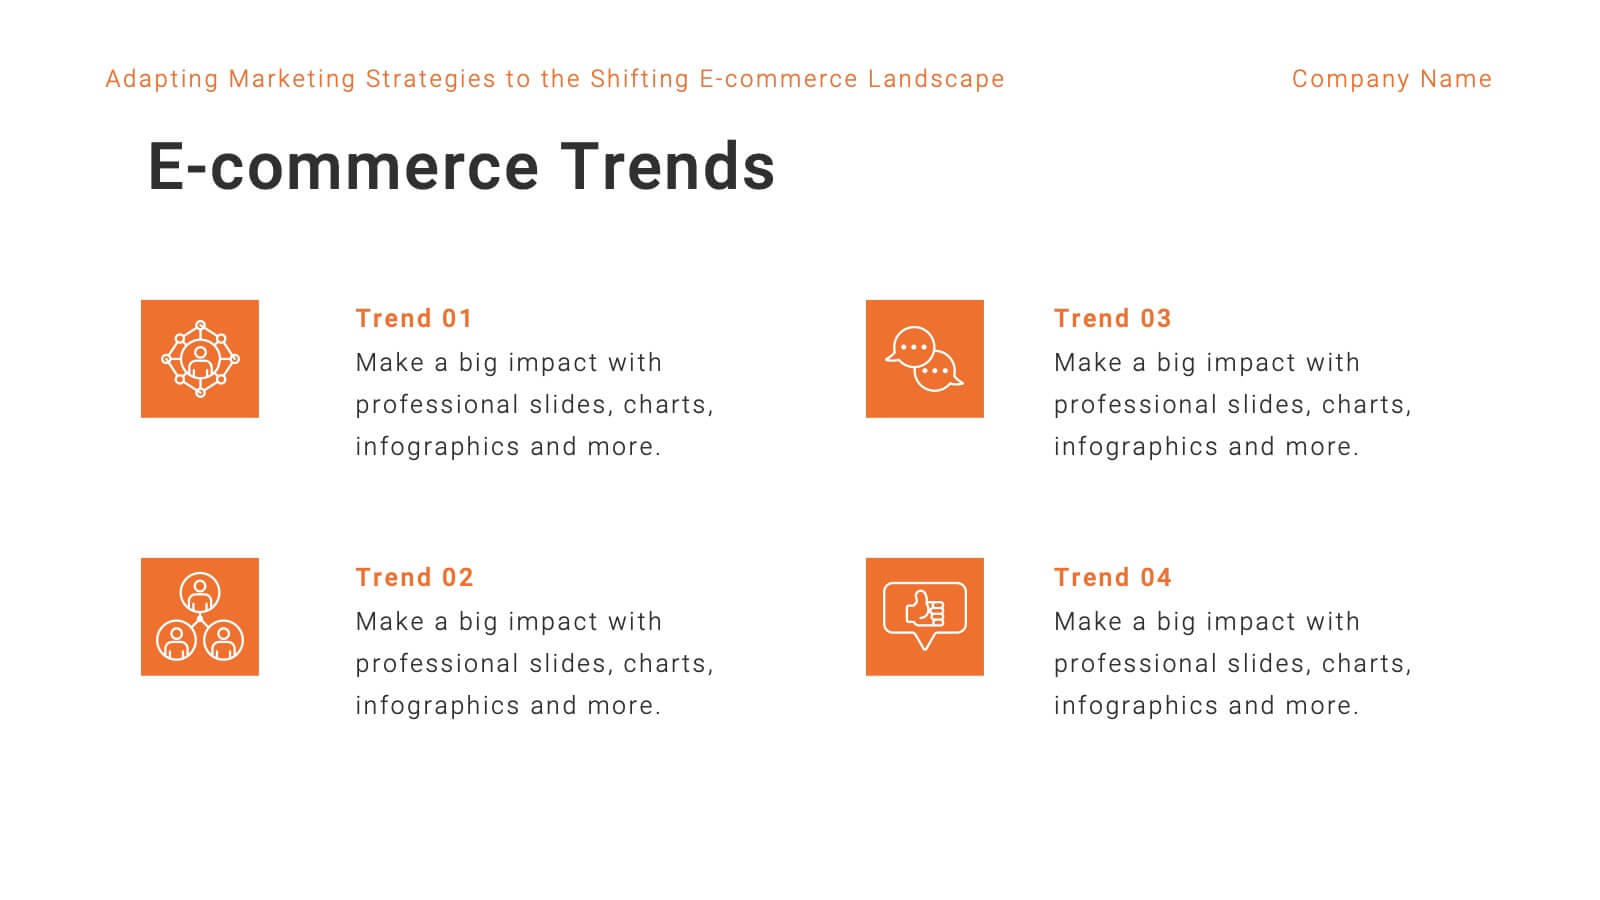
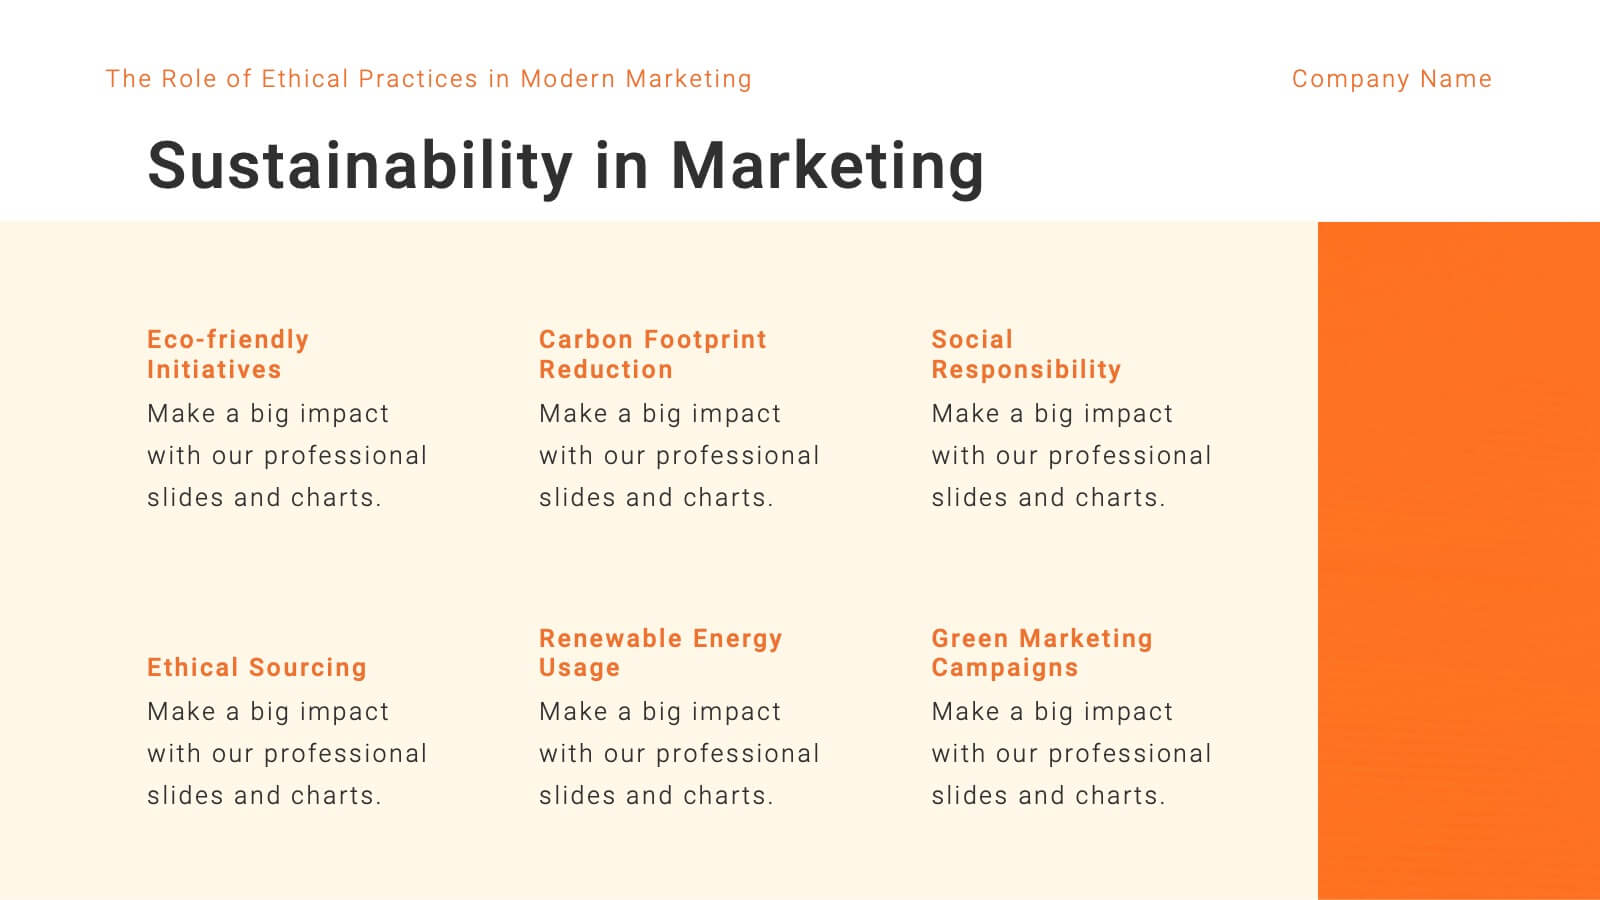
Mercury Marketing Research Report Presentation
Elevate your marketing strategy with this insightful and data-driven presentation template! Perfect for analyzing trends, consumer behavior, and emerging technologies, this template provides a thorough overview of today’s marketing landscape. From social media strategies to e-commerce trends, it covers all key areas. Fully customizable and compatible with PowerPoint, Keynote, and Google Slides for easy use.


8 diapositivas
Survey Poll Results Visualization Presentation
Easily showcase your survey or poll data with this bold and modern results visualization slide. Designed with eye-catching circular charts, it helps your audience quickly grasp key insights at a glance. Perfect for business reviews, feedback summaries, or internal reports. Compatible with PowerPoint, Keynote, and Google Slides.


4 diapositivas
Product List Table for Quick Overview
Showcase product highlights at a glance with the Product List Table for Quick Overview Presentation. This sleek, column-based layout allows you to compare up to three product categories or service features side by side. Each section includes an icon, title, and space for three concise text rows—ideal for summarizing specifications, benefits, or pricing tiers. Fully editable in PowerPoint, Keynote, and Google Slides.


6 diapositivas
Market Research Case Study
Visualize your research findings with this step-by-step arrow-style case study slide. Ideal for outlining research methodology, key findings, and conclusions across six distinct phases. This layout is perfect for marketing reports, academic presentations, or business insights. Fully editable in PowerPoint, Keynote, and Google Slides.


6 diapositivas
Business Journey Roadmap Planning Presentation
Map out strategic progress with this Business Journey Roadmap Planning presentation. Ideal for outlining key steps, milestones, and achievements, this staircase-style layout visually guides your audience through your business journey. Fully editable in Canva, PowerPoint, and Google Slides—perfect for project planning, goal setting, and executive updates.


19 diapositivas
Dynamo Product Roadmap Presentation
Introduce your product roadmap with this professional template! Showcase customer pain points, demonstrate how your product solves problems, and provide a detailed product overview. Highlight your competitive analysis, marketing and sales strategy, and distribution channels. Perfect for presenting support information and engaging in Q&A sessions. Compatible with PowerPoint, Keynote, and Google Slides for versatile presentations.