


Características


¿Tienes alguna pregunta?
Recomendar


22 diapositivas
Kinetic Content Marketing Pitch Deck Presentation
Get ready to elevate your presentations with the Kinetic Pitch Deck template, designed to capture attention and convey your message with impact! This modern, bold design uses a sleek black and gold color scheme to create a sense of sophistication and power. Every slide is thoughtfully structured, ensuring your content is delivered with clarity and style. From your Company's Vision and Core Values to Market Presence and Financial Highlights, this template covers all the essential aspects of a compelling pitch. With fully editable slides, you can easily customize it to fit your brand's identity and make a lasting impression on your audience. Perfect for marketing proposals, business pitches, or corporate presentations, this versatile template is compatible with PowerPoint, Keynote, and Google Slides. Prepare to captivate your audience and make your next presentation unforgettable with this dynamic and visually striking pitch deck template!


6 diapositivas
Real Estate Investment Strategy Presentation
Illustrate your property plans with this Real Estate Investment Strategy Presentation. Designed as a stylized house diagram, this slide organizes six key areas of investment into clearly segmented zones with icons and colors for each layer. Ideal for property development, real estate pitches, or investor overviews. Compatible with PowerPoint, Canva, Keynote, and Google Slides.


7 diapositivas
Enforcement Law Infographic Presentation
A Law Enforcement Infographic is a visual representation of key concepts, statistics, and procedures related to law enforcement. This template can be used to provide an overview of various aspects of law enforcement, such as crime rates, policing strategies, and legal procedures. This infographic includes a variety of icons, illustrations, and other design elements law themed to enhance the visual appeal and make it more appealing for your viewers. This template is compatible with Powerpoint, Keynote and Google Slides making it easy to customize and edit with your own text and information.


7 diapositivas
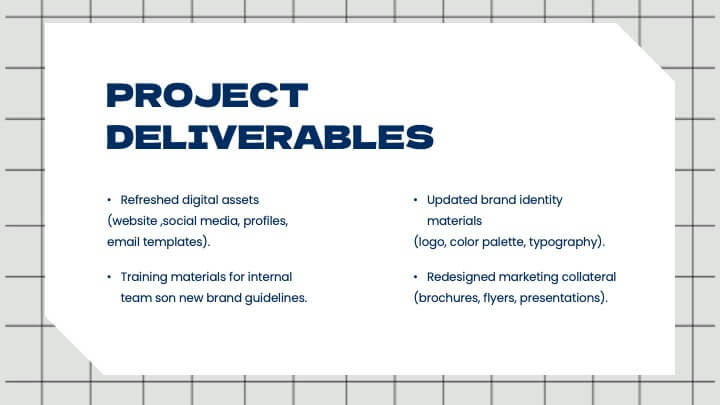
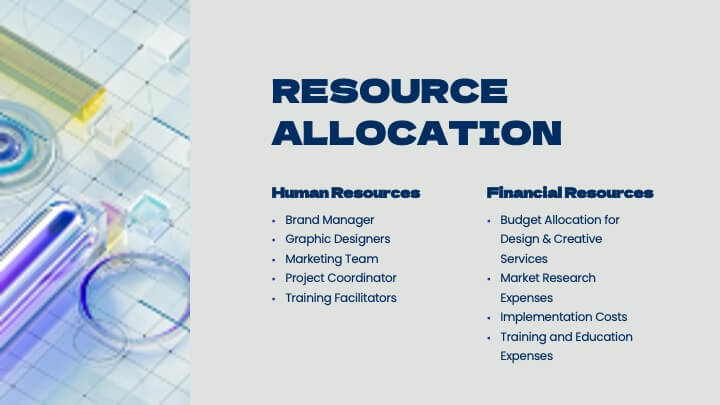
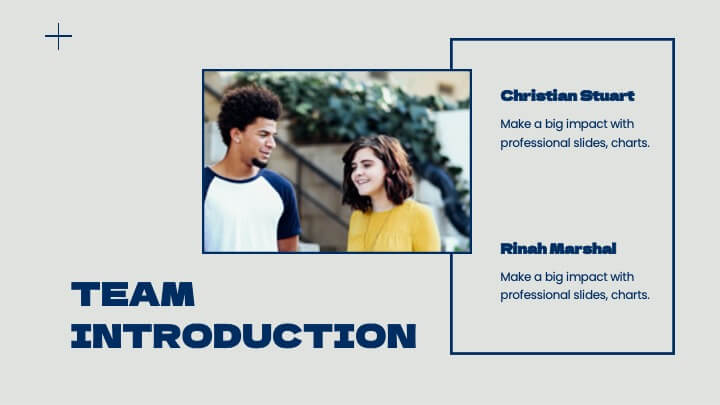
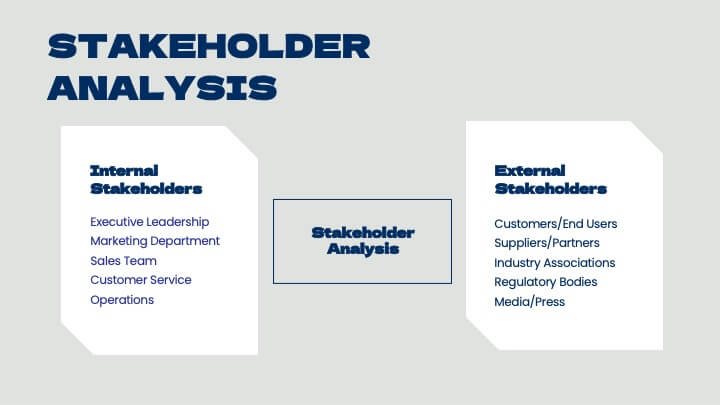
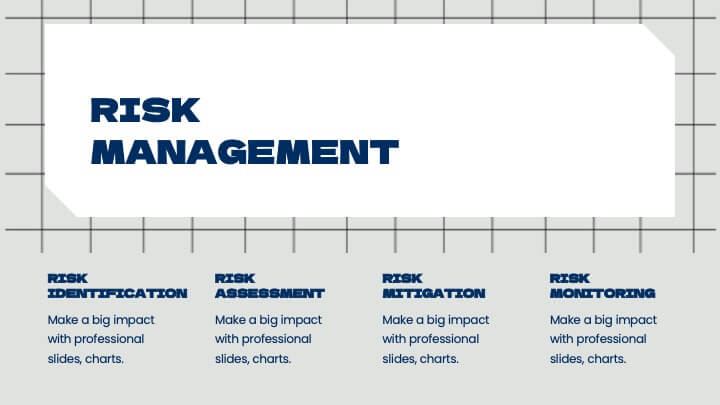
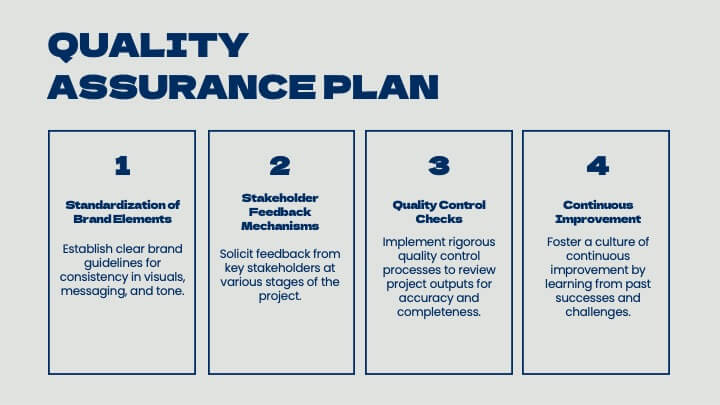
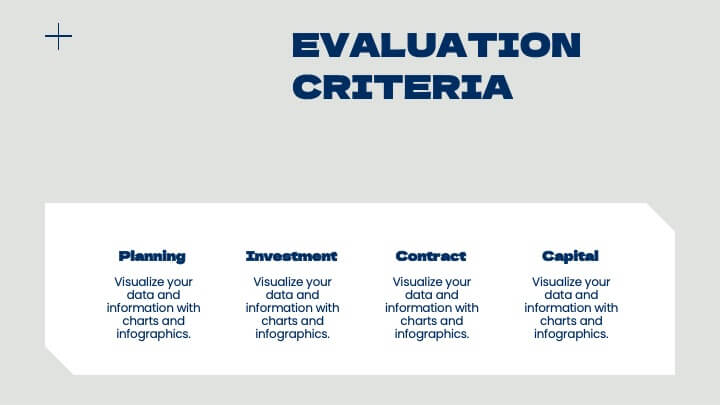
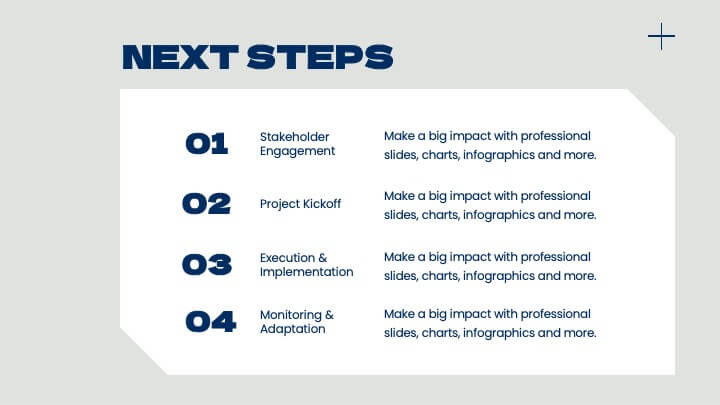
Editable List Slide Presentation
Organize your ideas with style and simplicity using this clean, structured layout designed for clarity and impact. Ideal for summarizing key points, checklists, or action plans, it keeps your content professional and easy to follow. Fully customizable and compatible with PowerPoint, Keynote, and Google Slides for seamless presentation design.


34 diapositivas
Dragon Startup
Introducing our Dragon Start-up Template! This template is designed with a vibrant and energetic yellow color palette, perfect to convey a sense of optimism, creativity, and innovation. It features customizable slides that are specifically tailored for start-up presentations. The slides included cover various aspects of your pitch deck, such as company overview, problem statement, solution description, market analysis, business model, financial projections, and more. Each slide in this template is designed with a dynamic layout, featuring eye-catching yellow accents that add a sense of energy and excitement to your presentation.


4 diapositivas
Problem-Solving Solution Framework Presentation
Streamline your approach to challenges with the Problem-Solving Solution Framework template, which visualizes complex solutions through an intuitive and clear design. It assists in entering business insights or key data in four structured sections, ensuring clarity and relevance. Ideal for strategic presentations, this template supports effective problem-solving narratives. Compatible with PowerPoint, Keynote, and Google Slides, it enhances presentation efficiency and impact.


6 diapositivas
Growth Through Lifelong Learning Presentation
Visualize personal or organizational development with this creative lifelong learning slide. Featuring a human head silhouette and puzzle piece graphics, it's perfect for illustrating stages of learning, training programs, or growth mindset principles. Fully editable in PowerPoint, Keynote, and Google Slides—ideal for educators, coaches, or corporate development professionals.


5 diapositivas
Food Business Pitch Deck Presentation
Bring your food concept to life with a lively, story-driven presentation that highlights flavor, creativity, and business potential. This slide design helps you explain your menu vision, branding approach, and restaurant strategy in a clean and engaging format. Fully compatible with PowerPoint, Keynote, and Google Slides.


7 diapositivas
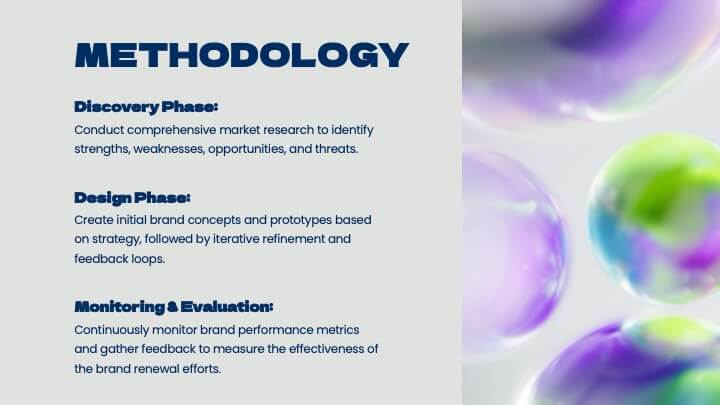
McKinsey 7S Model Strategy Presentation
Bring clarity to complex organizational relationships with a clean, structured layout that highlights how key elements connect and influence performance. This presentation helps you explain core components, identify alignment gaps, and guide strategic decision-making with confidence. Easy to customize and fully compatible with PowerPoint, Keynote, and Google Slides.


8 diapositivas
Corporate Mission Purpose Slide
Wave your flag of purpose with this bold, banner-inspired layout—ideal for communicating your corporate mission, core principles, and company values. Each section gives space to articulate what drives your business forward in a visually unified way. Fully compatible with PowerPoint, Keynote, and Google Slides.


7 diapositivas
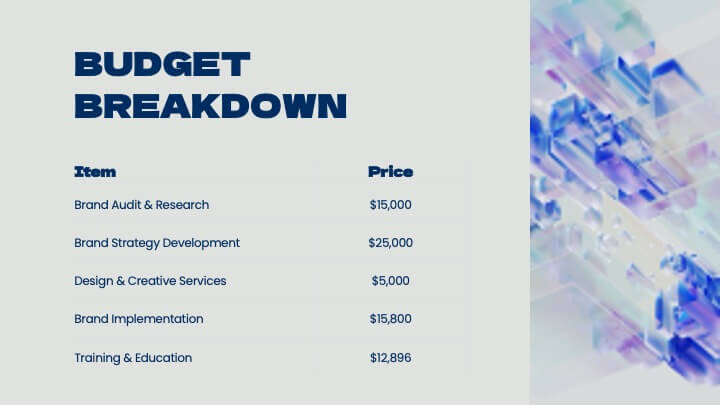
Inversion Table Infographic
A table infographic is a visual representation of data or information presented in a tabular format, using a combination of text, numbers, and visual elements to make the information more engaging and easily understandable. This infographic template is great for comparing two or more variables and is a powerful way to convey your data. This infographic is designed to show your audience the key points of your data in a visually appealing way. This template is a good option if you want to present your information as an easy-to-read table with labels and numbers. The bright colors and fun design make it easy to see at a glance.


7 diapositivas
Cyber Security Infographic Presentation Template
Cybersecurity helps protect your business from cybercrime and unauthorized access to data. It is a crucial step to safeguard your business from malicious attacks that can lead to confidential data being stolen, as well as loss of revenue through fraudulent transactions. With this template you can ensure that you and your business are well informed on the importance of cybersecurity. This template will provide you with a good starting point to create a cybersecurity strategy. This template includes illustrations on goals, benefits, limitations and recommendations based on your audience's needs.


5 diapositivas
Creative Brainstorming Presentation
Enhance your brainstorming sessions with this Creative Brainstorming template. Designed with a modern head outline and idea mapping structure, it visually organizes key insights for innovative discussions. Fully customizable with editable text, colors, and icons to fit your needs. Compatible with PowerPoint, Keynote, and Google Slides for seamless integration.


6 diapositivas
Science Project Infographic
Science projects are hands-on activities designed to explore and investigate scientific concepts. This infographic template aims to communicate complex scientific information in a visually appealing and easy-to-understand manner. The infographic provides an overview of the project's key elements, including the question, hypothesis, materials, procedure, results, and conclusion. This serves as a creative and engaging guide to help students choose and plan their science projects for school science fairs or independent research. The infographic uses visuals, illustrations, and icons to enhance understanding and engagement.


5 diapositivas
RAPID Decision-Making Roles Overview Presentation
Clarify accountability and streamline decisions with the RAPID Decision-Making Roles Overview Presentation. This visual layout breaks down the five essential roles—Recommend, Agree, Perform, Input, and Decide—into a clear quadrant diagram. Ideal for project teams, leadership alignment, or decision-making workshops. Fully editable in PowerPoint, Google Slides, Keynote, and Canva.


21 diapositivas
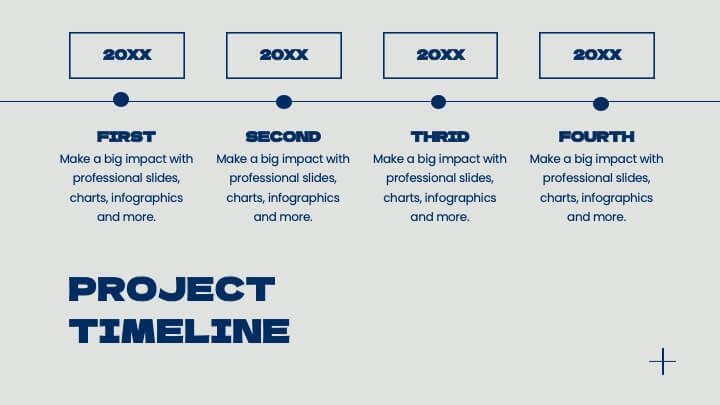
Minoan Project Timeline Presentation
Step back in time with this beautifully crafted Minoan-inspired presentation, perfect for outlining your project timeline! With an elegant design and clear structure, this template helps you showcase key milestones, deadlines, and deliverables in a visually stunning way. Keep your project on track. Compatible with PowerPoint, Keynote, and Google Slides.


5 diapositivas
5-Stage Growth Plan Presentation
Take your audience on a visual journey through each phase of success with this sleek step-by-step presentation. Designed to illustrate progress, milestones, and development stages clearly, it’s ideal for business planning or strategy discussions. Fully editable and compatible with PowerPoint, Keynote, and Google Slides for effortless customization.