


Características


¿Tienes alguna pregunta?
Recomendar


6 diapositivas
Food Market Infographic
The food market refers to the industry and marketplace where various food products are produced, processed, distributed, and sold to consumers. This infographic template is designed to provide insights into the food market industry. This aims to showcase key trends, statistics, and market dynamics related to the global food market. Whether used in presentations, reports, or educational material, this infographic will help your audience gain insights into the market, identify growth opportunities, and make informed decisions in the food industry. Compatible with Powerpoint, Keynote, and Google Slides.


10 diapositivas
Territorial Insights with South America Map Presentation
Unlock regional clarity with the Territorial Insights with South America Map Presentation. This editable slide visualizes country-specific highlights using a modern grid-based map layout, customizable color zones, and label connectors to break down key insights. Ideal for sales analysis, market entry strategies, or logistics reporting. Compatible with PowerPoint, Keynote, Google Slides, and Canva.


5 diapositivas
Lean Six Sigma Business Strategy
Present your continuous improvement plan with this visually compelling Lean Six Sigma pyramid slide. Each layer represents a key phase—Define, Measure, Analyze, Improve, and Control—making it ideal for team training, process mapping, or performance reviews. Fully editable in PowerPoint, Keynote, and Google Slides.


8 diapositivas
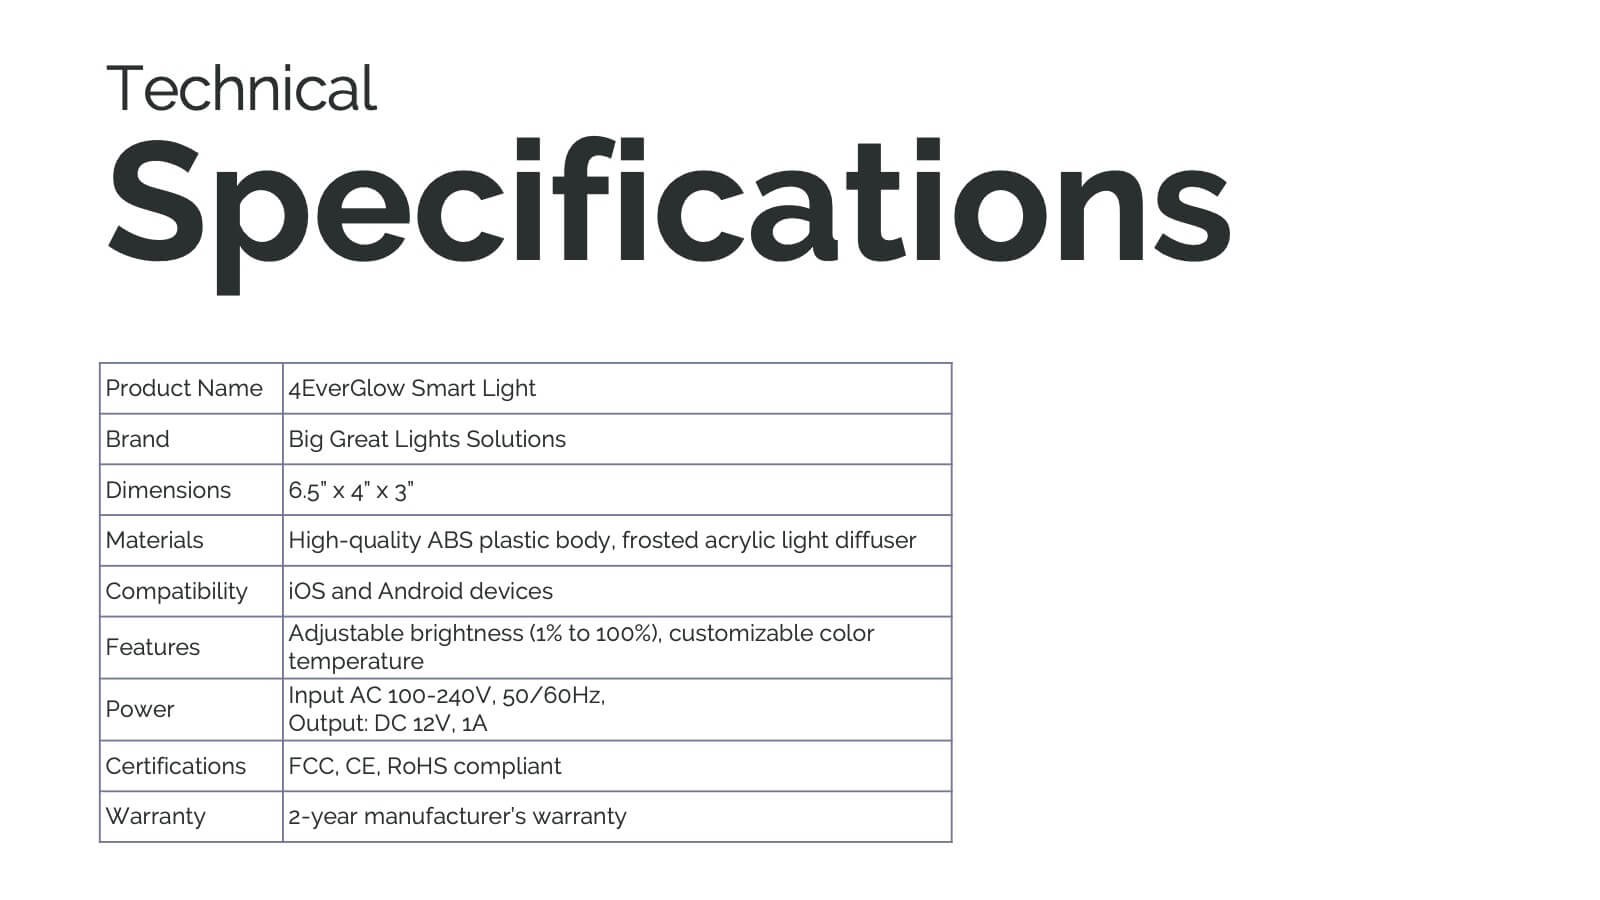
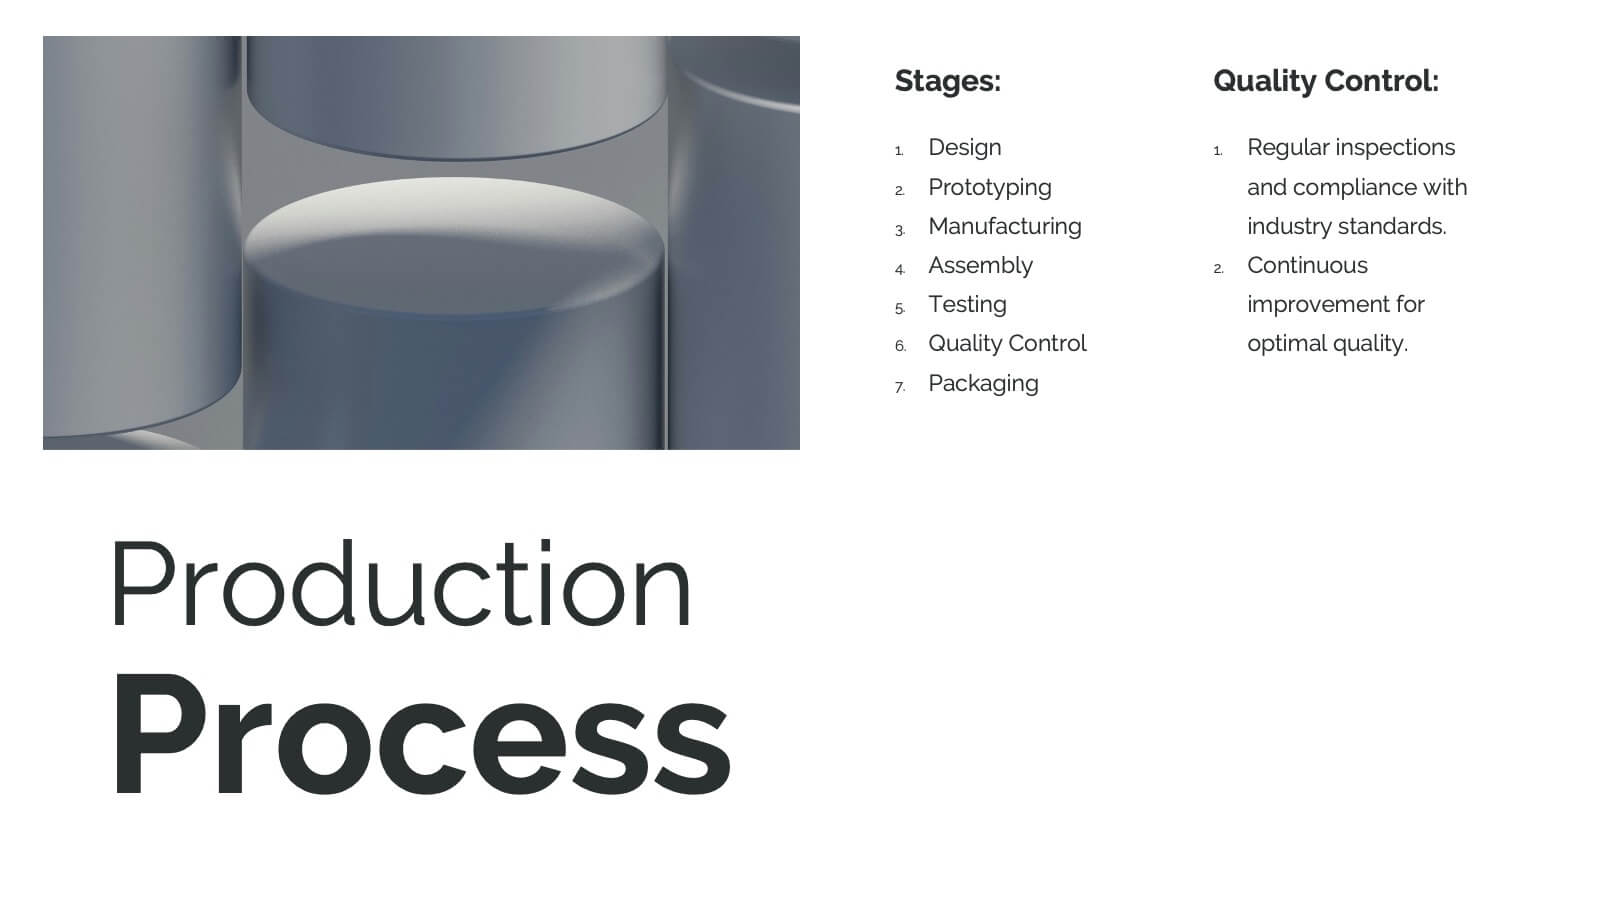
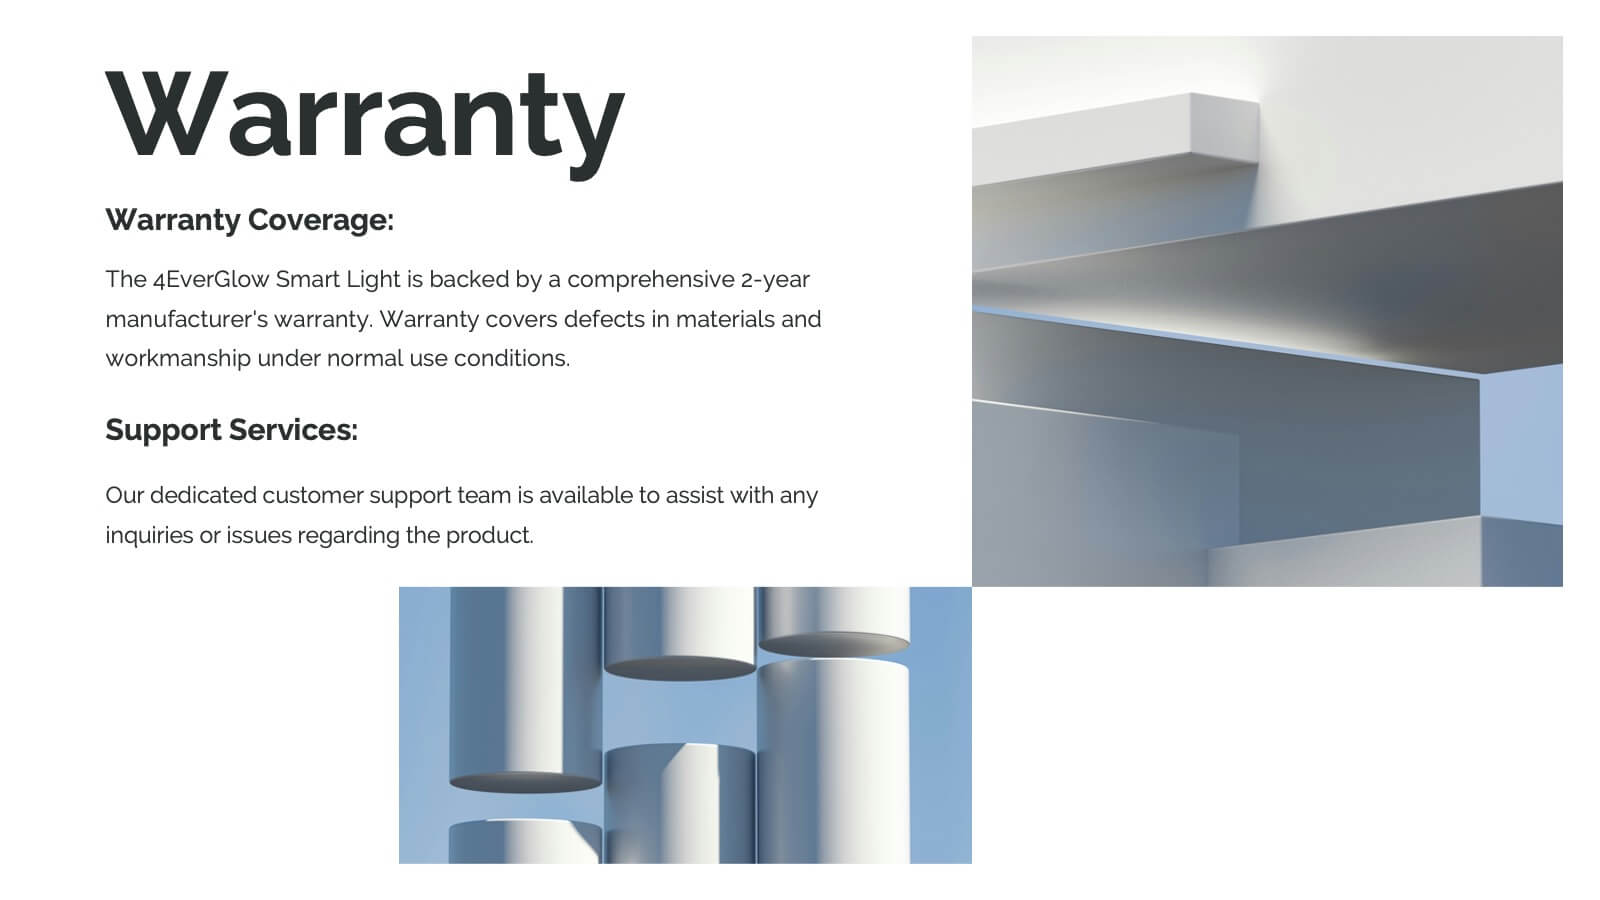
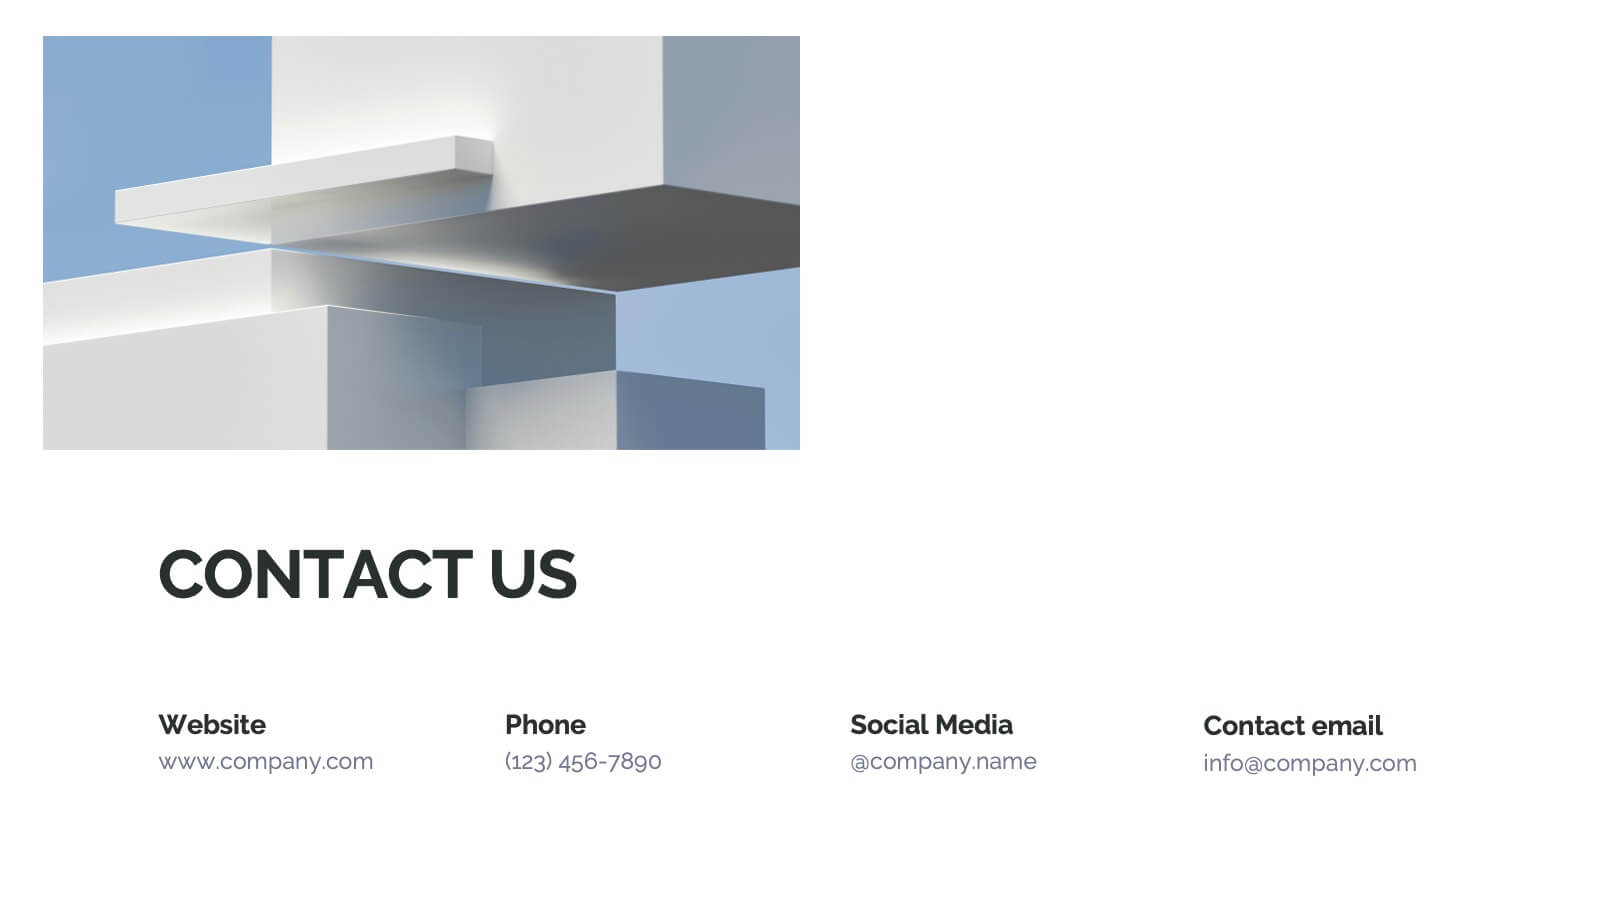
3D Infographic Design Presentation
Make your data pop—literally—with a stacked design that brings depth and clarity to your message. This 3D infographic template helps break down layered concepts, step-by-step processes, or hierarchical data in a visually striking way. It’s fully customizable and compatible with PowerPoint, Keynote, and Google Slides for easy presentation building.


5 diapositivas
Music Eras Infographics
Music history is often divided into distinct eras or periods based on the characteristics and predominant styles of music during specific time periods. These infographic templates are designed to present a chronological overview of significant musical periods, highlighting their characteristics, key composers, notable genres, and major developments. These templates serves as a comprehensive visual guide to help audiences understand the evolution of music throughout history. This template provides a captivating overview of the major music eras, allowing viewers to appreciate the distinct characteristics and contributions of each period.


5 diapositivas
Agile Scrum Task Board Workflow Presentation
Simplify your Agile process with this task board workflow diagram. Clearly outline backlog, sprint planning, task execution, and delivery steps in a visually engaging format. Perfect for Agile teams, project managers, or software developers. Fully customizable in PowerPoint, Keynote, and Google Slides to fit your sprint and scrum documentation needs.


8 diapositivas
Business Workflow Process
Showcase your operations with this 4-step business workflow diagram. Designed for clarity and adaptability, each step features icons and text fields ideal for processes, pipelines, or phase breakdowns. Fully editable in PowerPoint, Keynote, and Google Slides—customize effortlessly to fit your business needs.


20 diapositivas
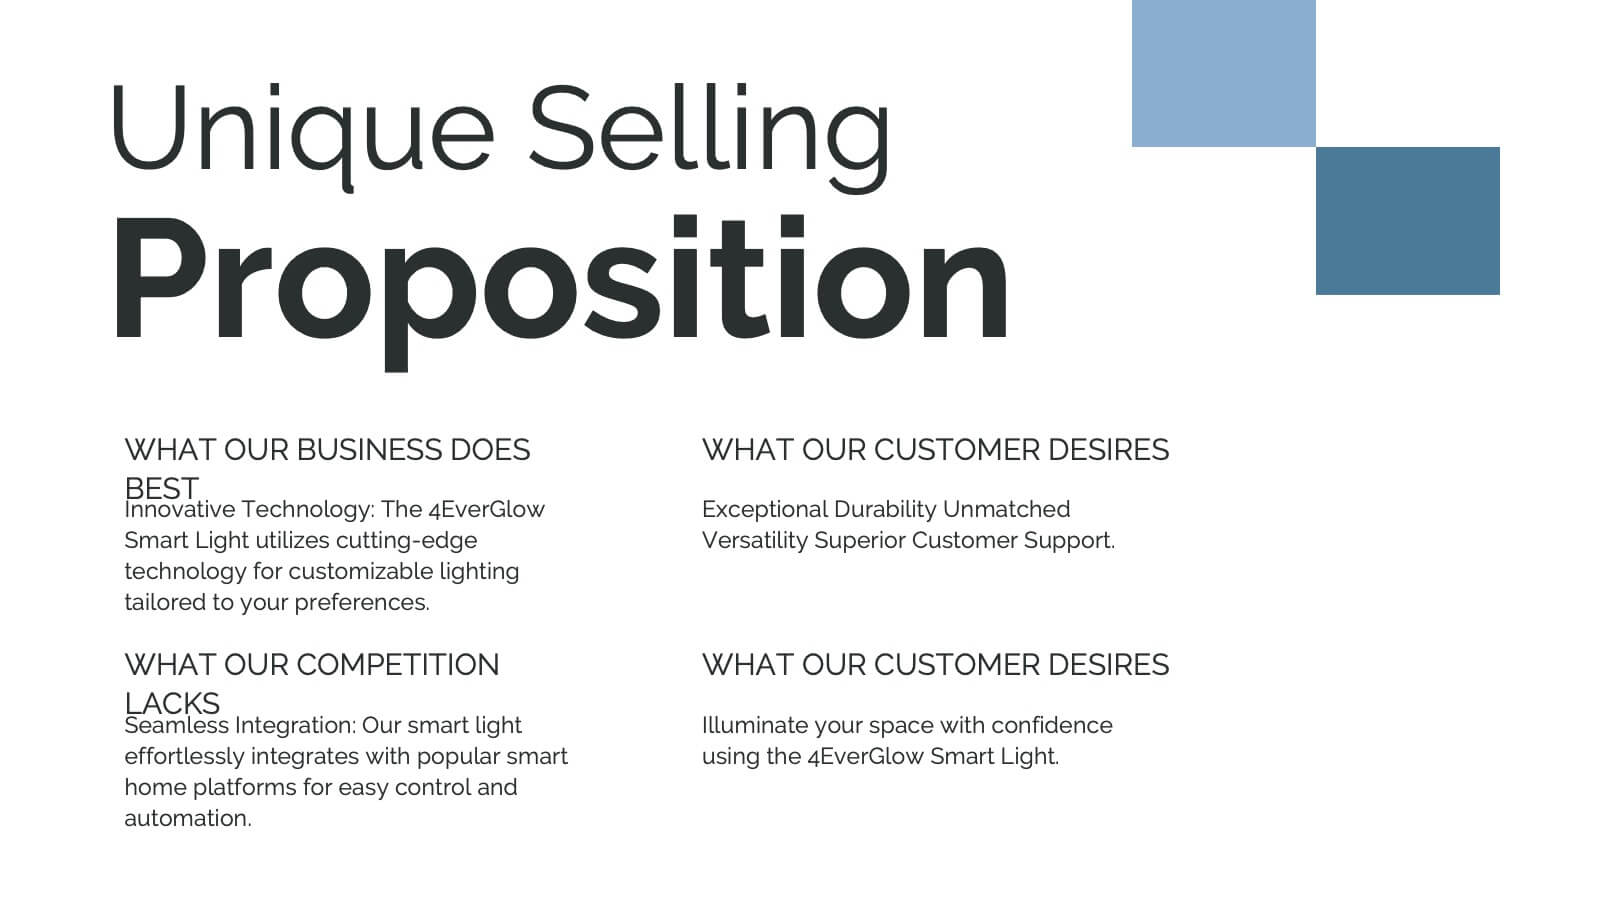
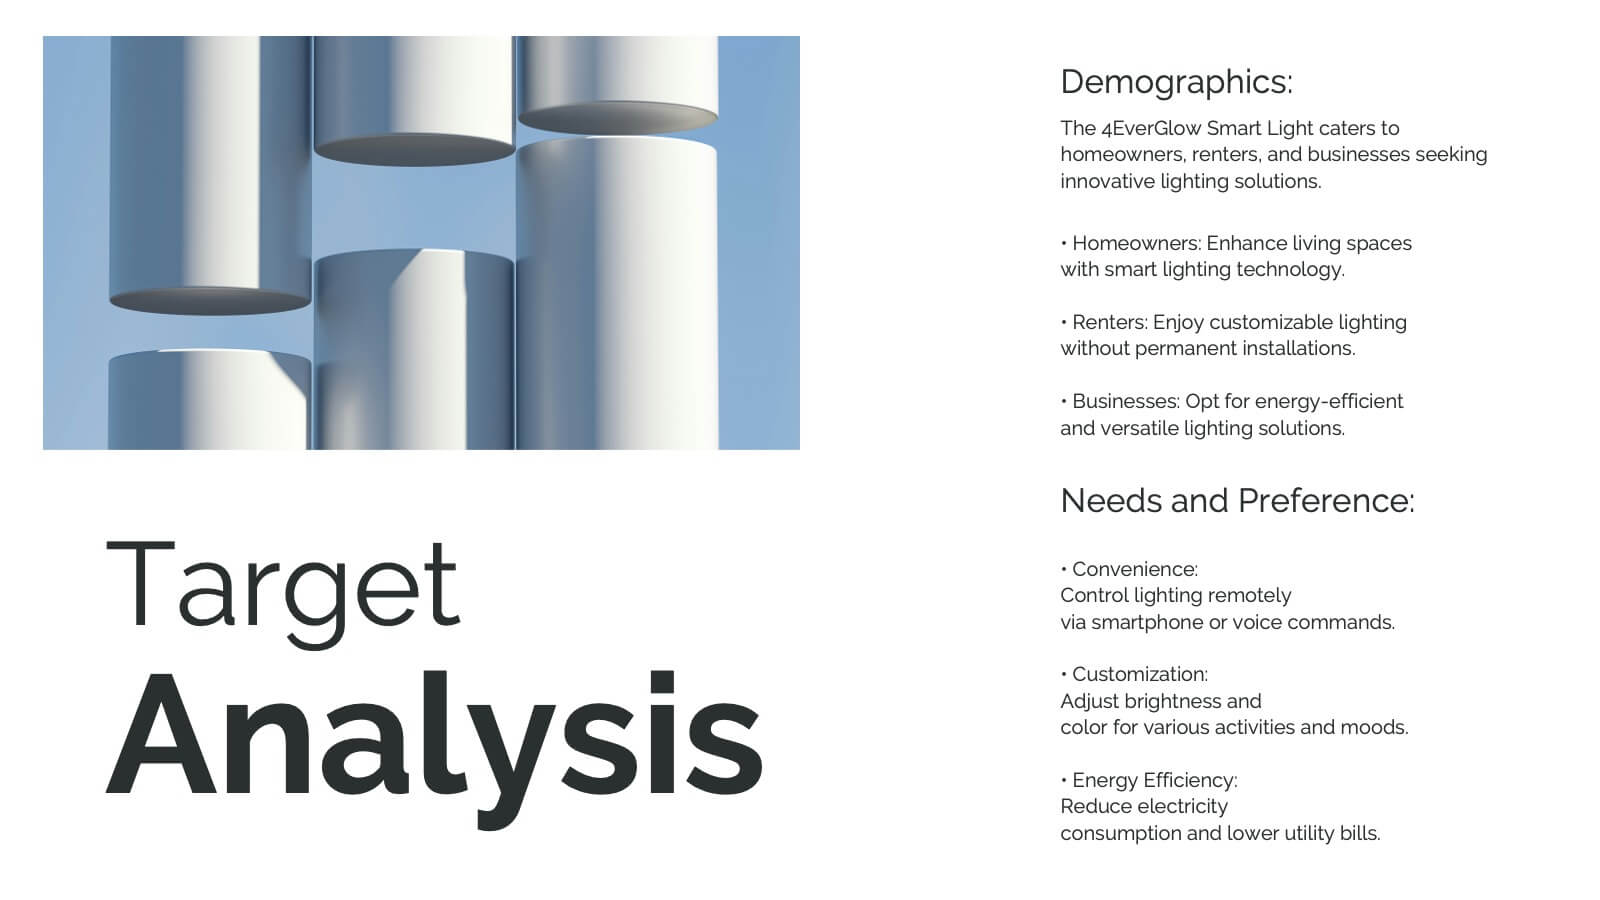
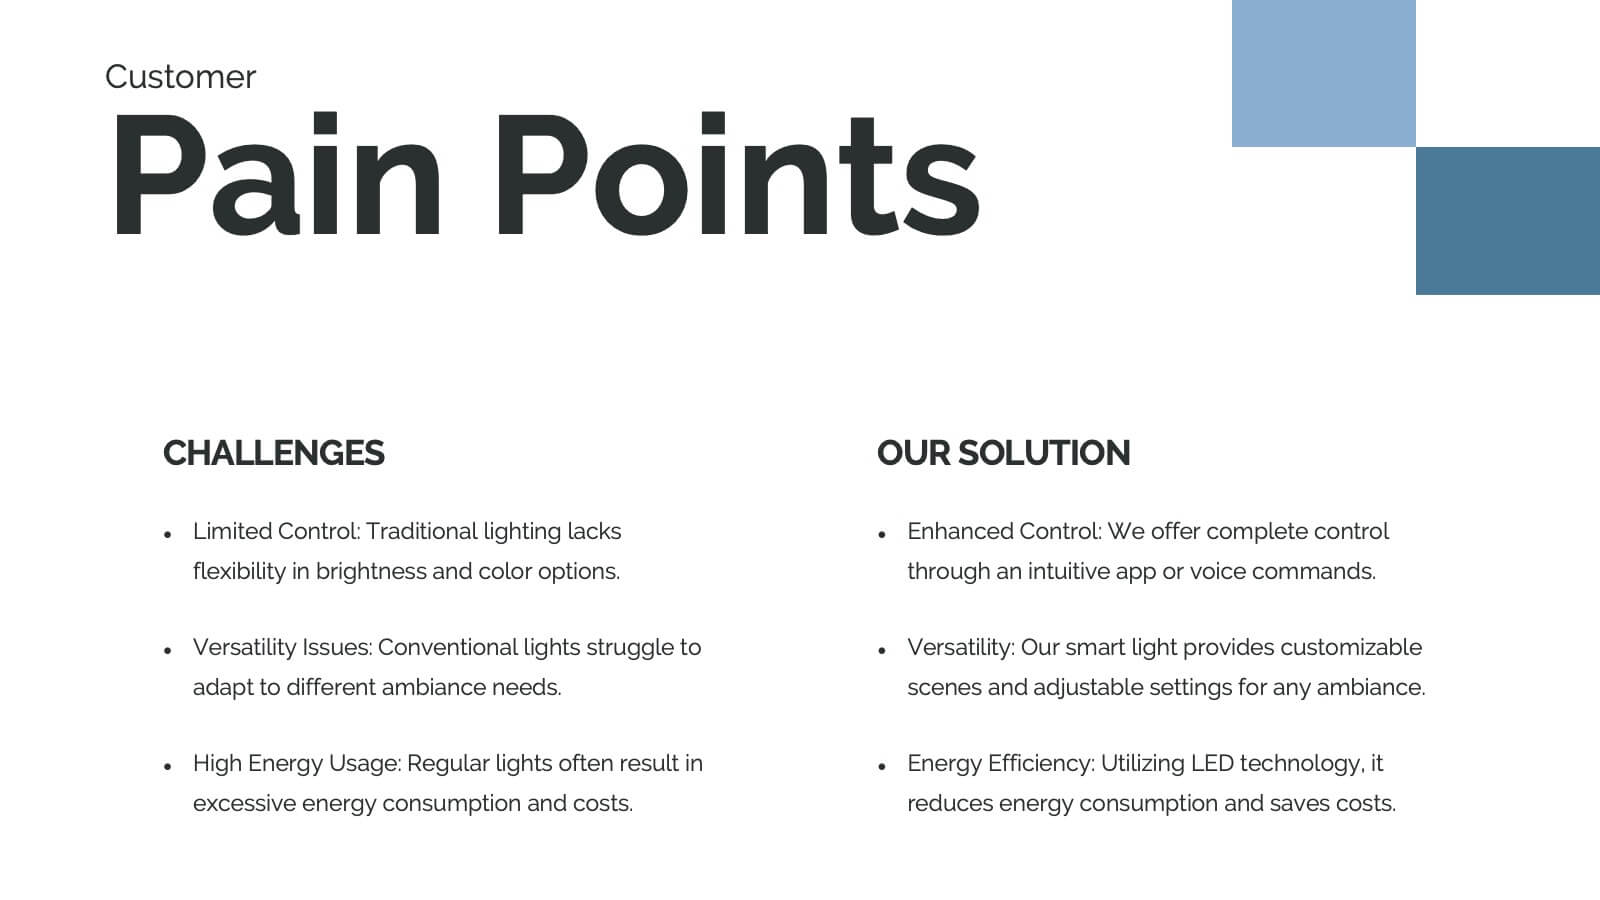
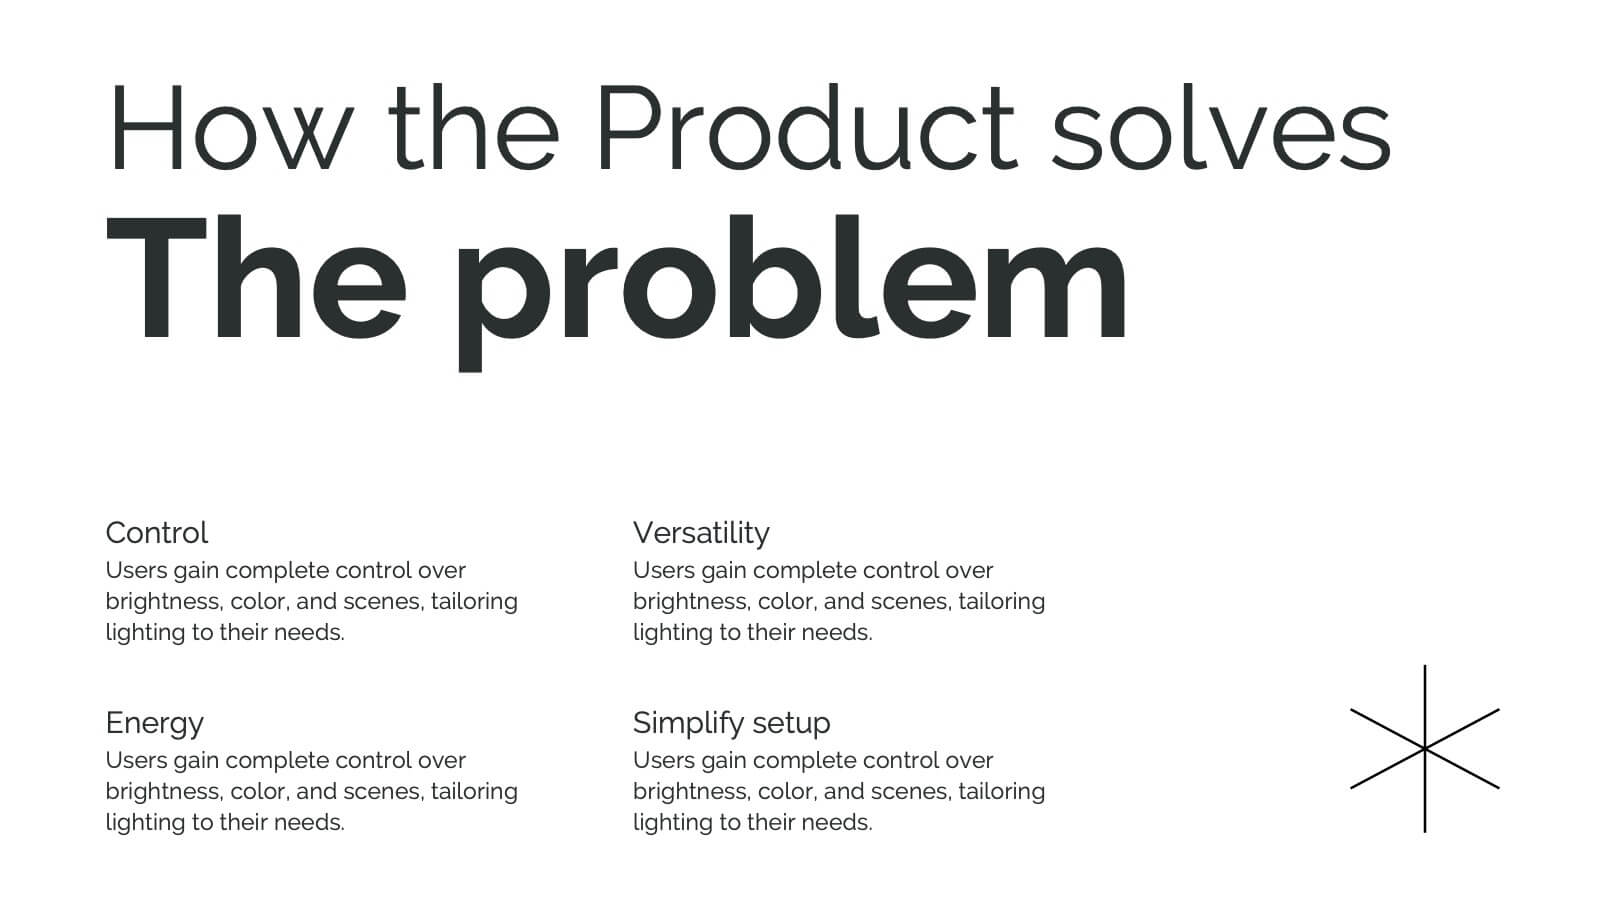
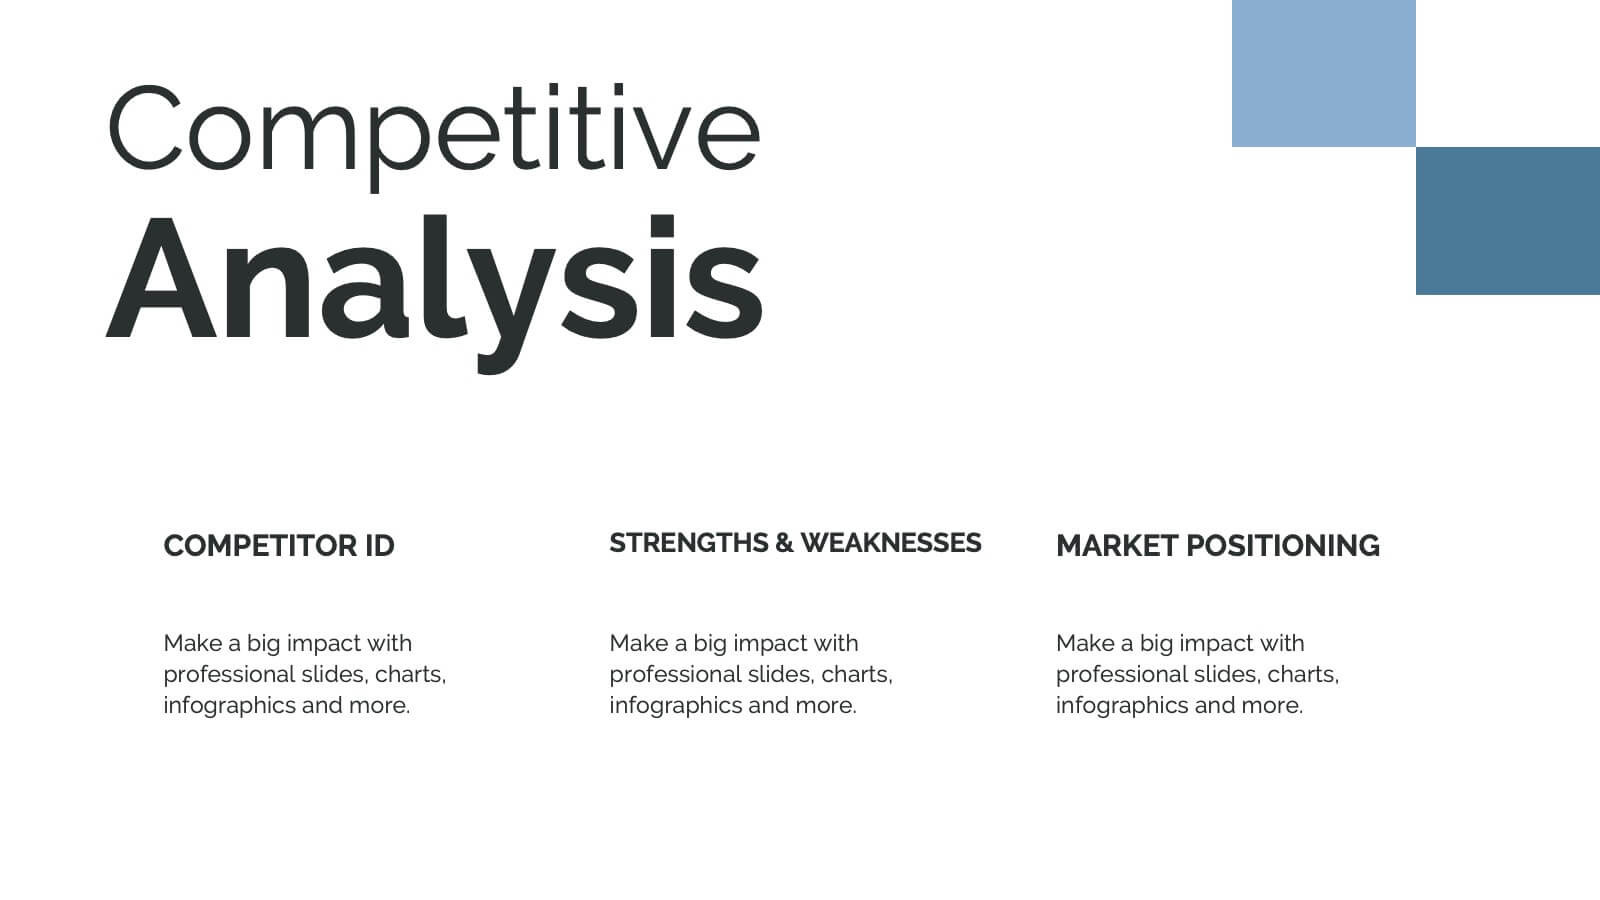
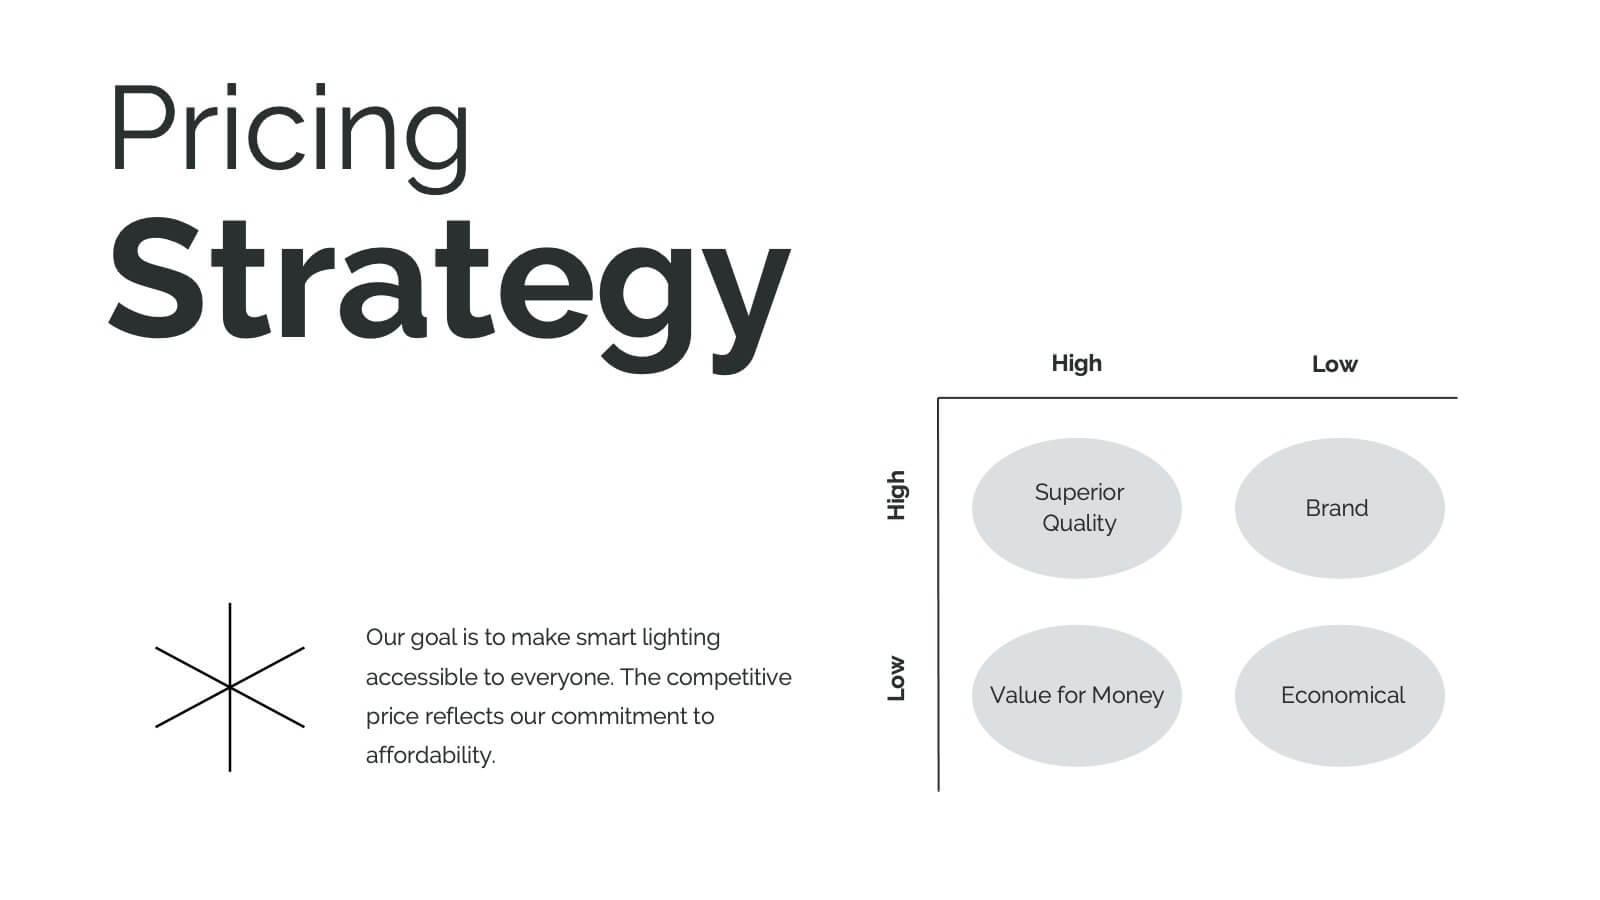
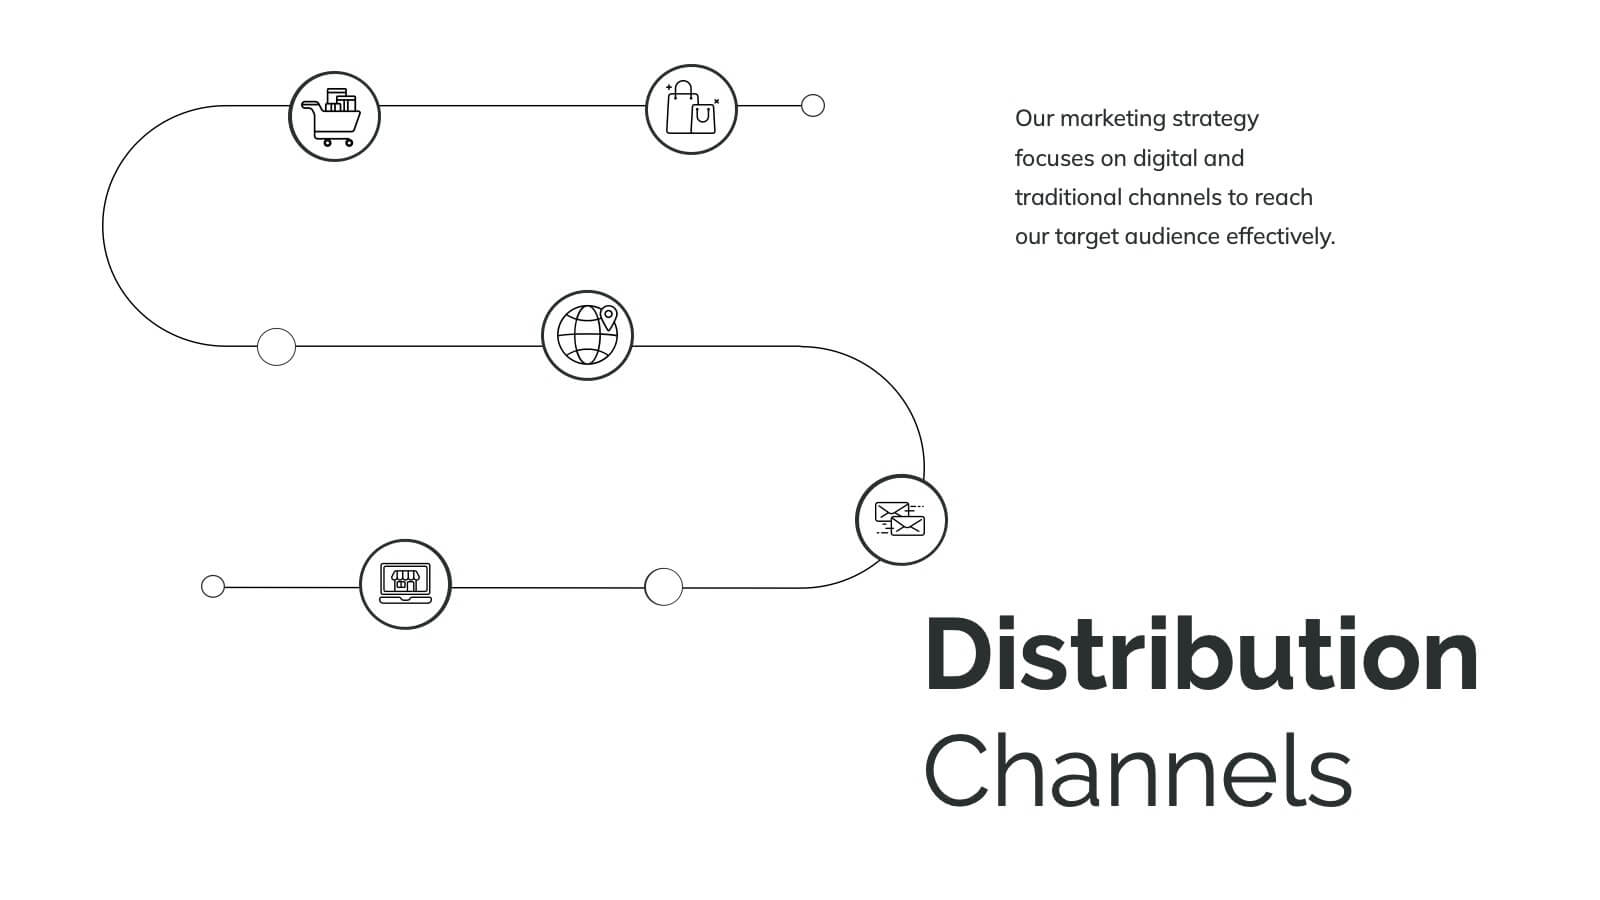
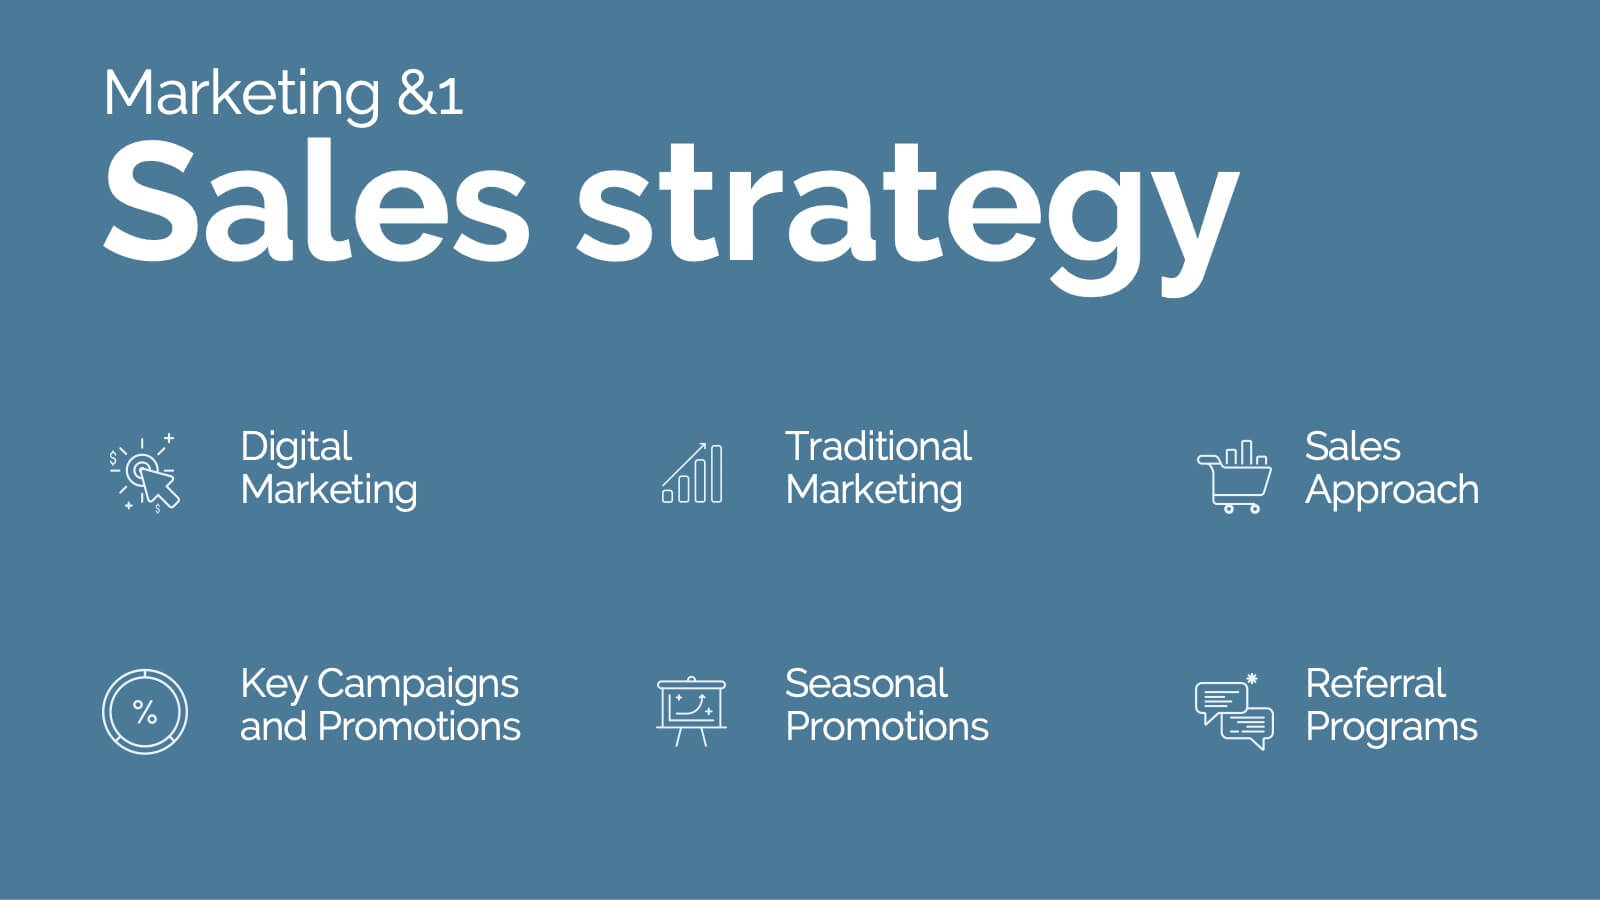
Hydra Product Launch Presentation
Unveiling your latest product has never been easier or more captivating! This comprehensive presentation template covers every aspect of your product's journey—from launch to competitive analysis. Engage your audience with detailed slides on features, target analysis, and pricing strategy. Seamlessly compatible with PowerPoint, Keynote, and Google Slides for maximum flexibility and impact.


5 diapositivas
Business Goals Roadmap Presentation
Bring your long-term vision to life with a clear, structured roadmap that highlights each milestone in your business journey. This presentation helps you outline key objectives, track progress, and communicate strategic priorities with ease. Ideal for planning, strategy, and growth discussions. Fully compatible with PowerPoint, Keynote, and Google Slides.


4 diapositivas
Competitive Advantage Blue Ocean Strategy
Highlight strategic positioning with this Competitive Advantage Blue Ocean template. Designed with clear flow visuals and modern iconography, it’s perfect for showcasing unique value propositions, competitive edges, and market leadership strategies. Easy to edit in PowerPoint, Keynote, and Google Slides for seamless customization.


26 diapositivas
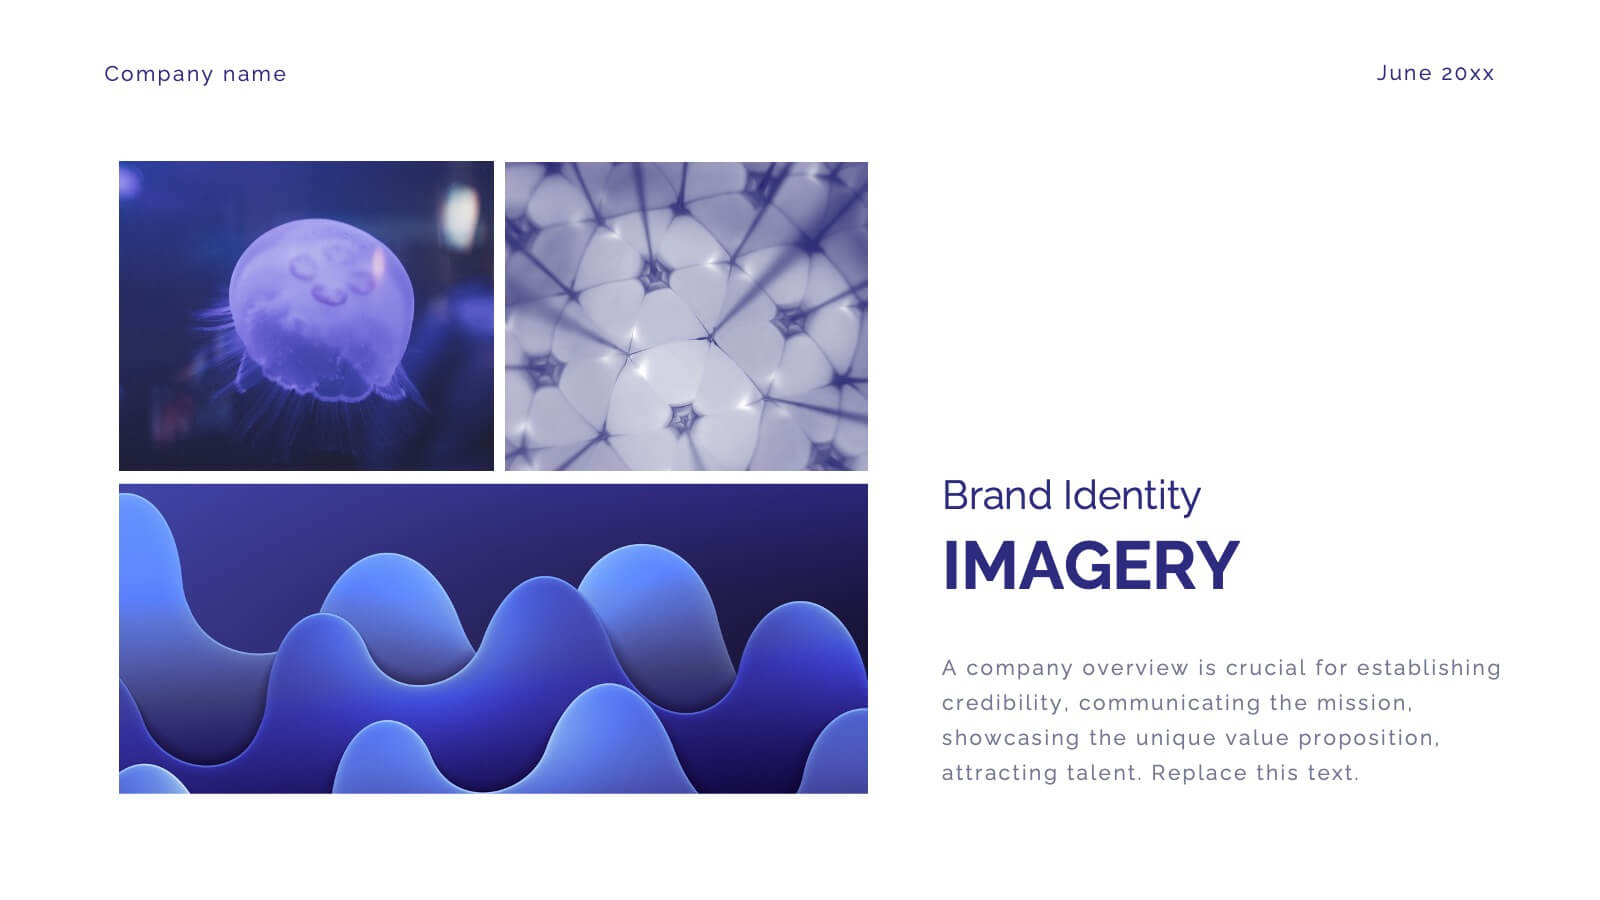
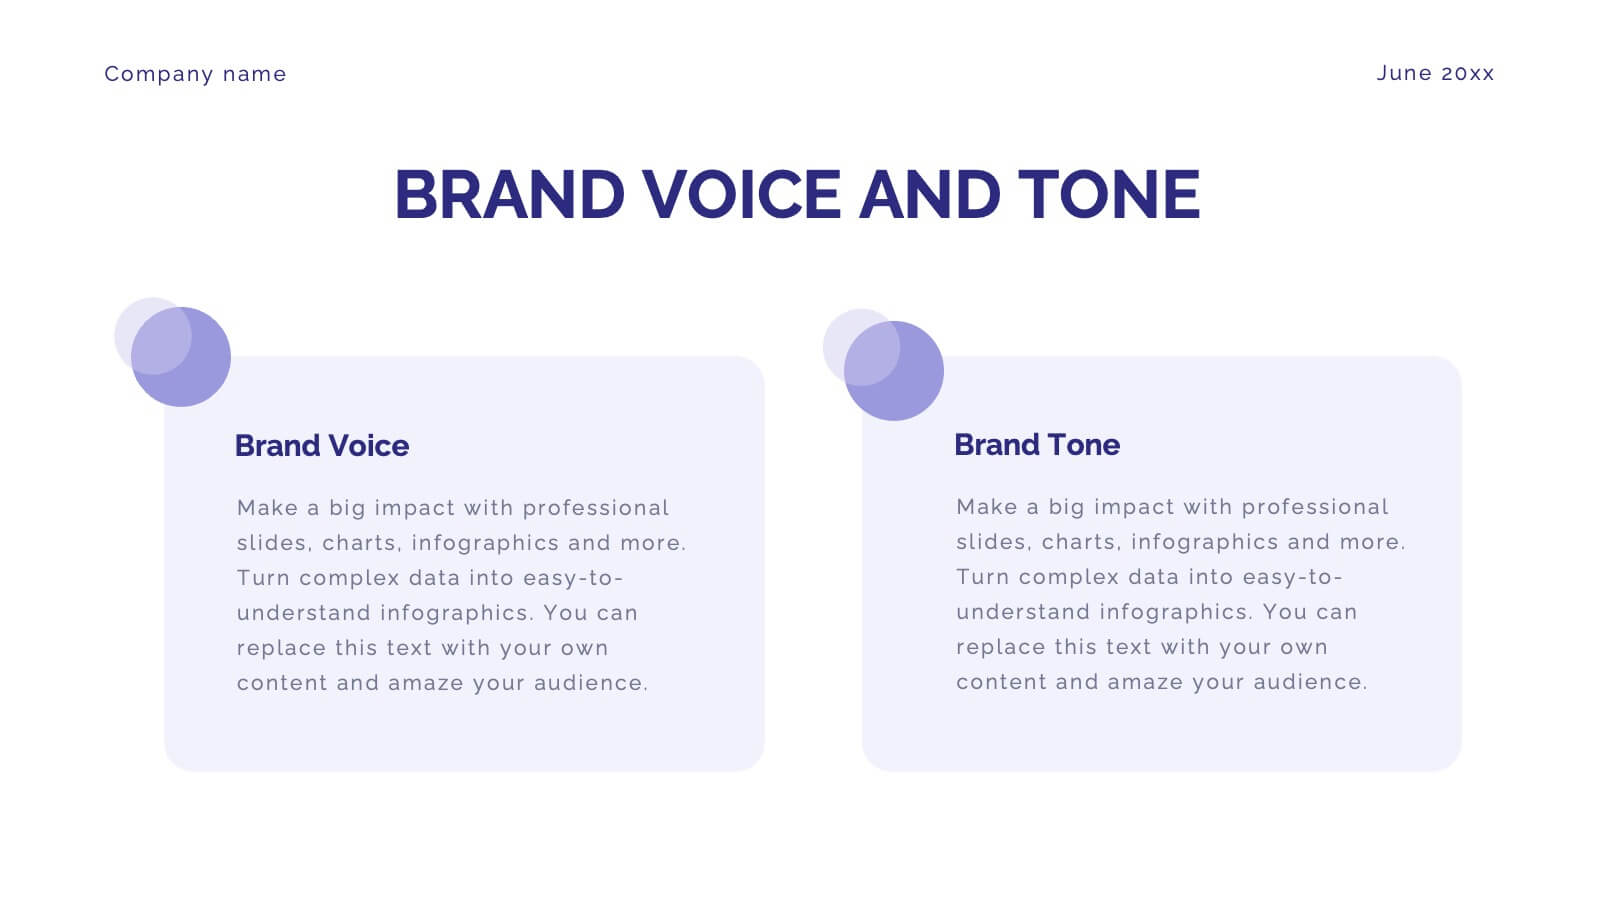
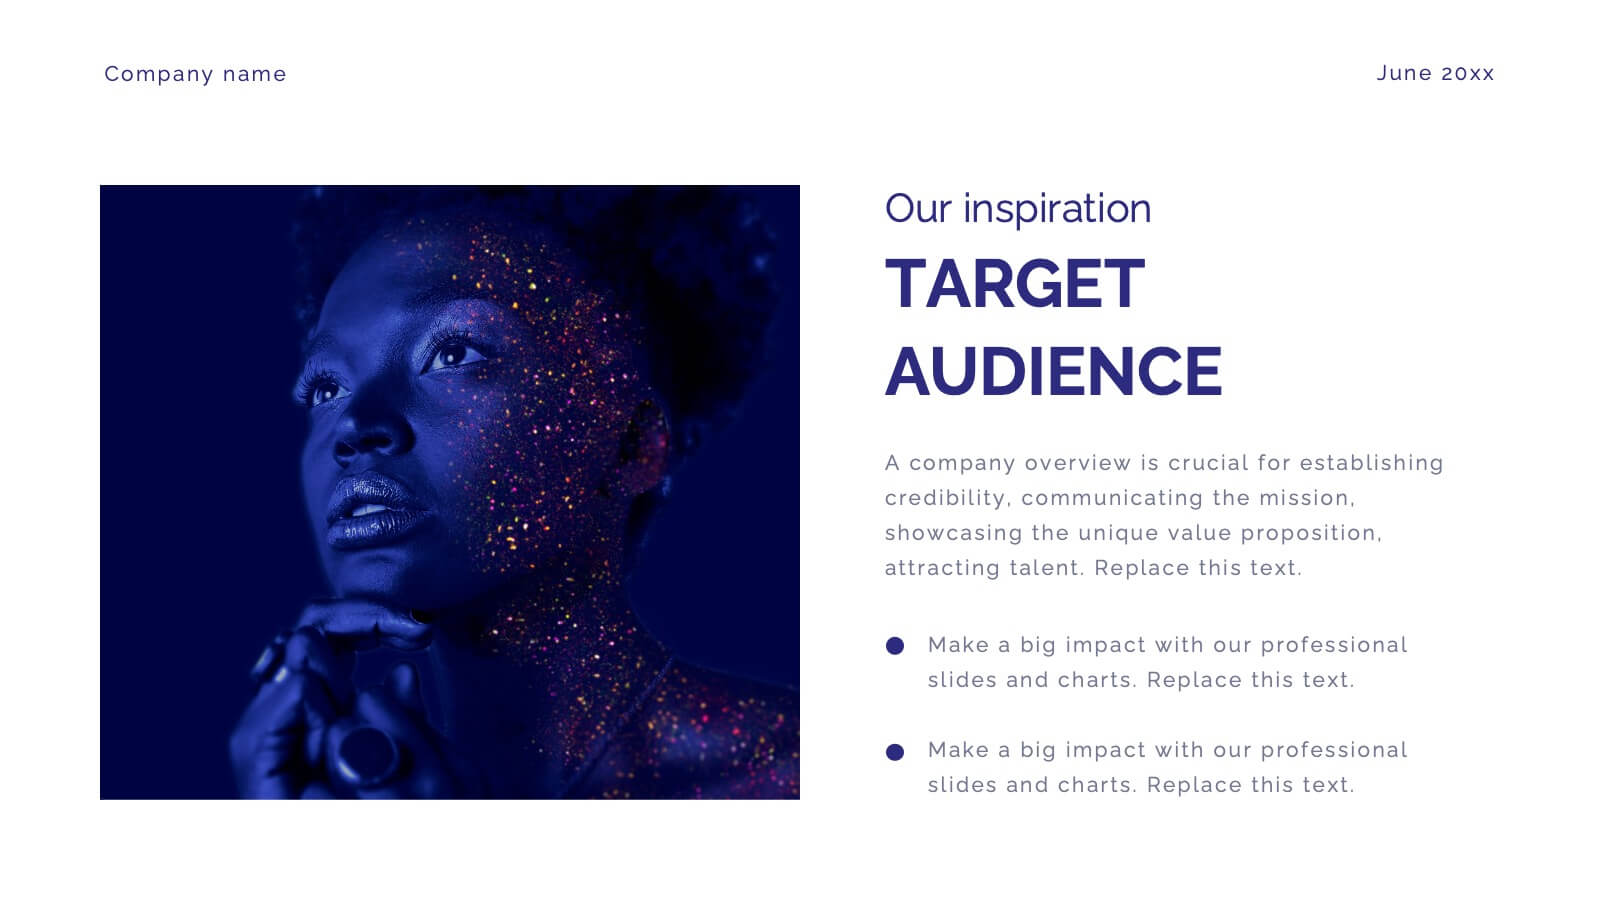
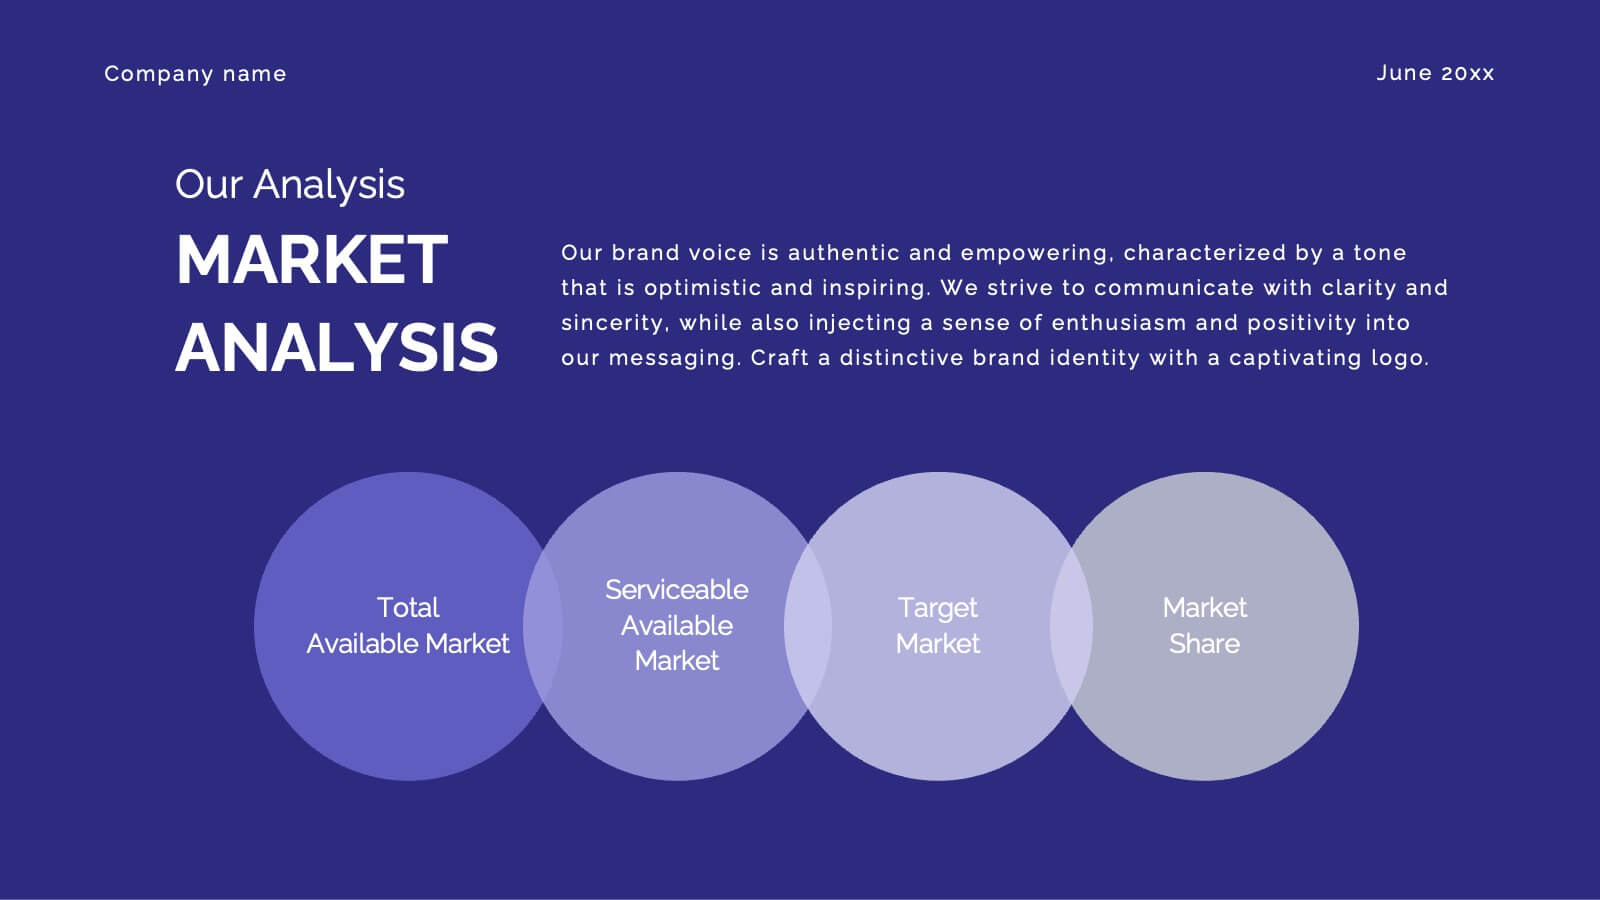
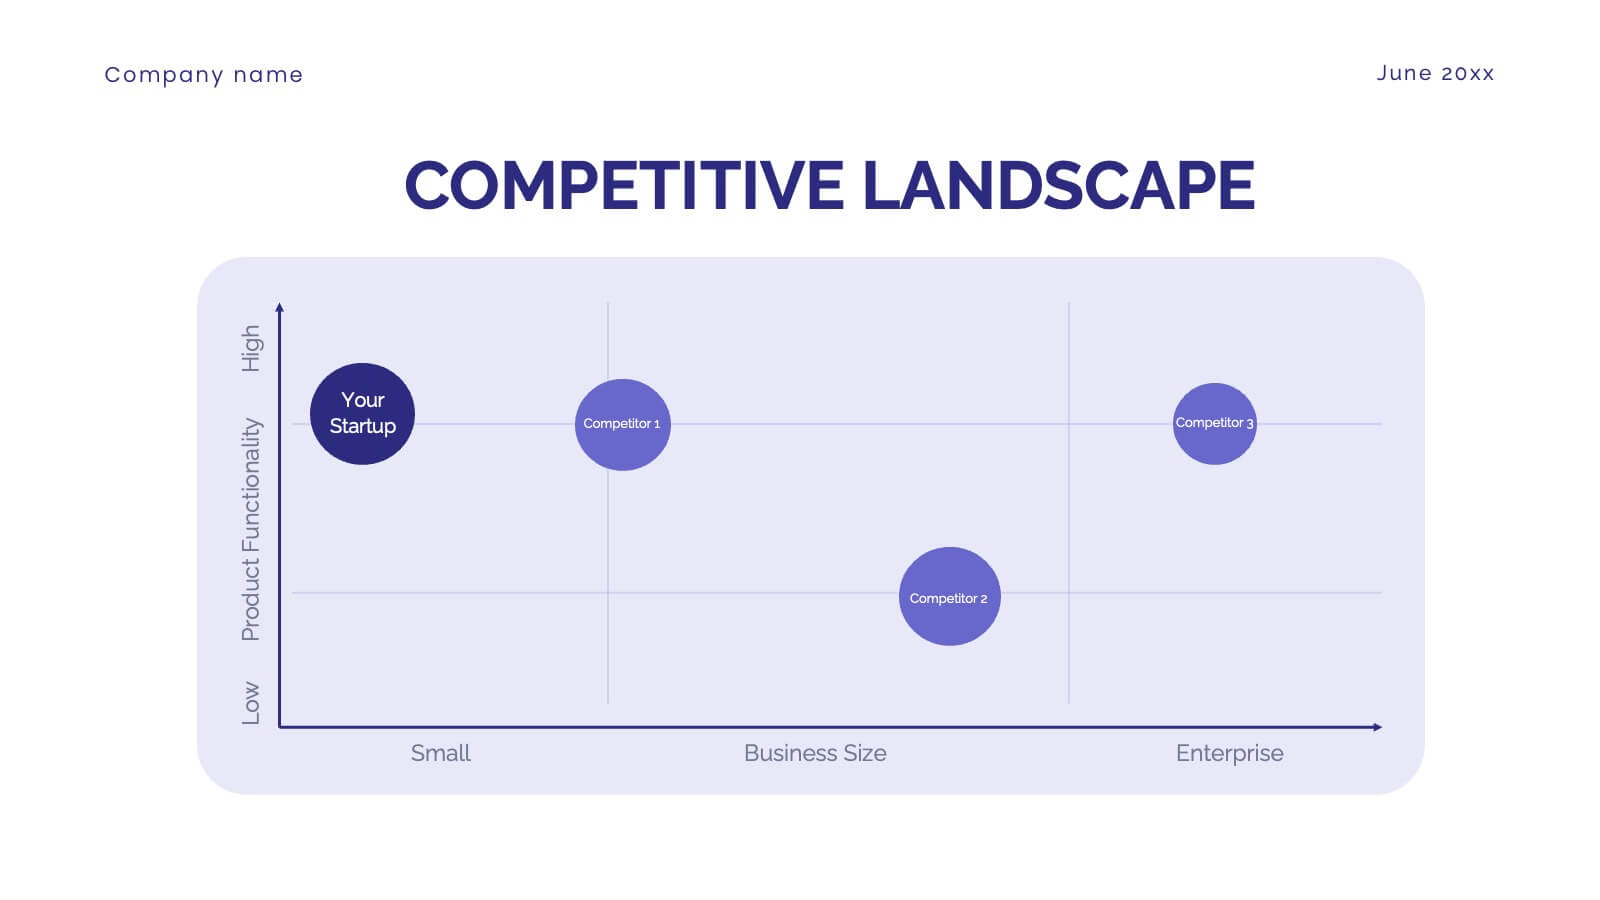
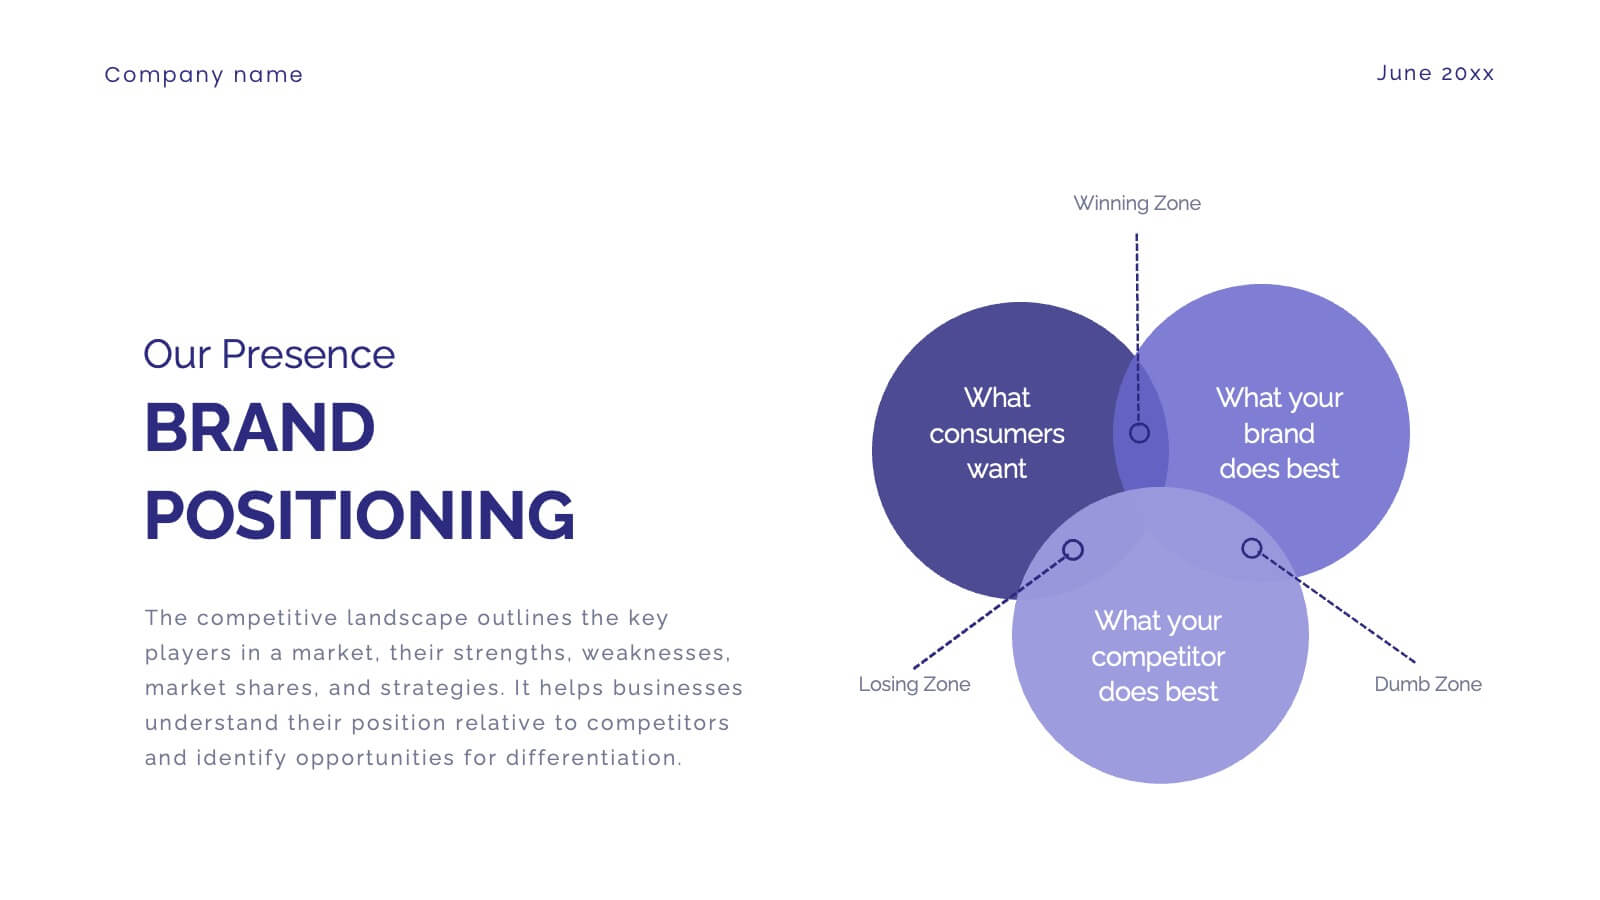
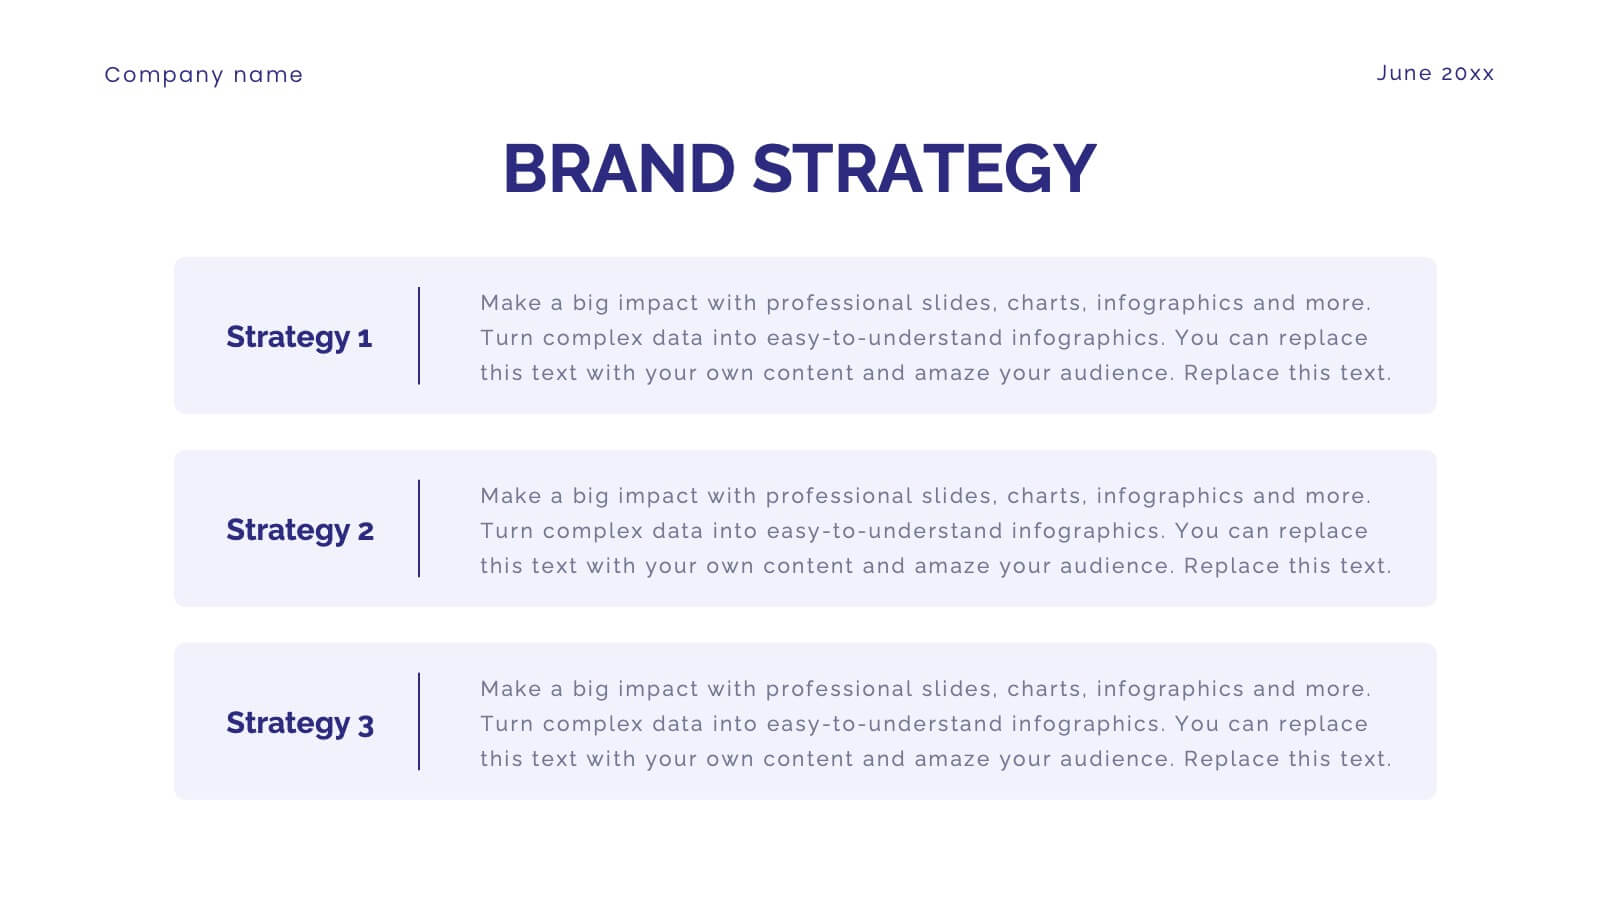
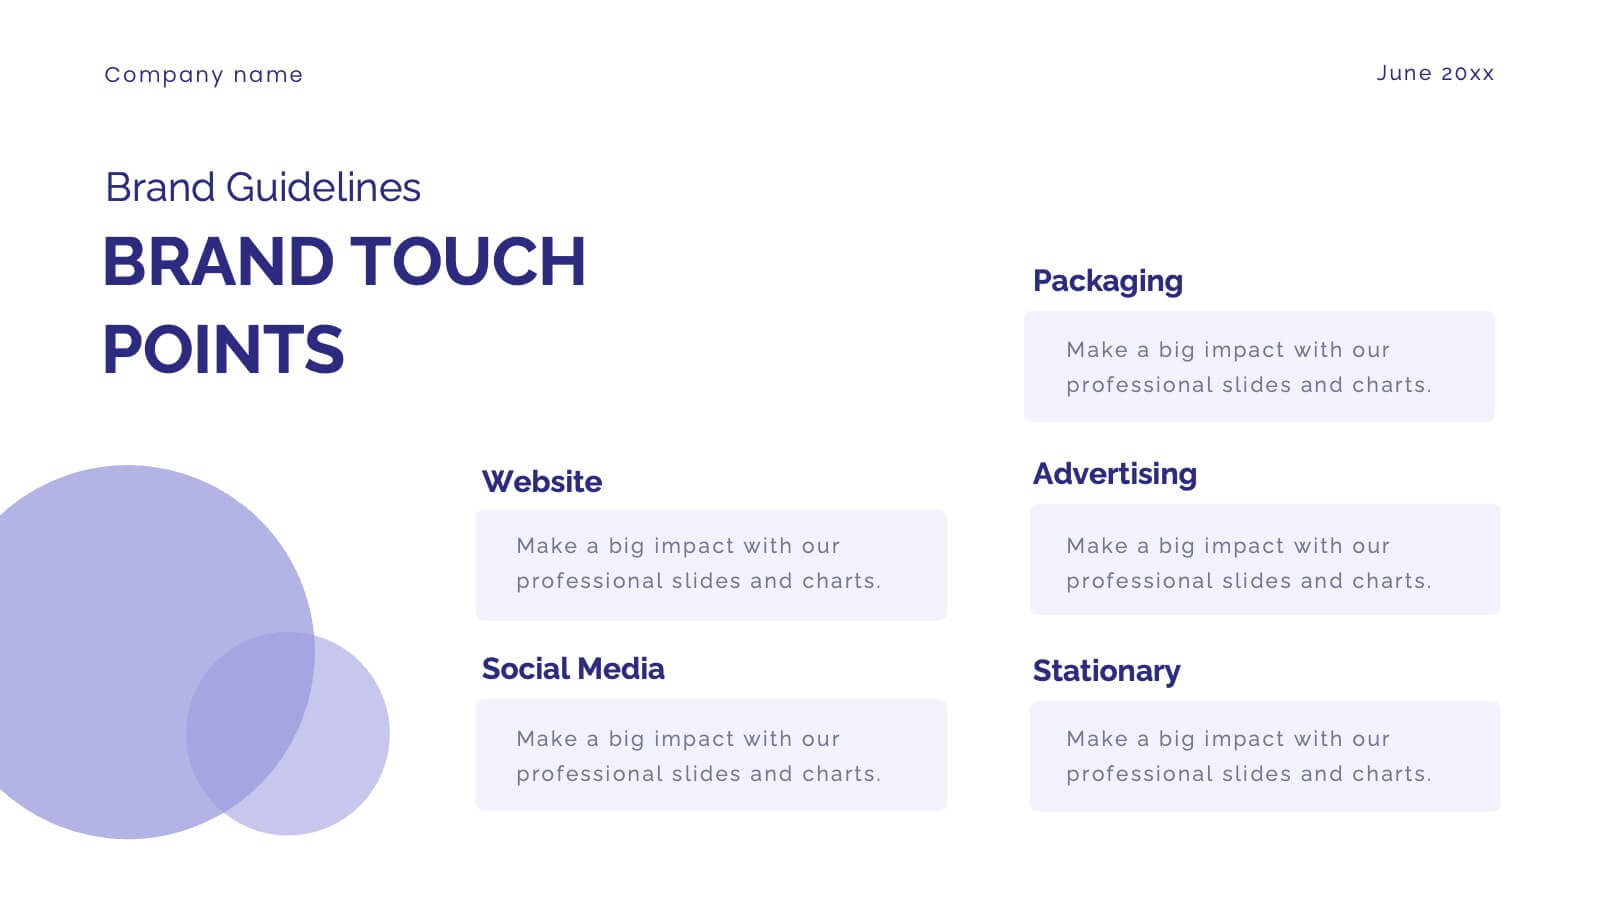
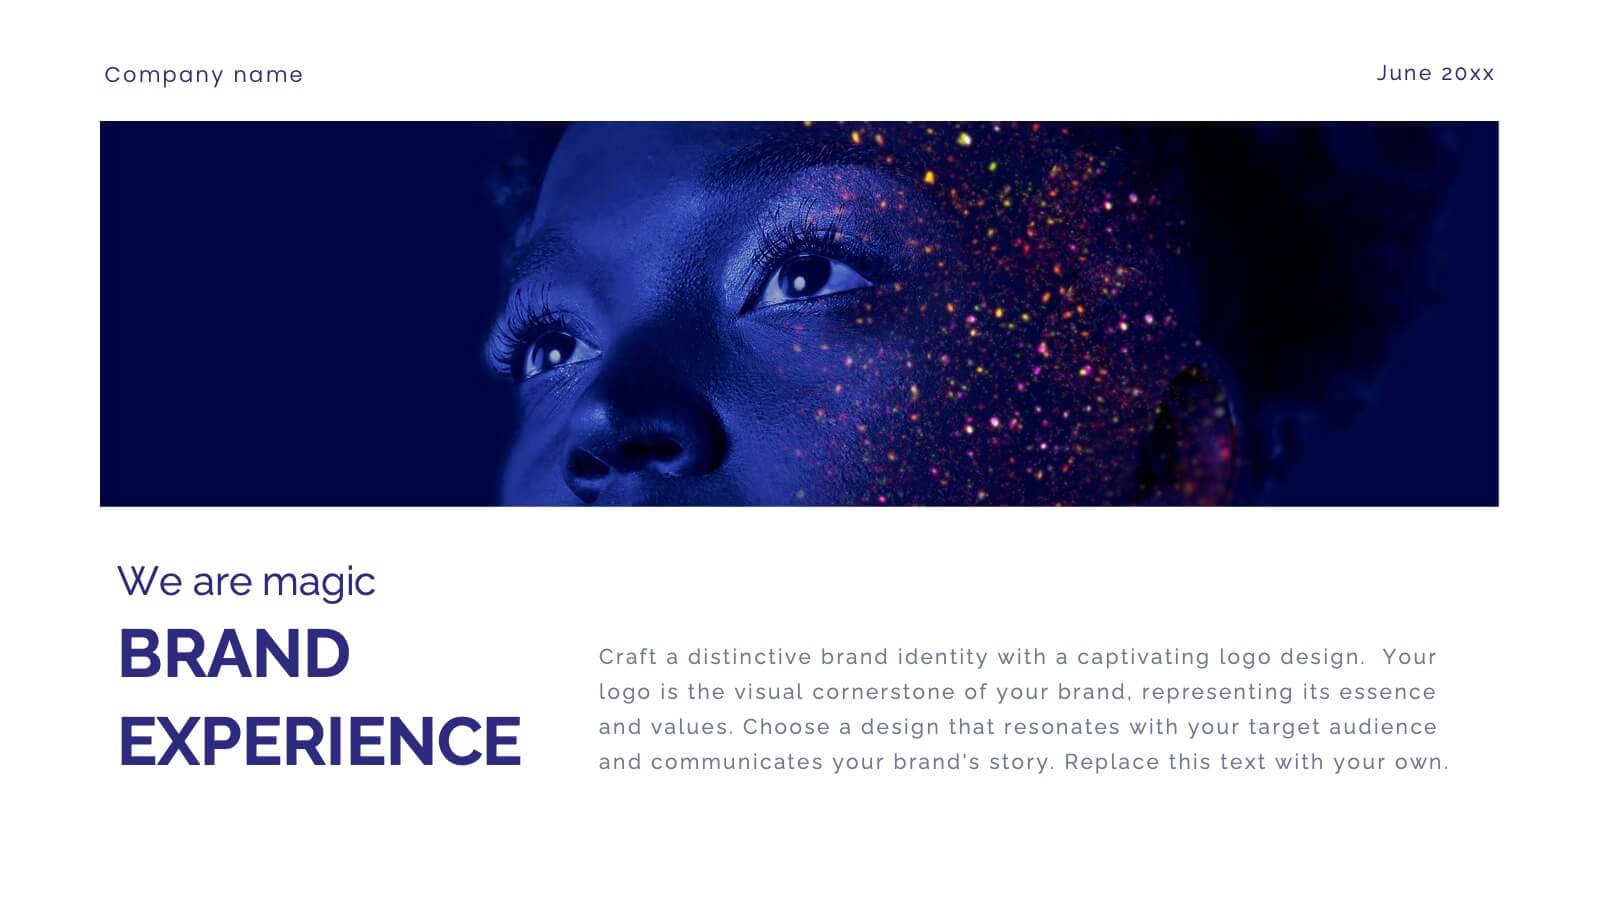
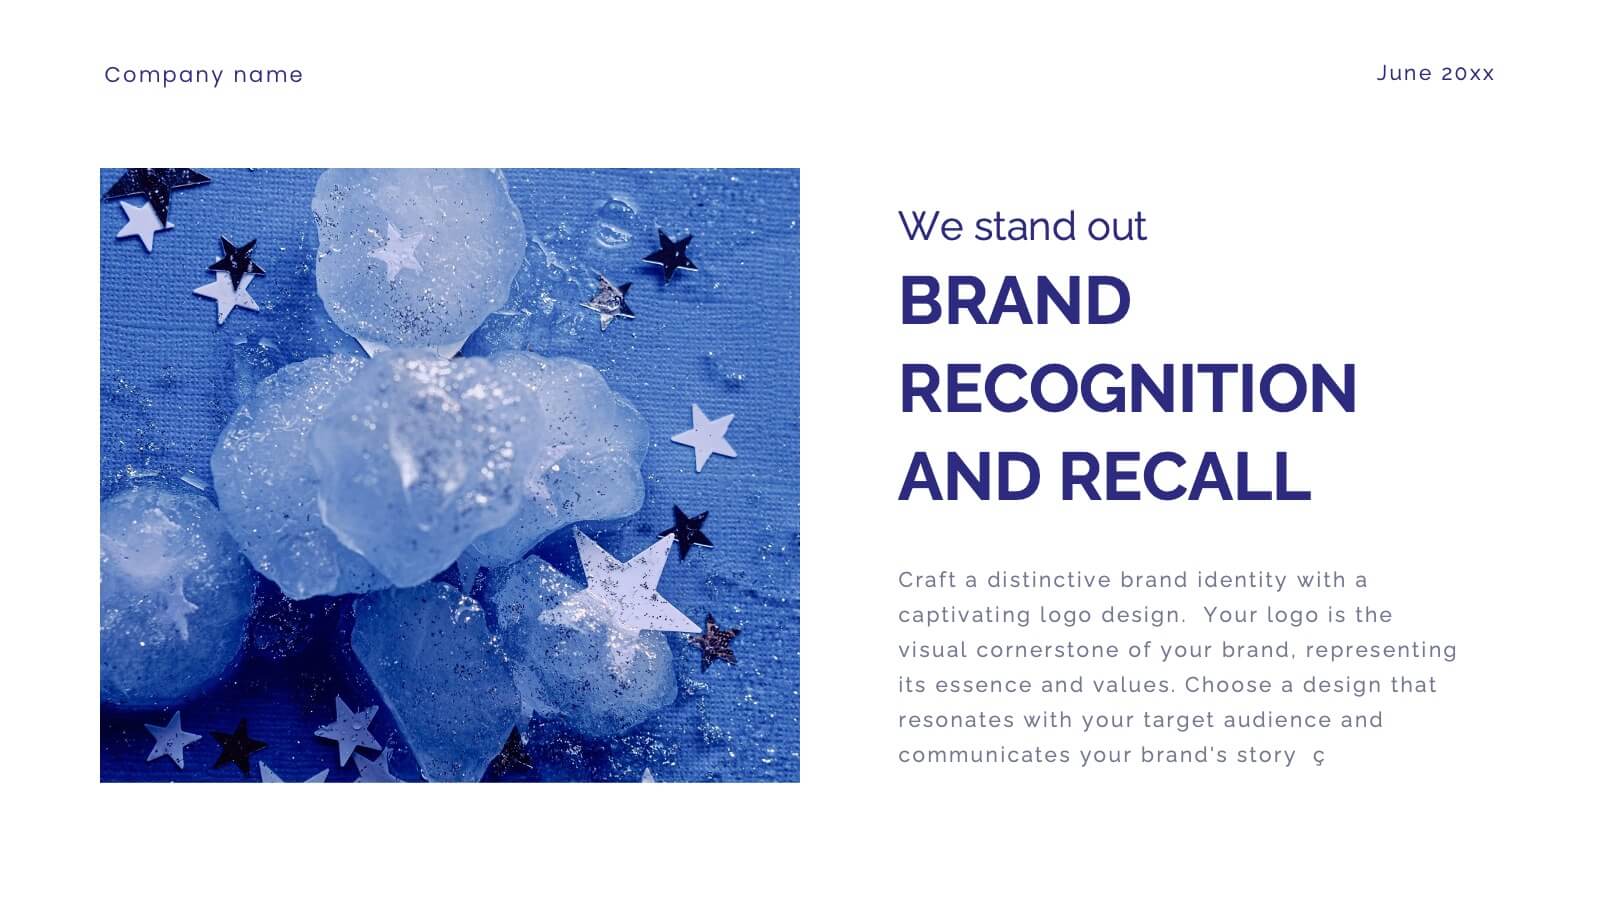
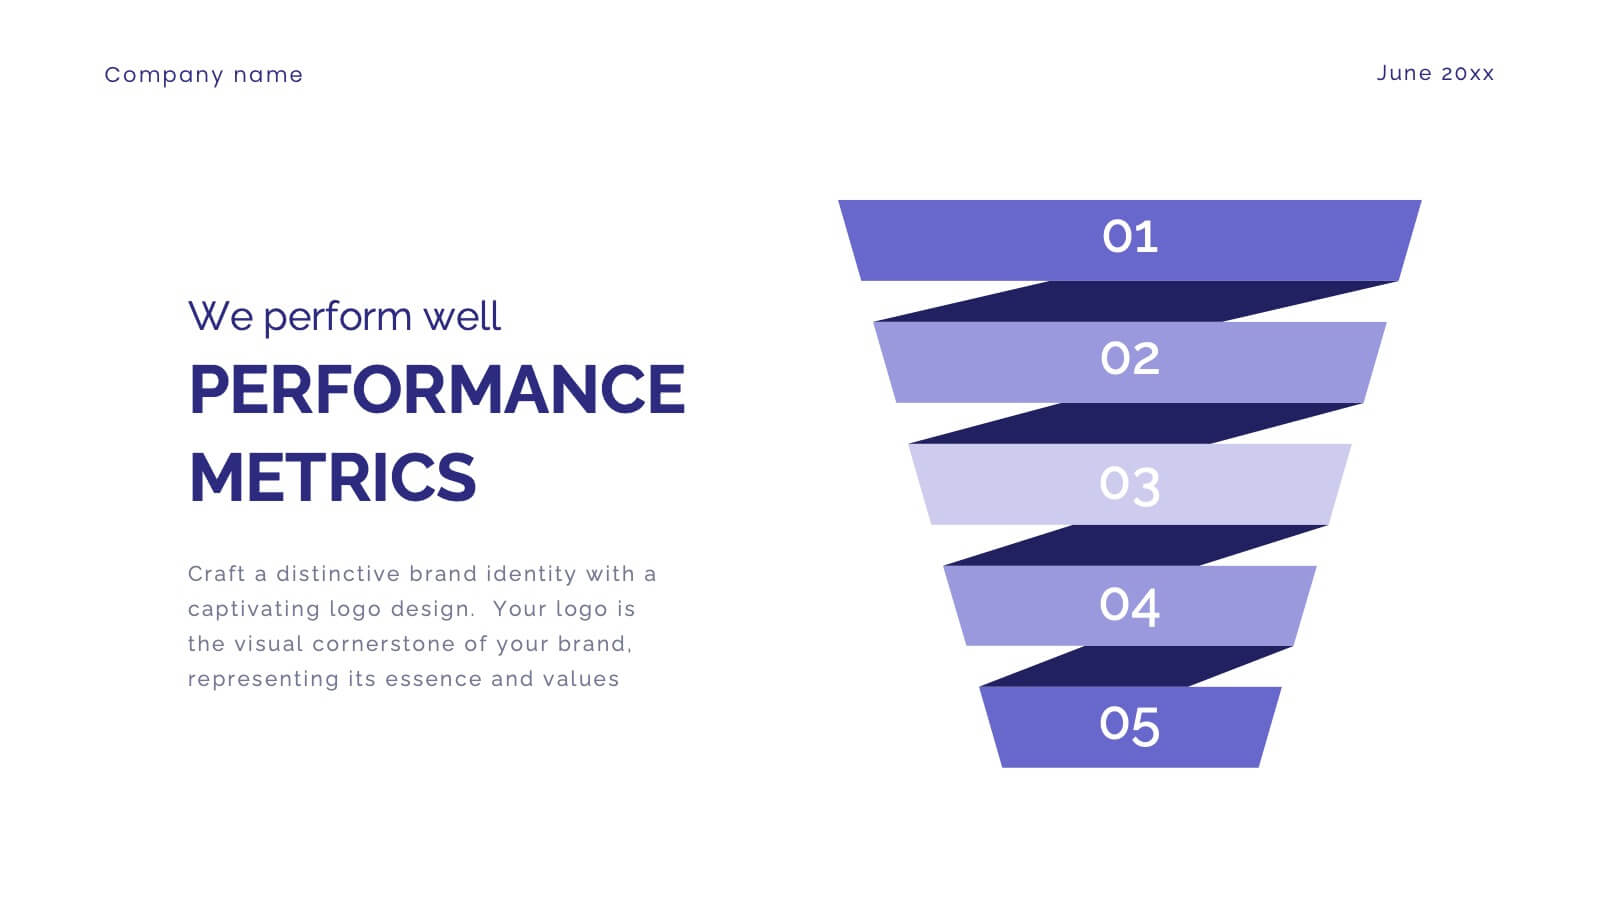
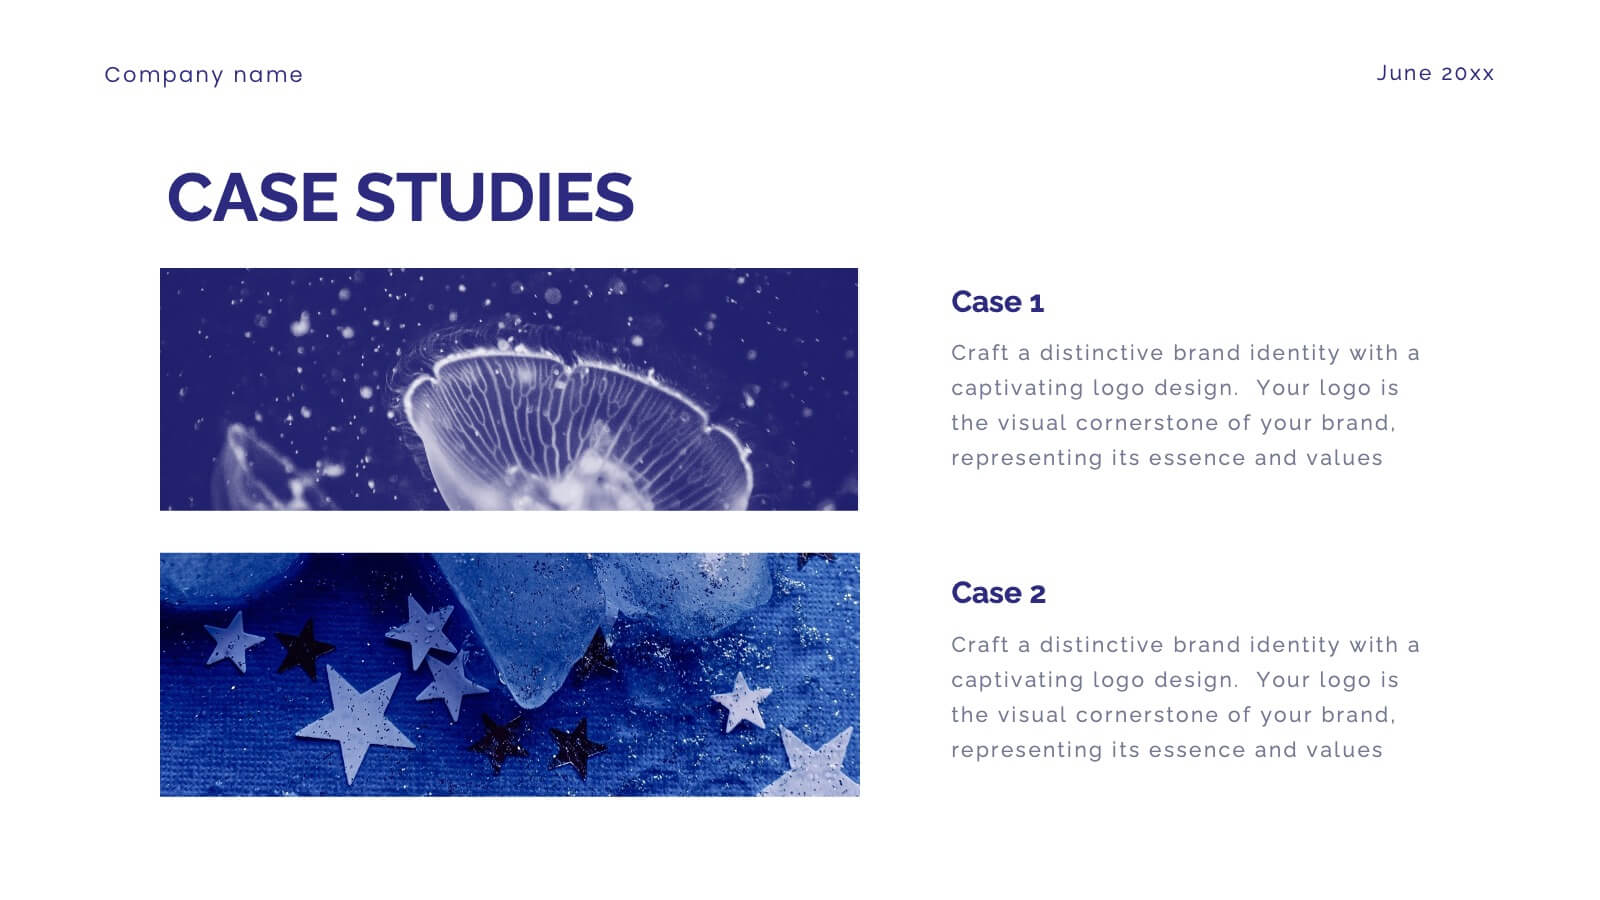
Glimmer Brand Development Pitch Deck Presentation
Elevate your brand with this comprehensive rebranding presentation template! Perfect for detailing your logo, color scheme, and market analysis, it includes slides for brand positioning, competitive landscape, and performance metrics. Engage your audience with clear visuals and structured content. Compatible with PowerPoint, Keynote, and Google Slides for seamless presentations on any platform.


4 diapositivas
Key Stakeholder Identification Presentation
A great presentation starts with clarity, and this slide brings your message to life with bold, visual focus. Use it to break down key stakeholder groups, highlight their roles, and communicate insights with ease. Clean lines and intuitive icons keep everything clear and engaging. Fully compatible with PowerPoint, Keynote, and Google Slides.


7 diapositivas
Growth Mindset Infographic Presentation
A Growth Infographic is a visual representation of data that displays the growth of a particular business, industry, or market over time. It can be used to illustrate growth in areas such as revenue, profits, customer base, or market share. This growth template includes a timeline and graphs that shows the change in data over time, presented in a visually appealing way using icons, symbols, and color-coding. Use this infographic to include additional information such as industry trends, key drivers of growth, and future projections. Easily edit in Powerpoint, Keynote, and Google Slides.


7 diapositivas
Development Bubble Map Infographic
The Development Bubble Map Infographic you've provided appears to be a visual tool used to organize and represent information in a connected, yet clustered format. Bubble maps are commonly used to illustrate relationships and relative importance among concepts, making them useful for brainstorming, concept mapping, and planning. Each bubble in the map may contain a single concept, idea, or data point, with the size of the bubble often corresponding to the significance or amount of data related to the concept. The connecting lines indicate relationships or pathways between these ideas. Such an infographic could be used in various settings, such as educational environments for teaching, business meetings to discuss project development, or personal planning to visually map out ideas and their interconnections. It helps to visually break down complex systems or concepts into more manageable parts, enabling better understanding and analysis.


21 diapositivas
Frost Design Proposal Presentation
Present your design proposal with sophistication and clarity using this elegant template! Perfect for outlining your project summary, objectives, and proposed solutions, this template covers everything from scope of work and budget breakdowns to deliverables and team expertise. Fully compatible with PowerPoint, Keynote, and Google Slides, it's designed for seamless, professional presentations.


20 diapositivas
Blaze UX UI Design Pitch Deck Presentation
Craft a visually stunning pitch that brings your UX/UI design process to life with this sleek and modern presentation template. From concept development to final prototypes, each slide is designed to showcase research, wireframes, typography, and more with a seamless, professional aesthetic. Fully compatible with PowerPoint, Keynote, and Google Slides.


7 diapositivas
Digital Marketing Infographics Presentation Template
Digital marketing is essential for your business and brand awareness. From website design to social media advertising, learn about all the ways digital marketing can help grow your company with this template. Digital marketing can be a powerful and effective way to promote your business.