


Características


¿Tienes alguna pregunta?
Recomendar


5 diapositivas
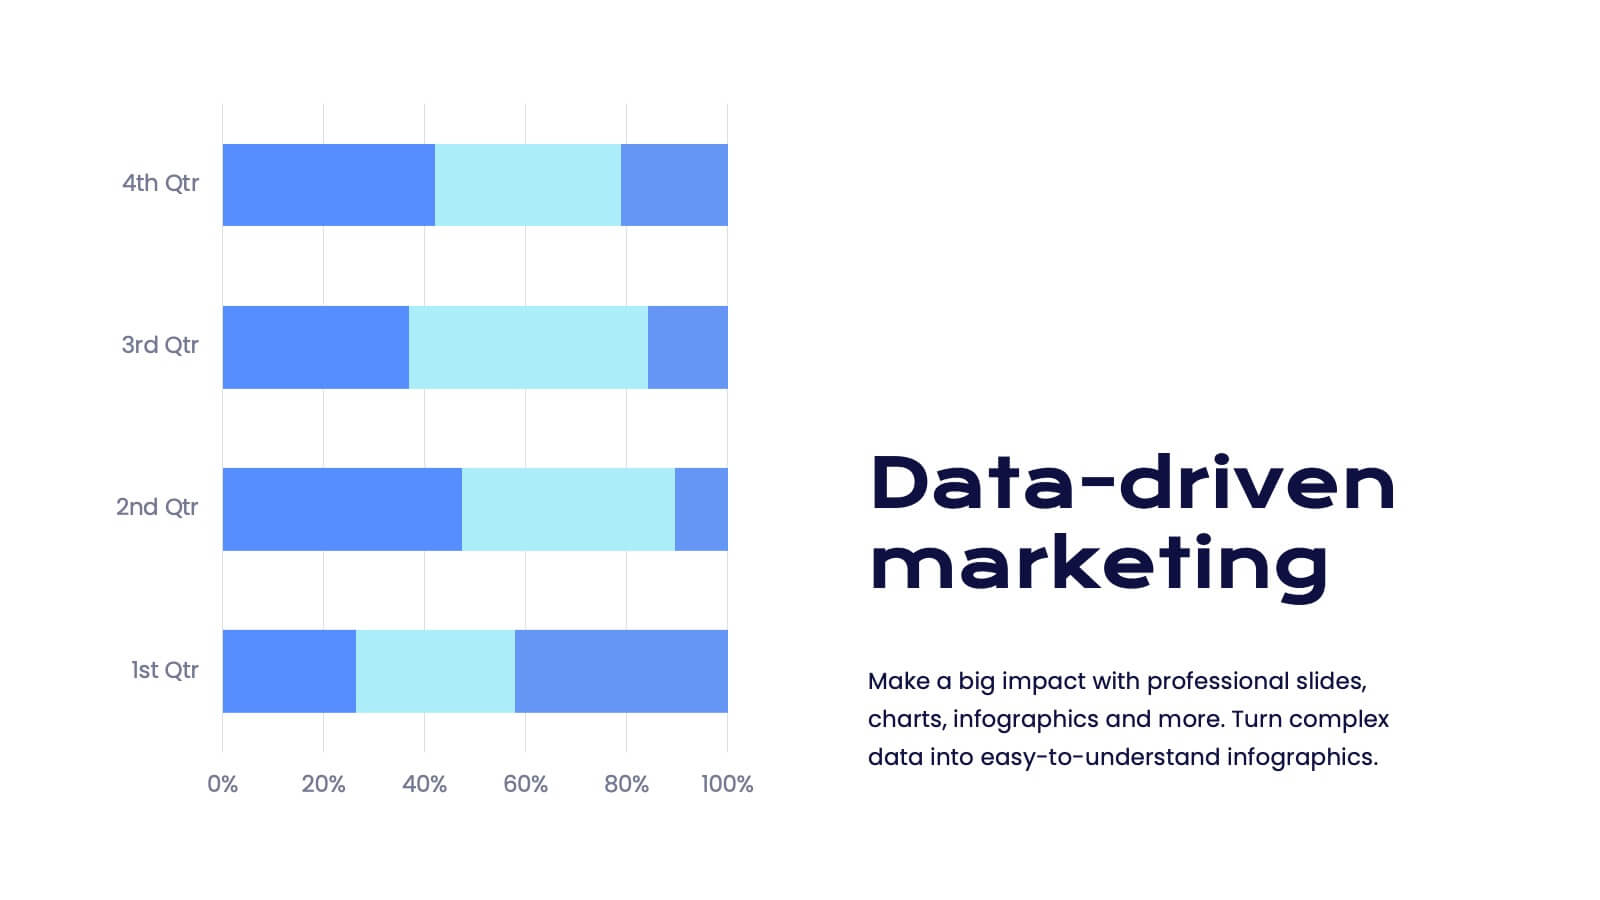
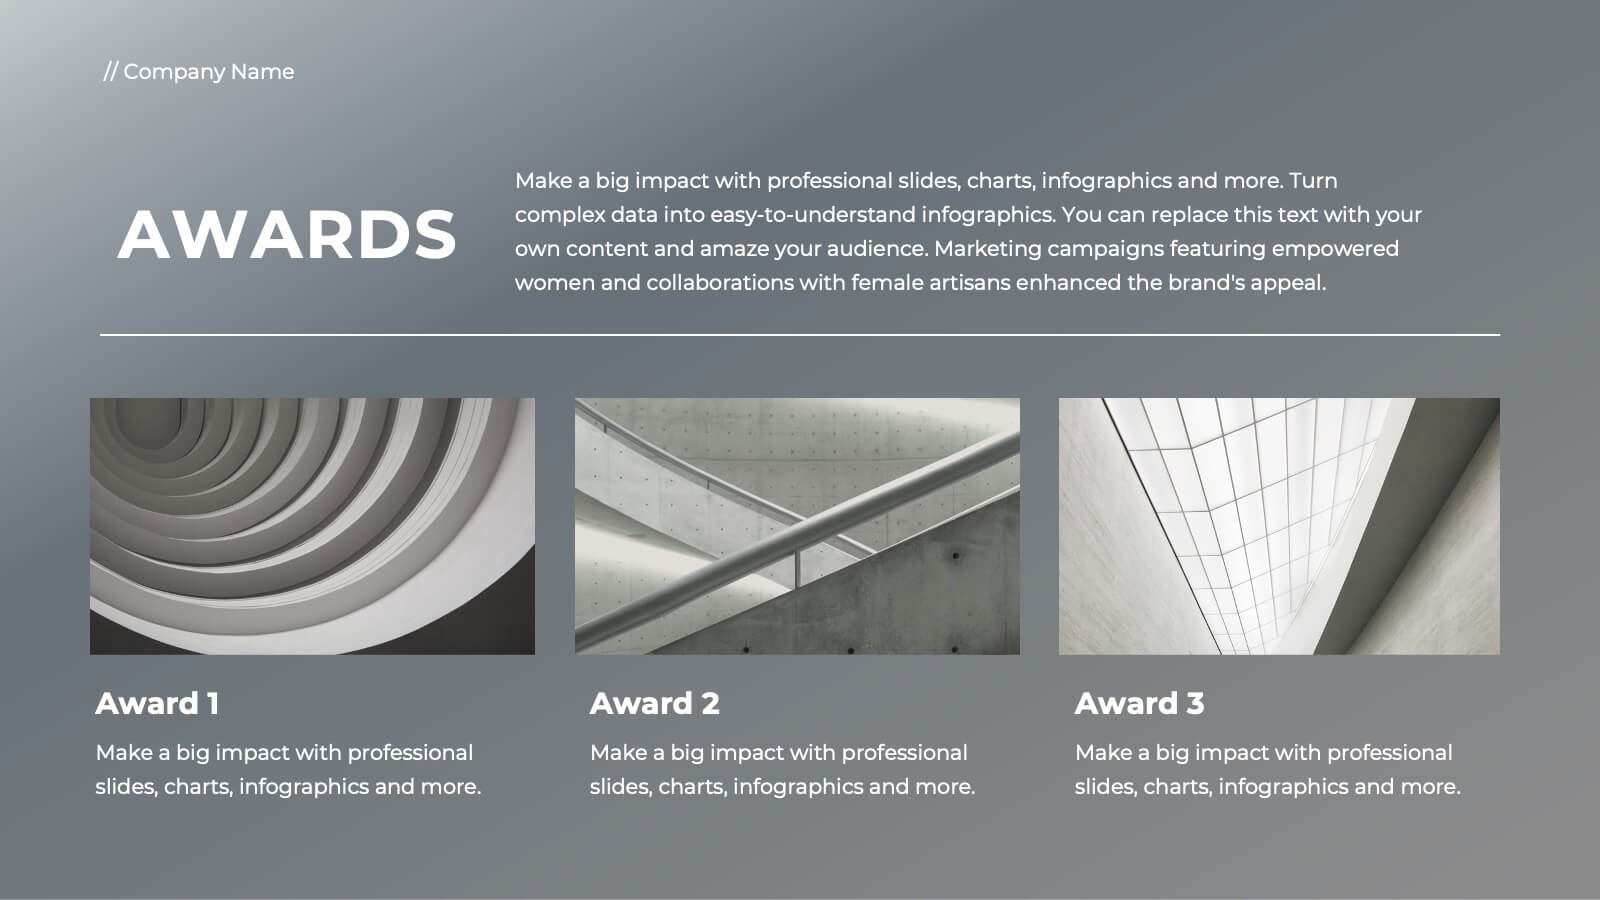
Annual Overview Report Template Presentation
Bring your yearly achievements to life with this sleek and structured layout designed for clarity and impact. Ideal for summarizing company performance, milestones, and future goals, it organizes data into easy-to-follow visuals. Fully editable and compatible with PowerPoint, Keynote, and Google Slides for a smooth presentation experience.


6 diapositivas
Risk Management in Insurance Presentation
Ensure Stability and Security with this Risk Management in Insurance Presentation template. Featuring a shield-themed layout, this slide effectively communicates key risk assessment strategies, mitigation plans, and compliance measures in the insurance sector. Ideal for insurance professionals, financial risk analysts, and compliance teams, this fully editable template is compatible with PowerPoint, Keynote, and Google Slides, allowing you to tailor the content to your specific risk management needs.


6 diapositivas
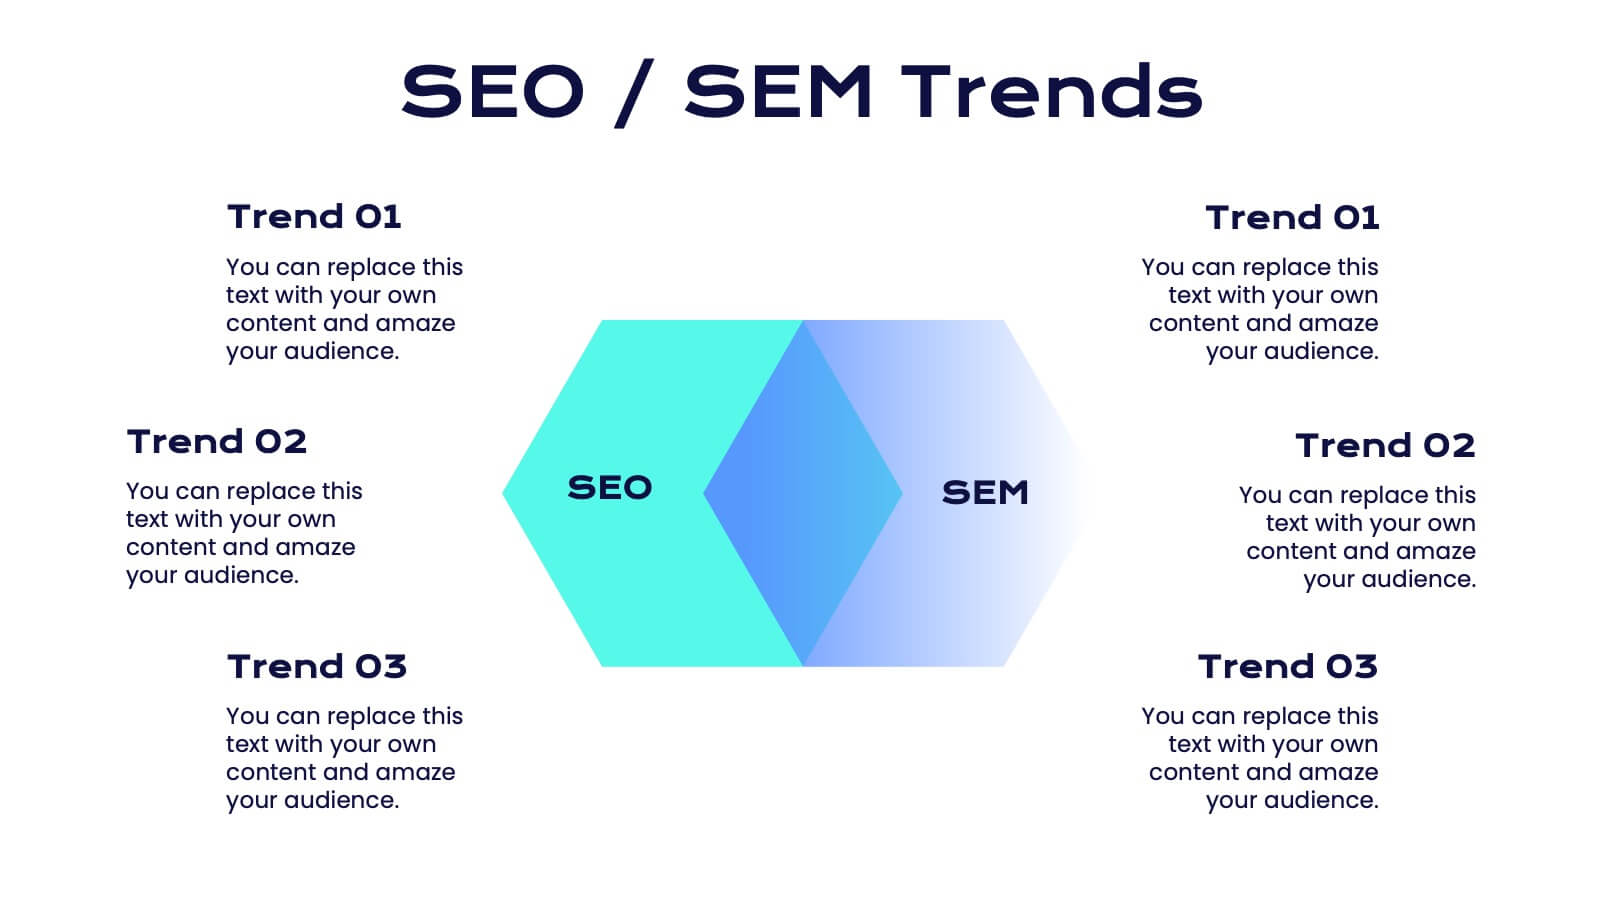
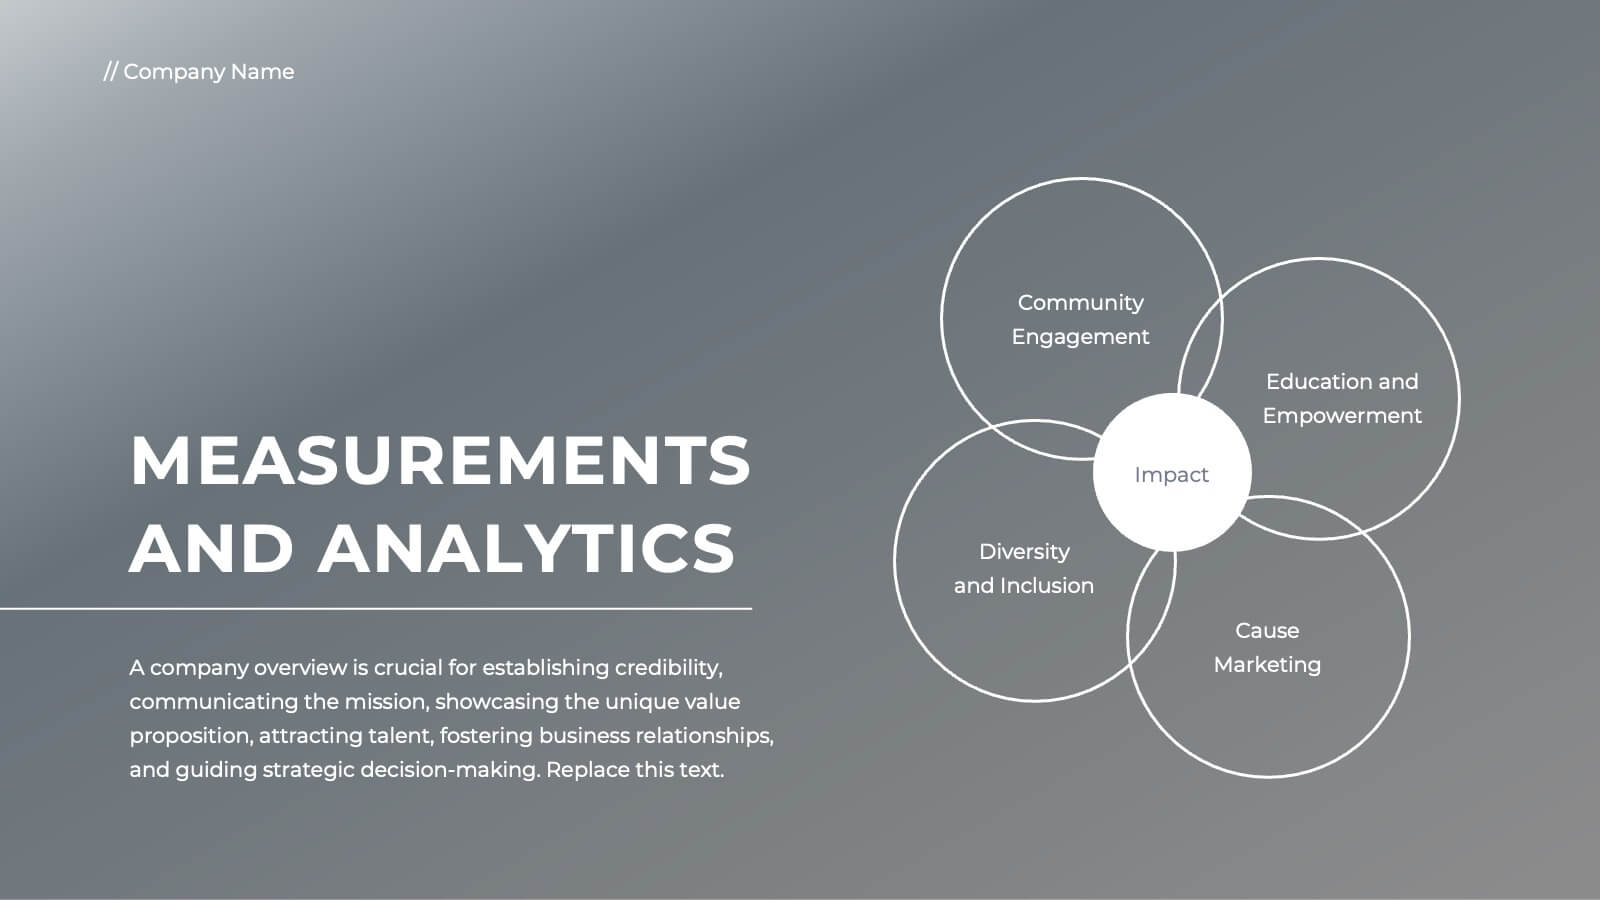
Three-Part Comparative Venn Layout Presentation
Showcase relationships, overlaps, and distinctions across three core elements with this elegant petal-style Venn layout. Perfect for comparing strategies, audiences, or product features. Each section includes customizable labels and icons. Fully editable in PowerPoint, Keynote, and Google Slides—ideal for business analysis, educational presentations, and marketing plans.


5 diapositivas
Cyber Security Statistics Infographics
Cybersecurity refers to the practice of protecting computer systems, networks, and digital information from unauthorized access, data breaches, theft, or damage. These infographic templates are designed to help educate and raise awareness about the importance of protecting digital assets and staying vigilant against cyber threats. They allow you to effectively communicate the significance of cybersecurity through cyber icons and compelling statistics. This is useful for organizations, educational institutions, and individuals who want to promote awareness and encourage proactive measures to protect against cyber threats.


6 diapositivas
Editable Weekly Calendar Slide Presentation
Bring your week into focus with a vibrant layout that turns daily planning into something you actually look forward to. This presentation helps you outline tasks, deadlines, and priorities in a clear, color-coded structure perfect for productivity. Fully editable and compatible with PowerPoint, Keynote, and Google Slides.


6 diapositivas
Prioritized Business List Format
Streamline your priorities with this clean and structured list layout, perfect for project steps, goals, or ranking business initiatives. Featuring five connected stages with icons, this editable design highlights key information in an easy-to-follow format. Fully customizable in PowerPoint, Keynote, and Google Slides.


4 diapositivas
Cybersecurity and Data Protection Presentation
Safeguard your digital assets with this Cybersecurity and Data Protection template. Designed for IT security professionals, compliance officers, and business leaders, this slide illustrates key security measures, risk mitigation strategies, and data protection protocols. Featuring a modern cloud security theme, it effectively conveys network safety, encryption, and compliance frameworks. Fully editable and compatible with PowerPoint, Keynote, and Google Slides for seamless customization.


6 diapositivas
Audience Segmentation by Region Presentation
Discover where your audience truly connects with a visually engaging layout that highlights market insights across regions. This presentation helps businesses identify, compare, and target audiences by location for smarter decision-making. Fully customizable and compatible with PowerPoint, Keynote, and Google Slides for seamless professional use and presentation flexibility.


5 diapositivas
Business Influence Stakeholder Analysis
Highlight influence and interest with this layered stakeholder analysis pyramid. Designed for strategic presentations, this layout categorizes engagement levels—Pull Communications, Push Communications, Consultant, Participation, and Partnership—across a 3D stacked model. Ideal for stakeholder mapping, influence management, and communication strategy planning. Fully editable in PowerPoint, Keynote, and Google Slides.


12 diapositivas
Risk Management and Security Compliance Presentation
Enhance your organizational resilience with the 'Risk Management and Security Compliance' presentation template. This intuitive design helps you communicate complex compliance standards and risk mitigation strategies effectively. Ideal for training sessions, board meetings, and compliance audits, ensuring your team stays informed and proactive in managing risks.


6 diapositivas
Social Challenges Infographics
Address social challenges effectively with our Social Challenge infographic template. This template is fully compatible with popular presentation software like PowerPoint, Keynote, and Google Slides, allowing you to easily customize it to illustrate and communicate various social challenges and their solutions. The Social Challenge infographic template offers a visually engaging platform to outline the nature of social issues, their impact on communities, and strategies for addressing them. Whether you're an advocate, nonprofit organization, community leader, or simply interested in making a positive impact, this template provides a user-friendly canvas to create informative presentations and educational materials. Raise awareness and promote solutions with this SEO-optimized Social Challenge infographic template, thoughtfully designed for clarity and ease of use. Customize it to showcase specific social challenges, statistics, success stories, and calls to action, ensuring that your audience gains a comprehensive understanding of the issue at hand. Start crafting your personalized infographic today to contribute to positive change in society.

20 diapositivas
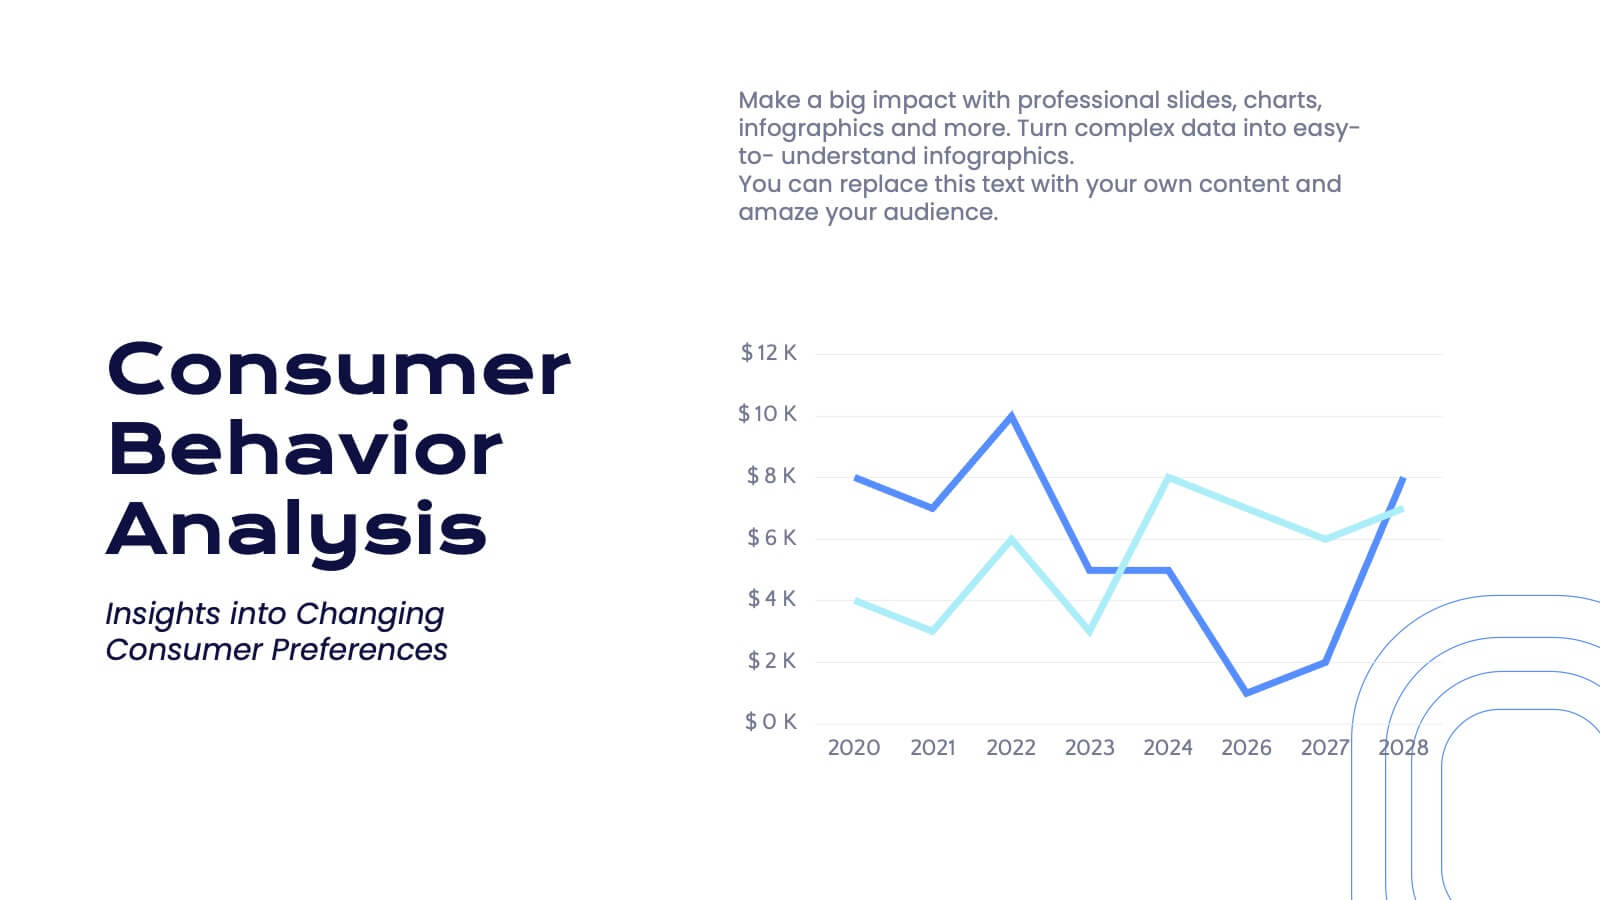
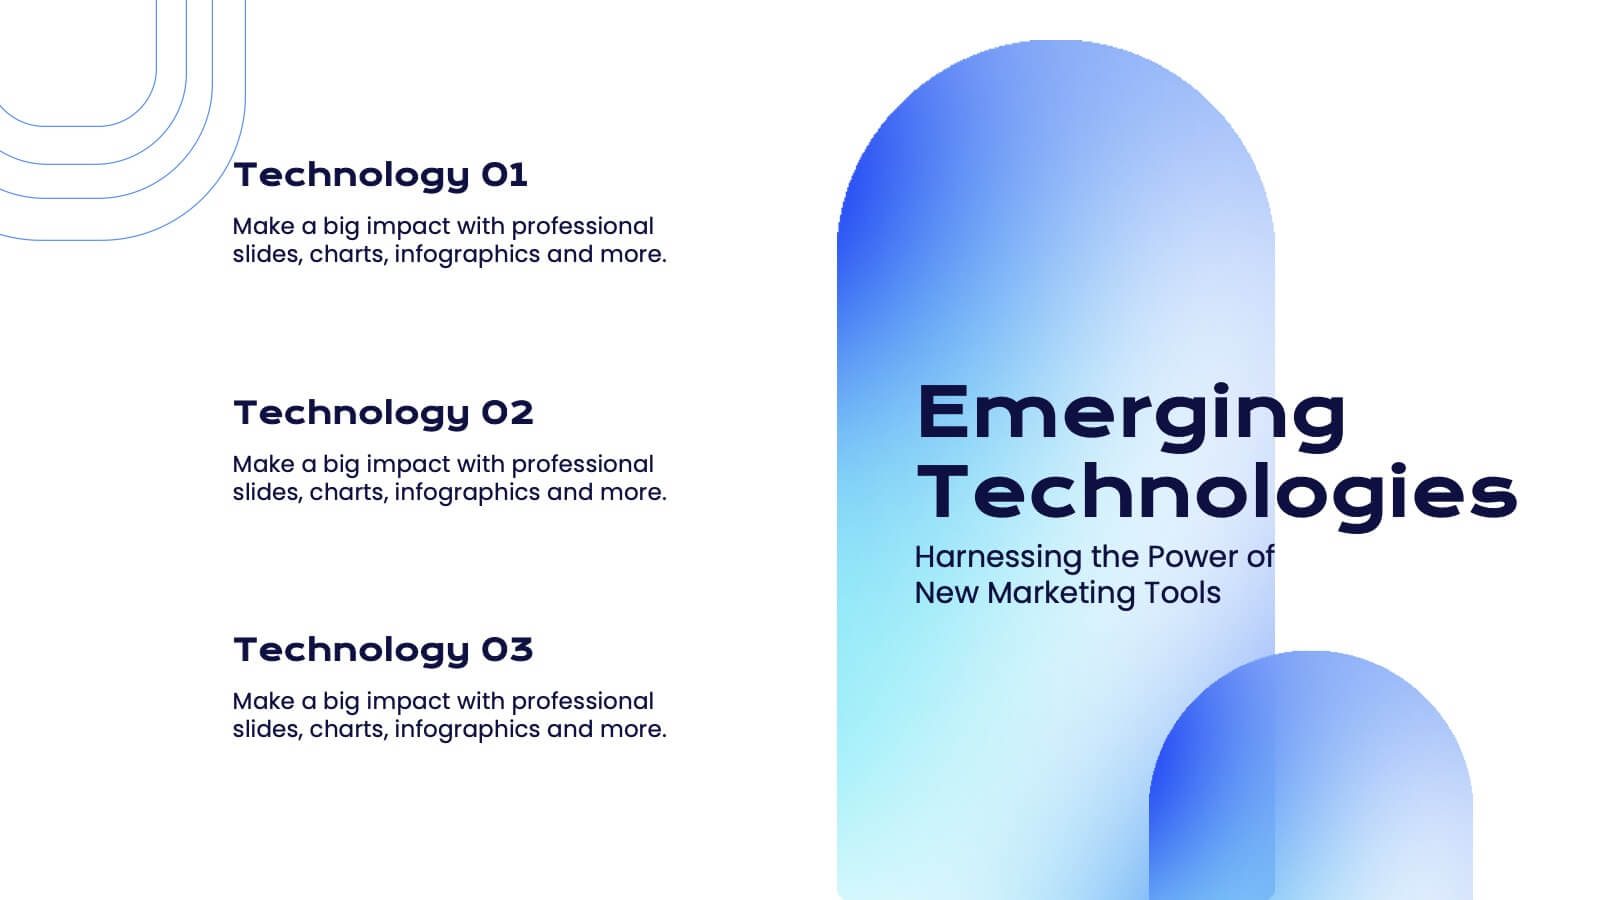
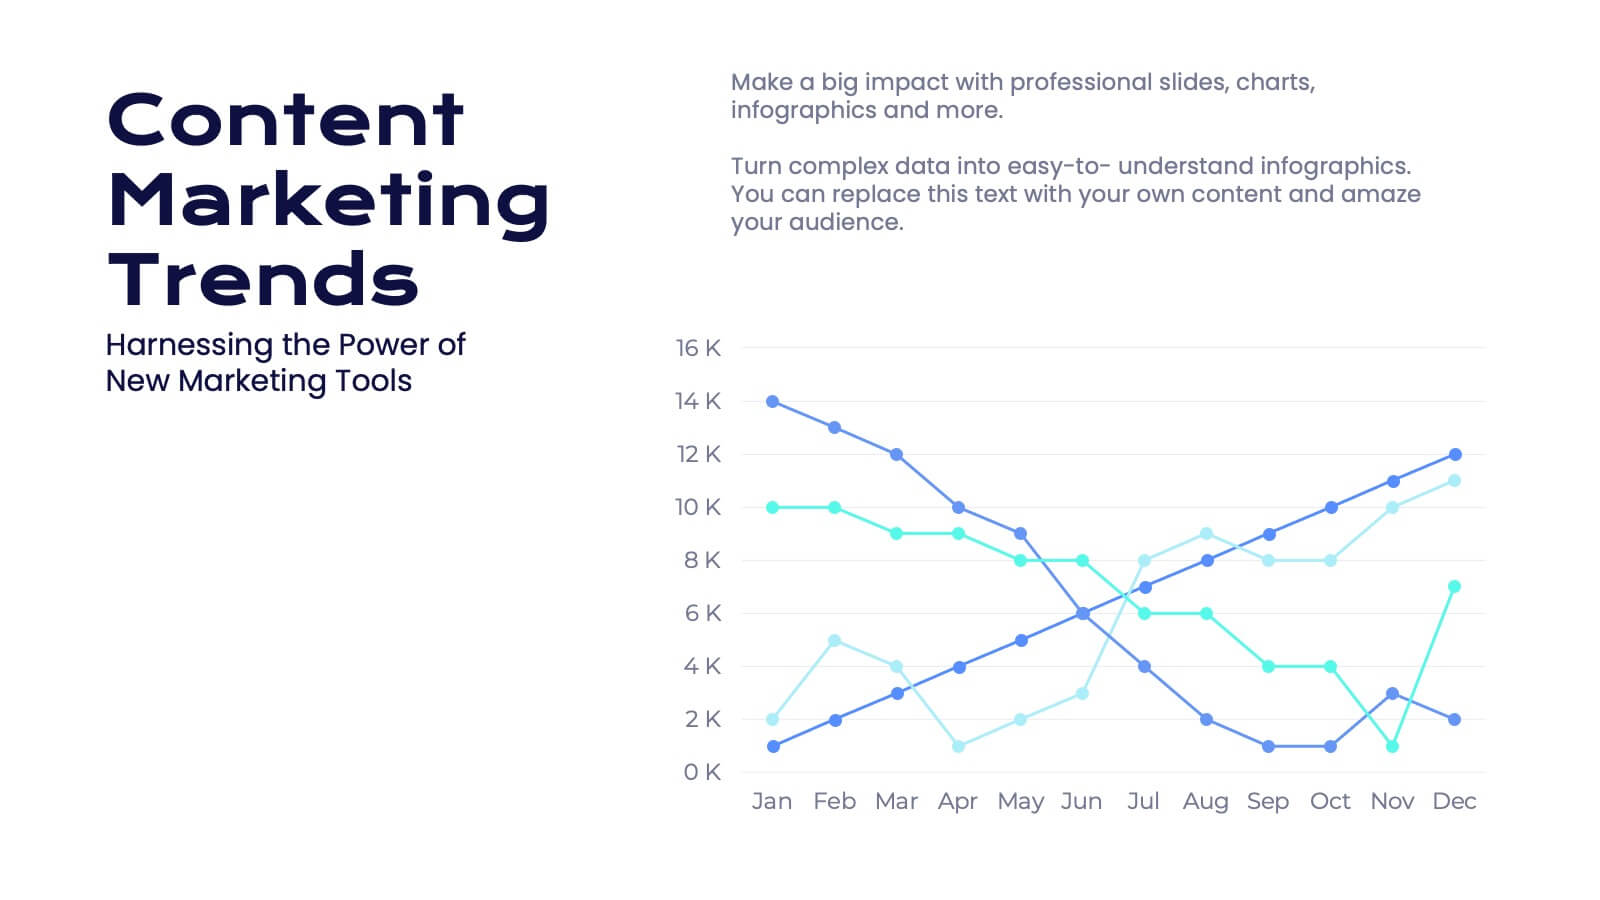
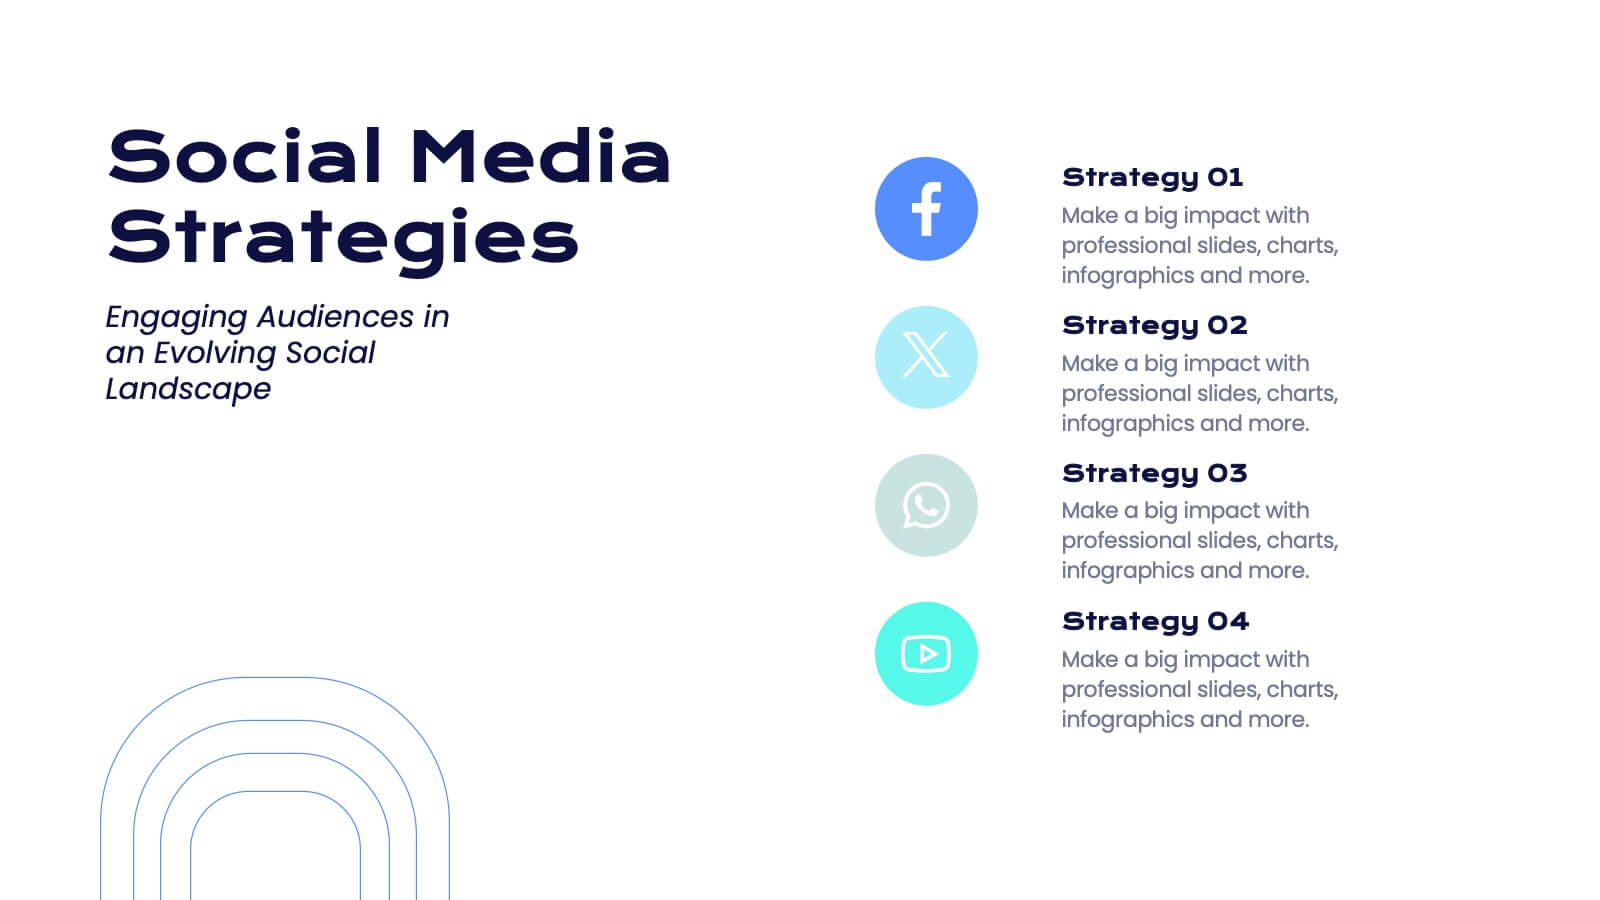
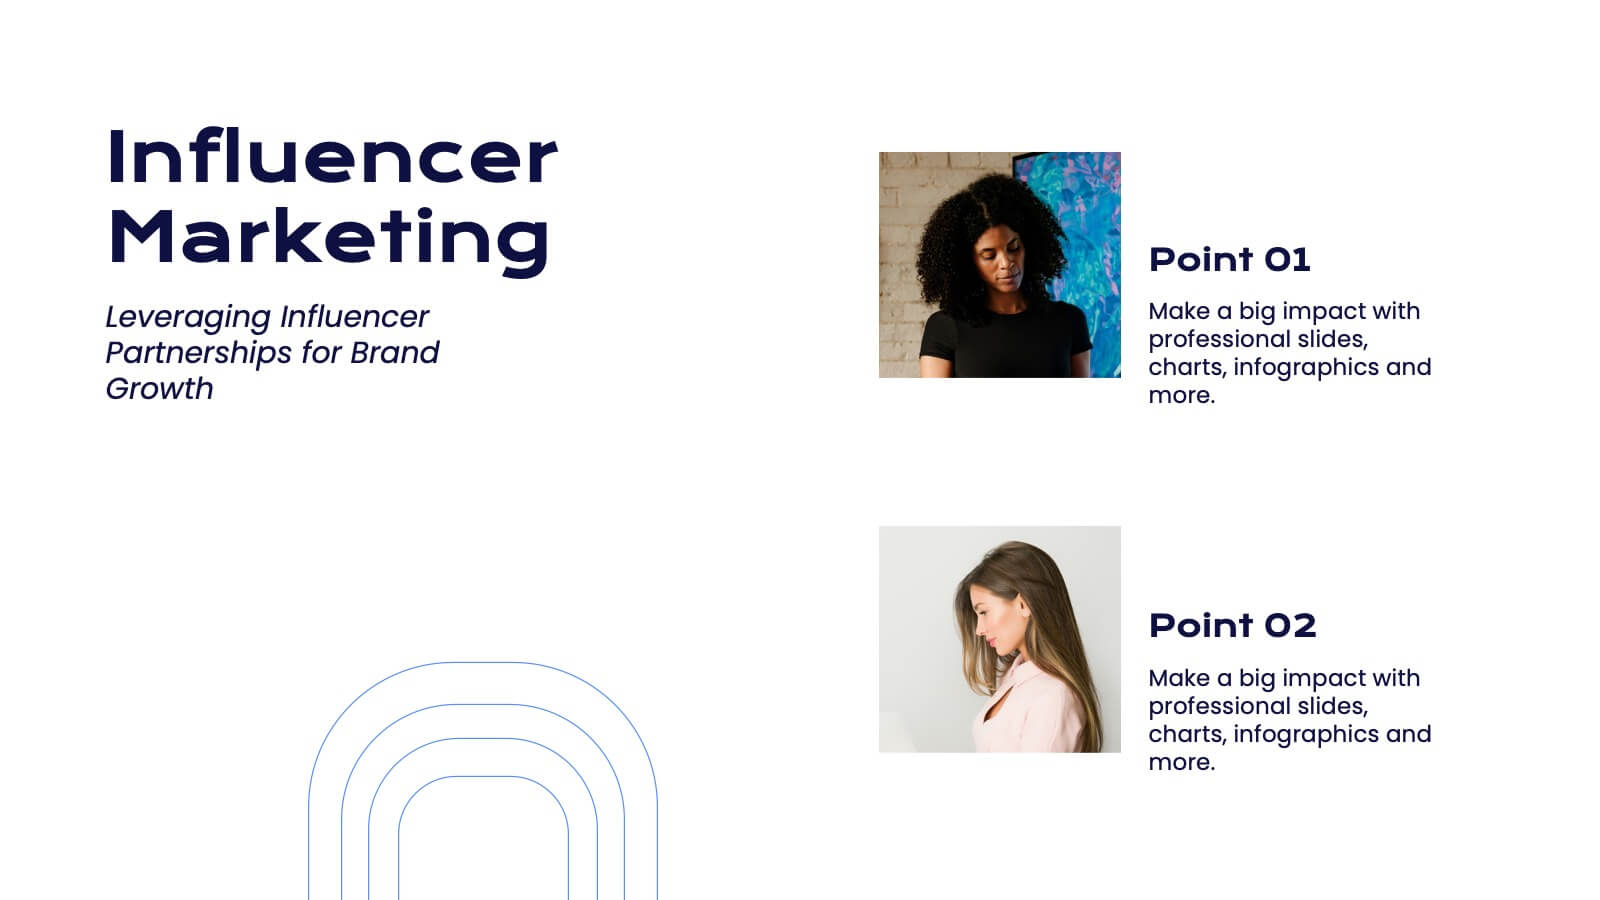
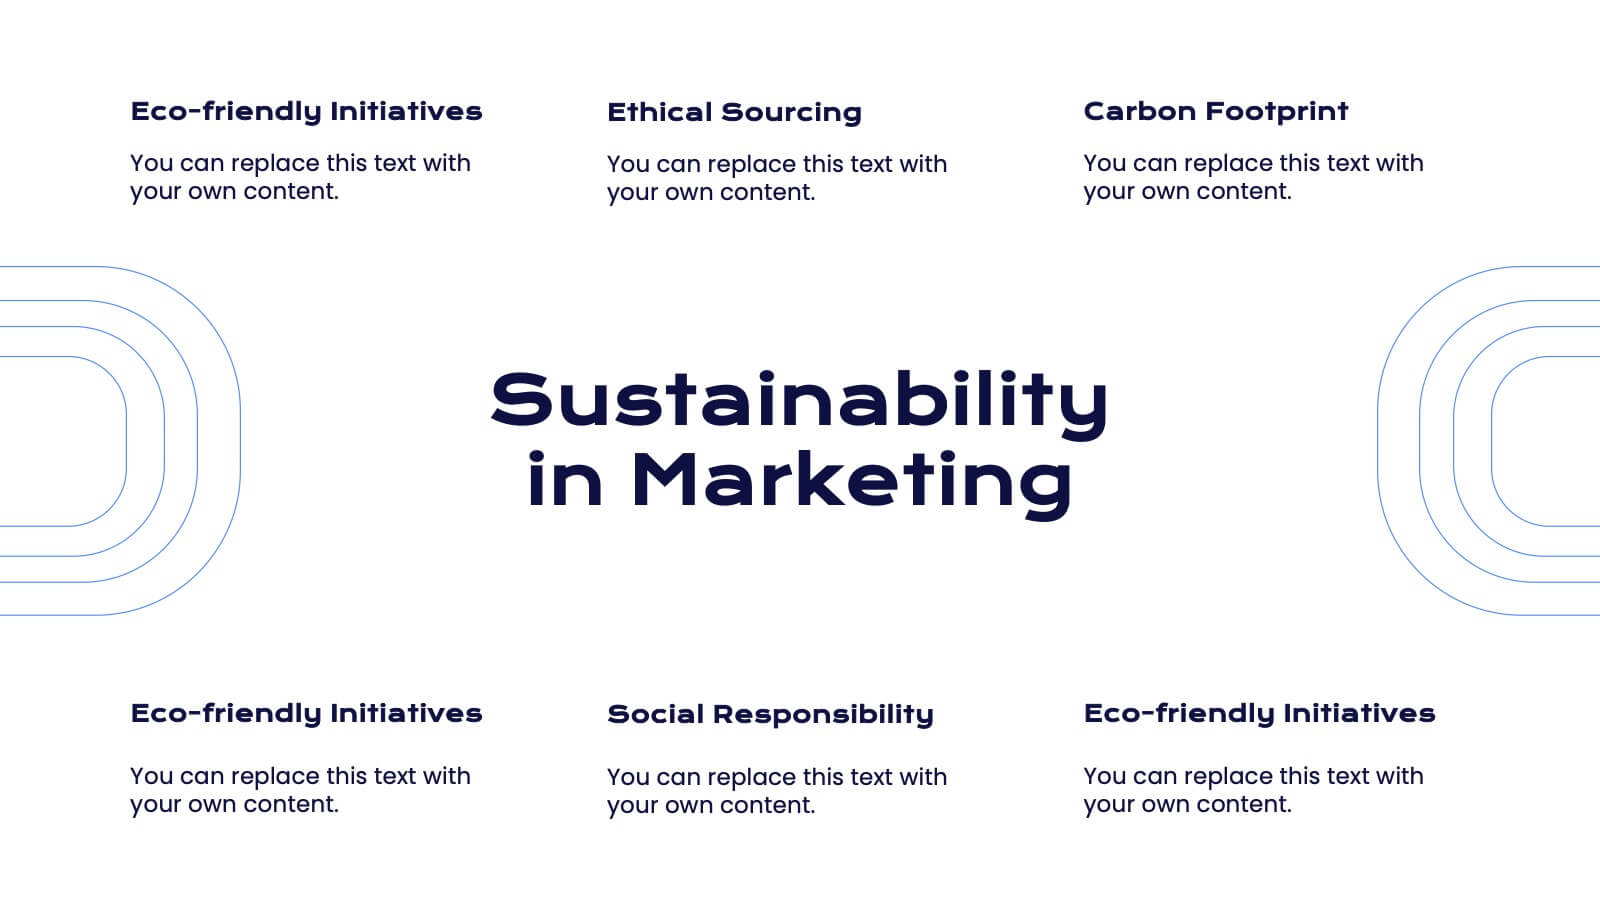
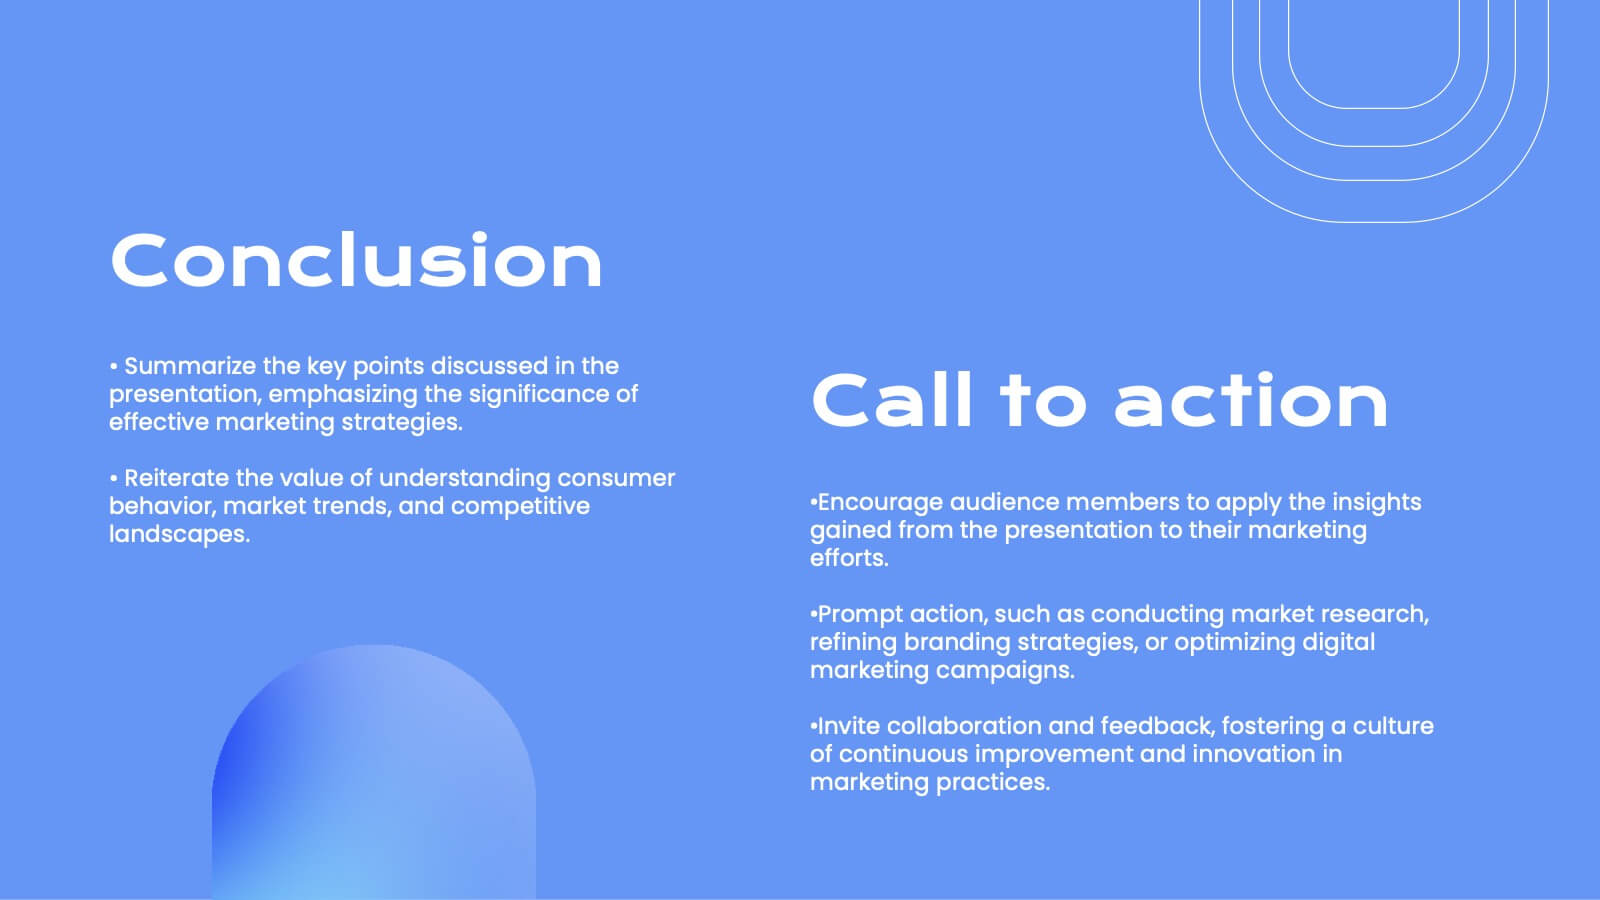
Faerie Digital Marketing Strategy Plan Presentation
Create a compelling marketing strategy with this sleek, modern template! It covers key topics like consumer behavior, social media strategies, and emerging trends. Perfect for showcasing insights in a clear, data-driven format. Fully customizable, it works seamlessly with PowerPoint, Keynote, and Google Slides for effective presentations.


6 diapositivas
Butterfly Chart Data Visualization
Present complex comparisons with visual elegance using the Butterfly Chart Data Visualization Presentation. This eye-catching format displays six key data points split symmetrically across two wings—perfect for showcasing contrasts like pros vs. cons, before vs. after, or product comparisons. Each section is color-coded and paired with editable text areas for clarity. Ideal for reports, strategy meetings, and decision-making decks. Fully compatible with PowerPoint, Keynote, and Google Slides for effortless customization.


22 diapositivas
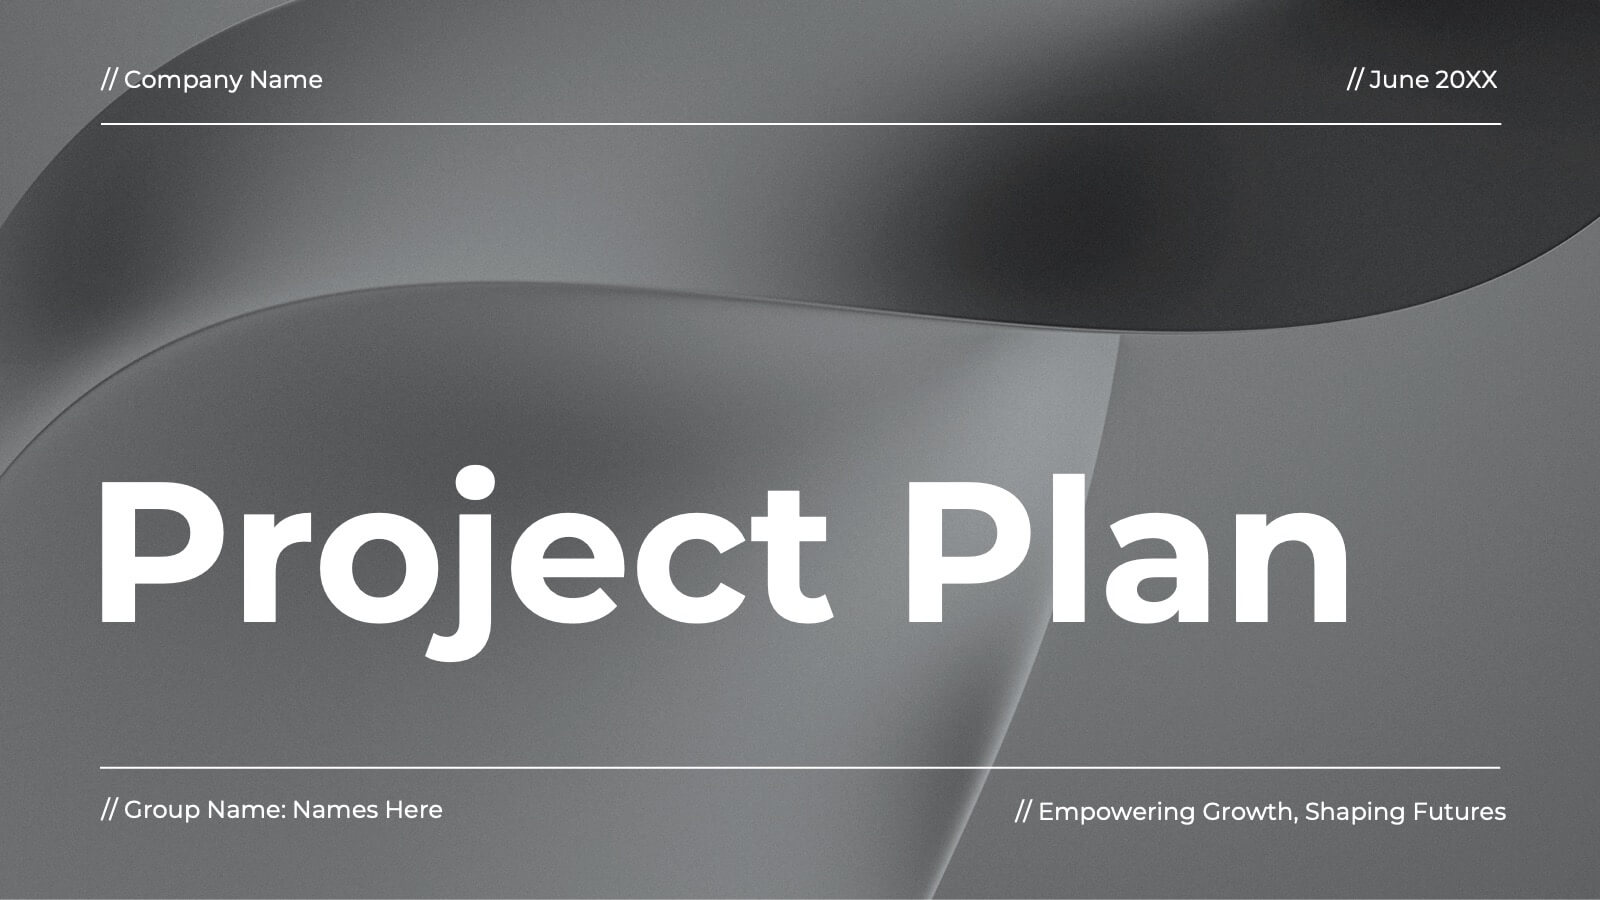
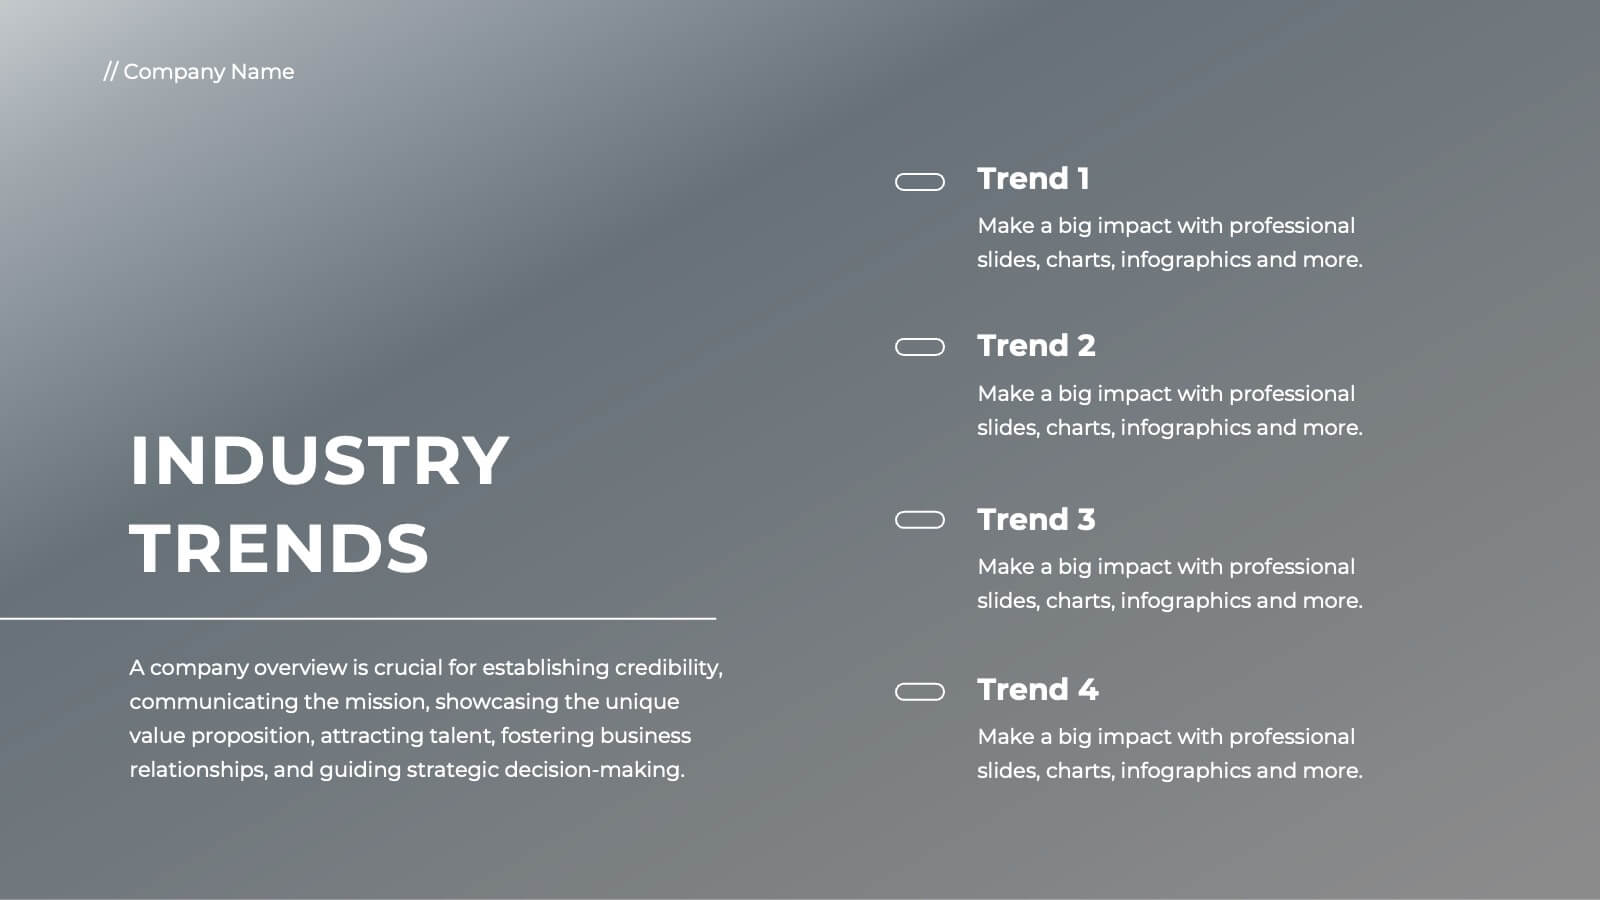
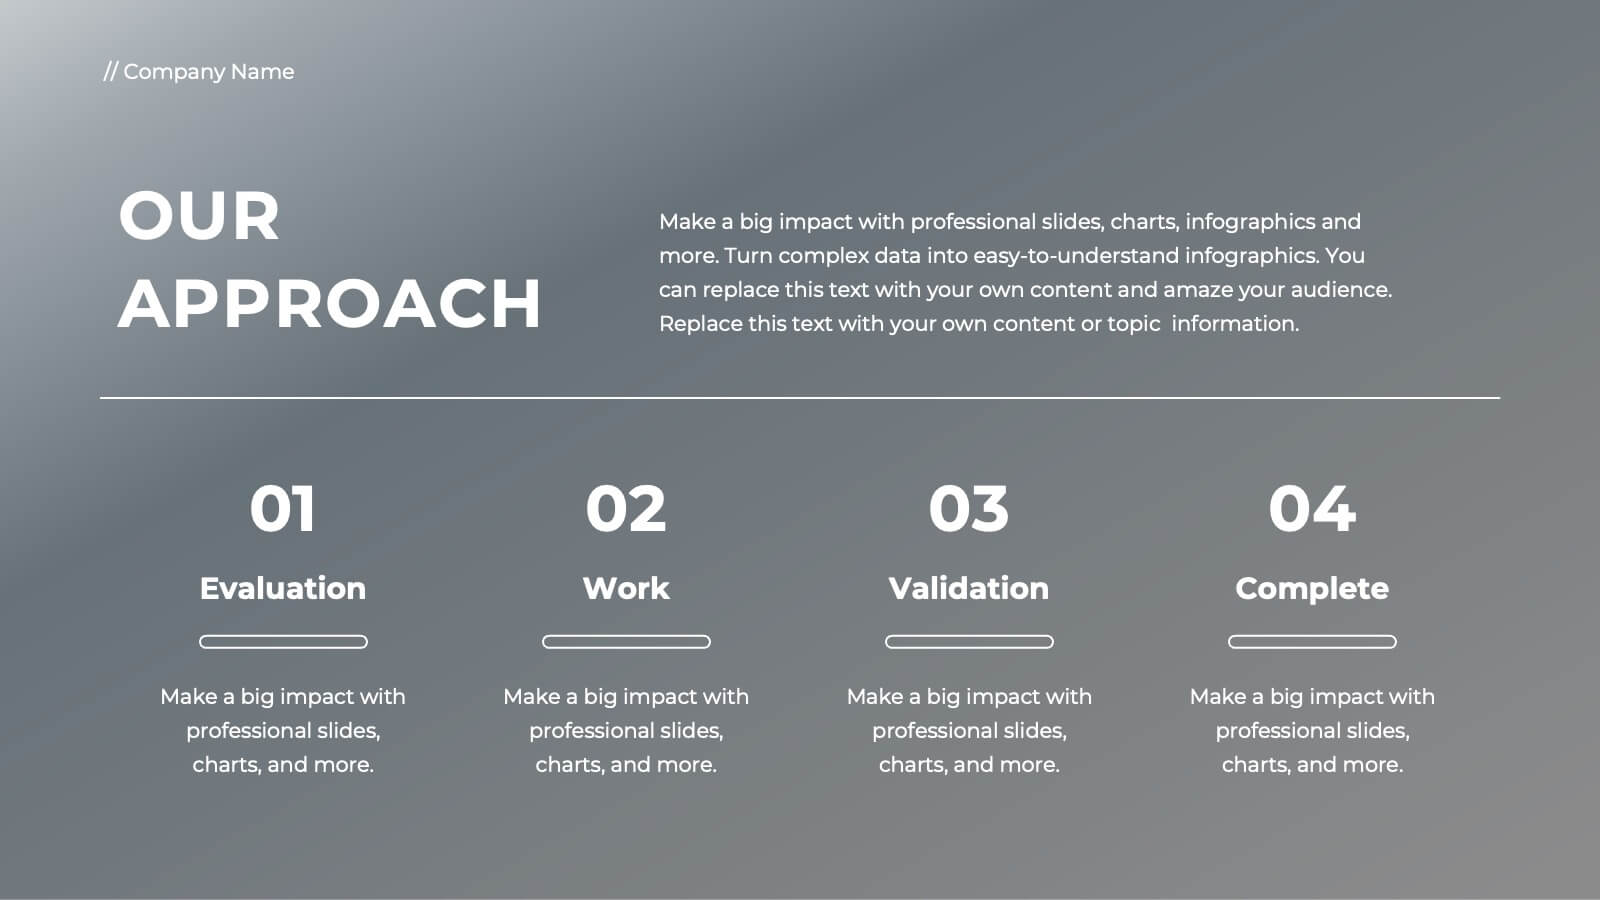
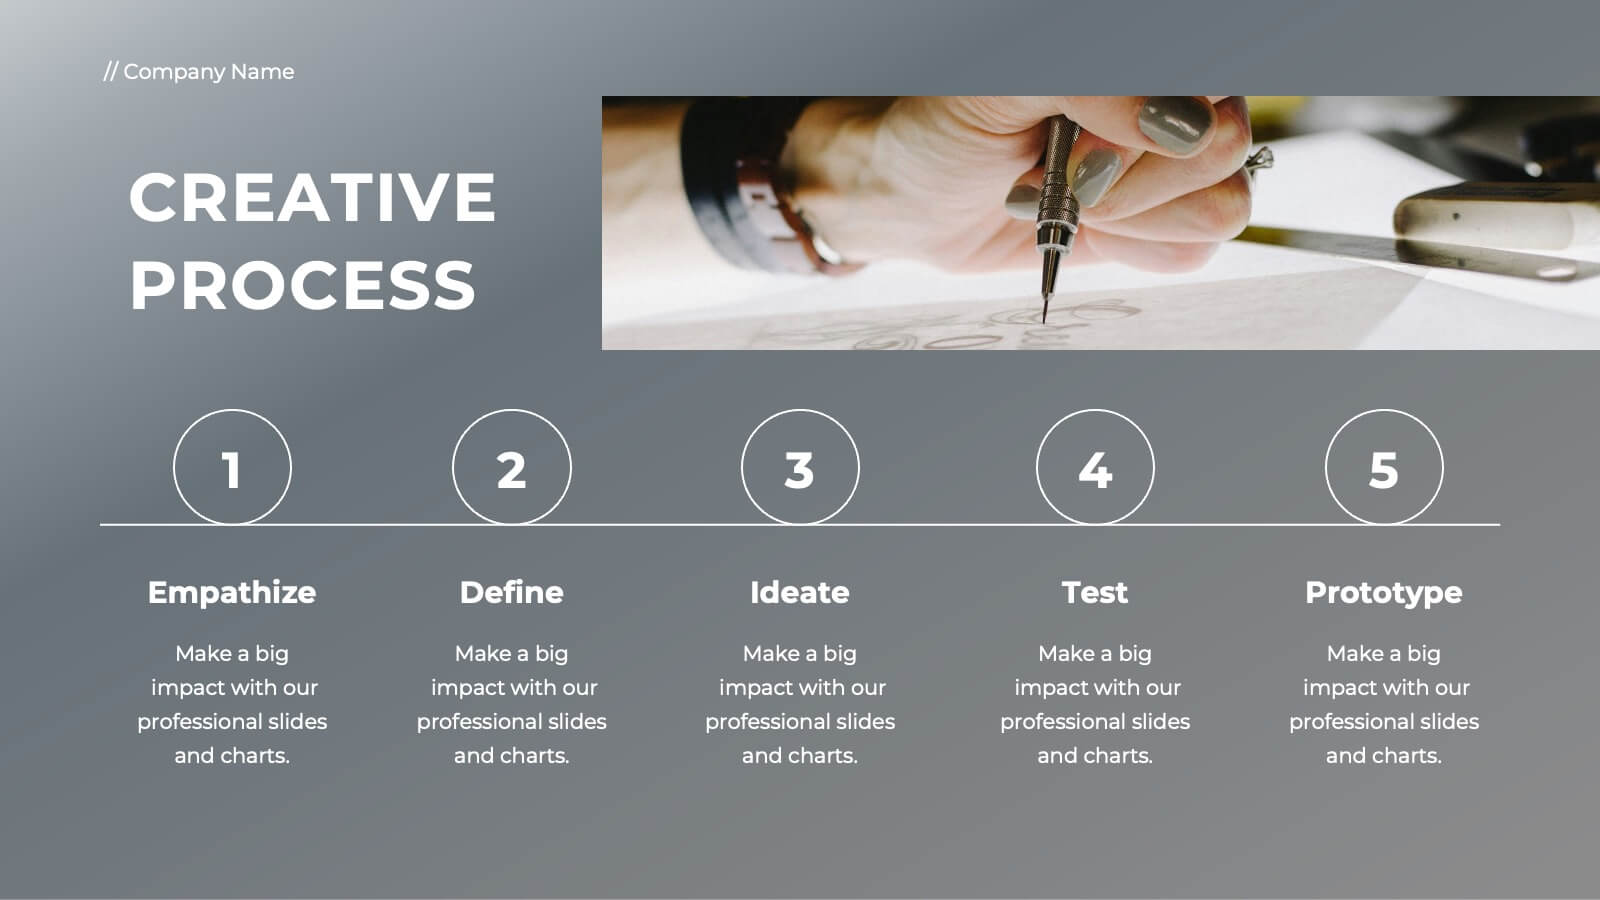
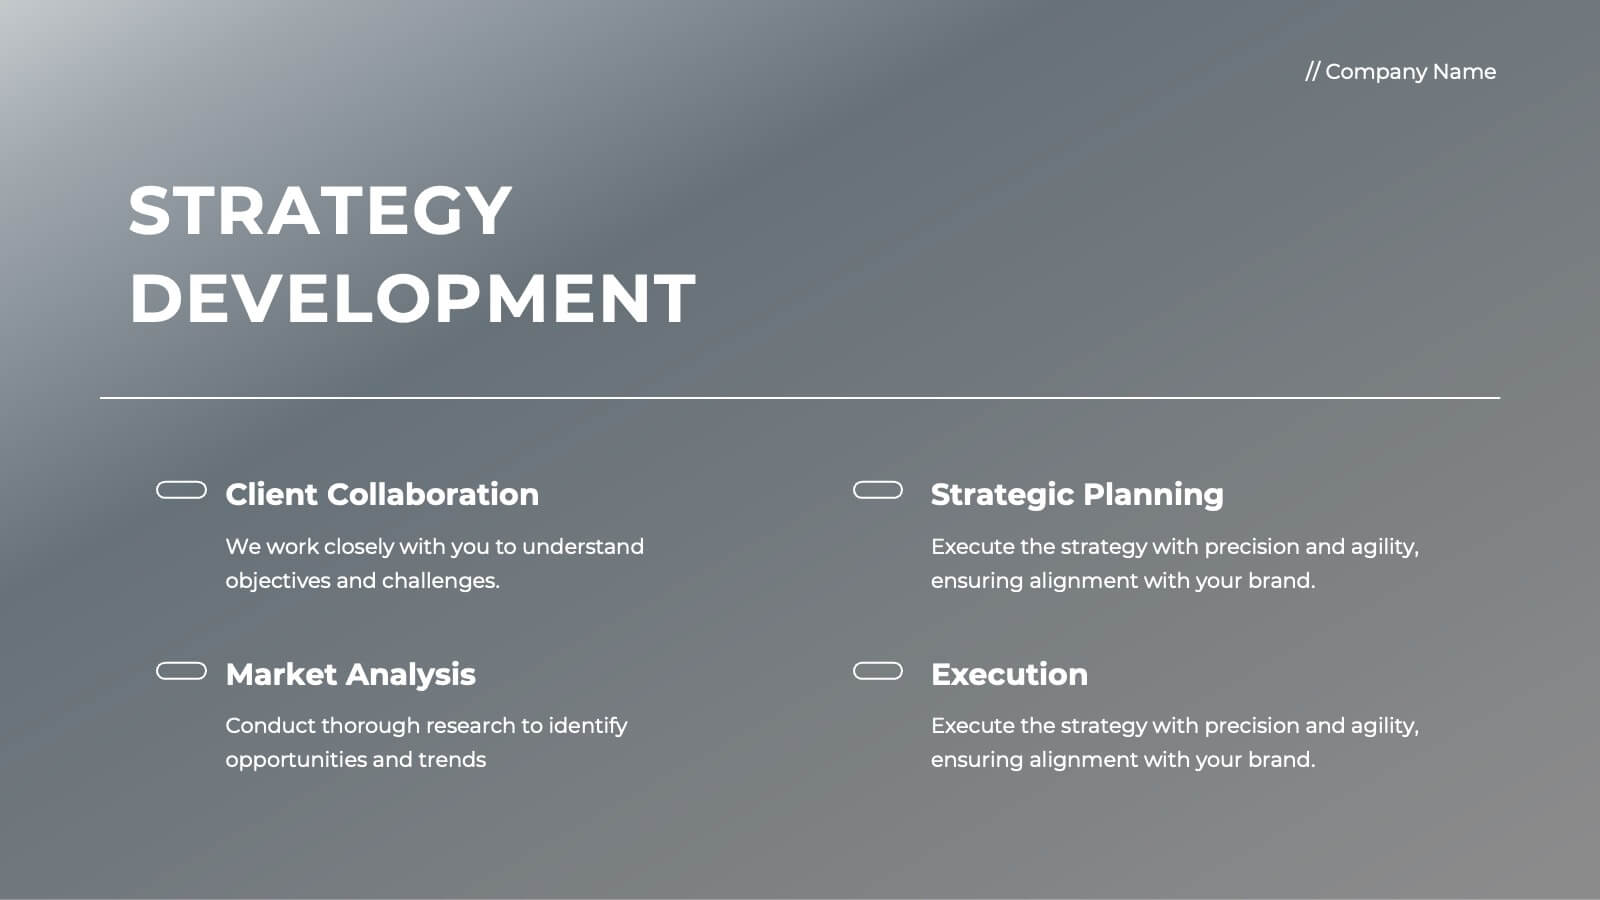
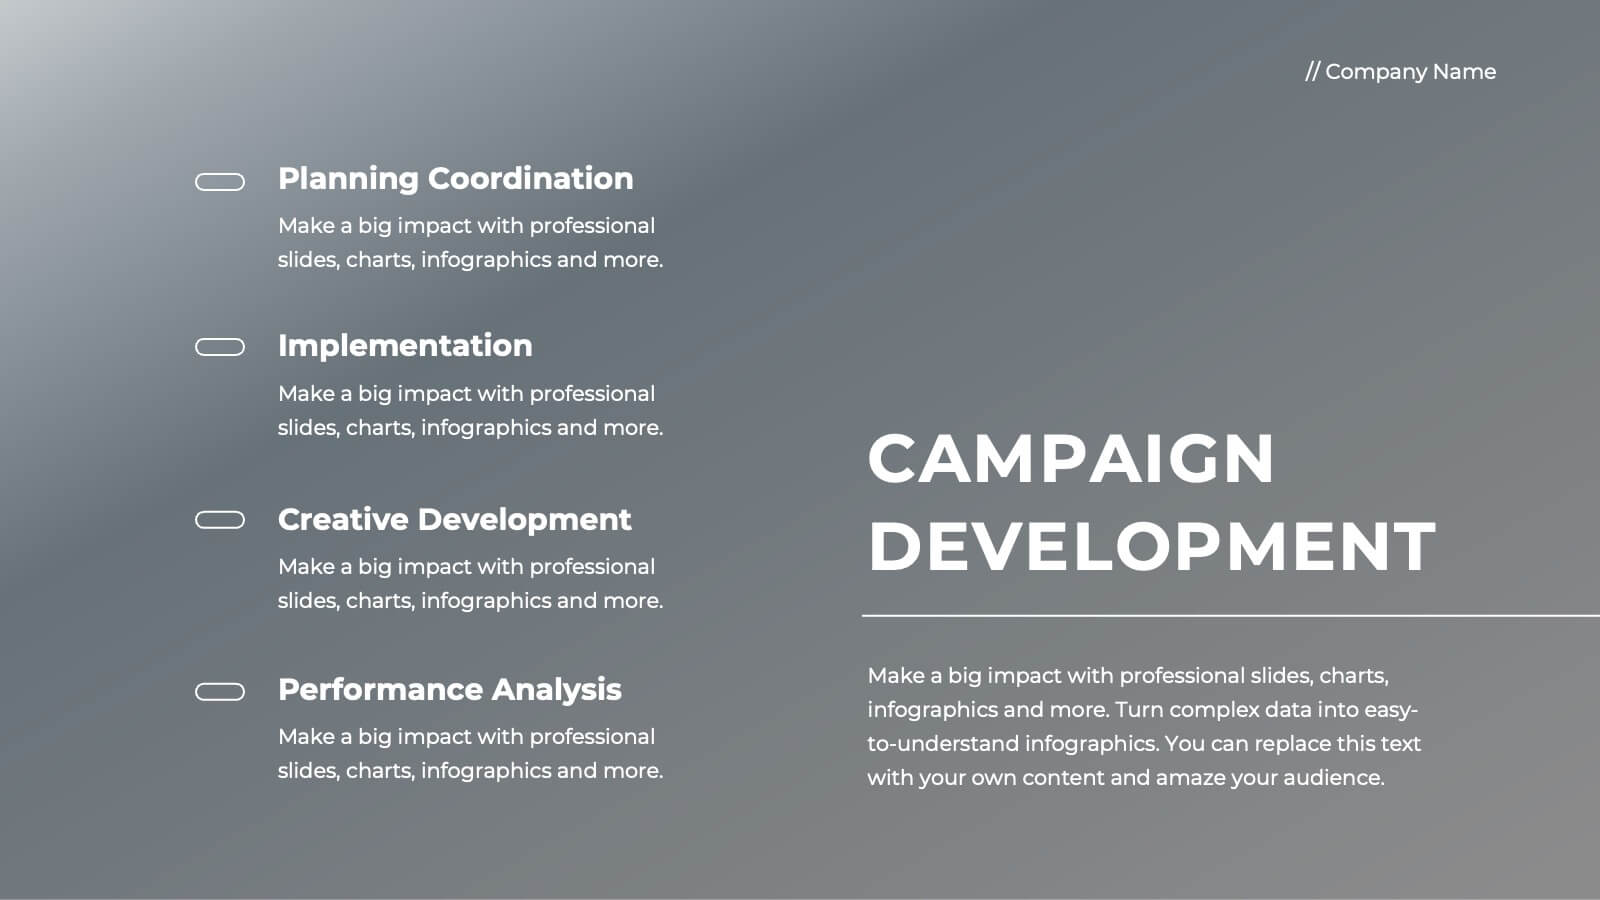
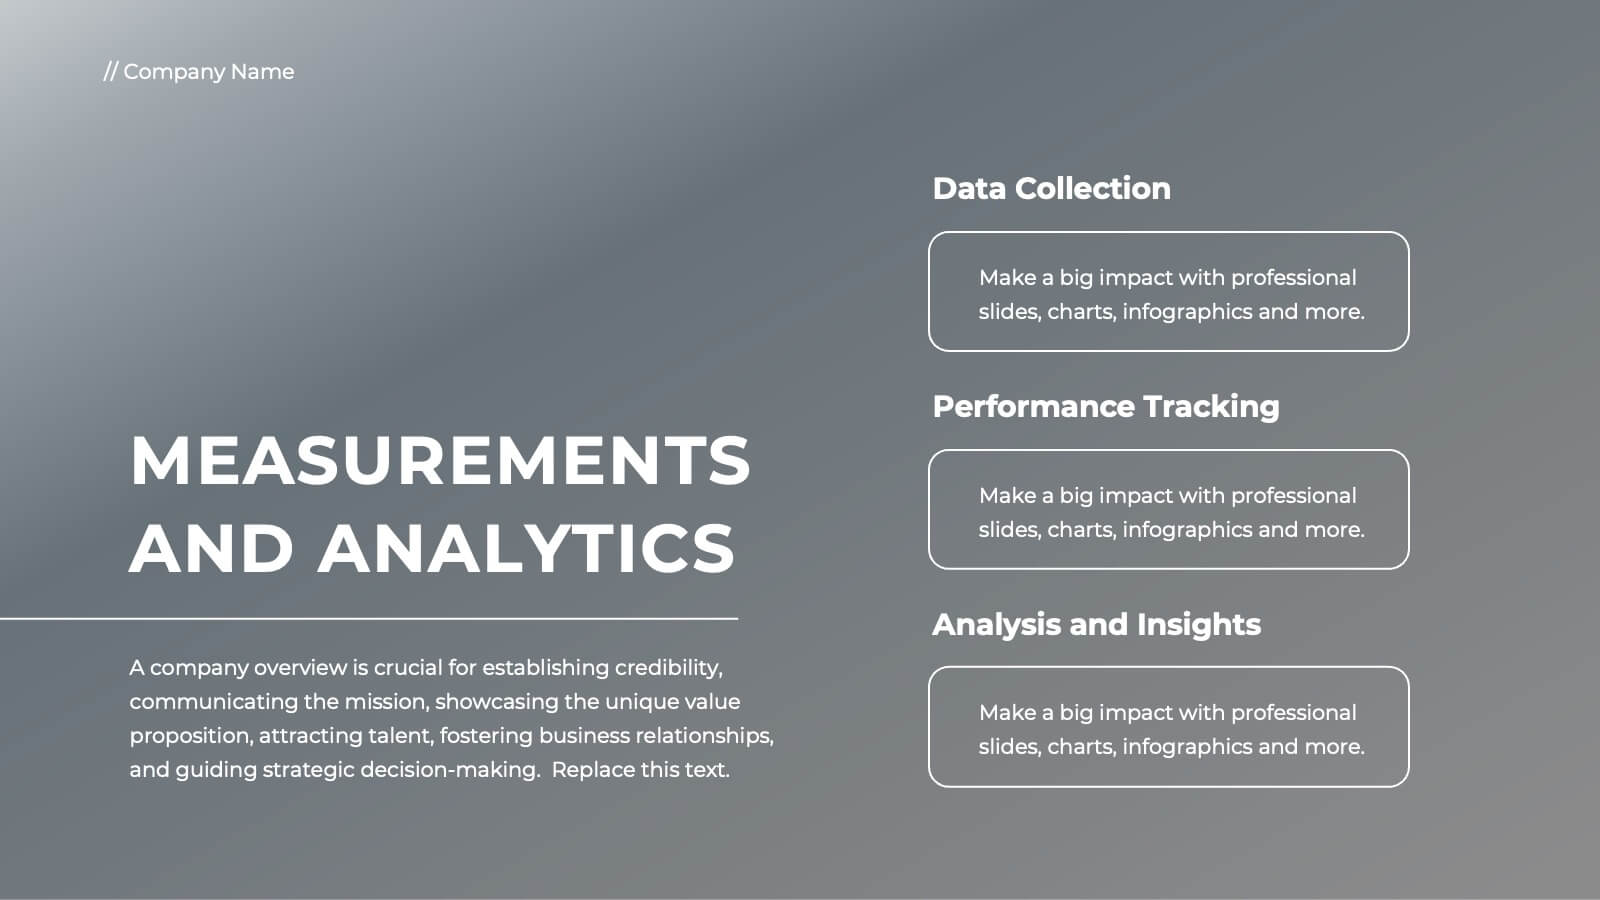
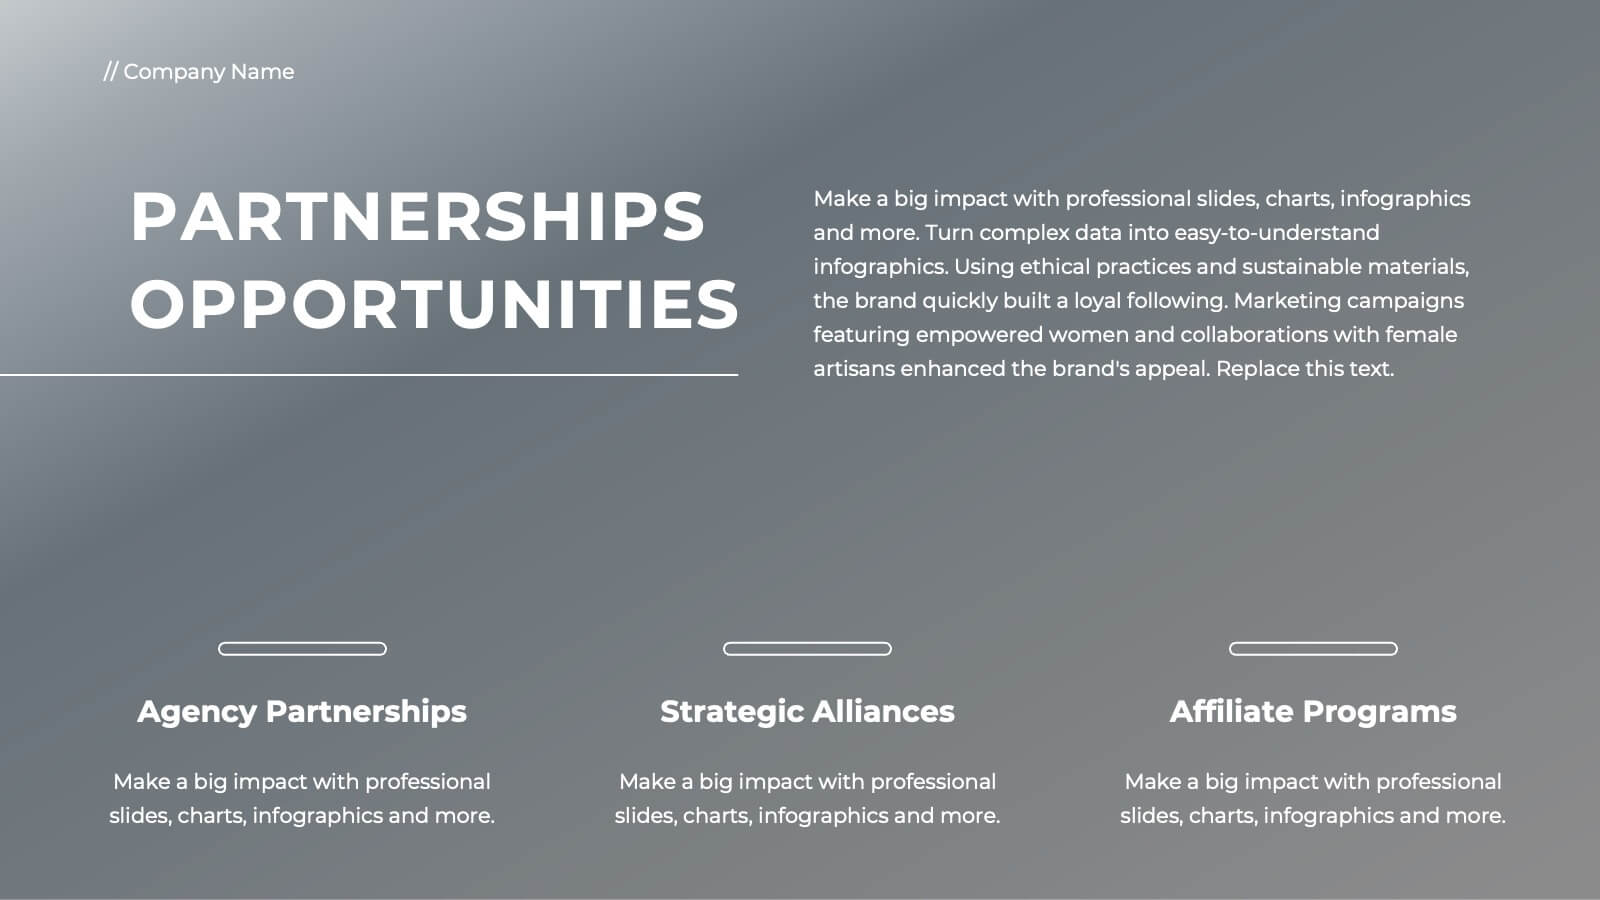
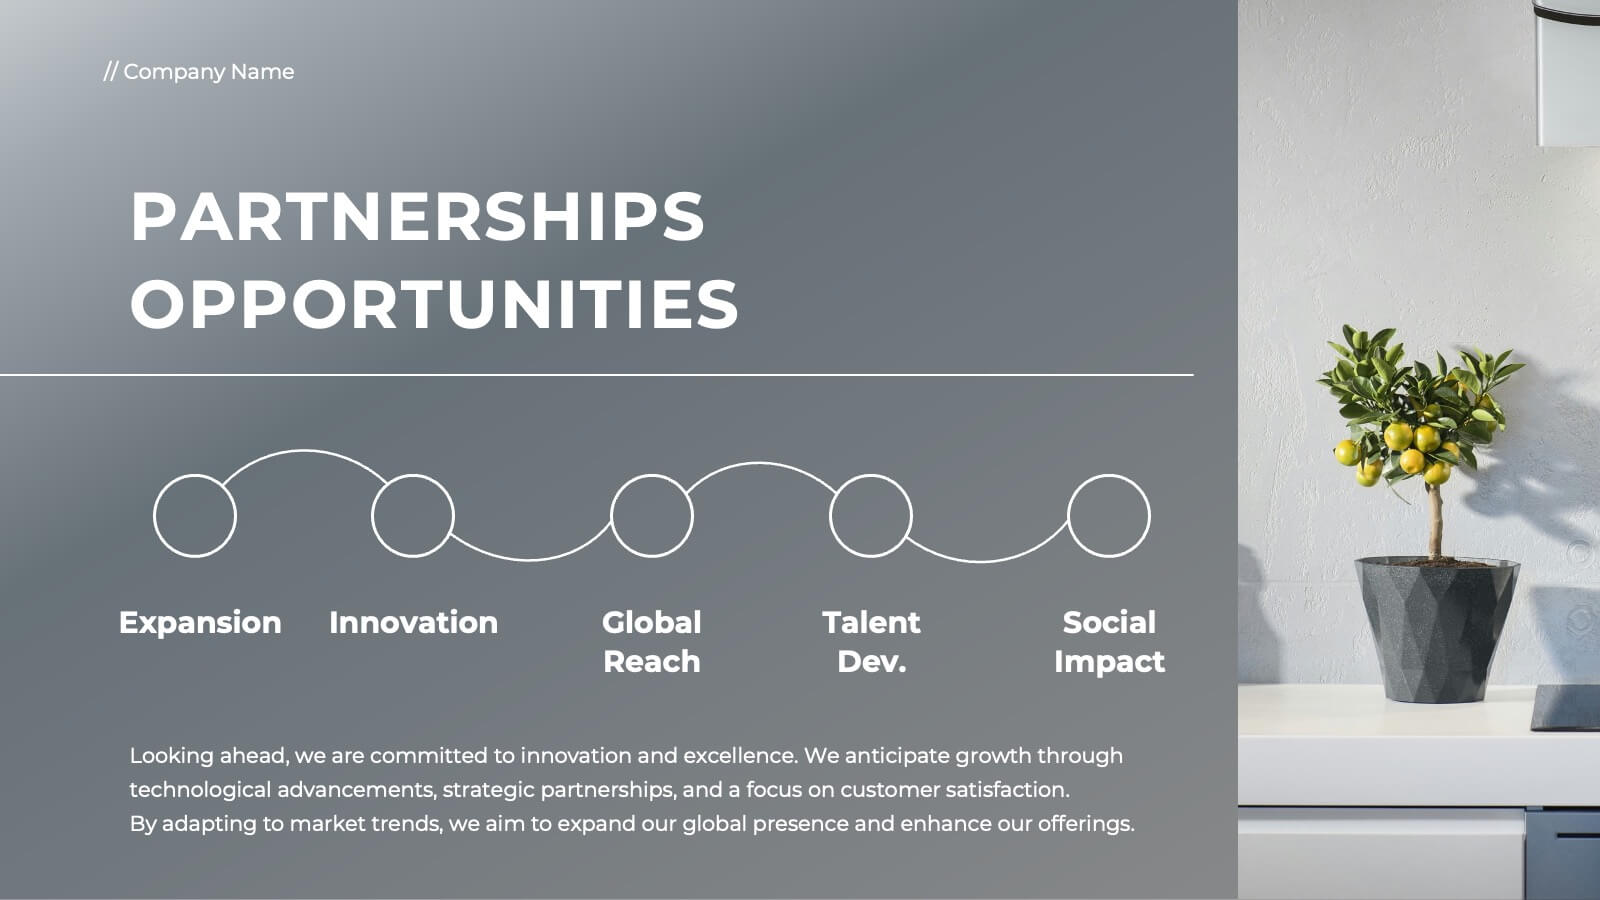
Ember Full-Service Agency Project Plan Presentation
Elevate your agency's presentation with this sleek project plan template! Ideal for showcasing your team's vision, market analysis, and client success stories, it includes slides for strategic development, campaign execution, and partnerships. Impress clients and stakeholders with professional visuals and detailed content. Compatible with PowerPoint, Keynote, and Google Slides for seamless presentations on any platform.


5 diapositivas
Risk Management Bowtie Diagram Layout Presentation
Visualize risk pathways with clarity using the Risk Management Bowtie Diagram Layout Presentation. This design helps illustrate cause-and-effect relationships around a central risk event, making it ideal for identifying threats, controls, and consequences. Fully editable and easy to adapt in Canva, PowerPoint, Google Slides, and Keynote.


3 diapositivas
Breakthroughs in Biology and Chemistry Presentation
Highlight your scientific discoveries with this Breakthroughs in Biology and Chemistry Presentation Template. Featuring illustrated lab elements like microscopes, DNA, and petri dishes, it's perfect for researchers and educators. Easily editable in PowerPoint, Keynote, or Google Slides, this template helps convey key insights with clarity and visual appeal.


12 diapositivas
Business Networking Strategy
Showcase your connection-building roadmap with this hexagonal Business Networking Strategy template. Ideal for illustrating partnerships, key contacts, or collaboration phases, this layout helps structure complex relationships with clarity. Fully customizable in PowerPoint, Keynote, and Google Slides to match your branding and networking objectives.