


Características


¿Tienes alguna pregunta?
Recomendar


5 diapositivas
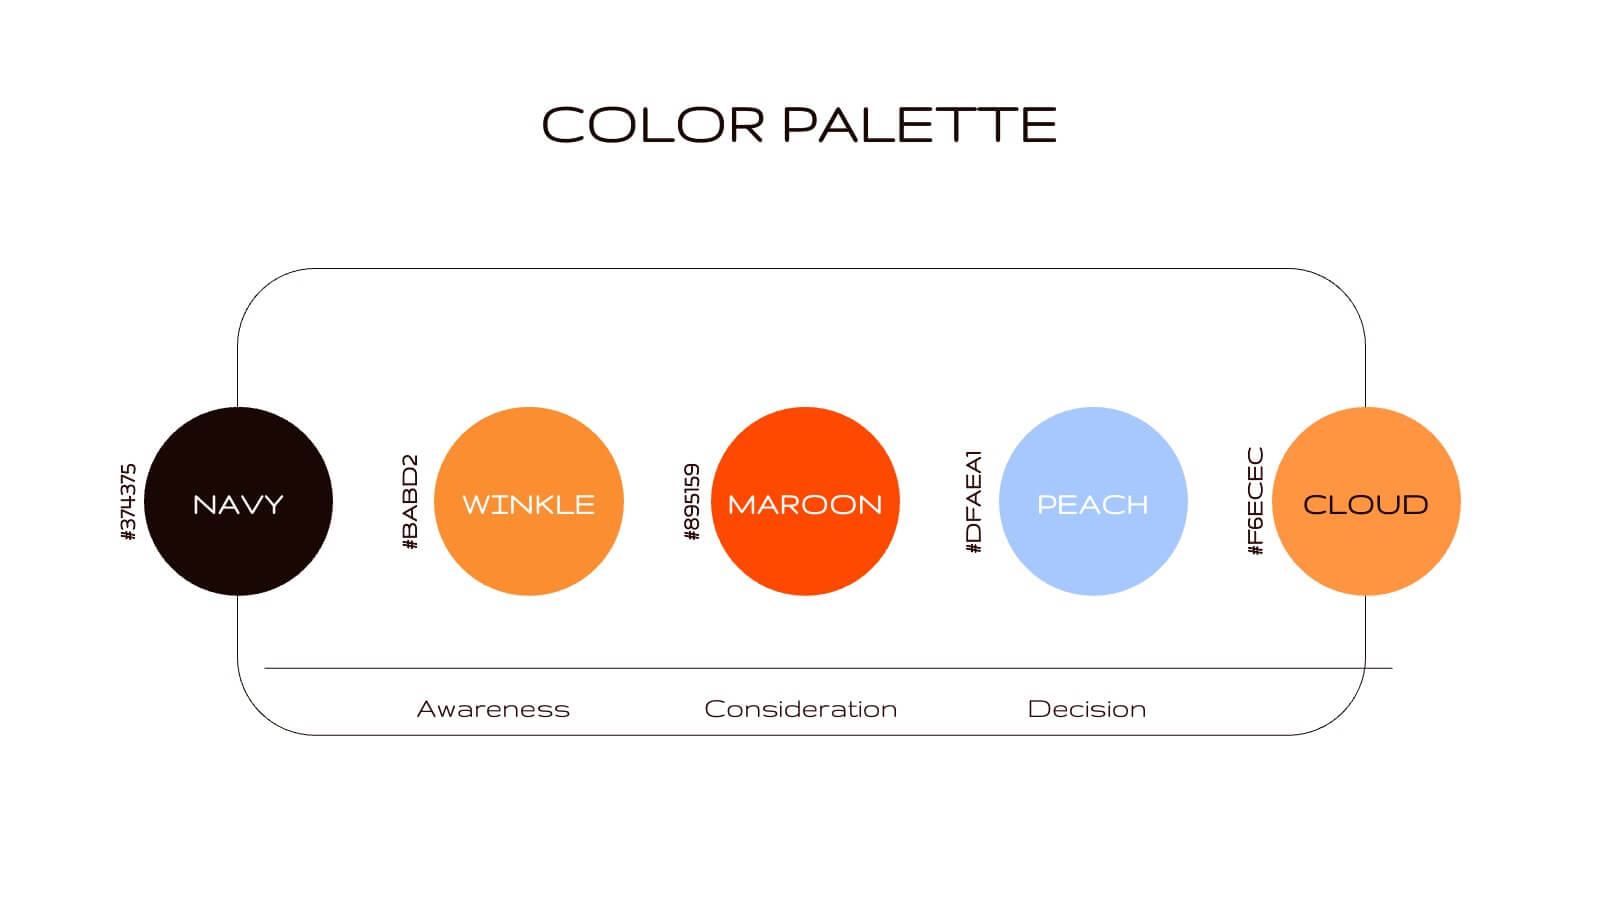
User Experience Customer Path Map
Visualize the full customer journey with the User Experience Customer Path Map Presentation. This engaging slide illustrates five key touchpoints in the user experience cycle using a connected flow design with bold icons and captions. Perfect for mapping onboarding steps, product interactions, or decision-making stages. Fully editable in PowerPoint, Keynote, and Google Slides.


5 diapositivas
Watercolor Accent Style Template Presentation
Add subtle creativity to your slides with this Watercolor Accent Style Template. Ideal for timelines, progressions, or process visualization, this layout features numbered brushstroke segments in soft, hand-painted textures. Use it to highlight key points with elegance and clarity. Fully editable in PowerPoint, Google Slides, and Canva.


10 diapositivas
Social Media Marketing Growth Presentation
Boost your social media strategy with this dynamic infographic template! Perfect for illustrating marketing growth, engagement tactics, and content performance, it features an intuitive flow that simplifies complex data. Ideal for presentations to teams and clients, it’s fully customizable and works seamlessly with PowerPoint, Keynote, and Google Slides.


20 diapositivas
Whisper Creative Portfolio Presentation
The Creative Portfolio Presentation Template is a visually striking 20-slide design, ideal for showcasing your professional work or services. It features slides for introductions, about us, portfolio overviews, and individual project highlights. Key sections include philosophy, style, creative process, client testimonials, awards, and pricing structures. The vibrant yellow and pink gradient elements provide a modern, creative flair that grabs attention. Fully customizable and compatible with PowerPoint, Keynote, and Google Slides, this template is perfect for designers, agencies, and freelancers aiming to present their work professionally and uniquely.


7 diapositivas
Leadership Skills Infographic
Leadership skills encompass a range of abilities and qualities that enable an individual to guide, motivate, and manage a team or group of people effectively. Embark on this joyful adventure through the realm of leadership skills, and let the vibrant colors and engaging design of our leadership skills infographic spark the leader within you. Compatible with Powerpoint, Keynote, and Google Slides. This template is designed to allow you to lead with a commitment to excellence. Roam through the realms of teamwork and collaboration, learning how to unite diverse individuals towards a common goal.


21 diapositivas
Chrysolis Small Business Pitch Deck Presentation
Make your business stand out with a pitch deck that tells your story with clarity and confidence. Covering key elements like company policies, performance metrics, collaboration opportunities, and future projects, this presentation helps you impress stakeholders. Fully customizable and compatible with PowerPoint, Keynote, and Google Slides for a seamless pitch experience.


6 diapositivas
Brain Vector Infographic
This Brain Vector Infographic is an imaginative tool for presenting complex concepts and ideas in an easy-to-digest visual format. The design employs brain imagery to symbolize various aspects of thought processes, intelligence, brainstorming, or mental health. Its sections are strategically placed to reflect different cognitive areas, making it perfect for educational settings or business workshops focused on innovation. Fully editable and compatible with PowerPoint, Google Slides, and Keynote, this template allows for full customization, from colors to text, adapting to your unique presentation needs. Whether for academic, or personal use, this infographic simplifies conveying intricate information.


22 diapositivas
Nimbus Project Milestones Report Presentation
This project plan template offers a modern, vibrant design that clearly outlines key project components, including problem statements, objectives, deliverables, timelines, and risk management. It’s perfect for teams looking to present a comprehensive project overview. Compatible with PowerPoint, Keynote, and Google Slides for impactful presentations with a polished look!


6 diapositivas
Project Overview and Key Takeaways Presentation
Summarize your project outcomes with clarity and impact using this Project Overview and Key Takeaways slide. Featuring a clean layout with a dedicated section for a brief overview and key metrics, plus four hexagonal milestones for your main insights. Perfect for wrap-up reports, client updates, or stakeholder reviews. Fully editable in PowerPoint, Keynote, and Google Slides.


5 diapositivas
Collaborative Learning Techniques Overview Presentation
Highlight team-based education methods with the Collaborative Learning Techniques Overview Presentation. This layout is perfect for mapping out peer-led discussions, group projects, or cooperative learning strategies using a visual 4-step flow. The clean, screen-themed icons make it ideal for educators, trainers, or eLearning creators. Fully editable in Canva, PowerPoint, Keynote, and Google Slides.


7 diapositivas
Union Venn Diagram Infographic
Venn Diagrams are a great way to display your data in an organized, aesthetically pleasing way. This infographic template is perfect for any presentation that requires a Venn Diagram. This template is designed to visually demonstrate the impact of your company's efforts. Use this to show how different teams work to achieve goals, or how different departments work together to create something new. Compatible with Powerpoint, Keynote, and Google Slides. This infographic uses a cool, bold color scheme and fun imagery to show the relationship between two or more sets of data in a way that will help you easily explain it to your target audience.


19 diapositivas
Kinetic Sales Forecast Presentation
Forecast your sales with style using this vibrant template! Perfect for detailing company overview, sales process, team, and strategy. Includes sections for case studies, pricing, and future opportunities. Ideal for sales teams to impress stakeholders. Compatible with PowerPoint, Keynote, and Google Slides.


22 diapositivas
Thistlewisp Advertising Agency Proposal Presentation
Win clients and showcase your agency’s capabilities with this sleek and comprehensive proposal presentation! It highlights essential sections like mission and vision, client success stories, case studies, market trends, and creative processes to create a compelling pitch. Ideal for client presentations, this template is fully compatible with PowerPoint, Keynote, and Google Slides.


22 diapositivas
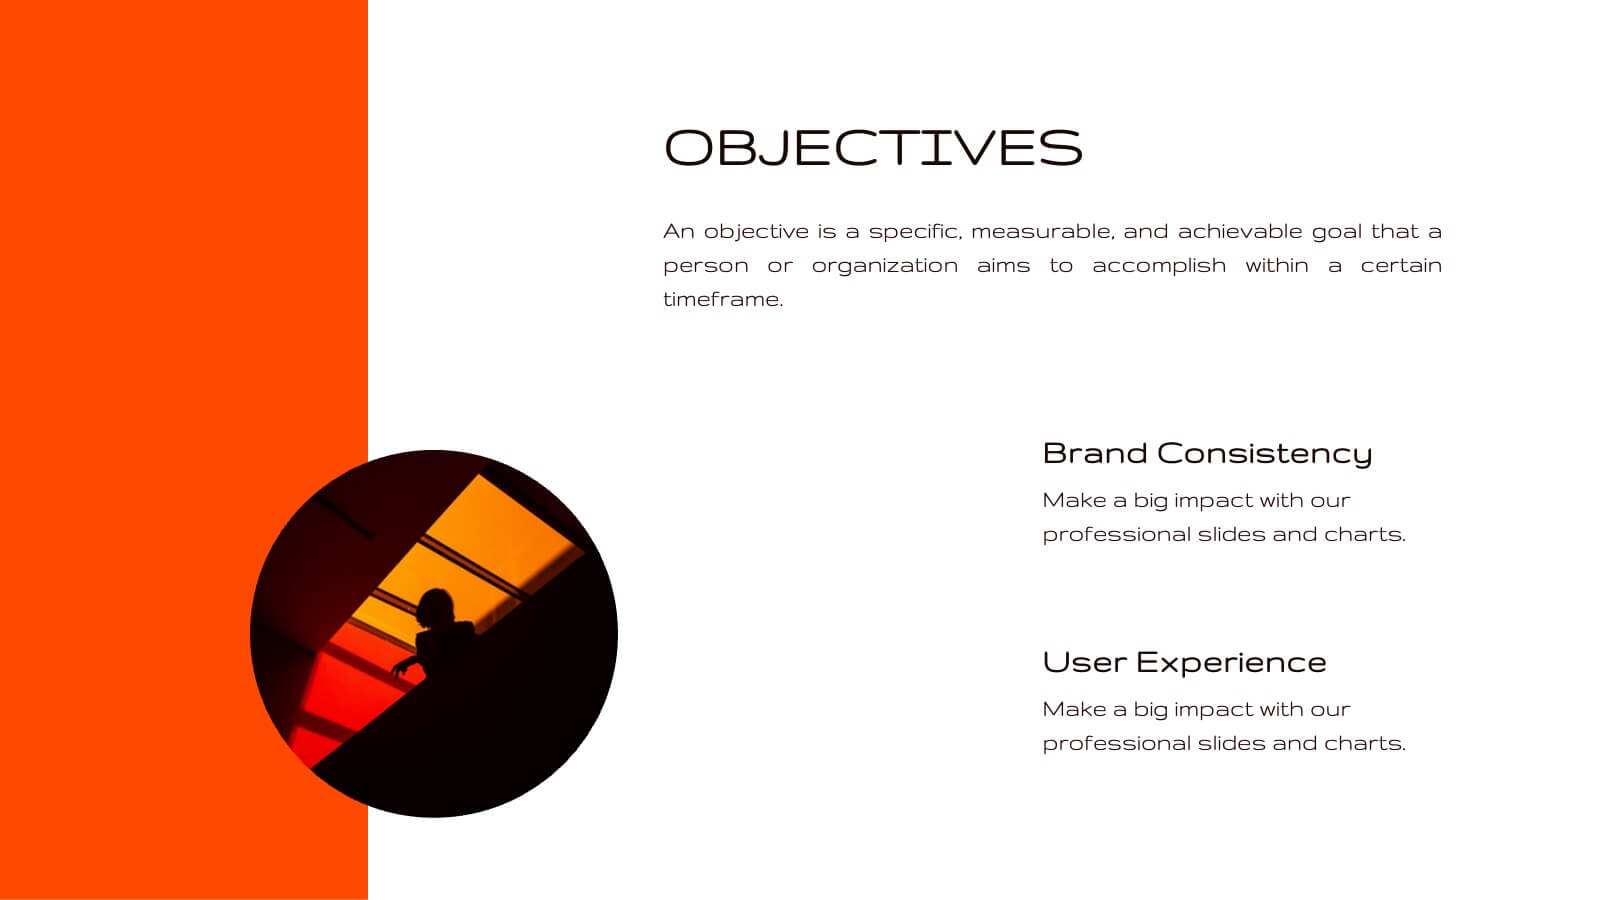
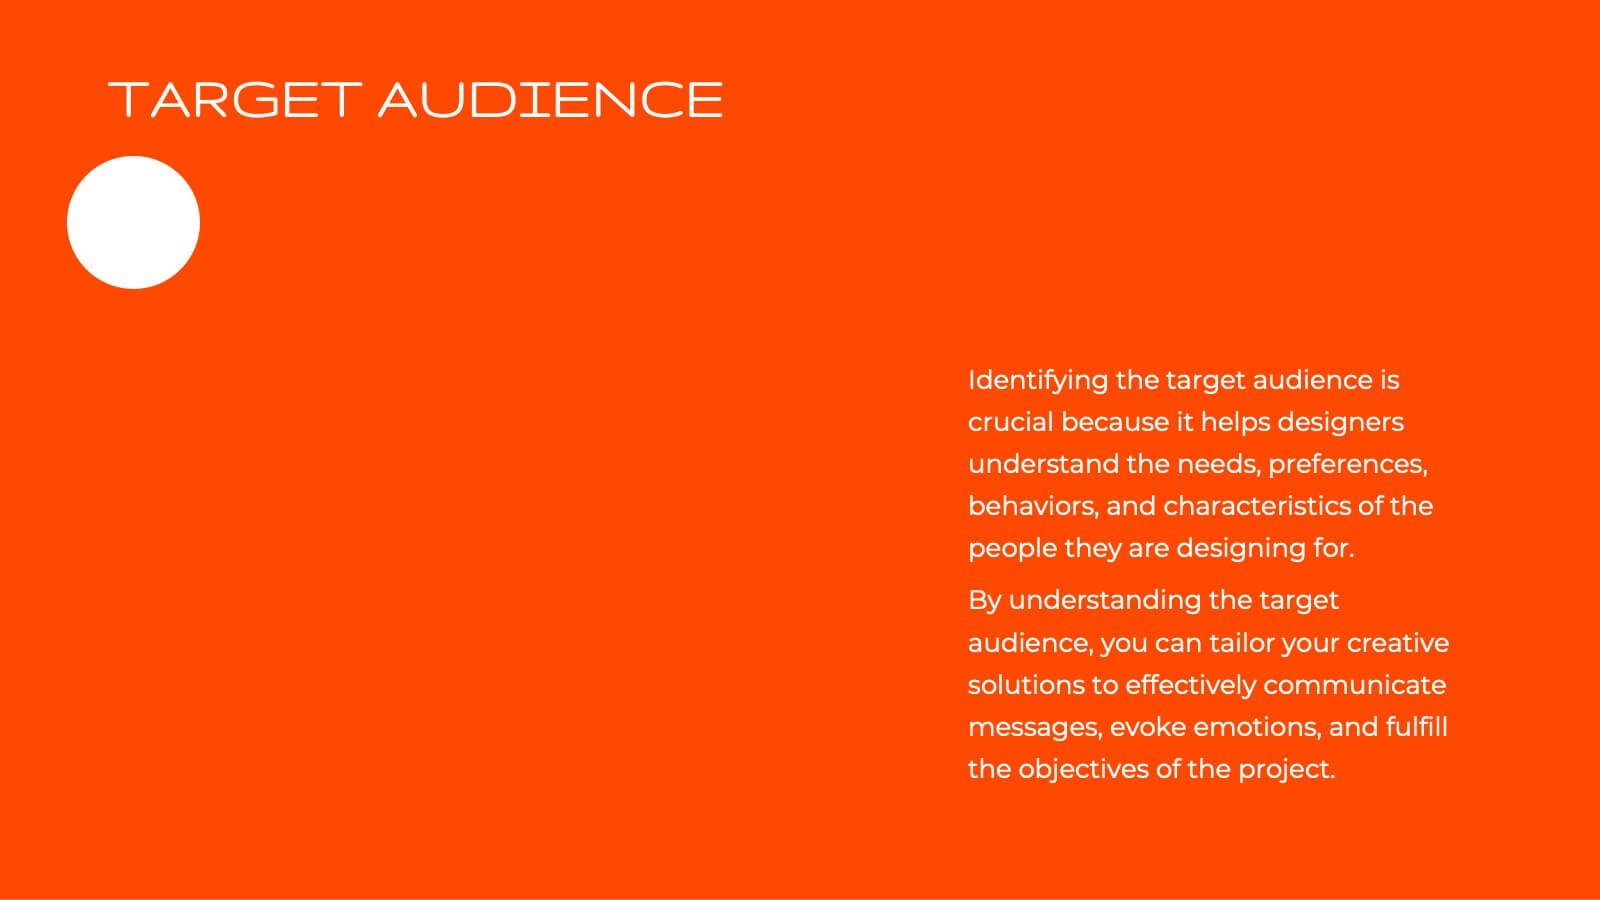
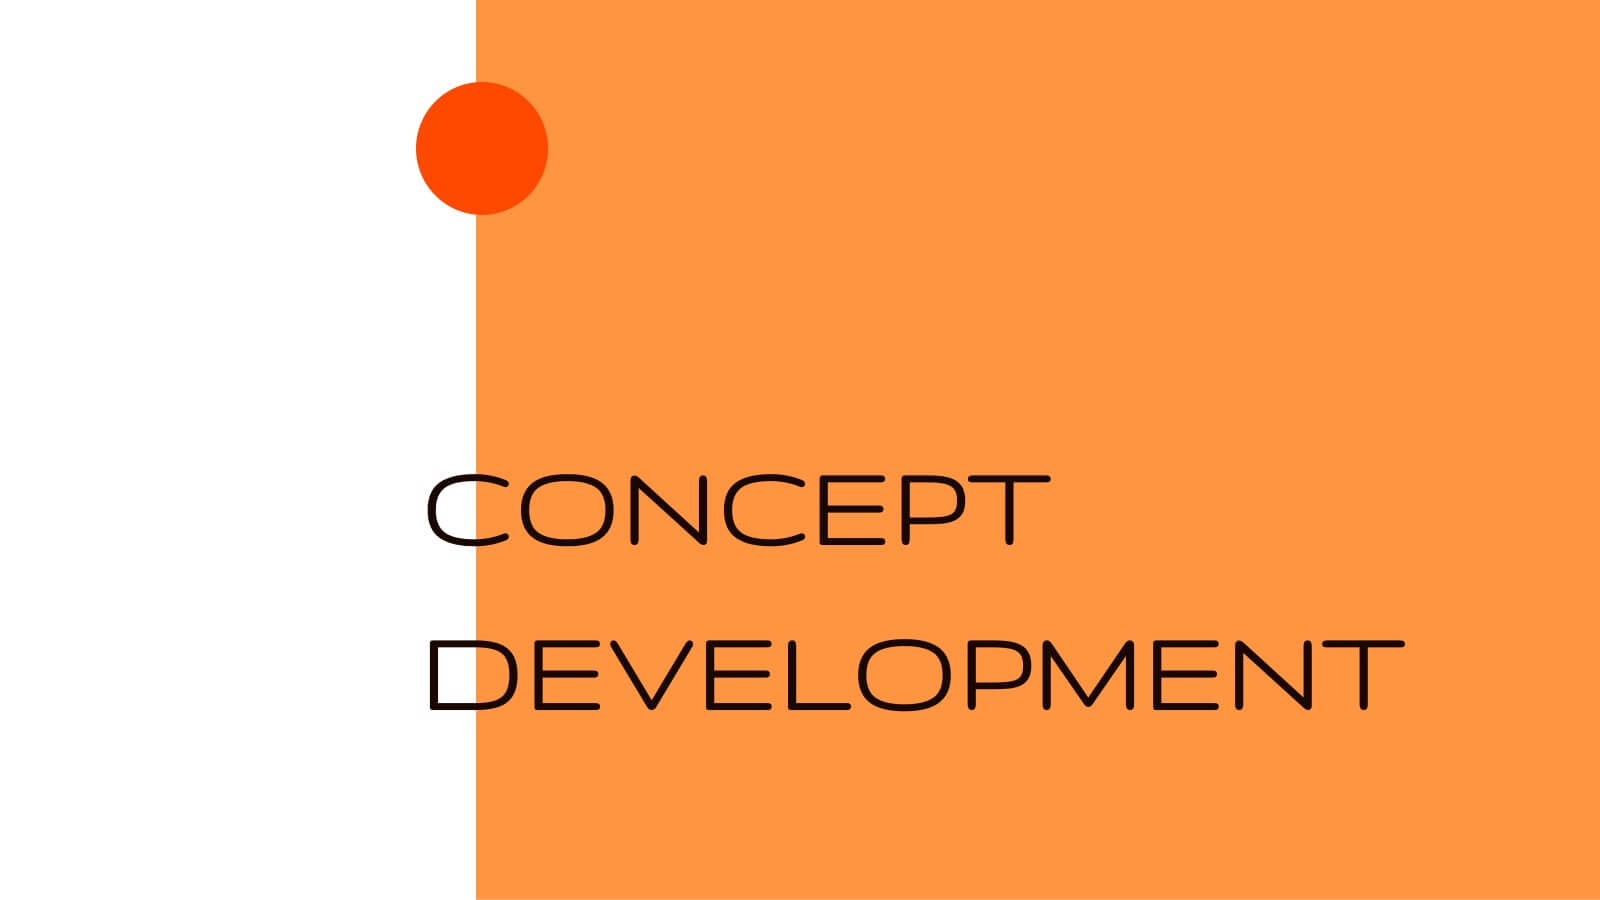
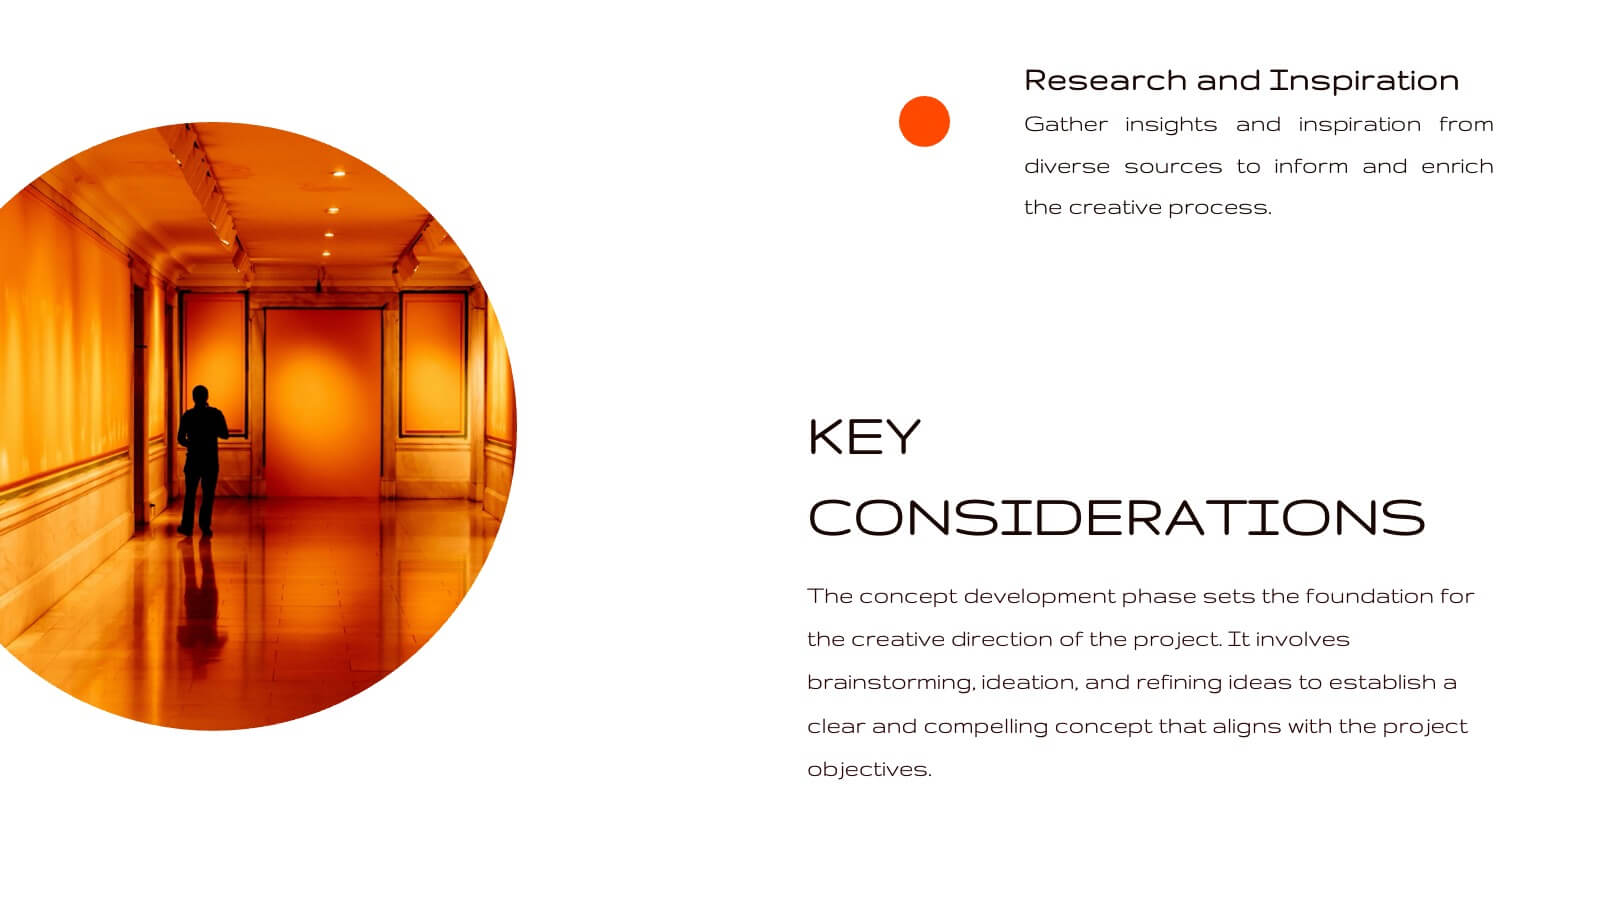
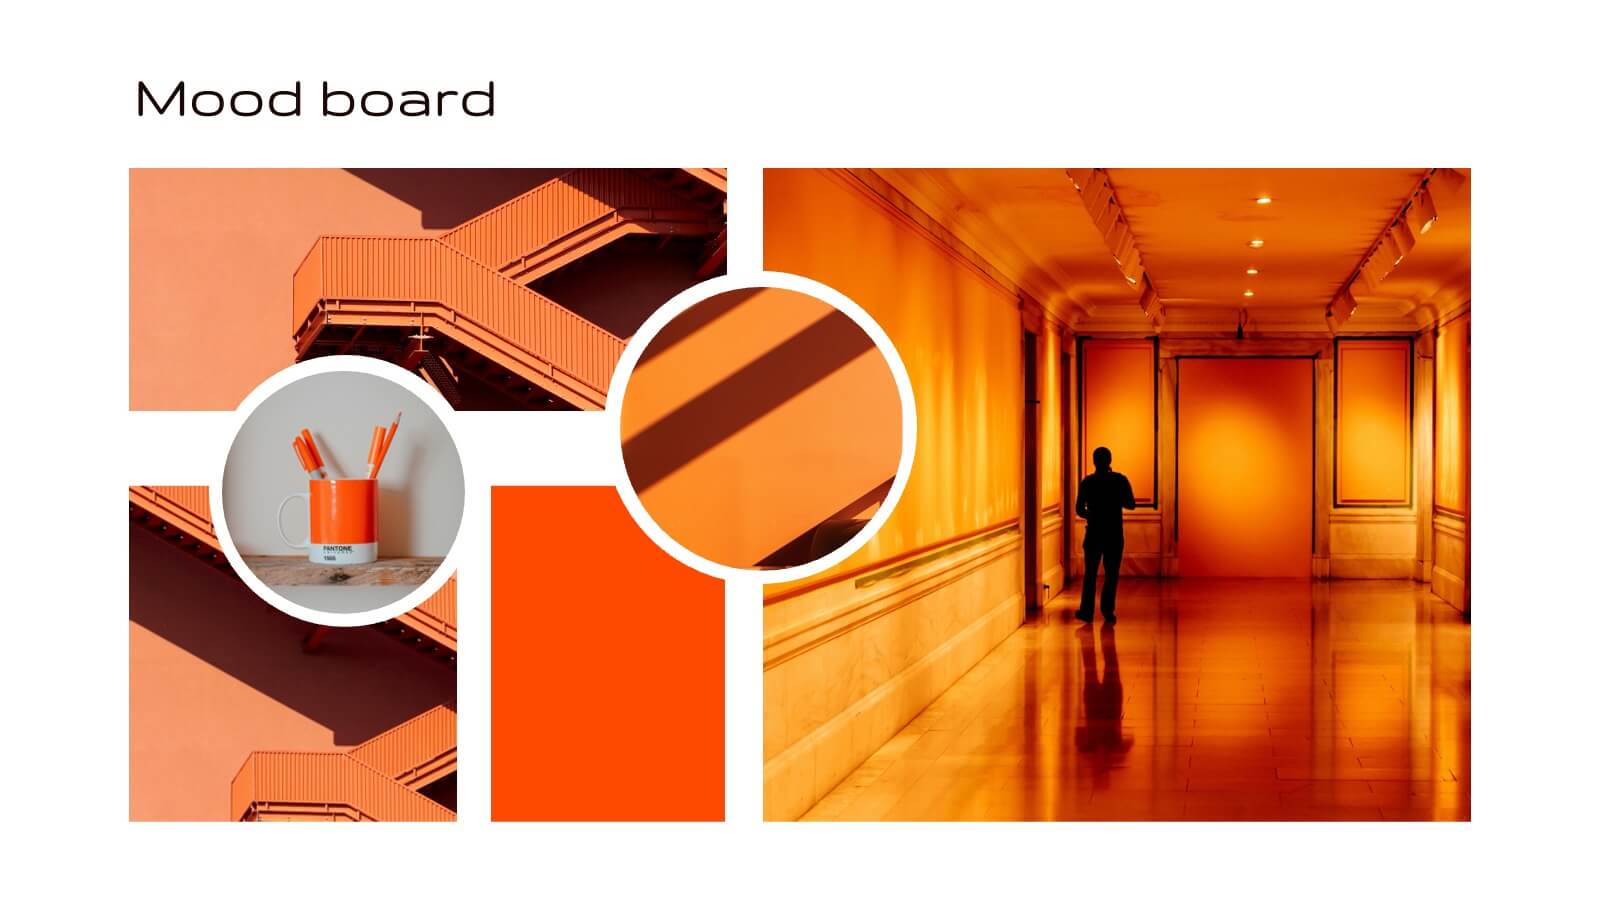
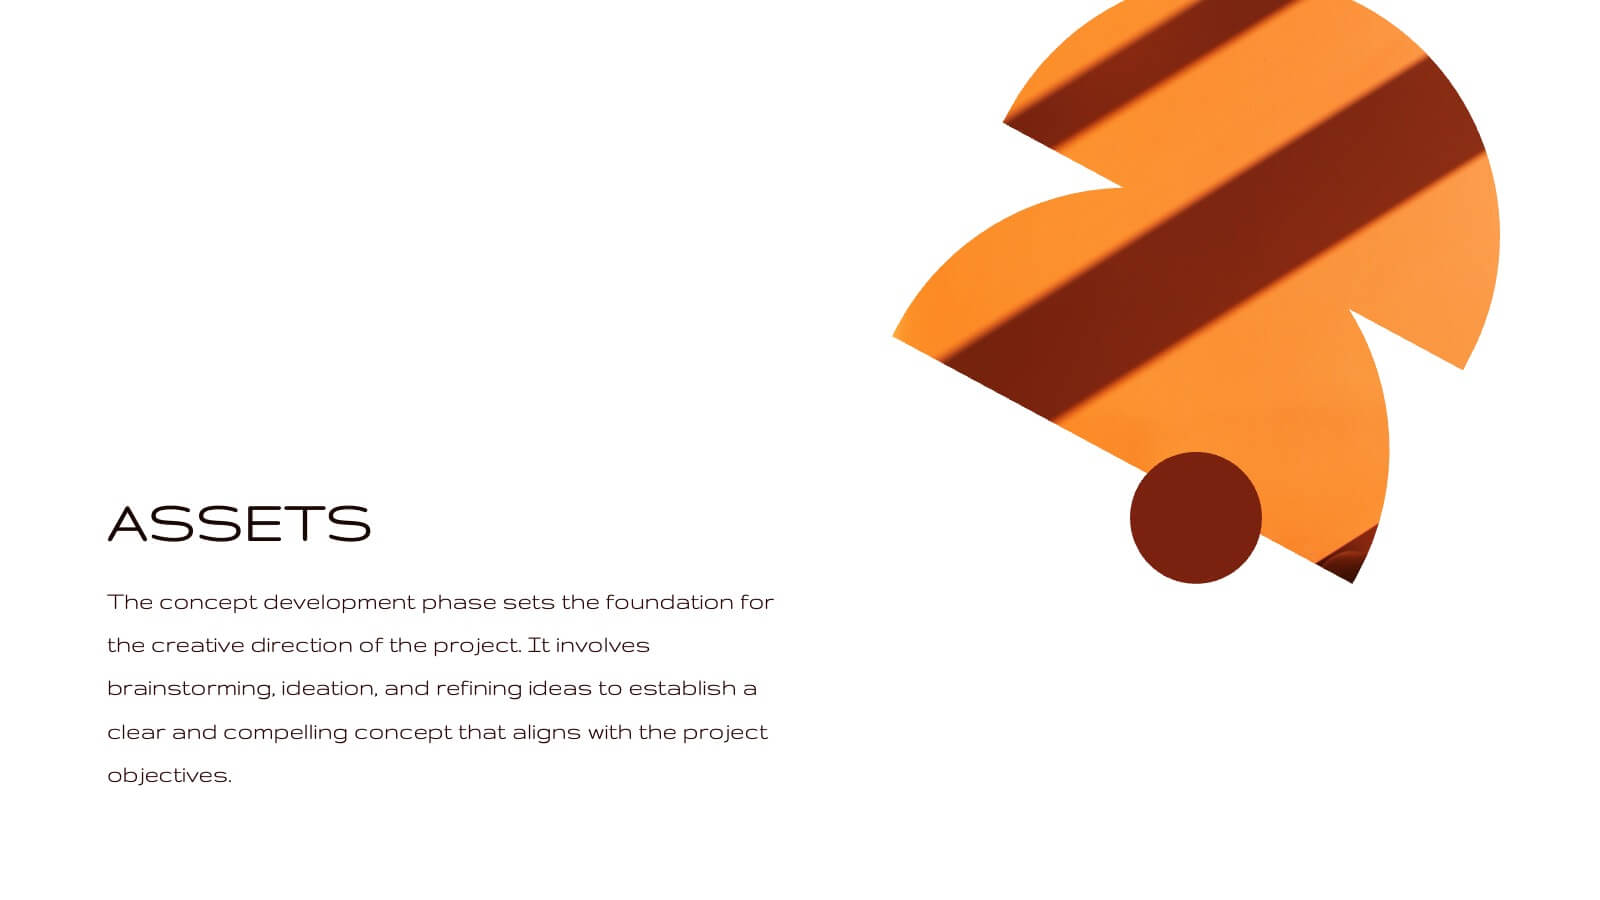
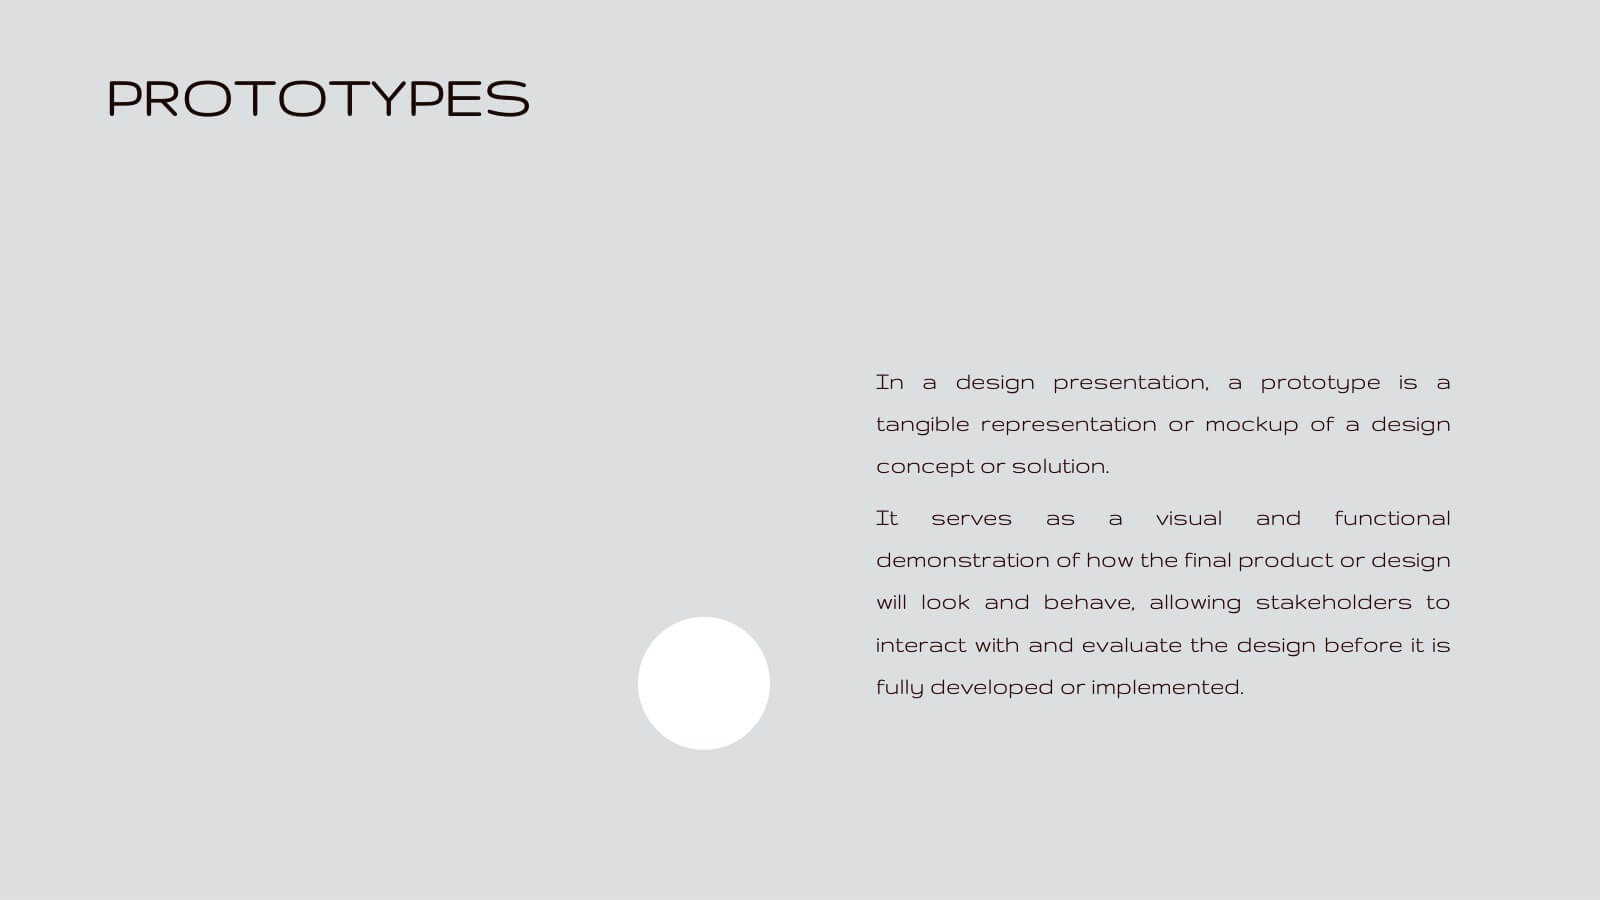
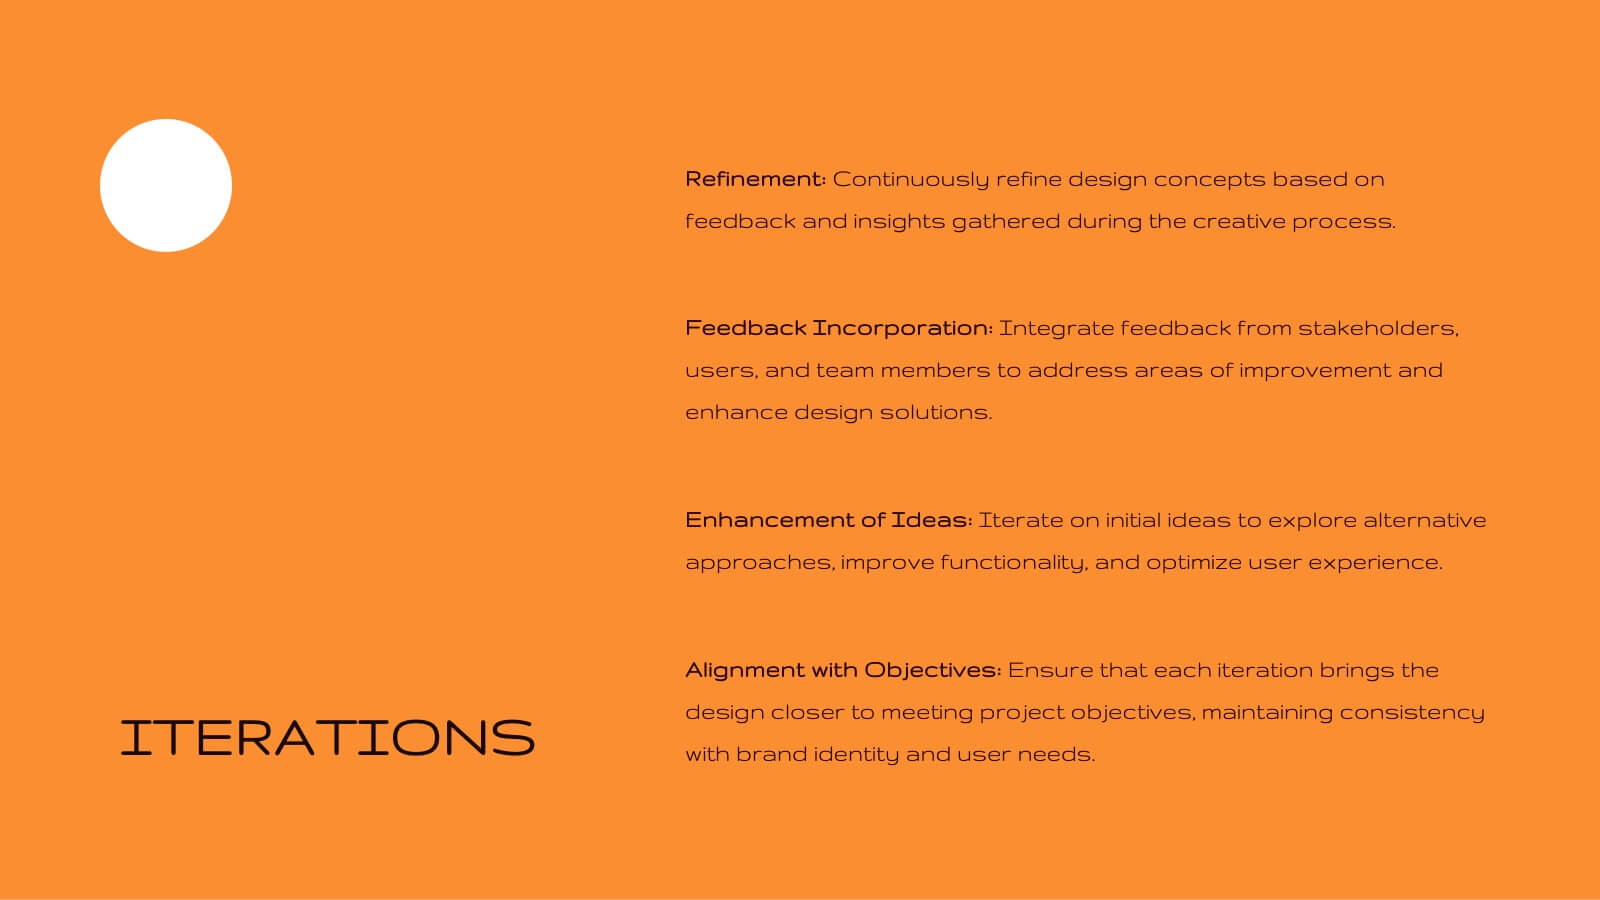
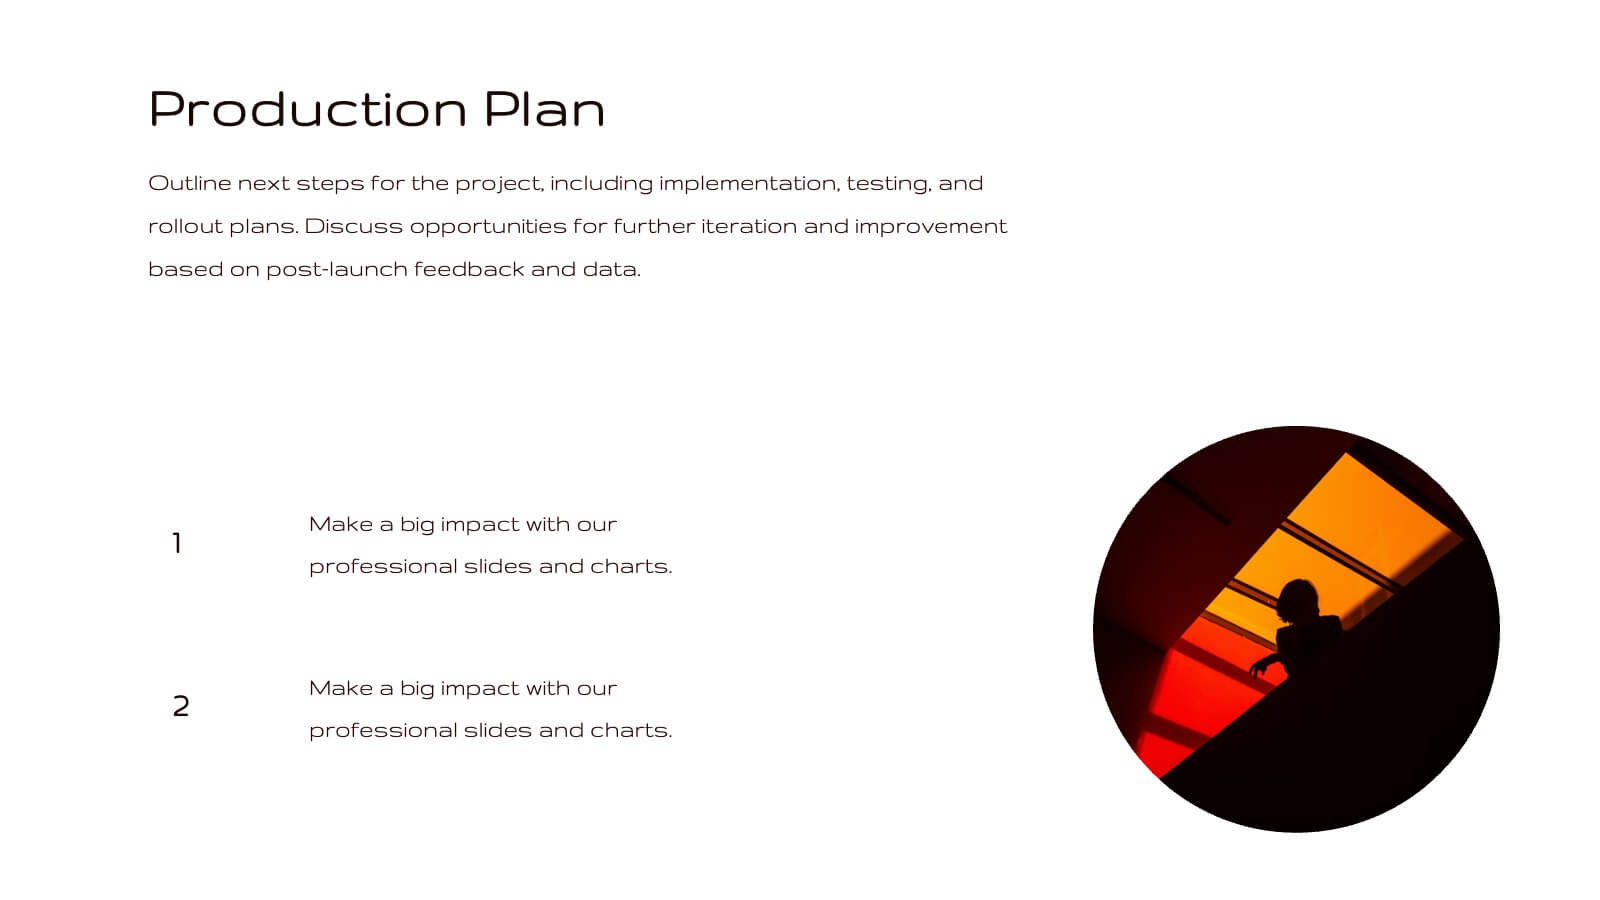
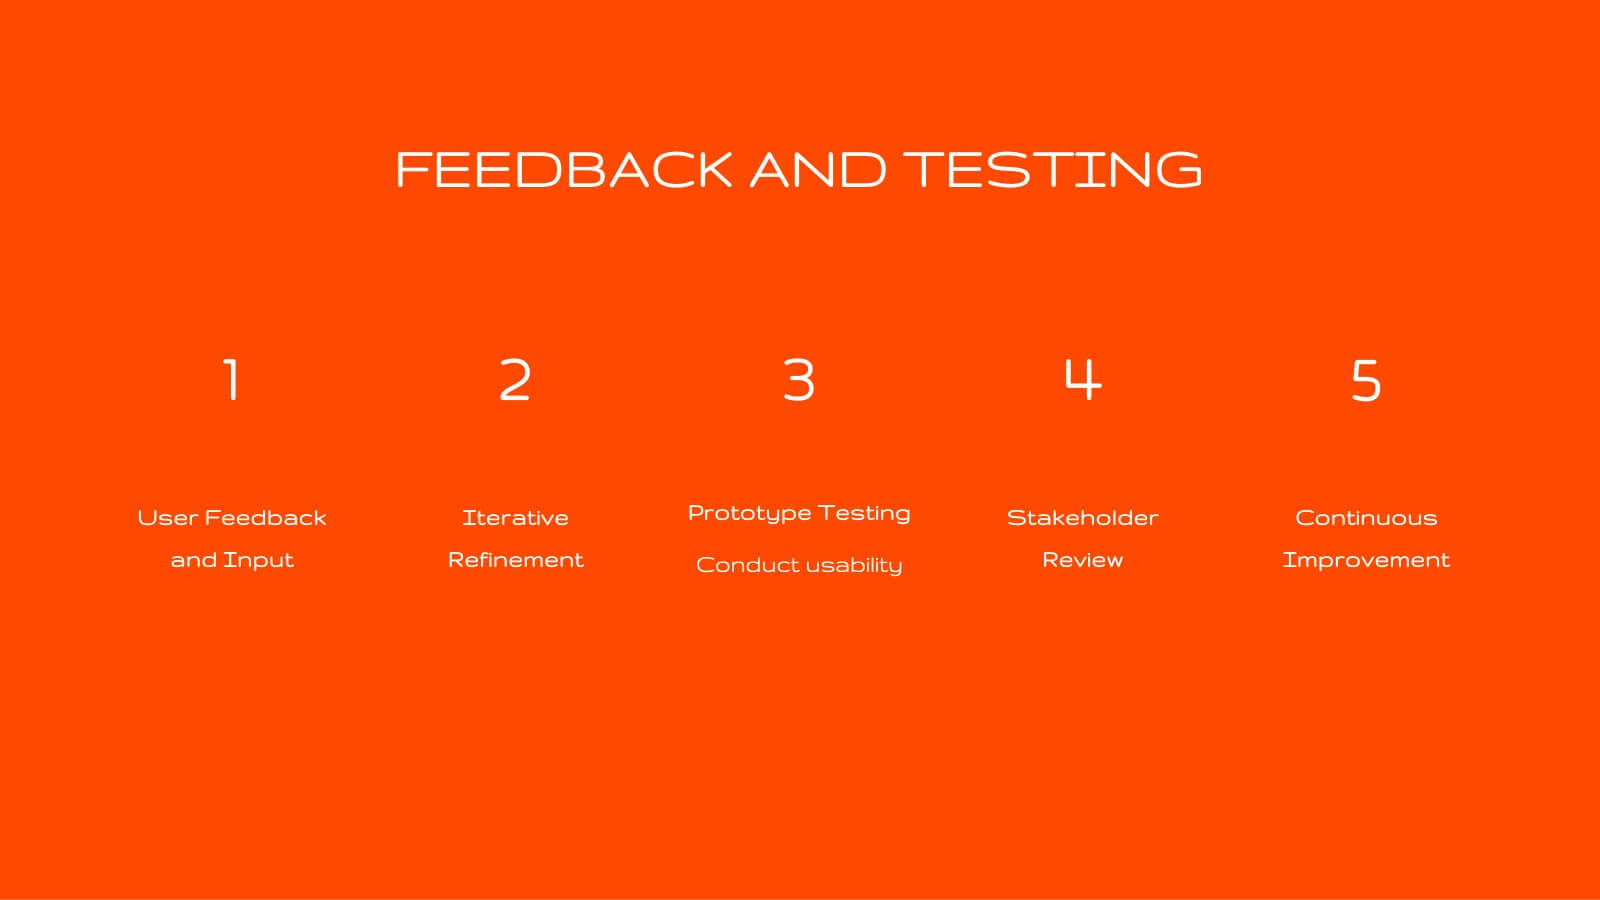
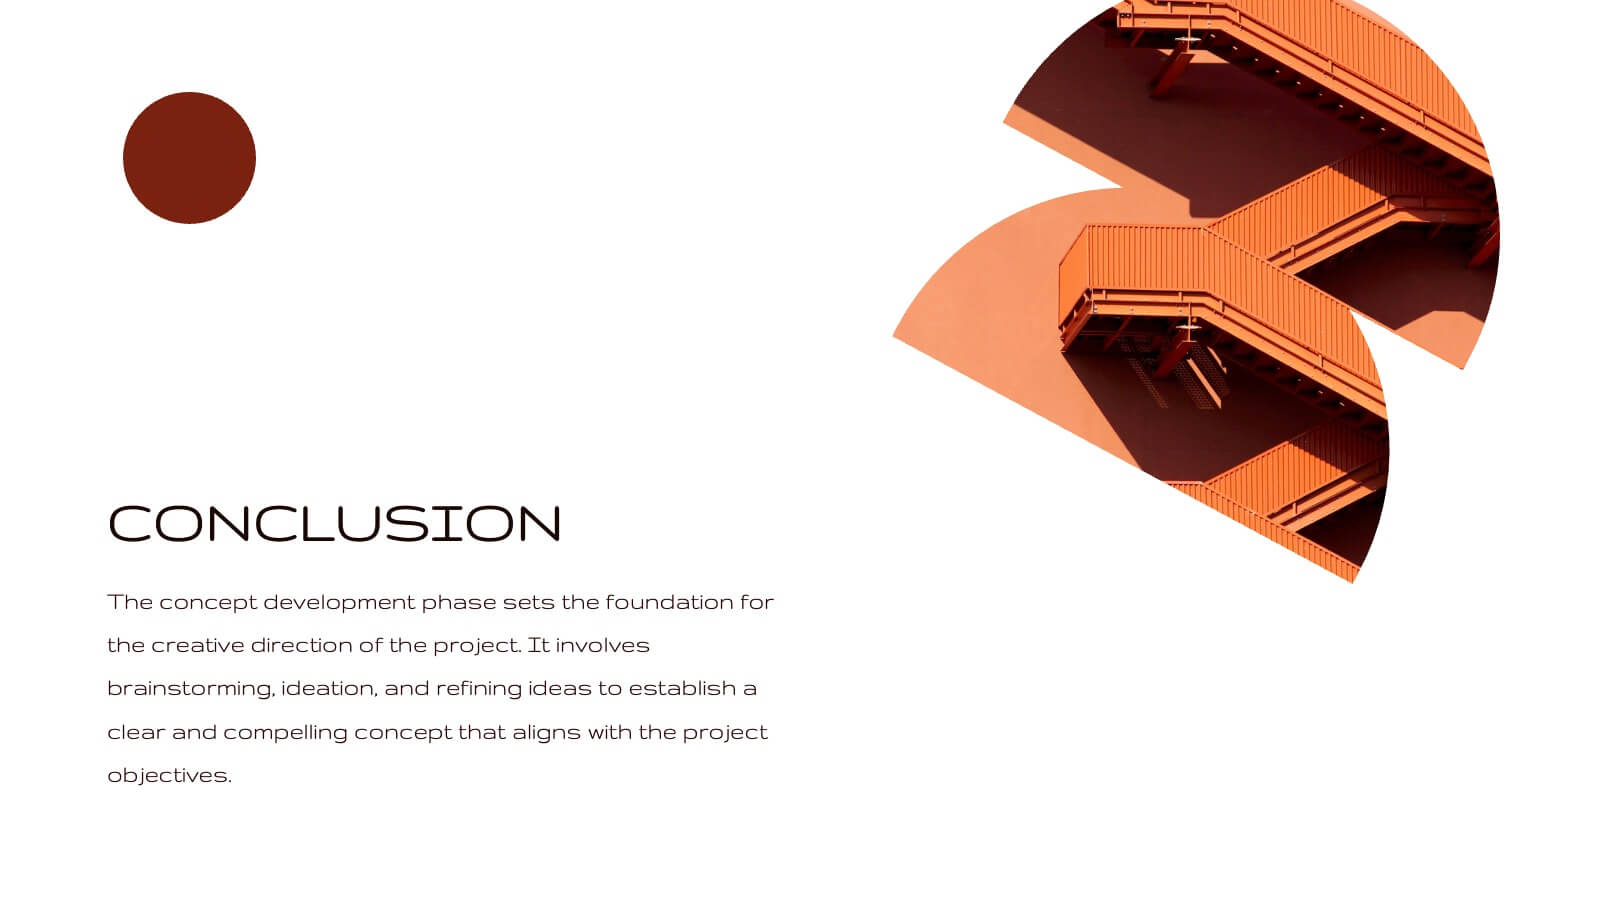
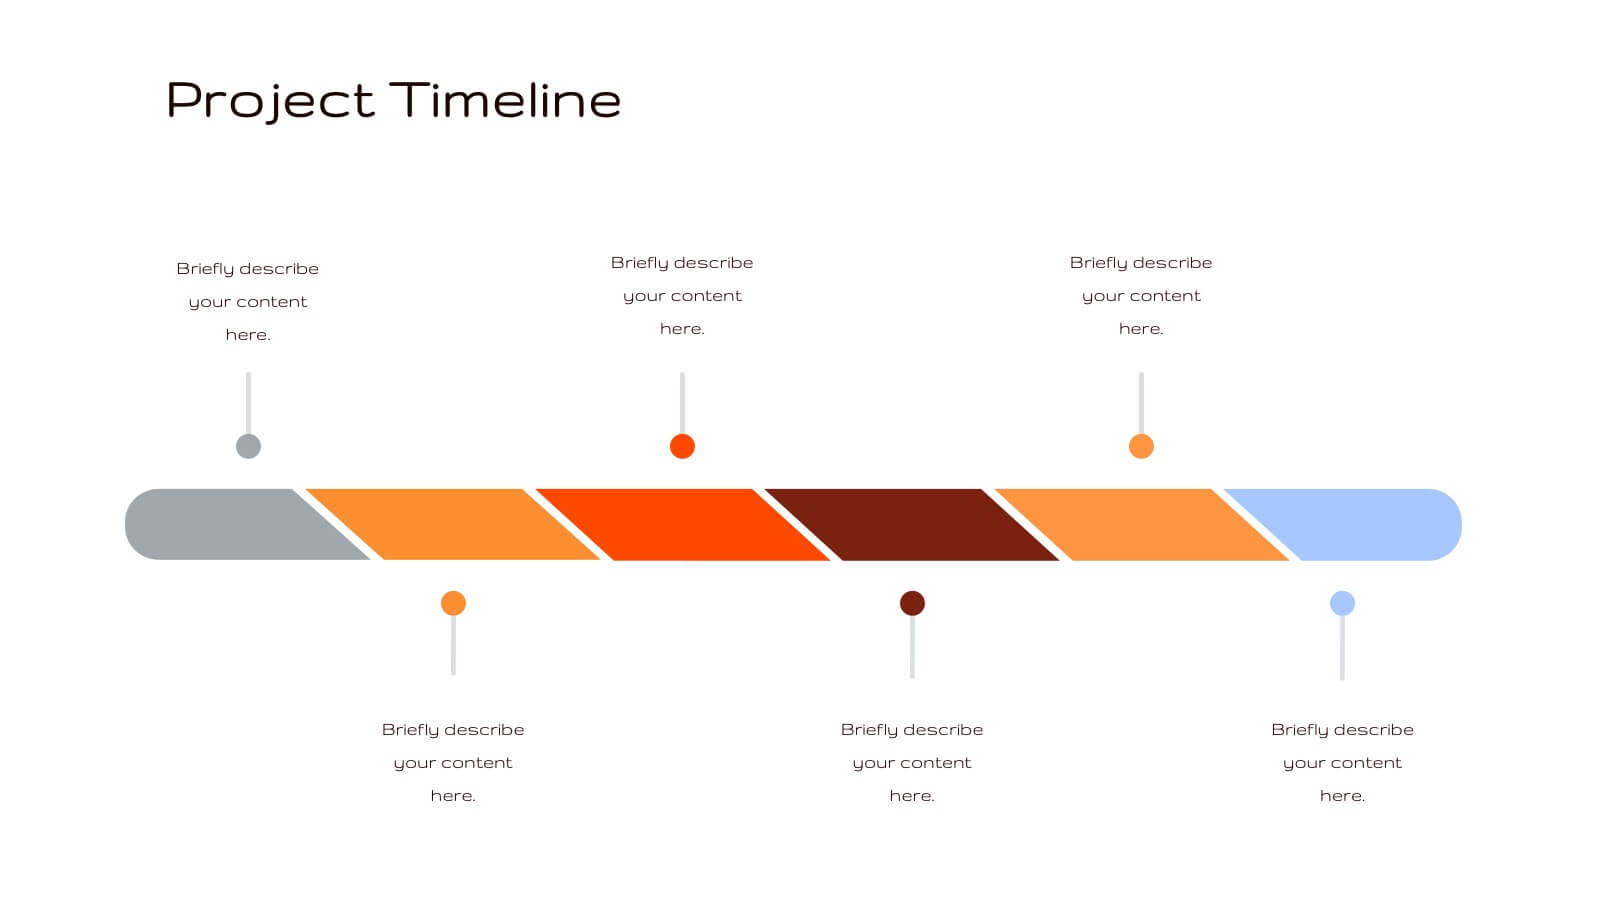
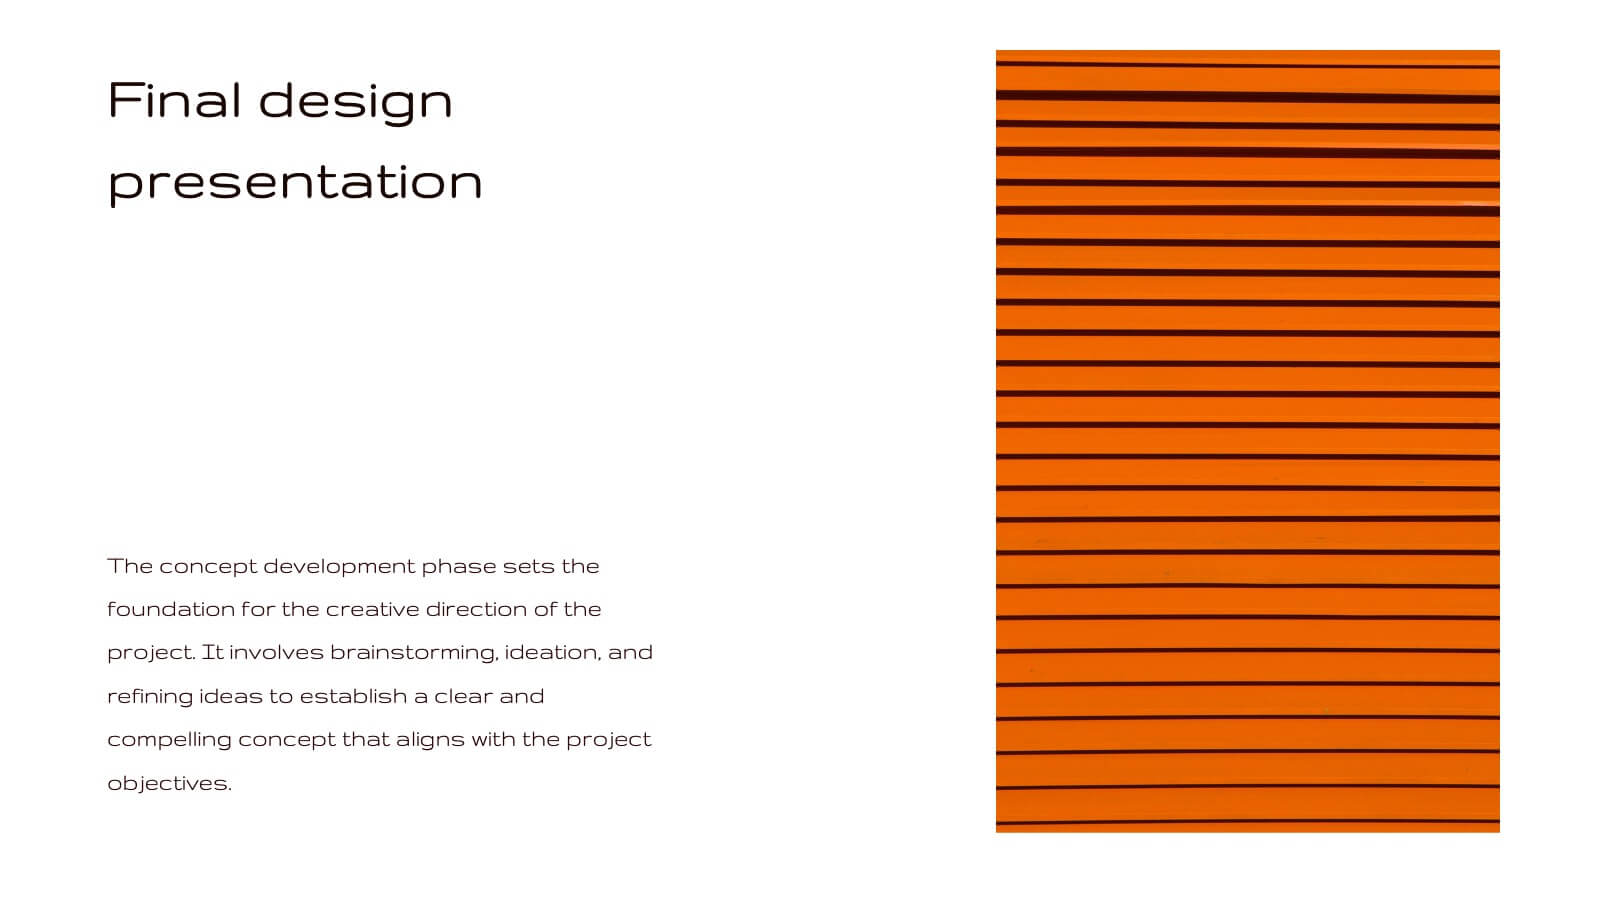
Radiance Creative Design Report Presentation
Bring your design ideas to life with this vibrant, engaging presentation template. Ideal for showcasing creative processes, concept development, and project timelines, it features a striking color palette and clean layout. This template is designed to captivate your audience and clearly communicate your design vision. Compatible with PowerPoint, Keynote, and Google Slides, it’s perfect for any platform.


7 diapositivas
AIDA Model Infographic Presentation Template
The AIDA model is the most commonly used marketing communication formula. It describes how people are influenced by advertising, and how brands can use this to their advantage. The AIDA model of marketing is a well-known strategy for organizations to use when presenting products and services. With this template you will be sure you have every element of the AIDA model covered in your presentation. This template will provide you with a perfect and easy way to create your ideal AIDA model presentation. This includes a comprehensive overview of the AIDA marketing funnel and how it works.


6 diapositivas
Editable Puzzle Infographic
Piece together complex data with our Editable Puzzle Infographic, compatible with Powerpoint, Google Slides, and Keynote. This engaging infographic is designed to help presenters visually connect different pieces of information in a cohesive and understandable way. The puzzle pieces are a metaphor for how individual components fit into a larger strategy or concept, making it perfect for collaborative projects or educational models. The infographic is fully customizable, allowing you to adapt the colors, text, and arrangement to fit your specific needs. With this puzzle infographic, you can make your presentations more interactive ensuring your audience can see the big picture every time.


7 diapositivas
PESTEL Framework for External Analysis Presentation
Evaluate external factors with ease using the PESTEL Framework for External Analysis Presentation. This structured layout helps you assess Political, Economic, Social, Technological, Environmental, and Legal influences on your business. Perfect for market research, risk assessment, and strategic planning. Fully customizable in PowerPoint, Canva, and Google Slides.