


Características


¿Tienes alguna pregunta?
Recomendar


6 diapositivas
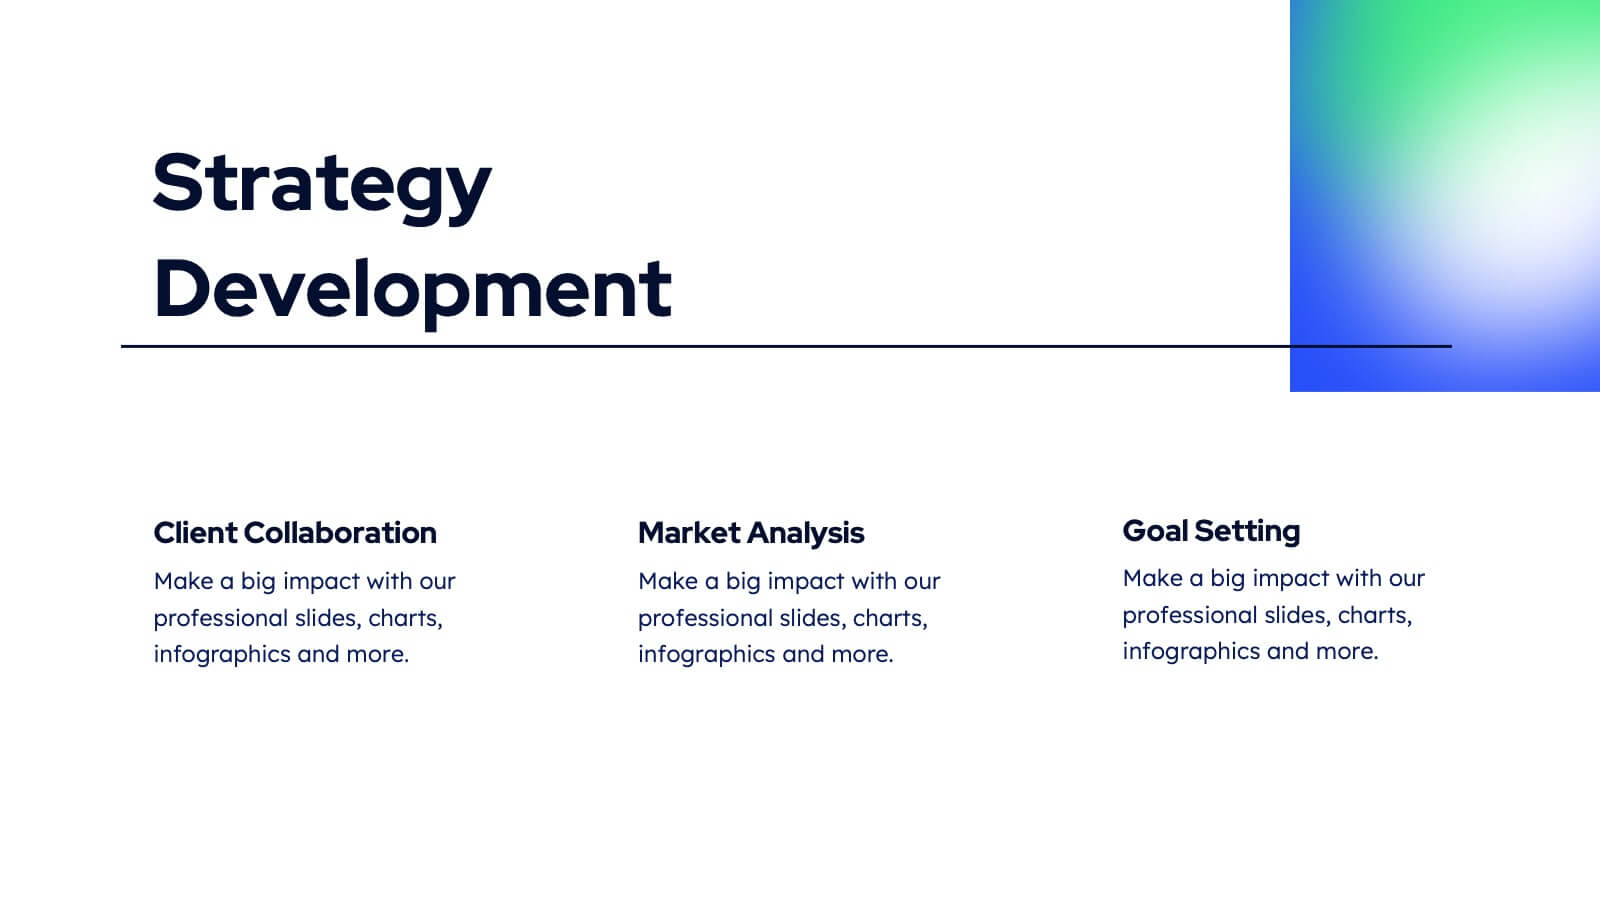
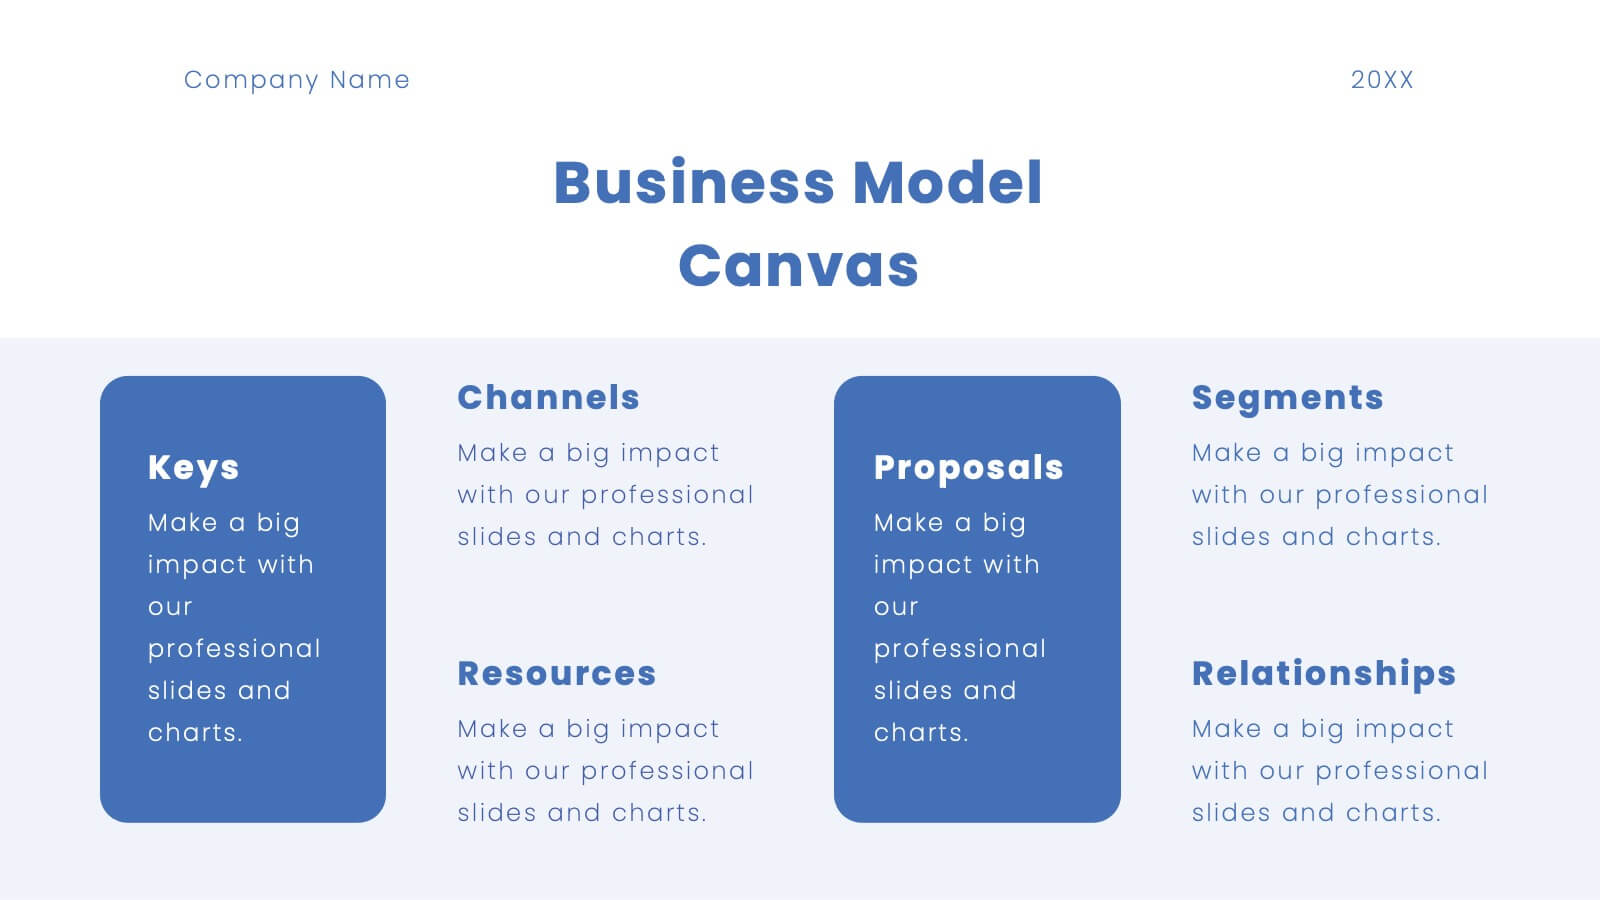
Corporate Framework Planning Presentation
Organize and present your strategic plans with this clean corporate framework layout. Ideal for showcasing six key areas of focus, this slide helps communicate business insights, goals, and execution pillars clearly. Fully editable in Canva, PowerPoint, and Google Slides—perfect for business plans, executive meetings, or internal project reviews.


7 diapositivas
Gantt Chart Infographic Presentation Template
A Gantt chart is a graphic chart that illustrates the start and finish dates of project activities, and its tasks or events between a start and finish date. The resulting charts are often used to depict the relationship between individual tasks in addition to their dependencies and duration estimates. This Gantt chart template is easy to use, and allows you to adjust start and end dates with a simple drag and drop. This template is designed to help you start organizing your project by identifying tasks and dependencies on those tasks, without overwhelming you with a comprehensive layout.
22 diapositivas
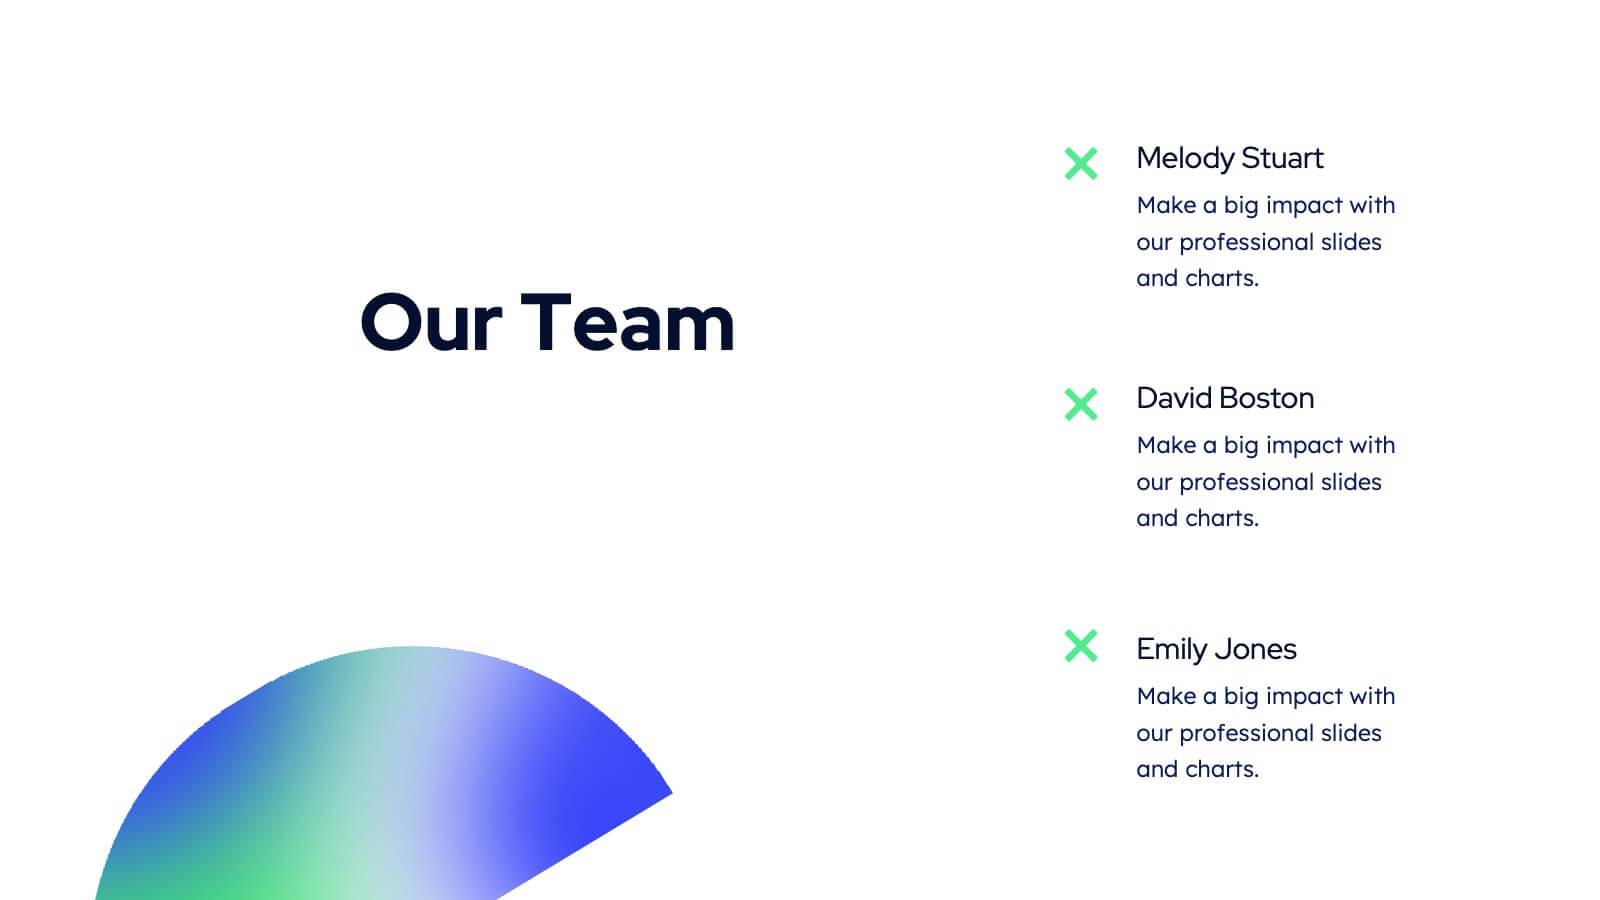
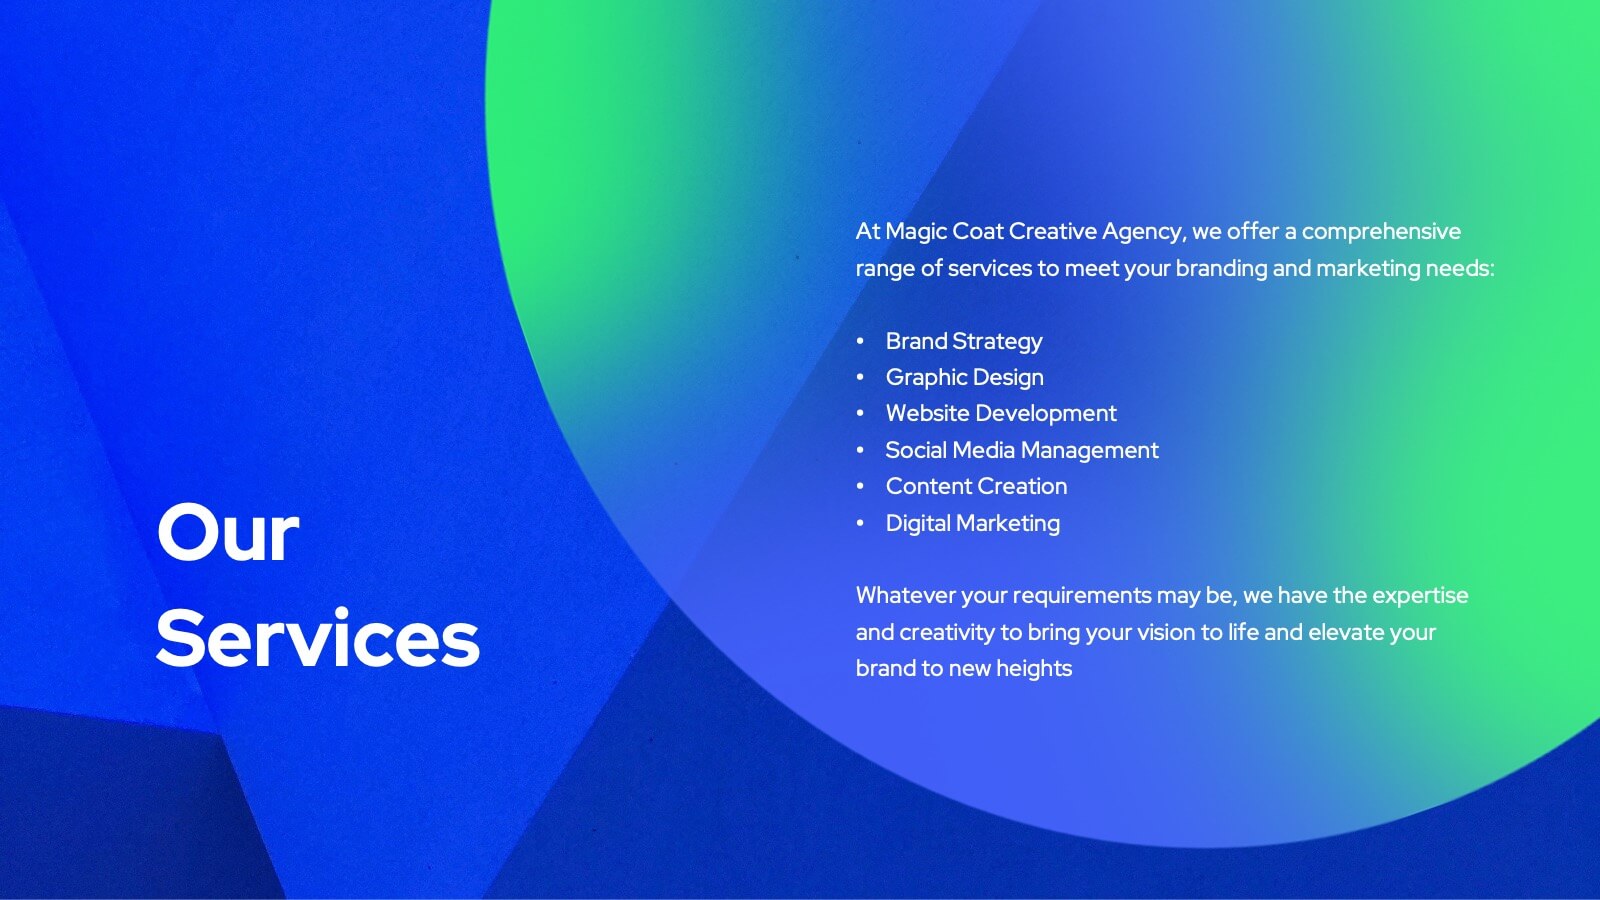
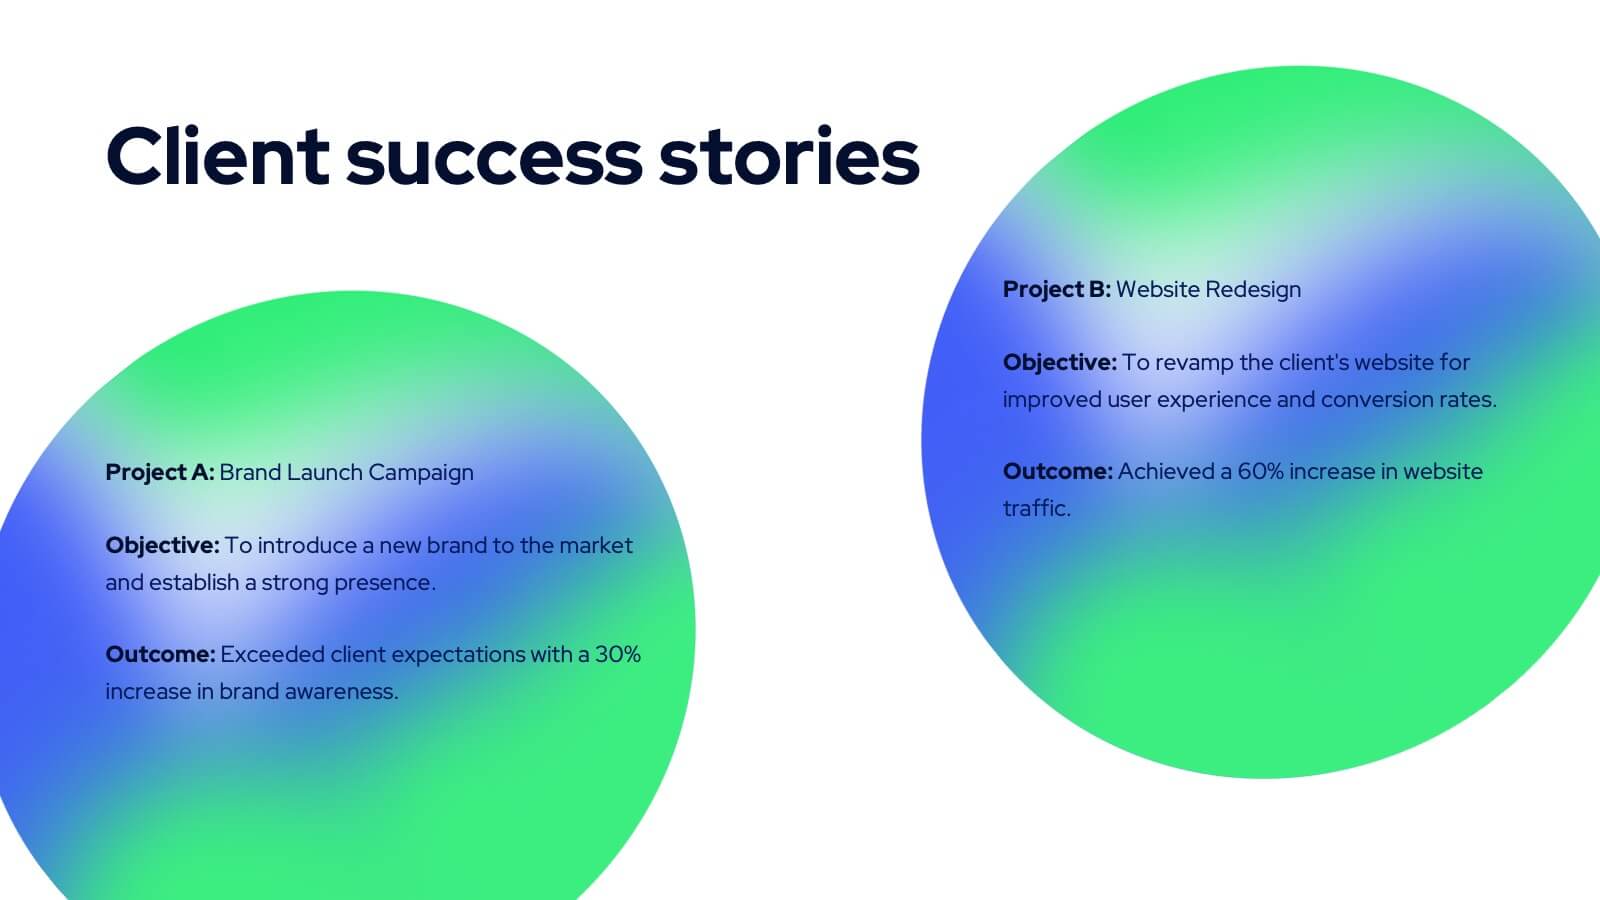
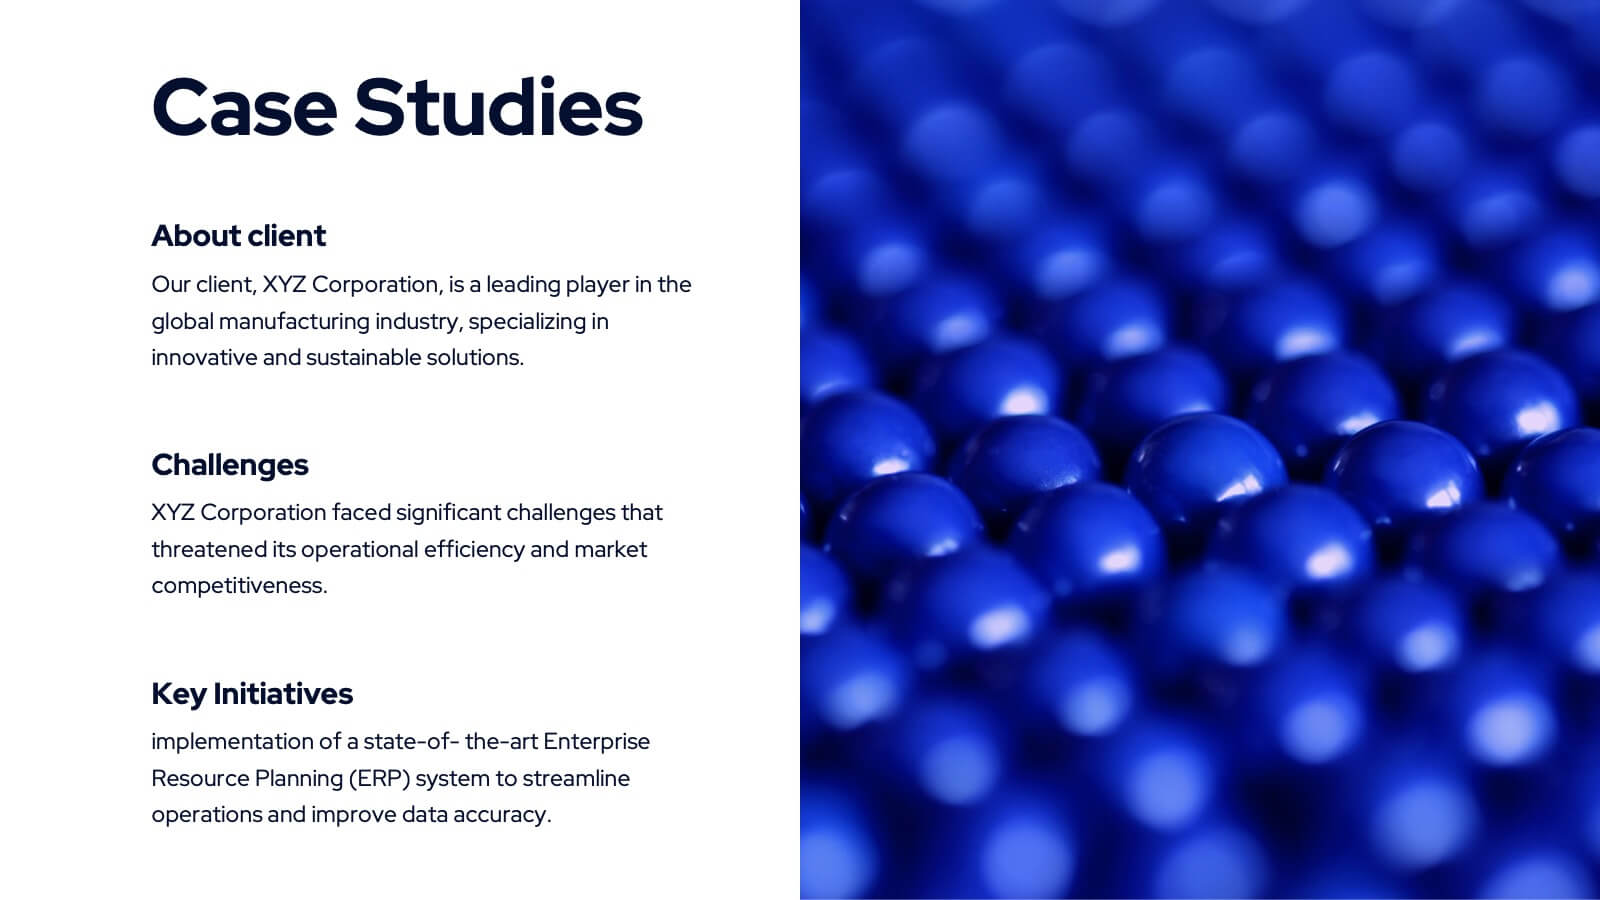
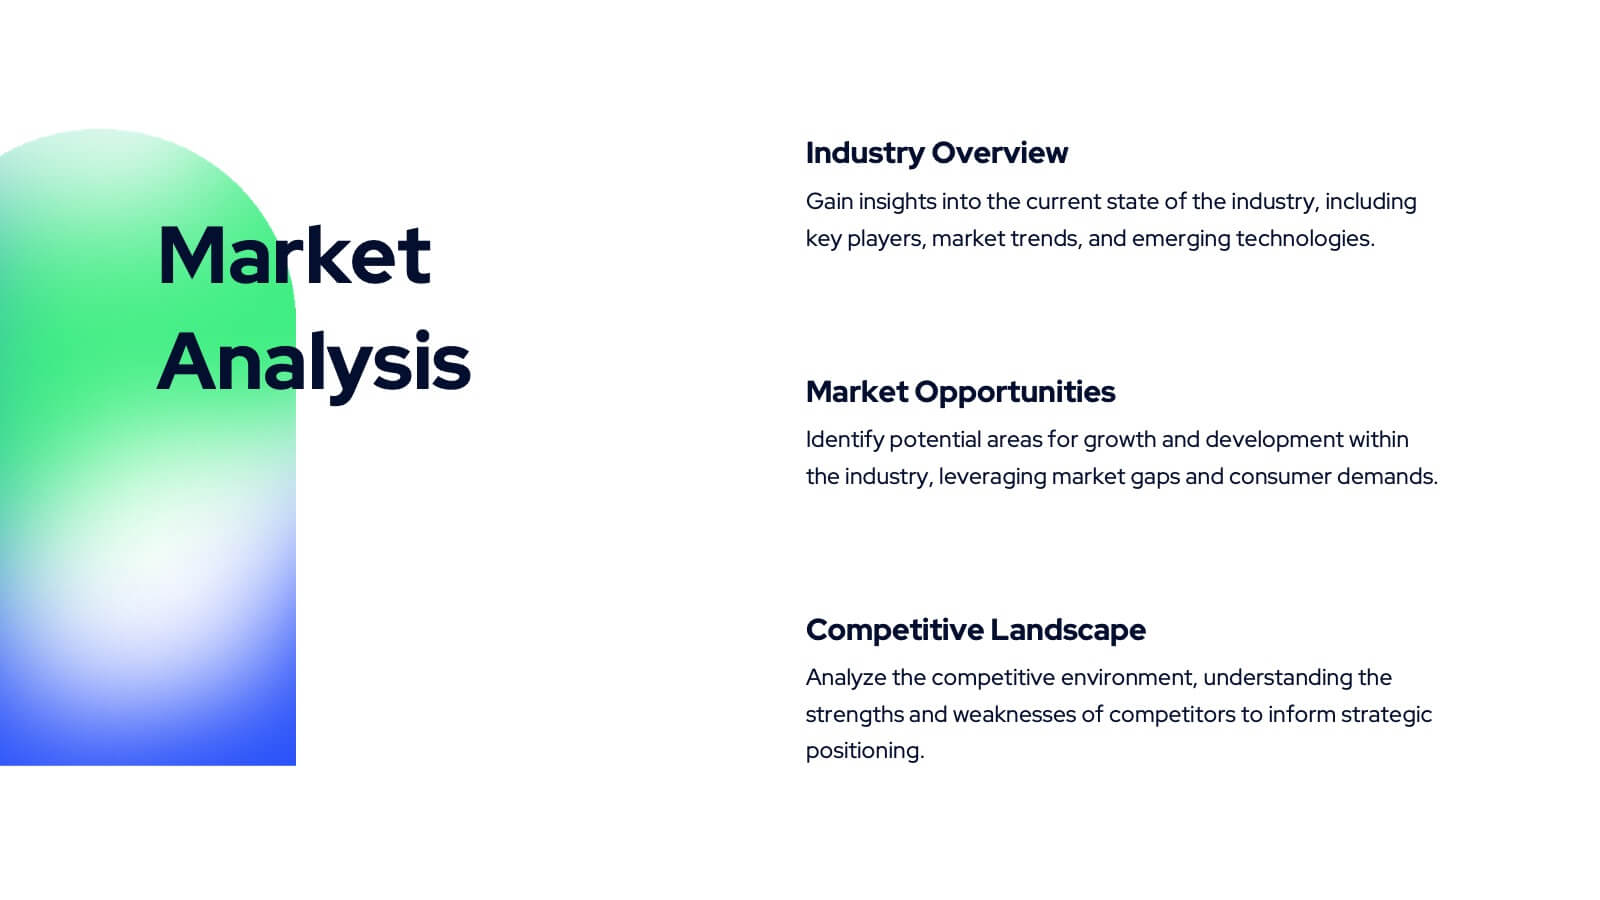
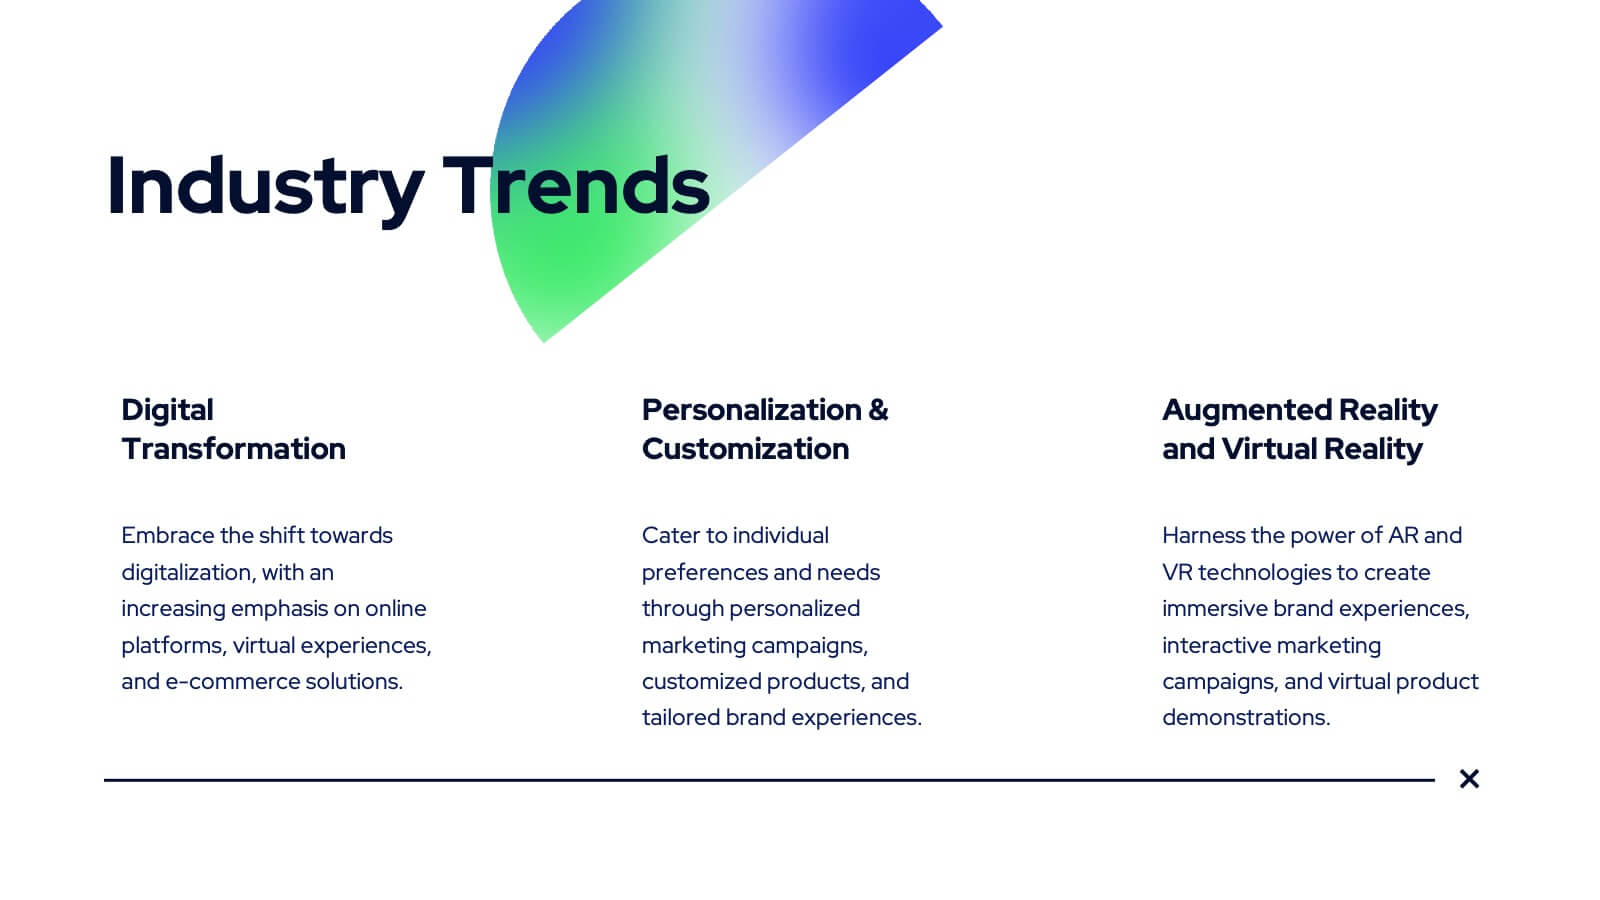
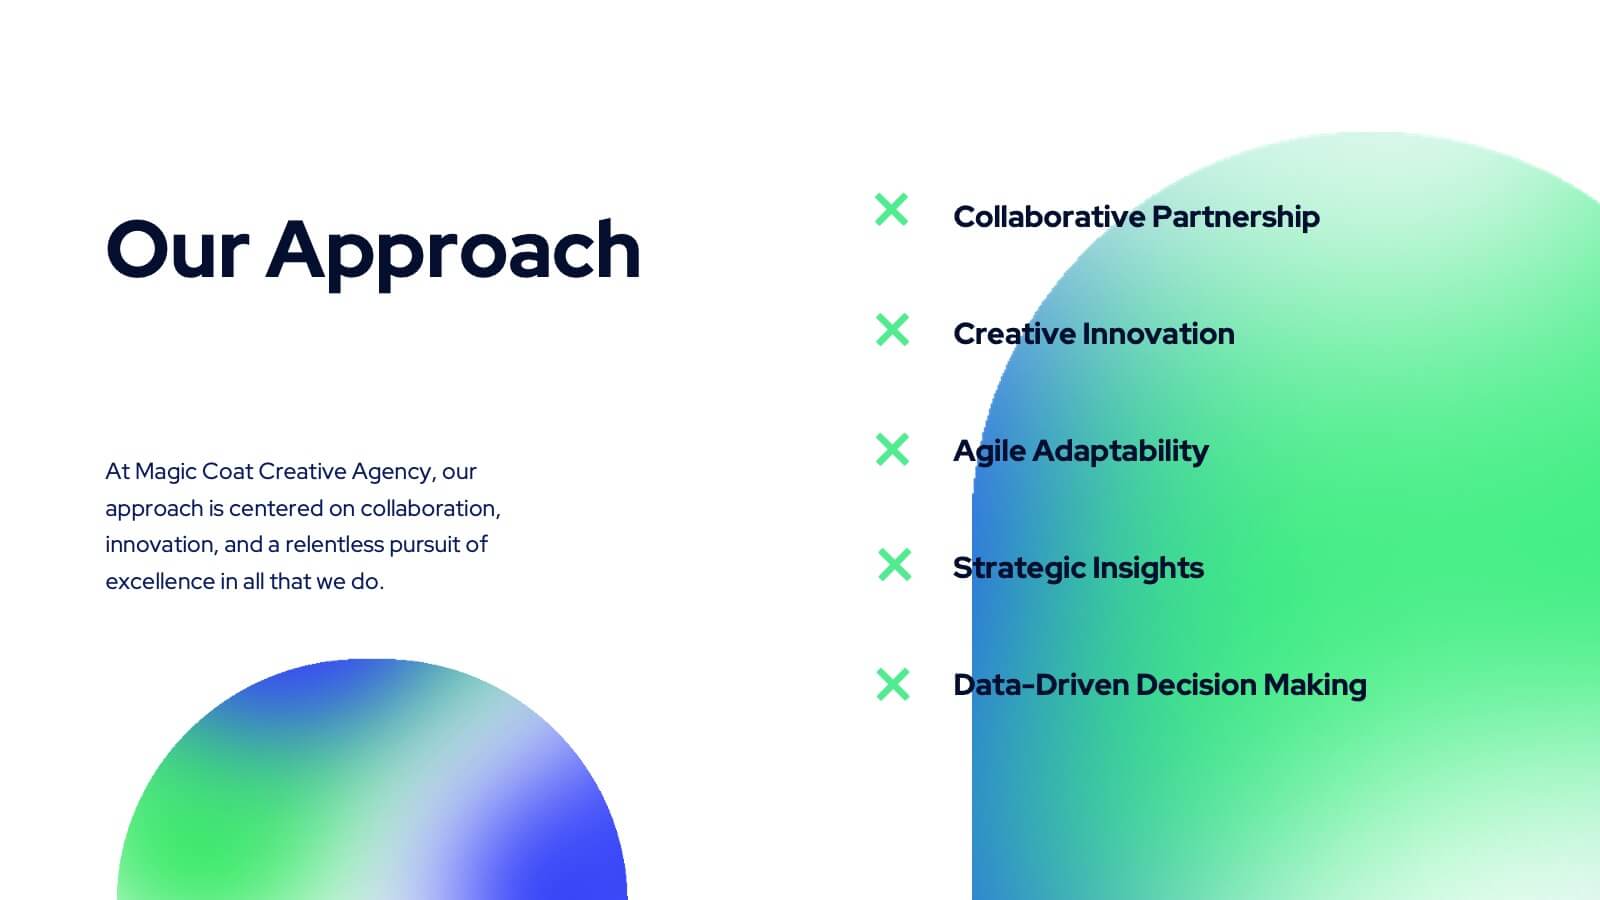
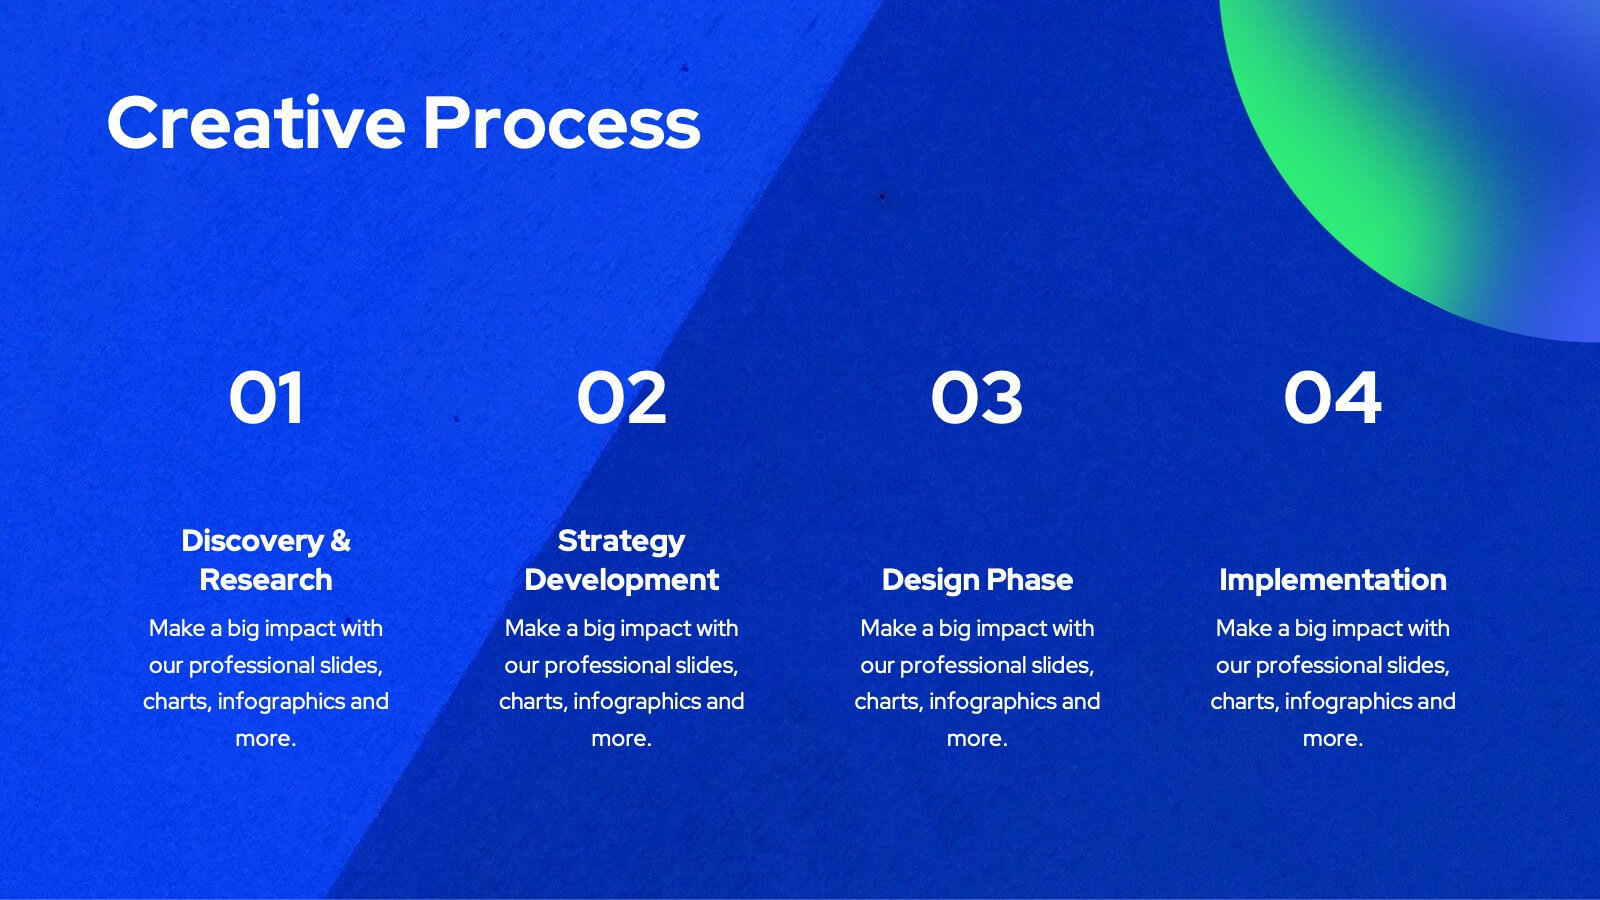
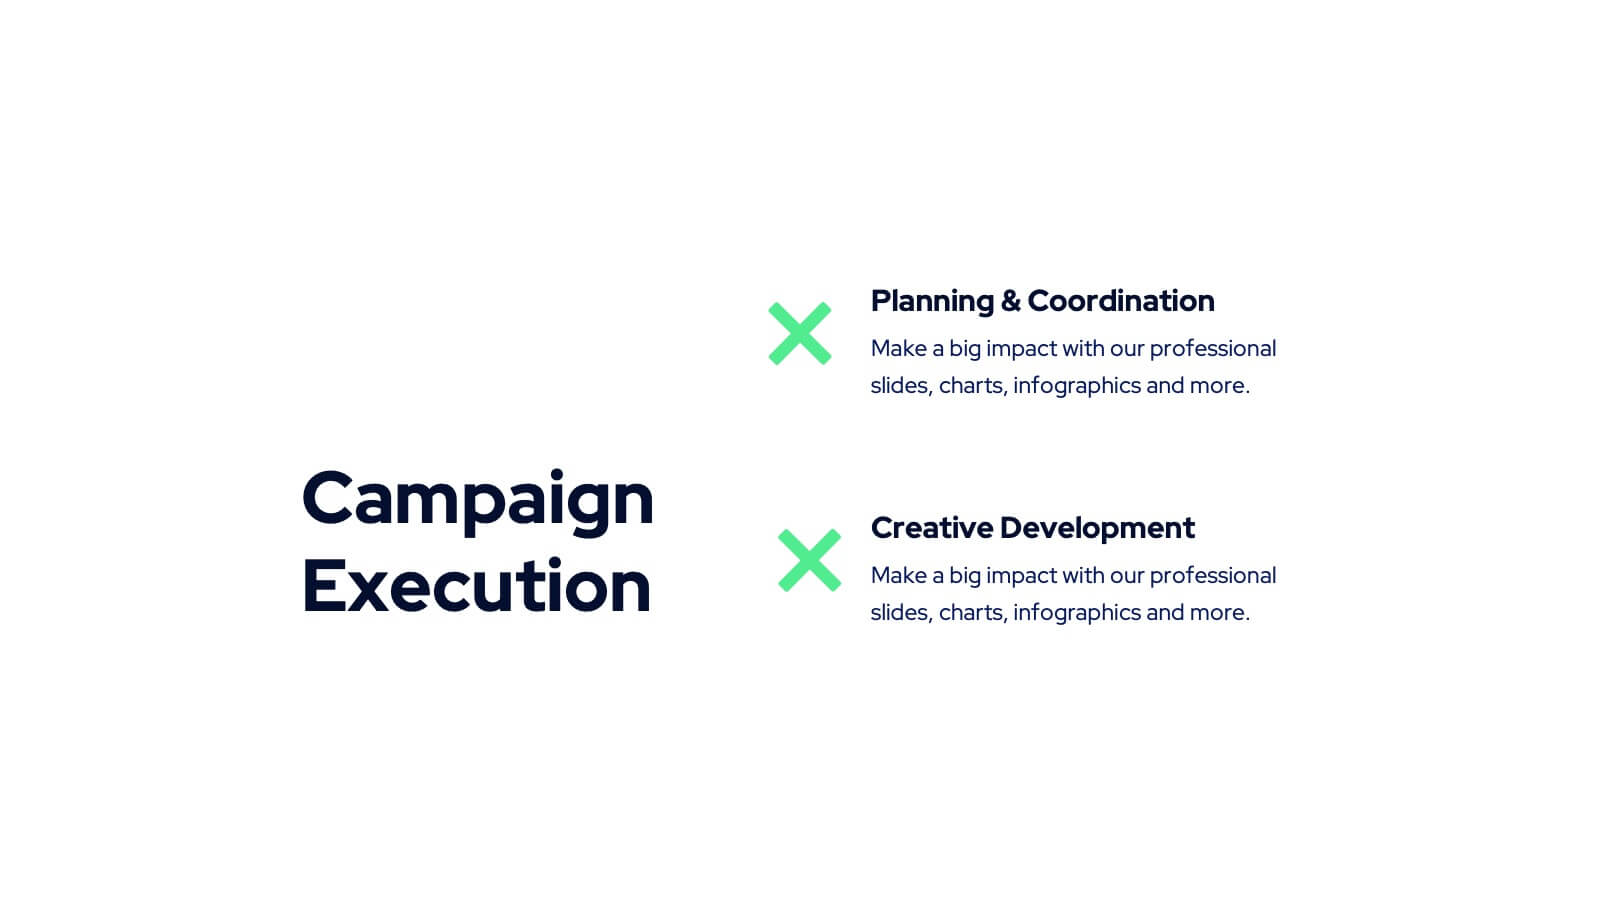
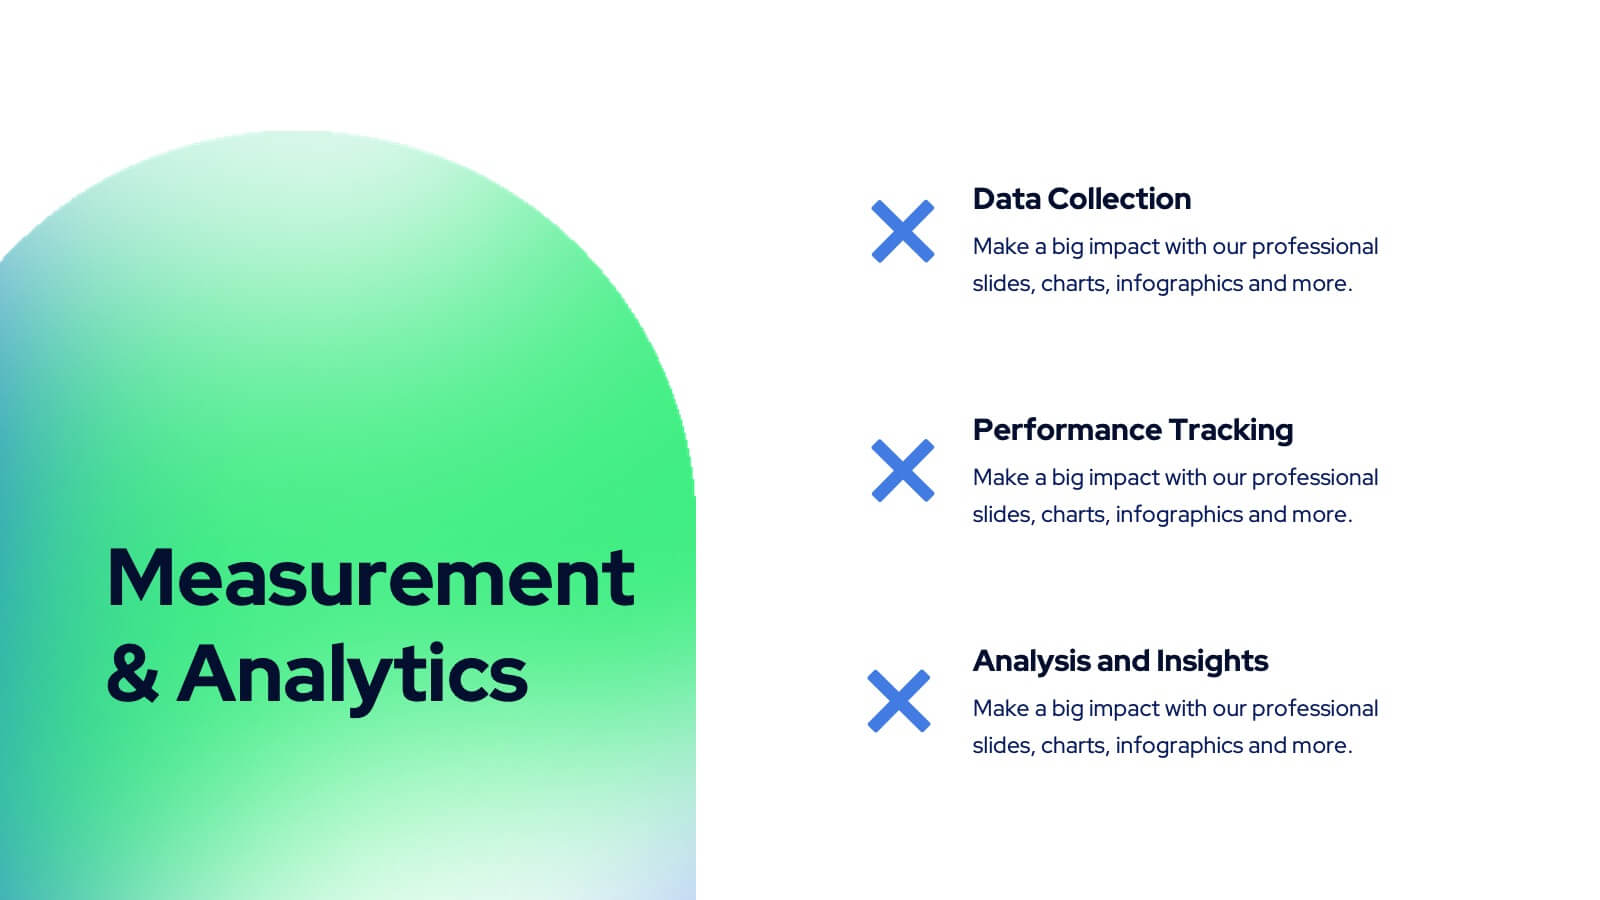
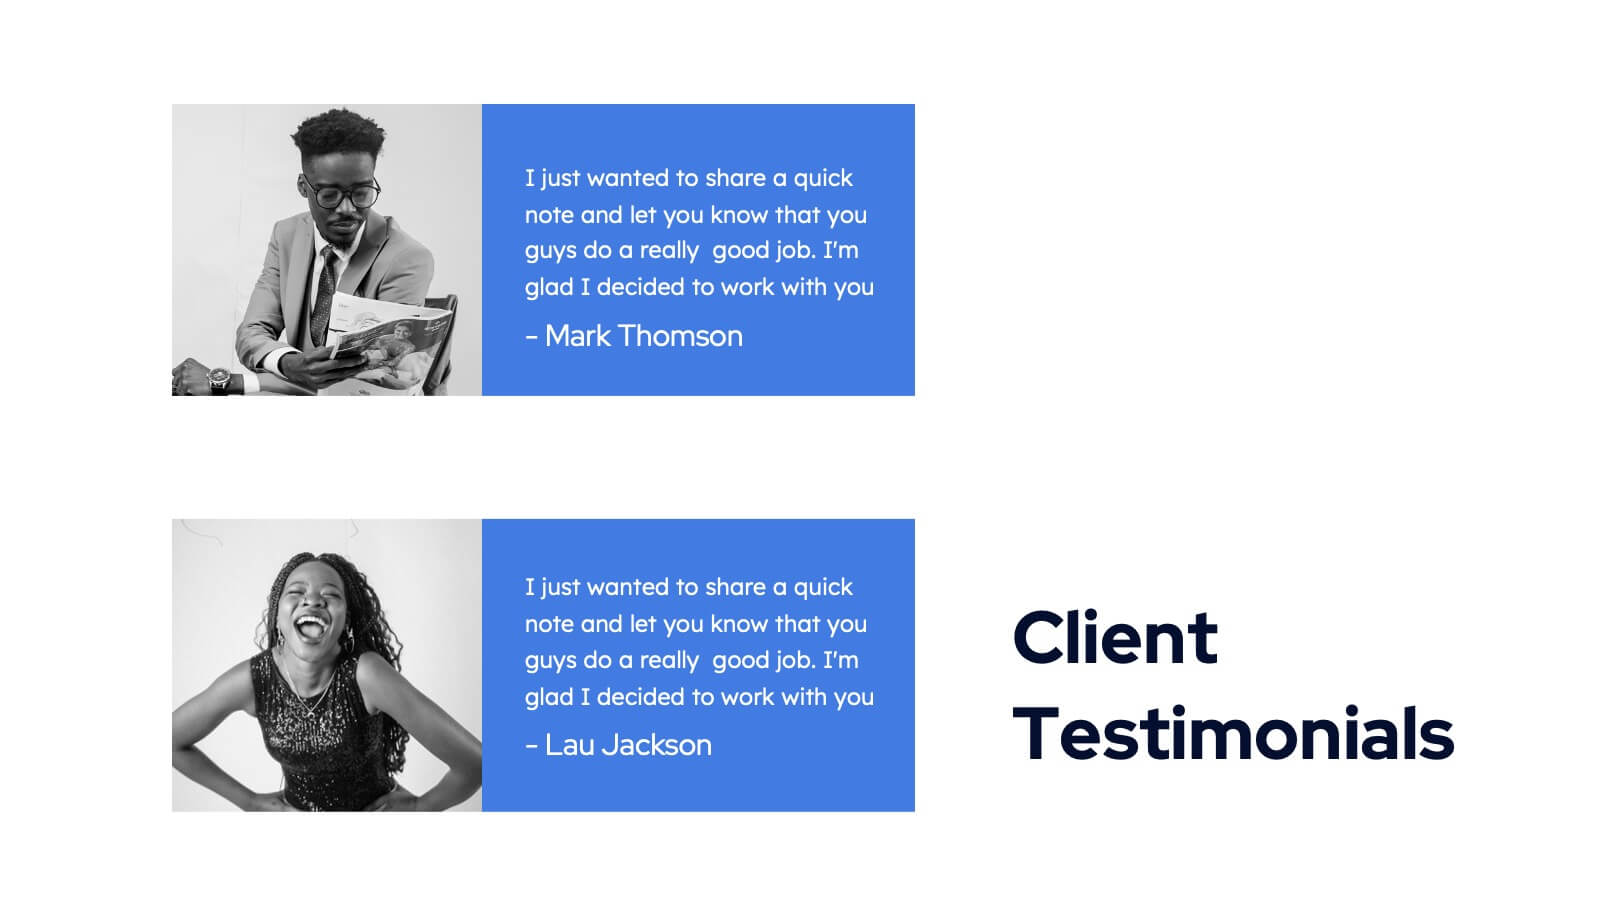
Tanzanite Full-Service Agency Project Plan Presentation
Showcase your agency's strengths with this bold and modern portfolio presentation template! From client success stories and case studies to market analysis and strategy development, this template highlights your expertise and approach. Perfect for agencies looking to present their services, creative processes, and partnerships. Compatible with PowerPoint, Keynote, and Google Slides, making it easy to impress any audience.


6 diapositivas
Business Growth Metrics Butterfly Chart
Highlight performance patterns and opportunities with the Business Growth Metrics Butterfly Chart Presentation. This engaging layout uses mirrored radial segments to present six growth indicators—ideal for tracking progress across two categories, departments, or timeframes. The butterfly-shaped curves draw the viewer’s attention to the center, making comparisons intuitive and visually balanced. Fully customizable in PowerPoint, Keynote, and Google Slides, this template is perfect for showcasing KPI trends, sales metrics, or marketing performance.


4 diapositivas
Sales Strategy 30-60-90 Day Plan
Accelerate your sales team’s performance with this 30-60-90 Day Strategy template. Designed with clean circular progress visuals and clear milestone stages, it helps you outline sales goals, track onboarding, and align strategic efforts. Ideal for new hires, quarterly planning, or sales enablement. Fully editable in PowerPoint, Keynote, and Google Slides.


7 diapositivas
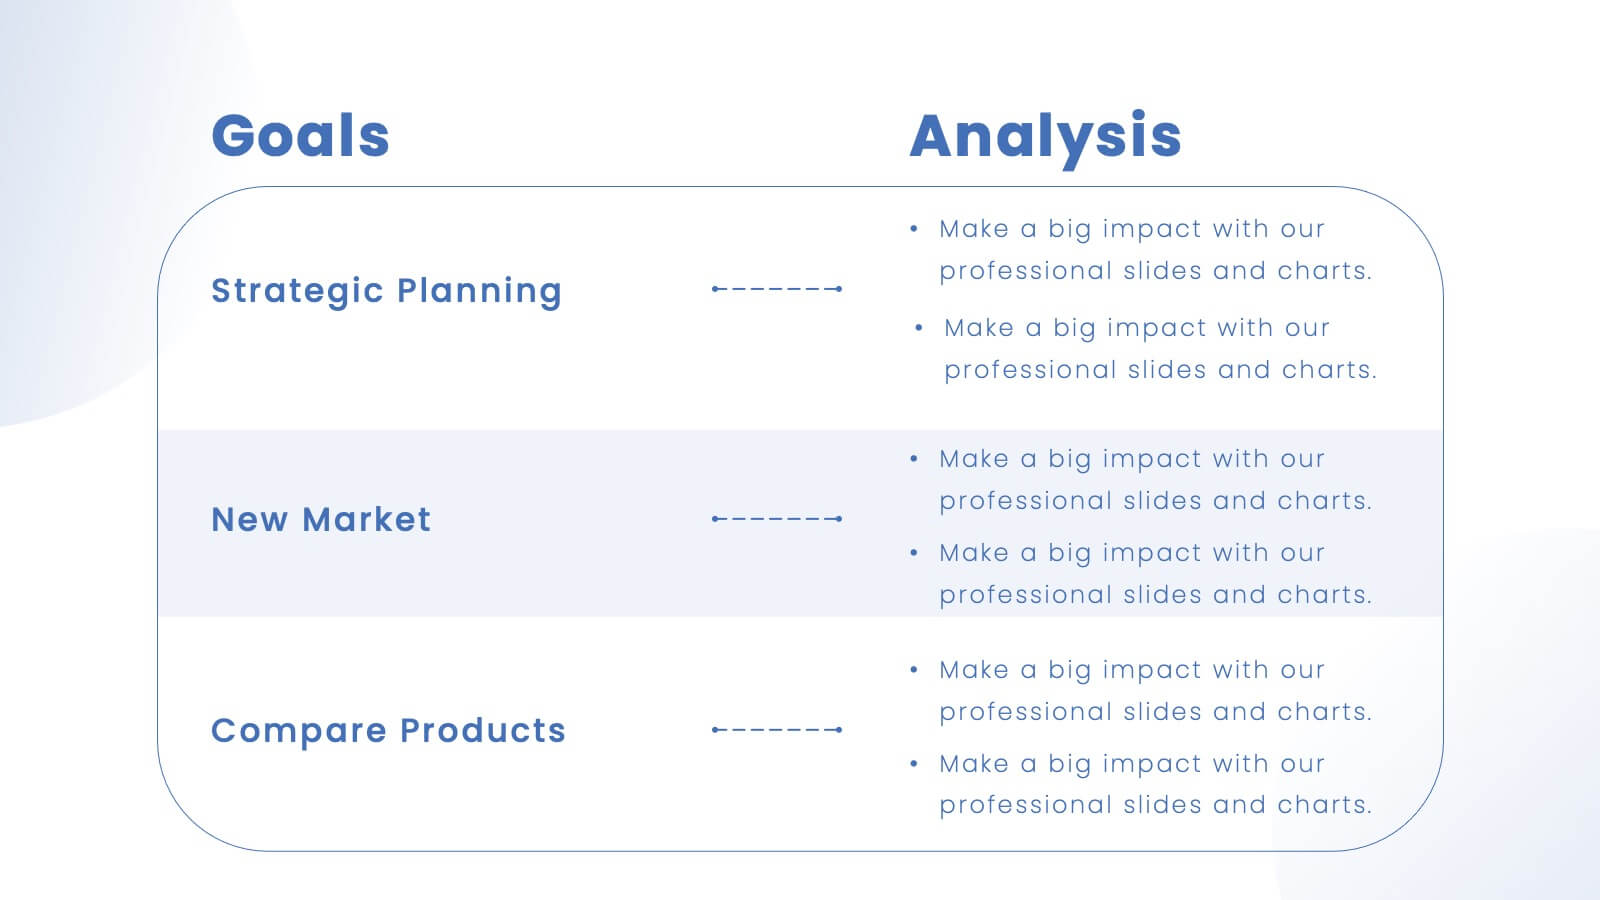
Editable List Slide Presentation
Organize your ideas with style and simplicity using this clean, structured layout designed for clarity and impact. Ideal for summarizing key points, checklists, or action plans, it keeps your content professional and easy to follow. Fully customizable and compatible with PowerPoint, Keynote, and Google Slides for seamless presentation design.


5 diapositivas
Big Data Interpretation and Metrics Presentation
Break down complex data into digestible segments with the Big Data Interpretation and Metrics Presentation. Featuring a puzzle-inspired layout, this template is ideal for illustrating interconnected data points, analytics strategies, or metric-based frameworks. Fully customizable in PowerPoint, Keynote, and Google Slides.


26 diapositivas
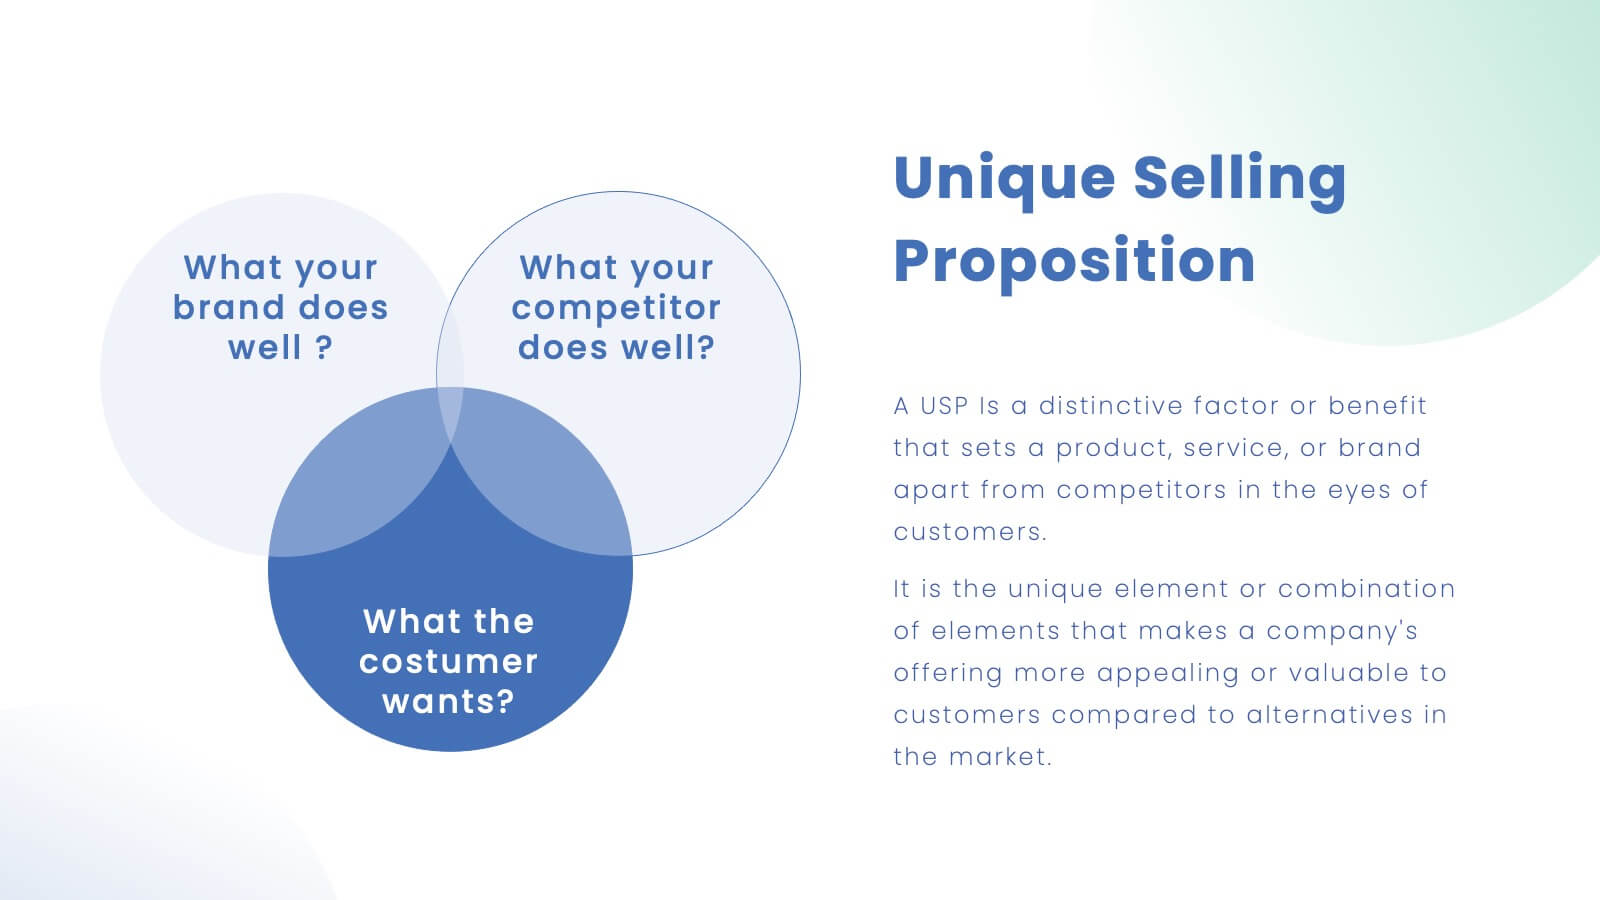
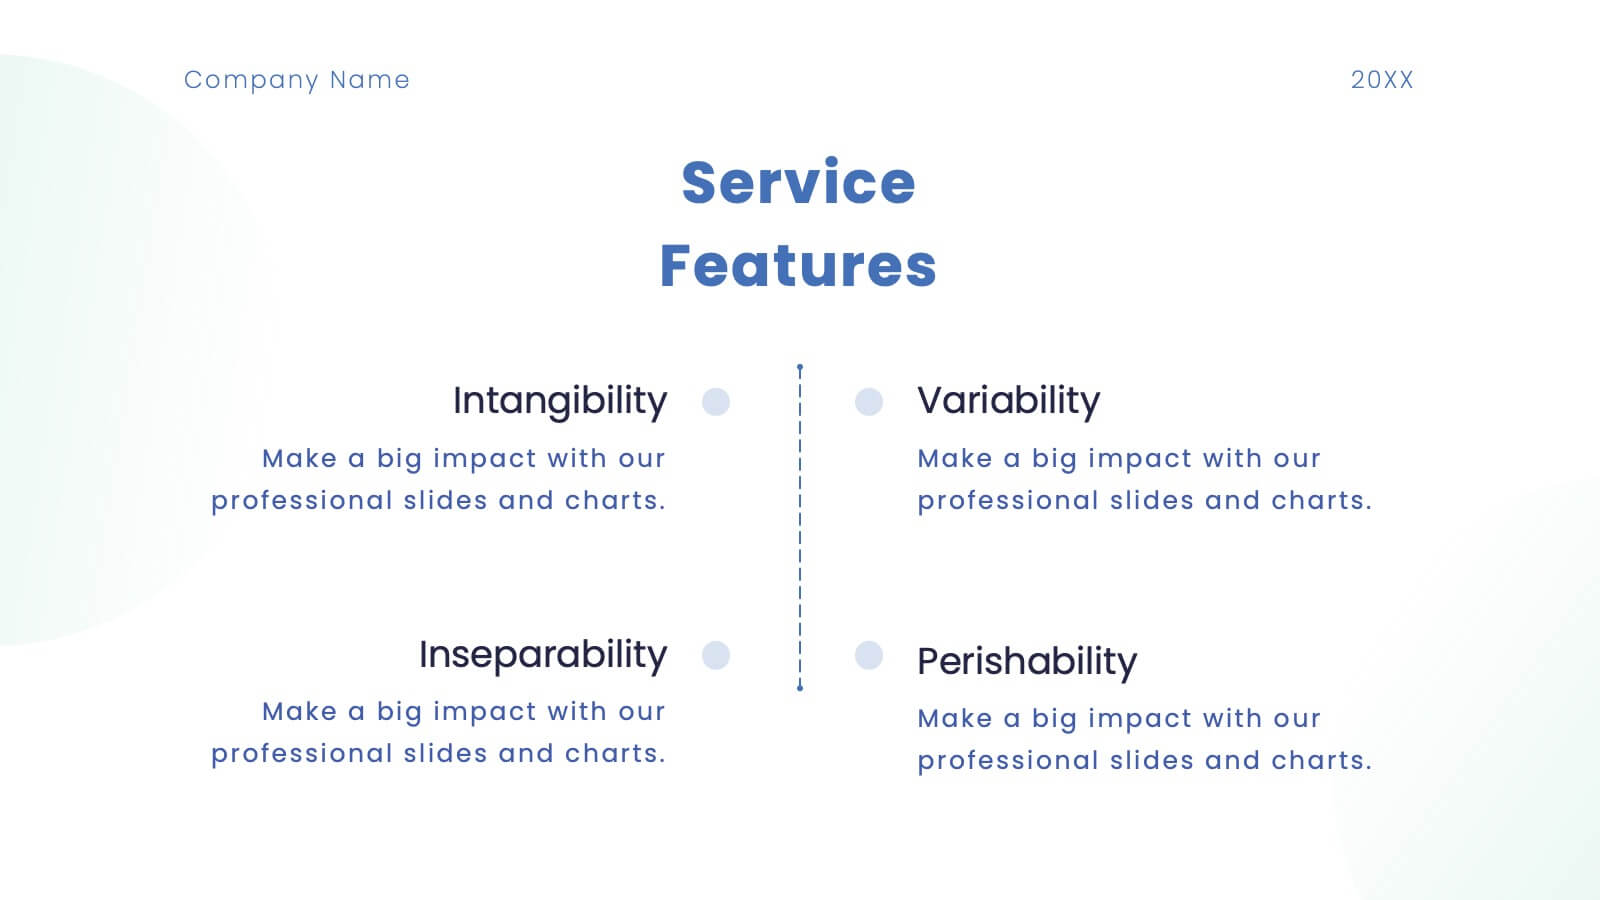
Wave Brand Identity Presentation
Take your brand's identity to the next level with the Wave Brand Identity Presentation template! Designed to capture the essence of your brand in a visually striking and comprehensive format, this template is perfect for showcasing your brand's vision, values, and personality. It includes sections for brand vision and mission, core values, target audience, and brand positioning, ensuring that every aspect of your brand identity is clearly communicated. The sleek design elements and modern layout make it easy to present your brand's unique selling proposition (USP) and key differentiators, helping you to build a strong, cohesive brand story. Ideal for brand strategists, marketing teams, and creative professionals, this template is fully customizable and works seamlessly with PowerPoint, Keynote, and Google Slides. Bring your brand's story to life and leave a lasting impression with the Wave Brand Identity template!


6 diapositivas
Environmental Science Infographics
Our "Environmental Science" infographic template, compatible with PowerPoint, Keynote, and Google Slides, is designed for educators, environmentalists, and scientists. This template effectively communicates important concepts in environmental science, making it a great tool for presentations and educational purposes. The template features key elements such as ecosystems, sustainability practices, and the impacts of climate change. It’s structured to help presenters convey complex environmental information in a way that is both easy to understand and visually engaging. This makes it ideal for educational settings, conferences, or public awareness campaigns about environmental issues. The design is vibrant and engaging, with a color scheme that reflects nature and environmental awareness. Incorporating greens, blues, and earth tones, it not only educates but also inspires the audience to think about the environment. Whether you're discussing conservation strategies, ecological studies, or environmental policies, this template ensures your presentation is both informative and visually striking.


26 diapositivas
Linear Technology Presentation
Cyberspace is the realm of digital information that can be accessed, shared, and stored using electronic devices. Focus on the future of technology with this template! This presentation's linear design will put your ideas front-and-center. This design is high-tech the theme colors and icons are sure to make an inspiring first impression on your audience. This can be used for business presentations, academic projects and conferences. This template consists of 26 slides that will bring your ideas to the next level by putting emphasis on key points and keeping your ideas concise and organized.


5 diapositivas
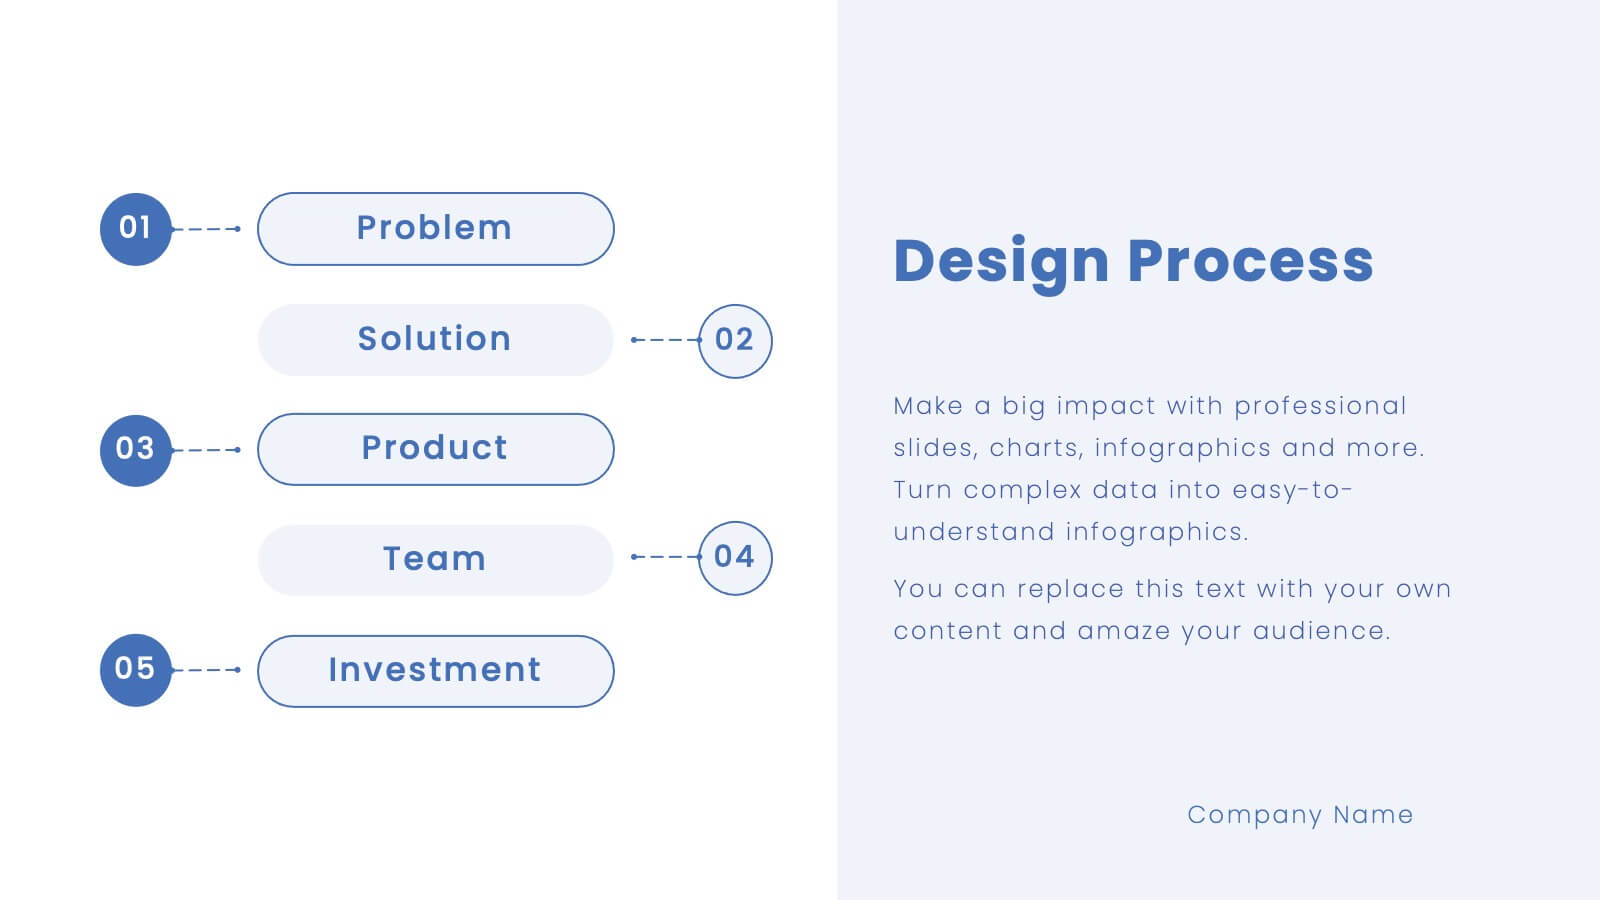
IT Infrastructure and Support Presentation
Optimize your IT presentations with the IT Infrastructure and Support Presentation template. Featuring a structured, step-by-step layout, this slide design visually conveys IT infrastructure processes, system support workflows, and key technology elements. Ideal for IT teams, tech consultants, and business professionals looking to illustrate complex IT strategies effectively. Fully editable in PowerPoint, Keynote, and Google Slides for seamless customization.


6 diapositivas
Credit Card Comparison and Benefits Presentation
Clearly compare features, perks, and advantages of different credit card options using this visually dynamic infographic slide. With side-by-side sections, icons, and clean labeling, this layout makes it easy to present pros and cons, reward tiers, or service details. Ideal for financial services, banking presentations, or consumer education. Compatible with PowerPoint, Keynote, and Google Slides for seamless customization.


28 diapositivas
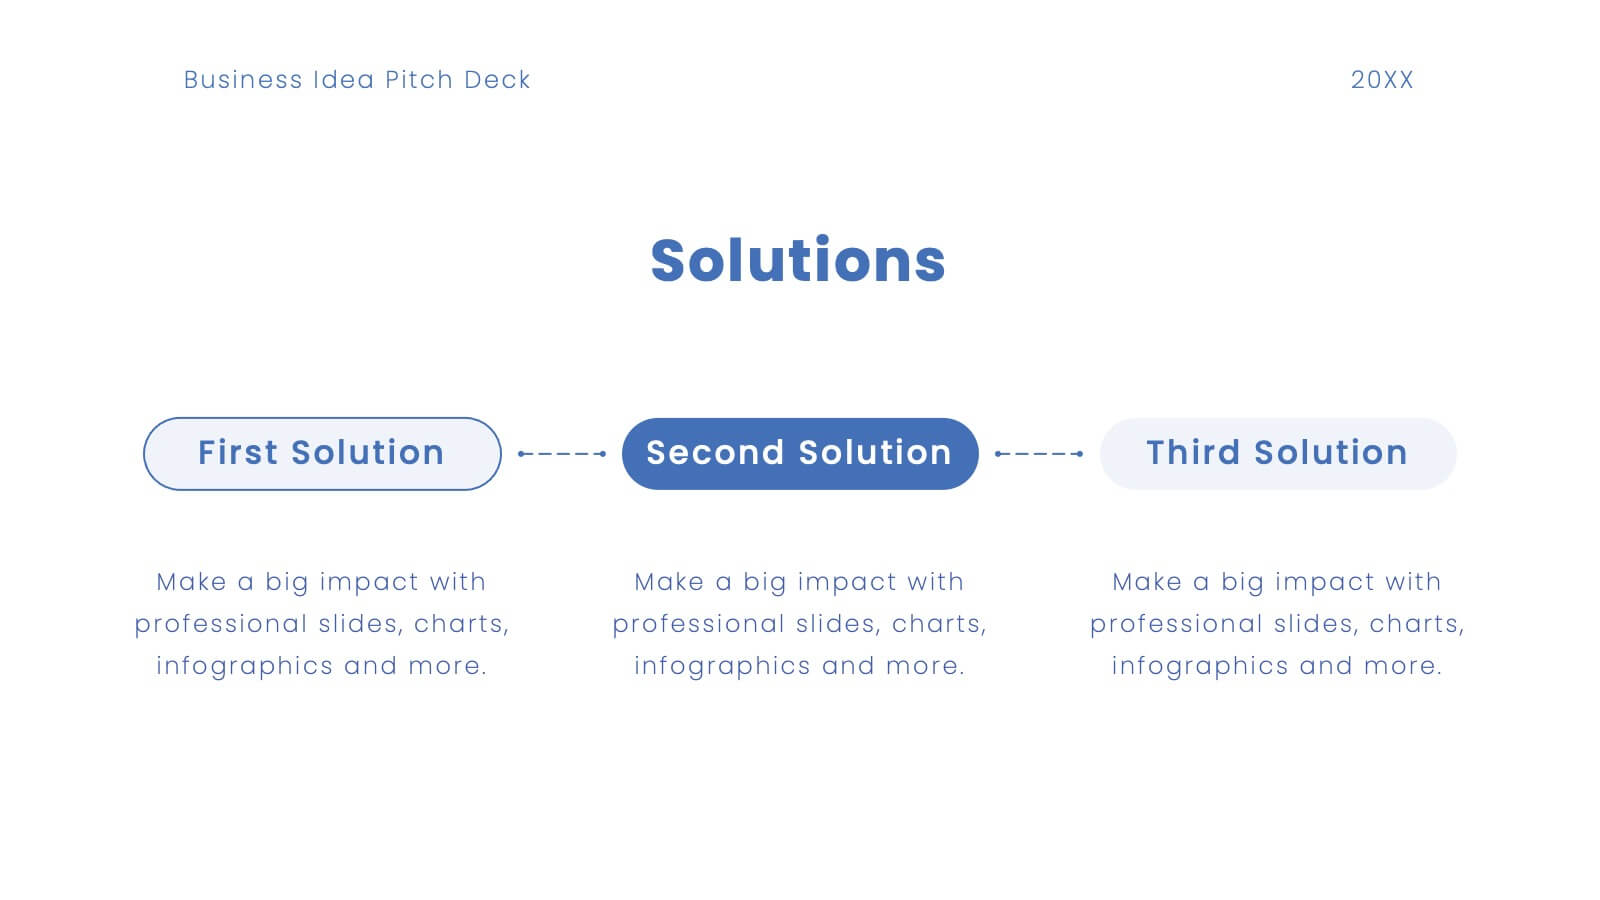
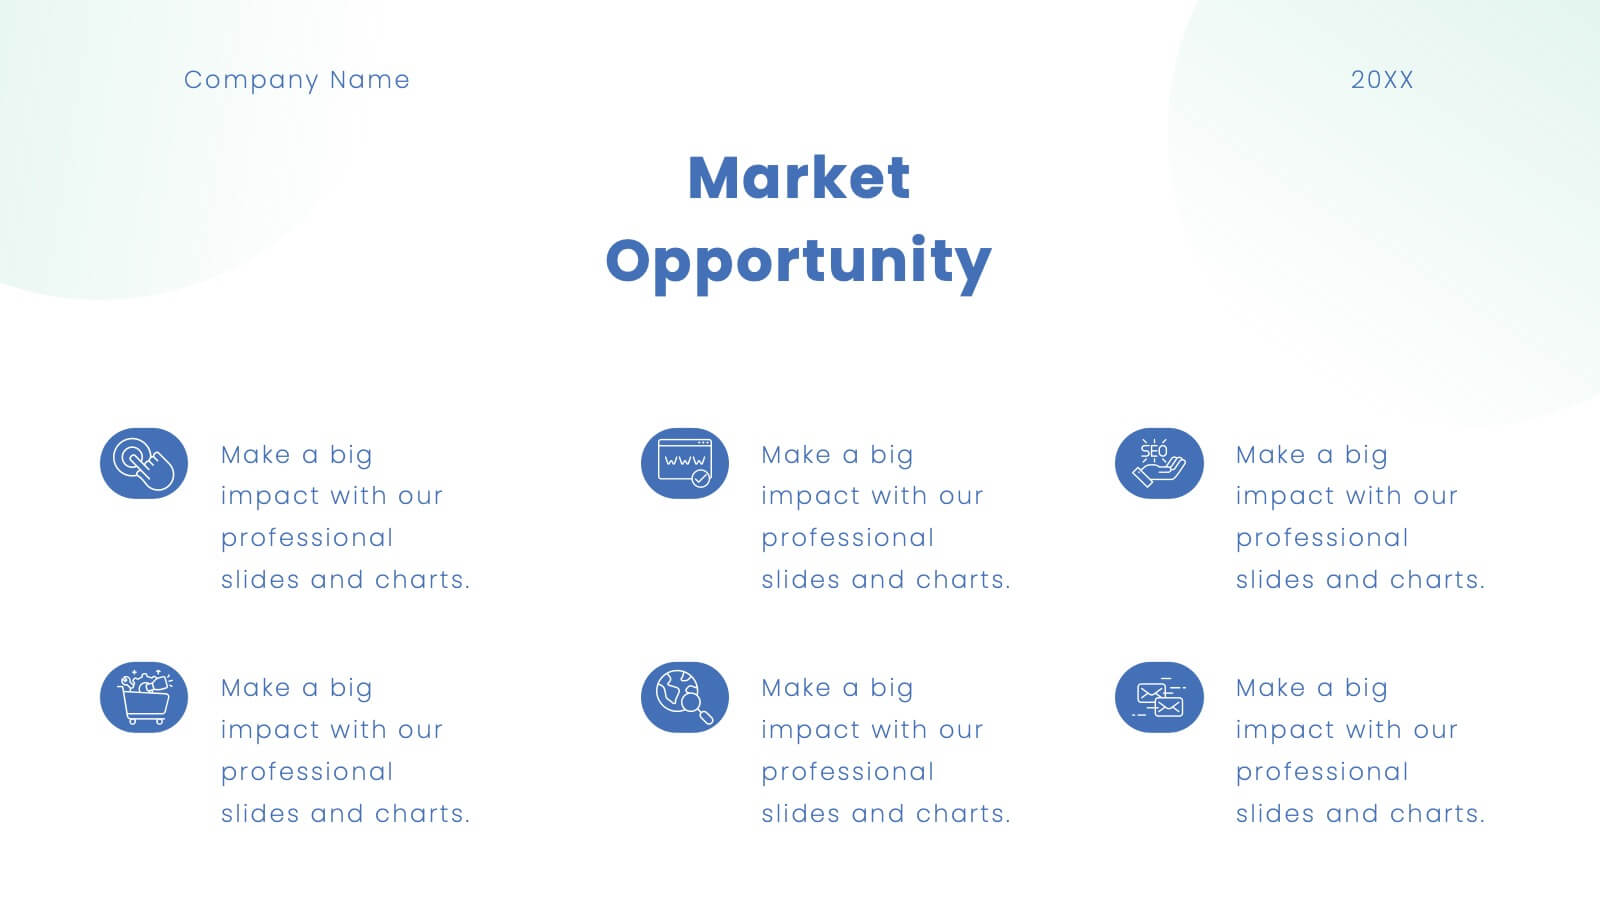
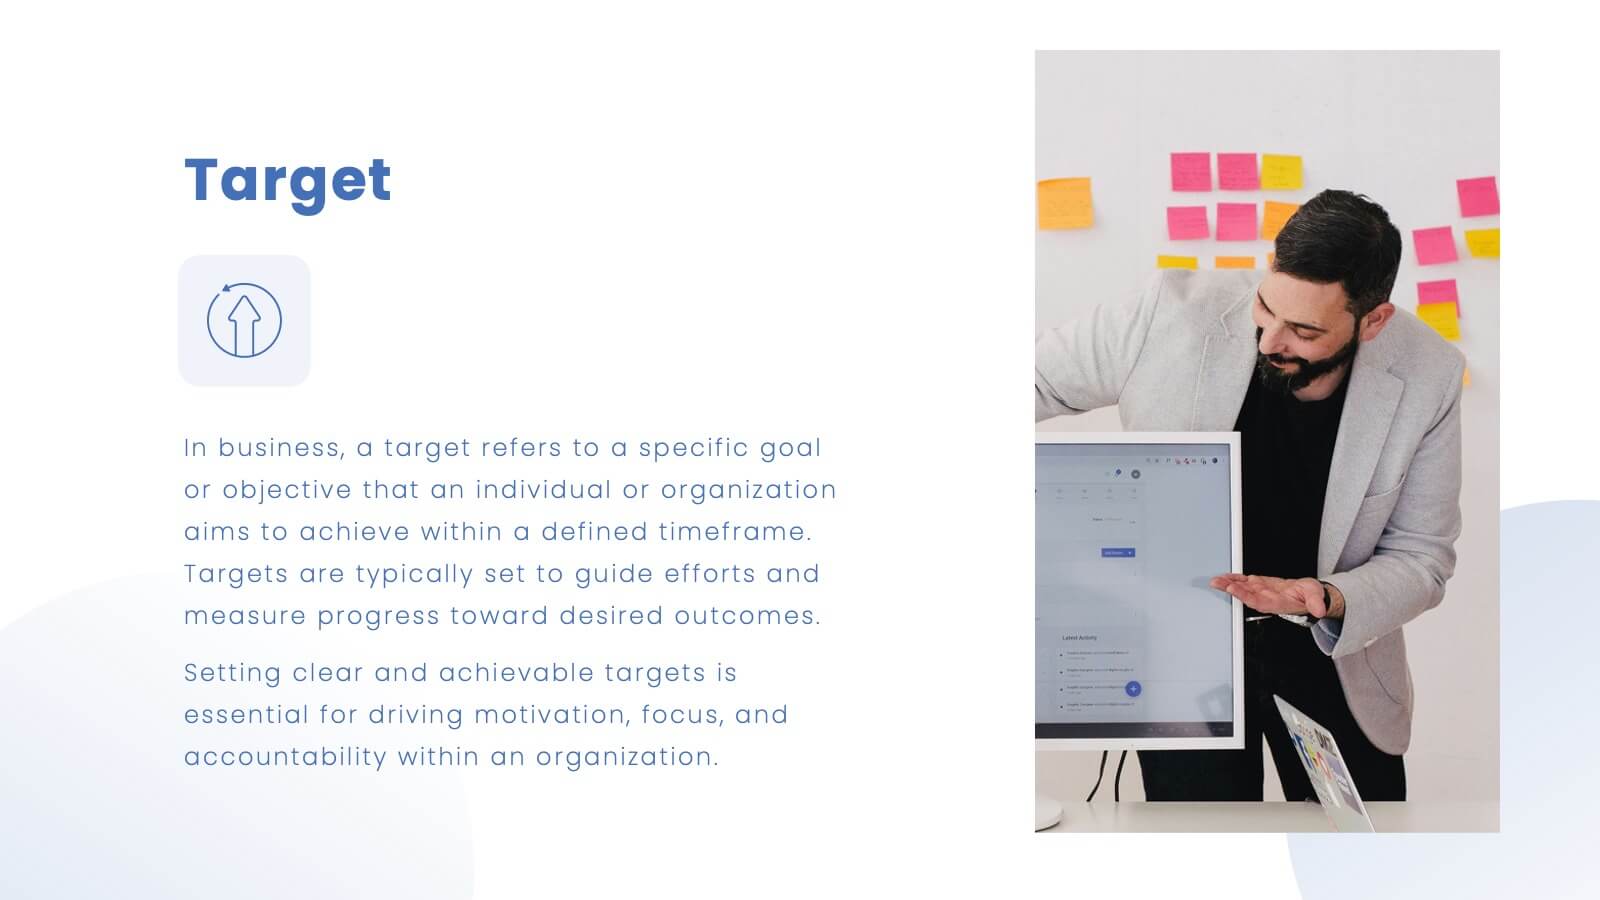
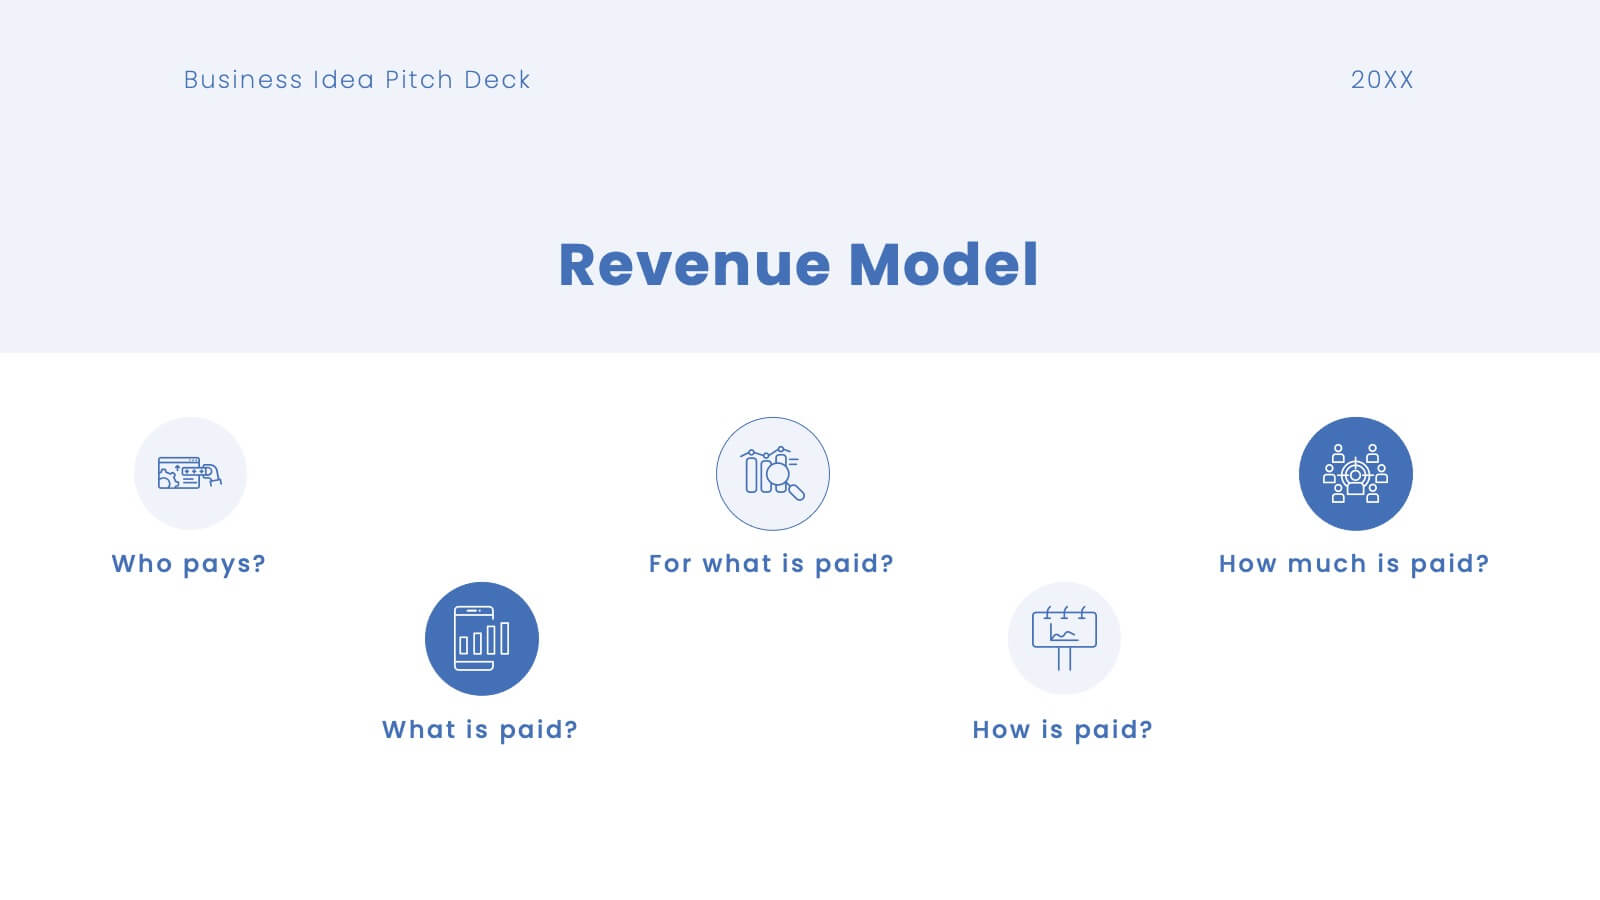
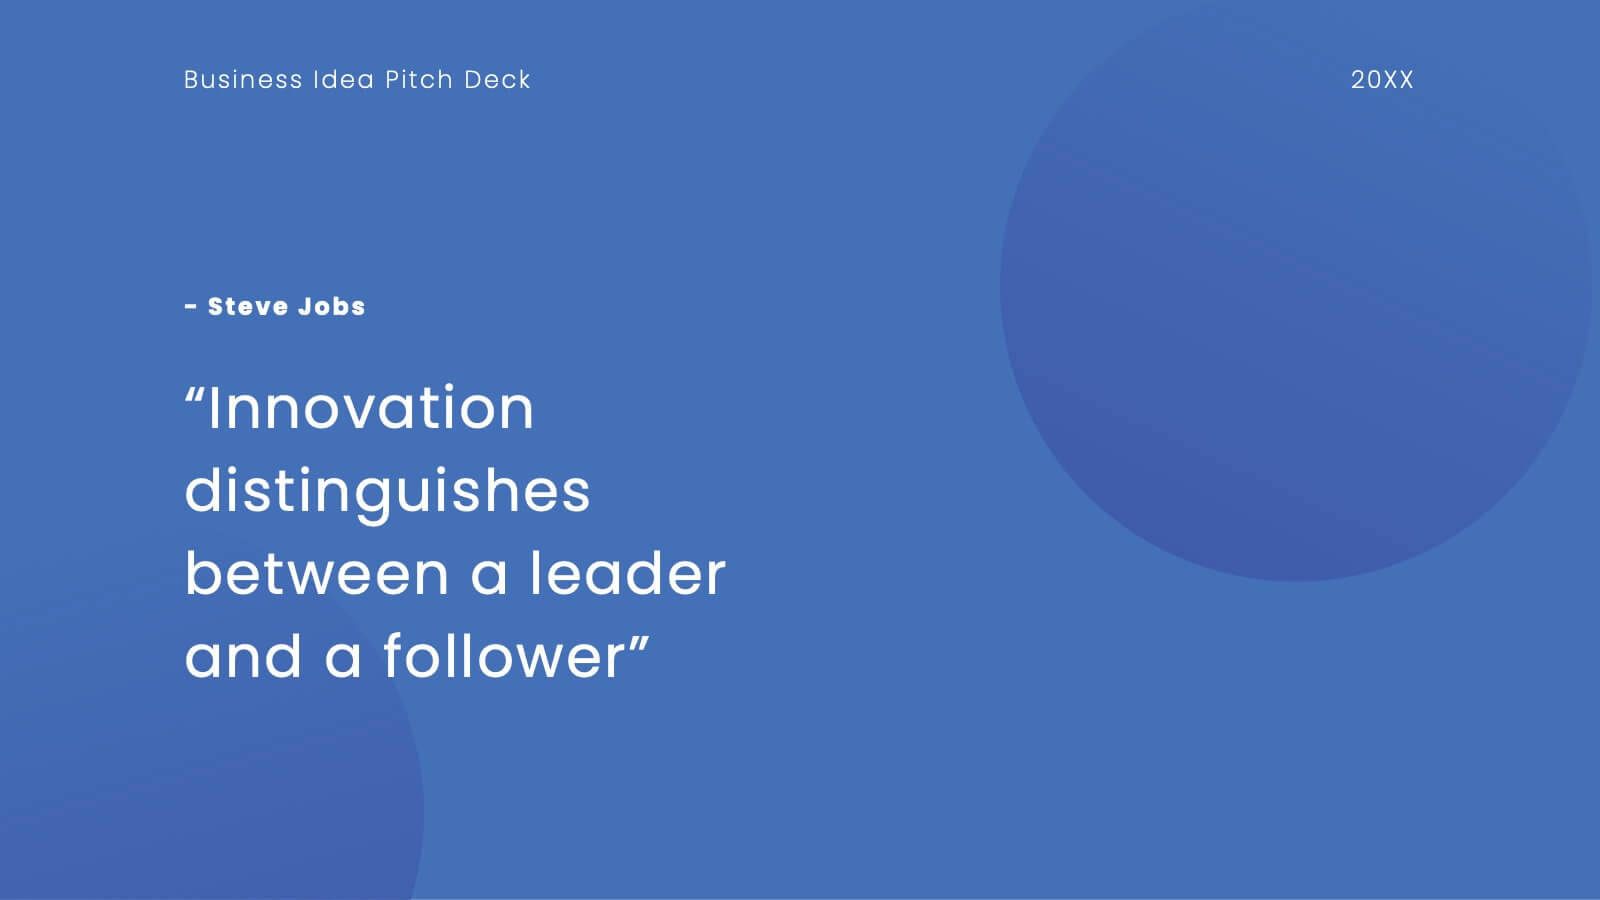
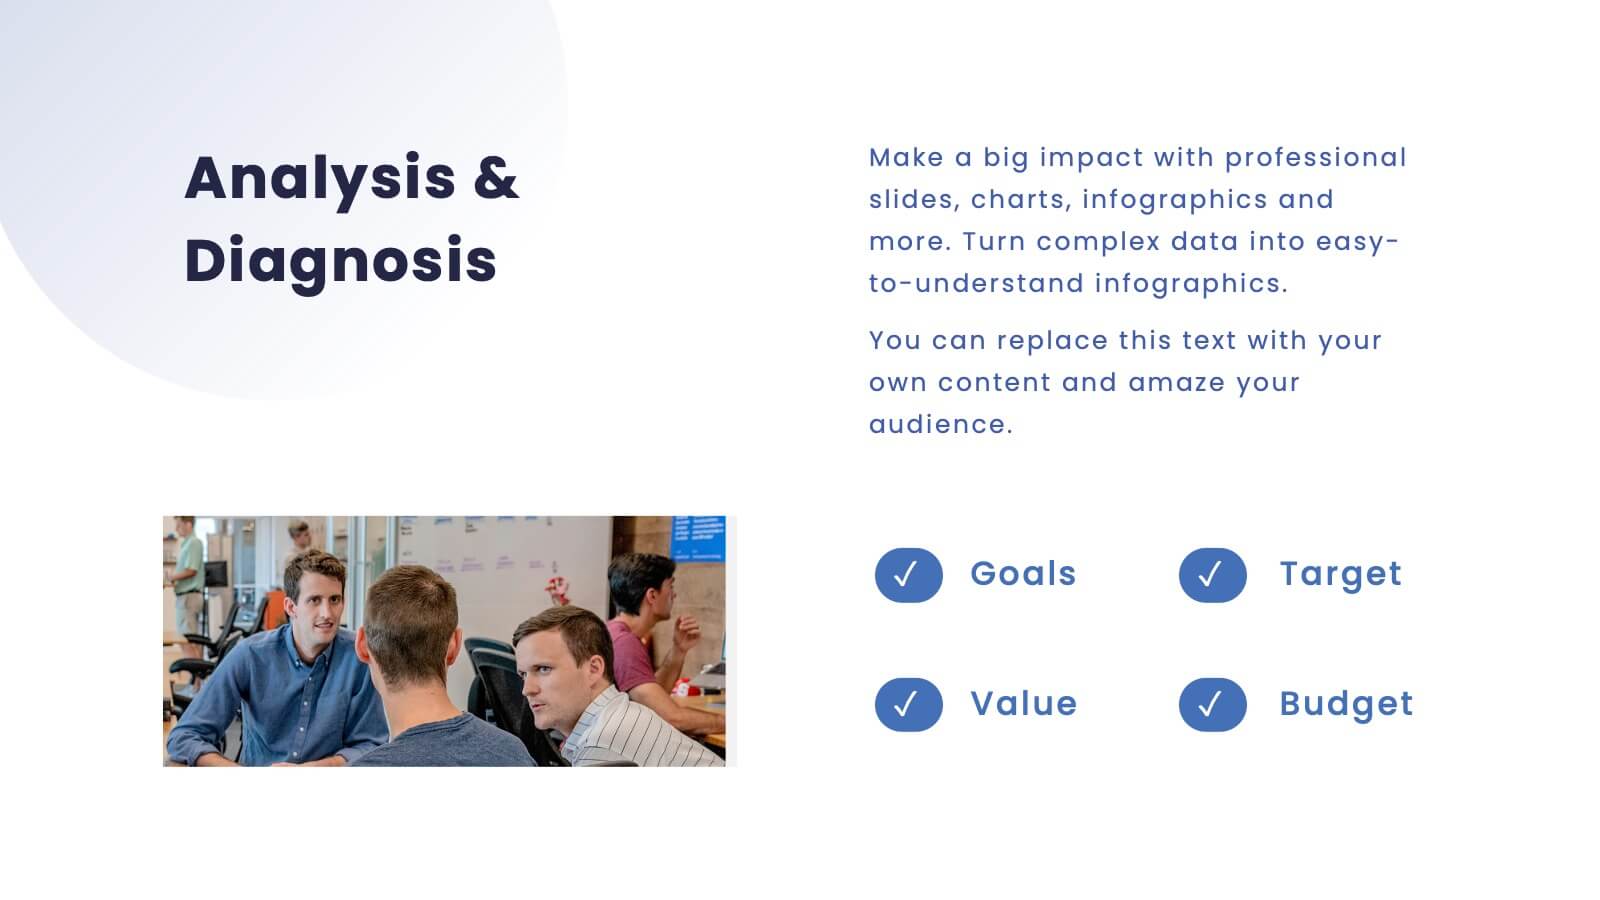
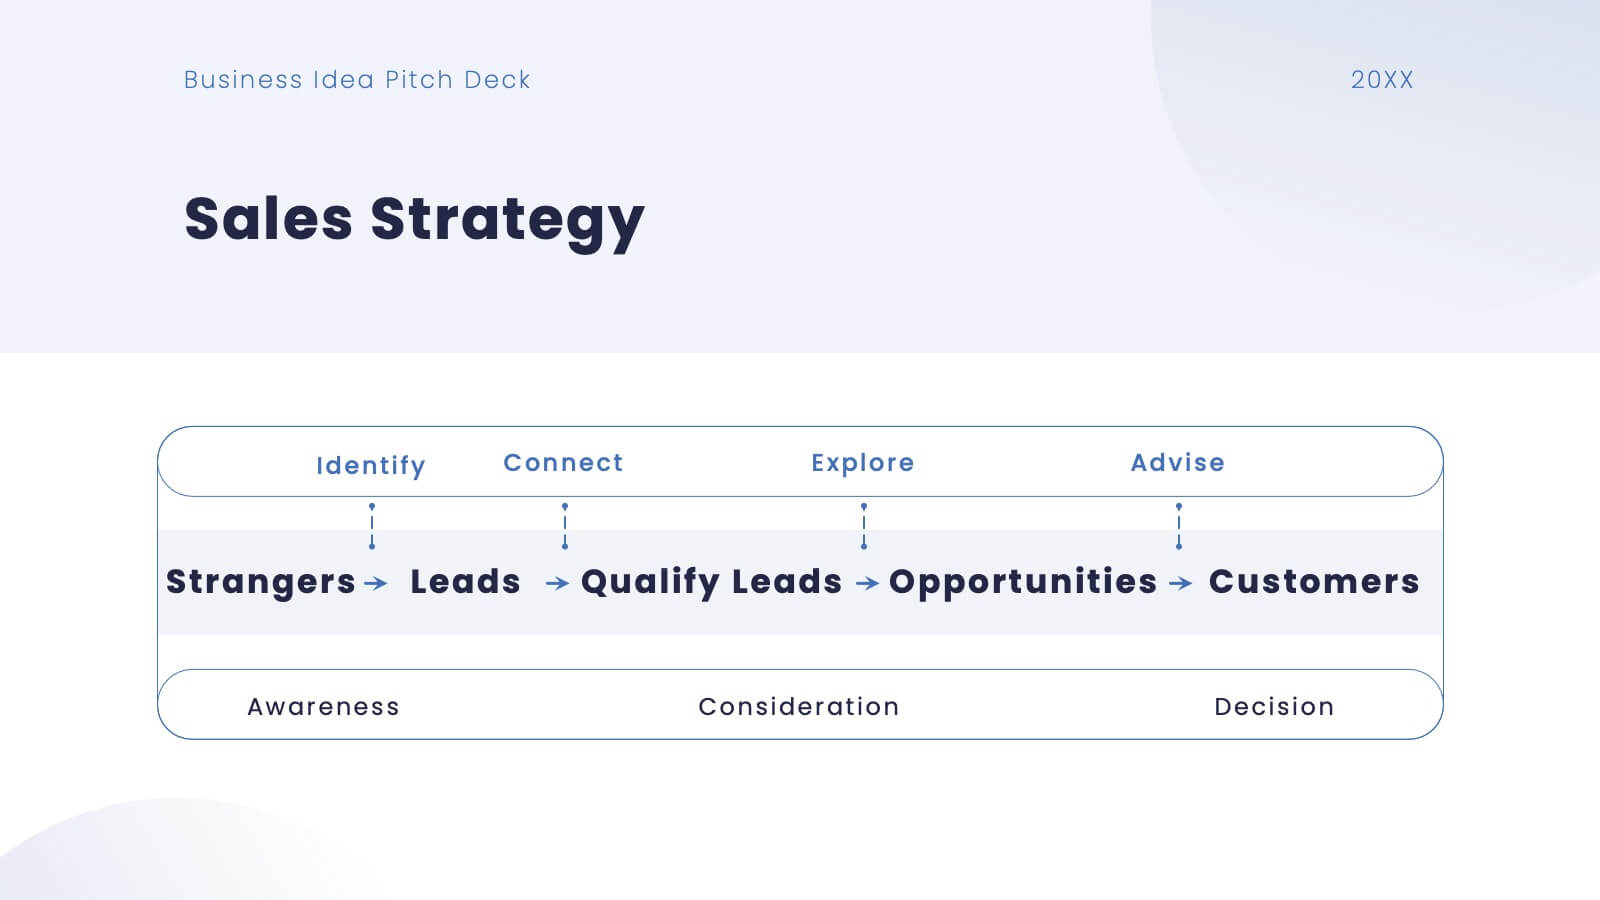
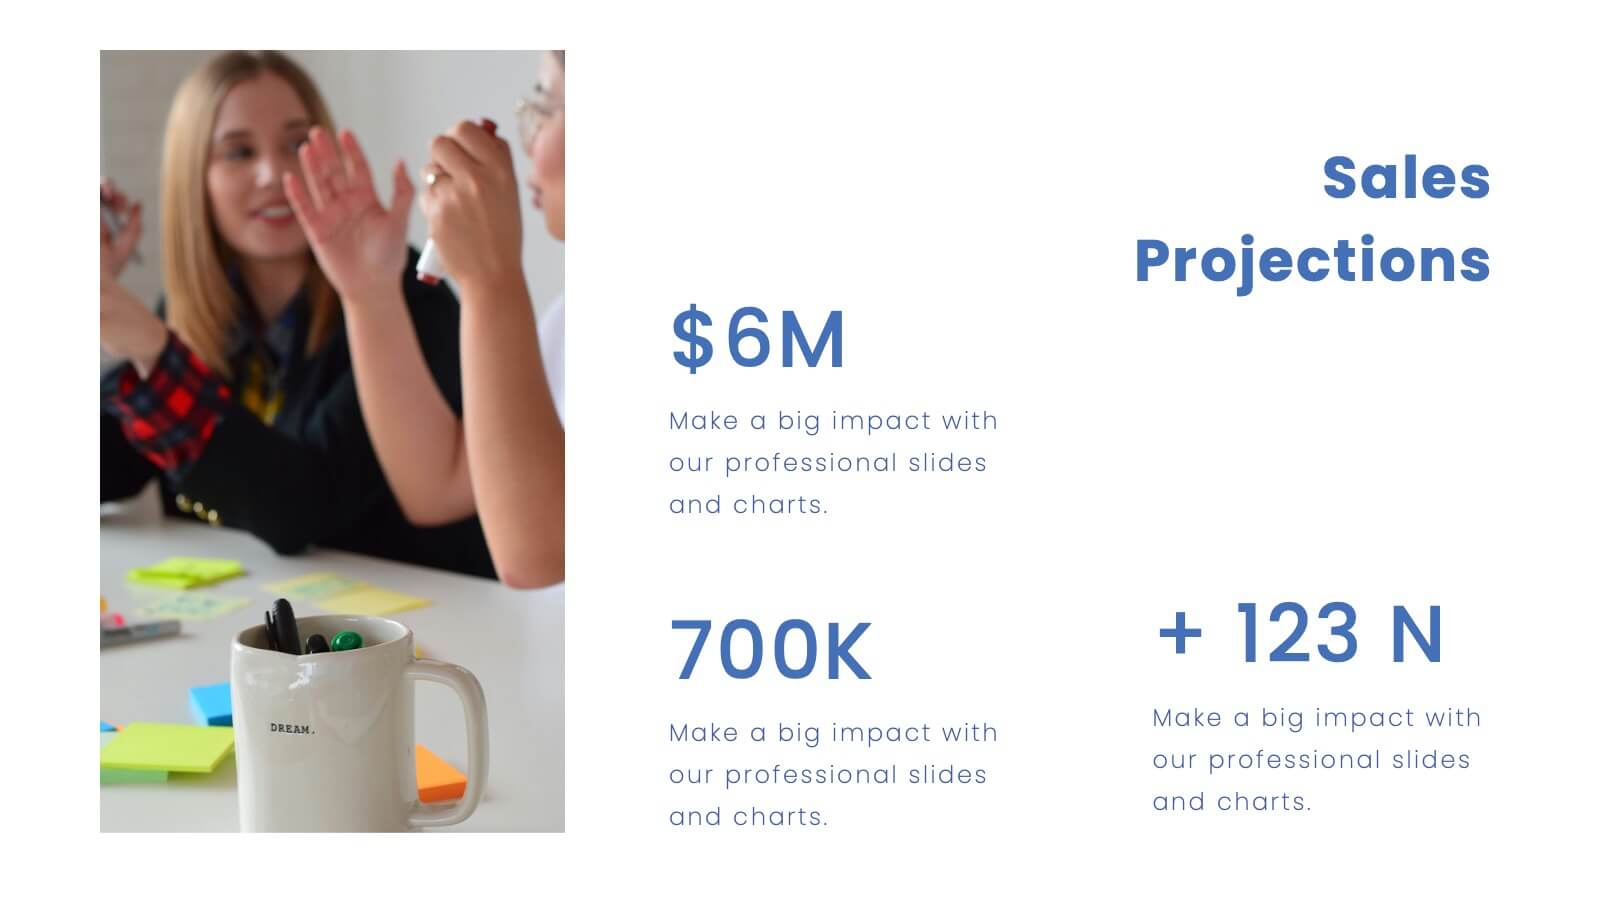
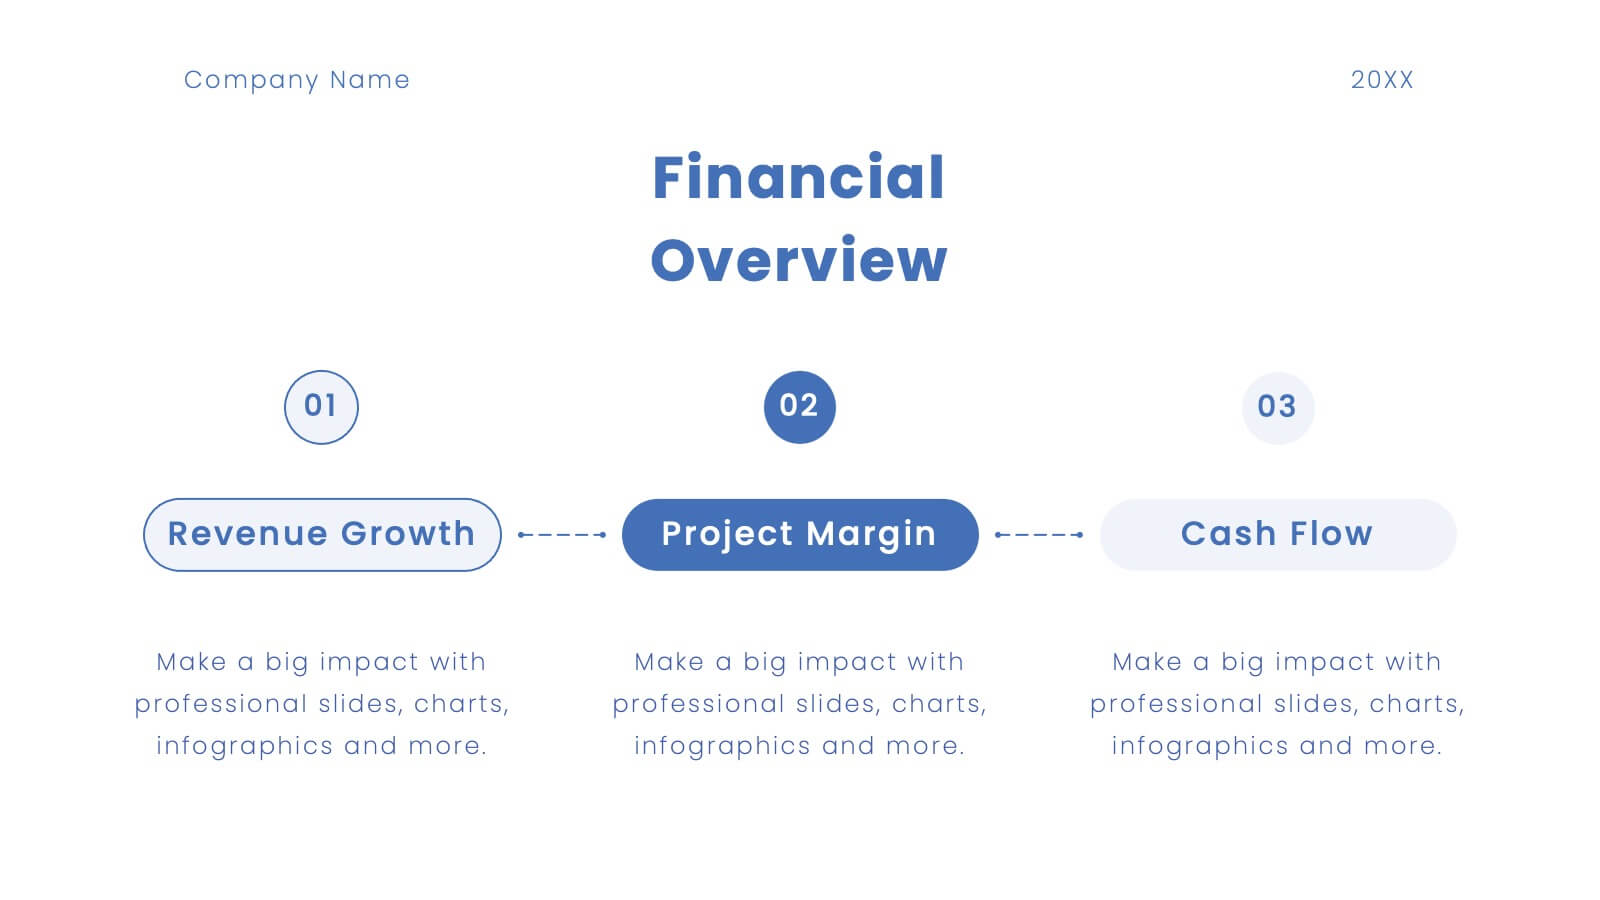
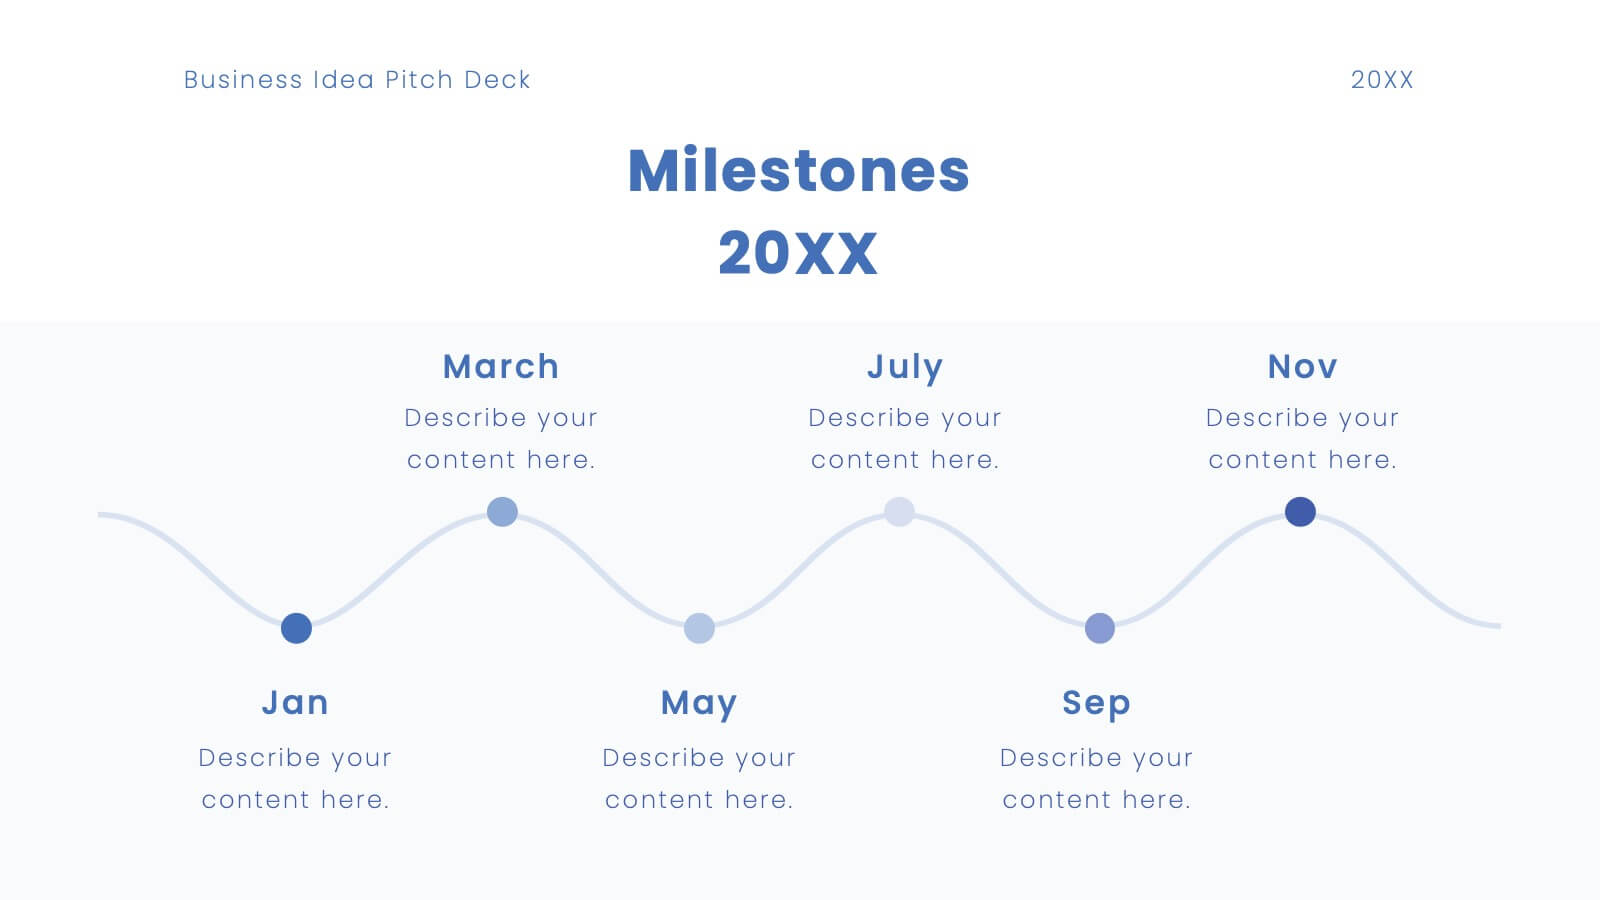
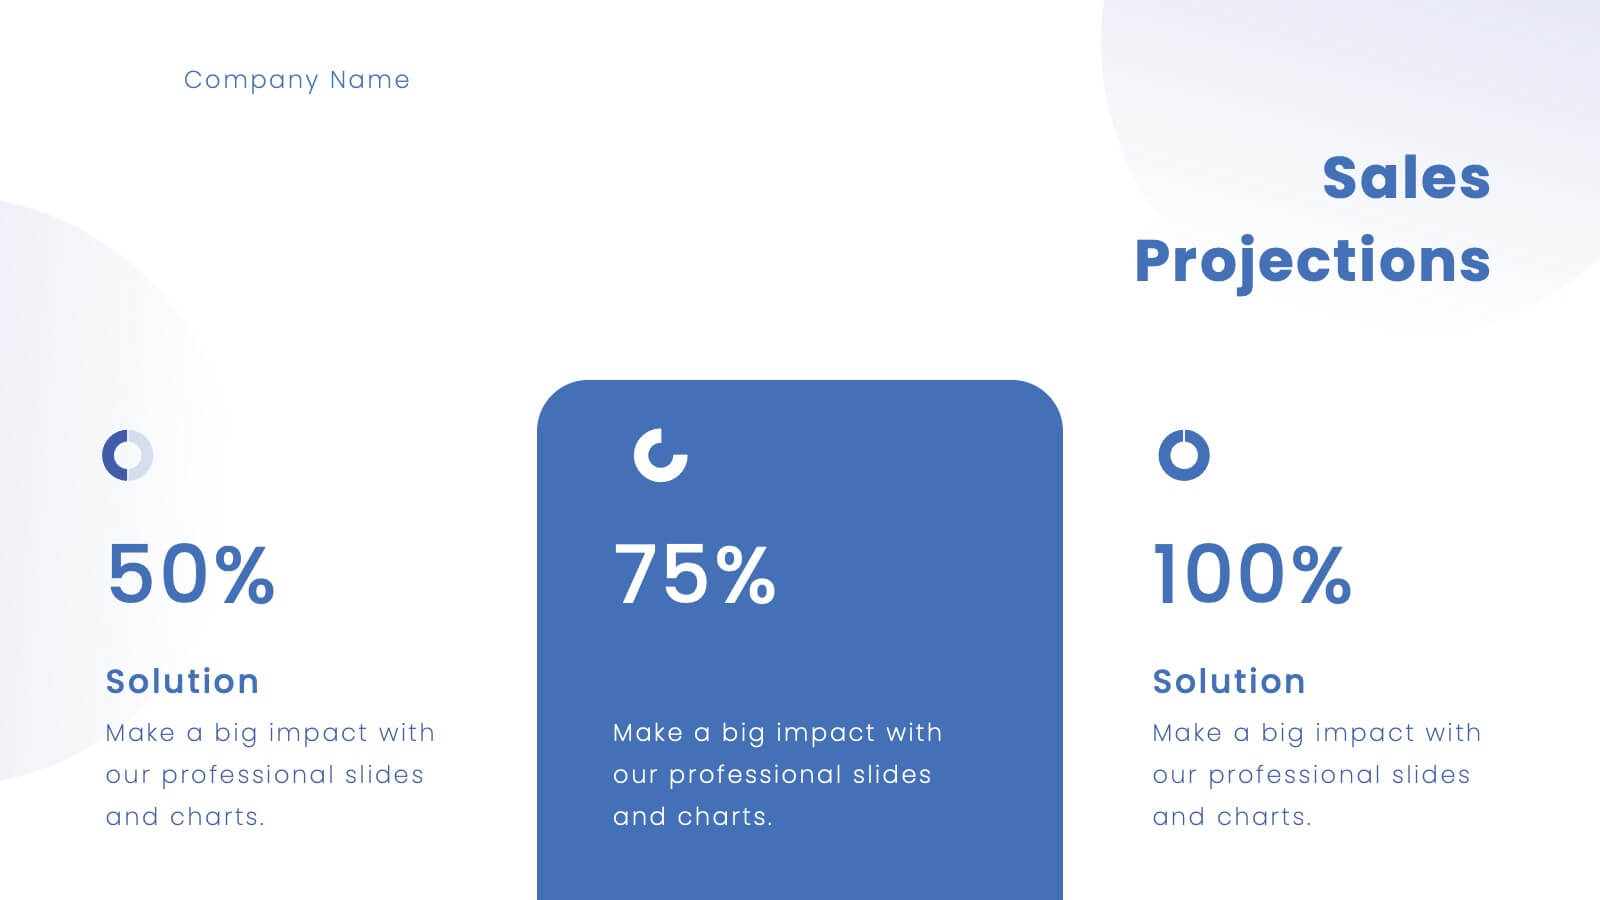
Platinum Business Idea Pitch Deck Presentation
Present your business idea with this sleek and professional pitch deck template! It includes everything from market opportunities to financial projections and sales strategies, providing a comprehensive structure for your pitch. Fully customizable and compatible with PowerPoint, Keynote, and Google Slides, this template is ideal for impressing investors and stakeholders.


4 diapositivas
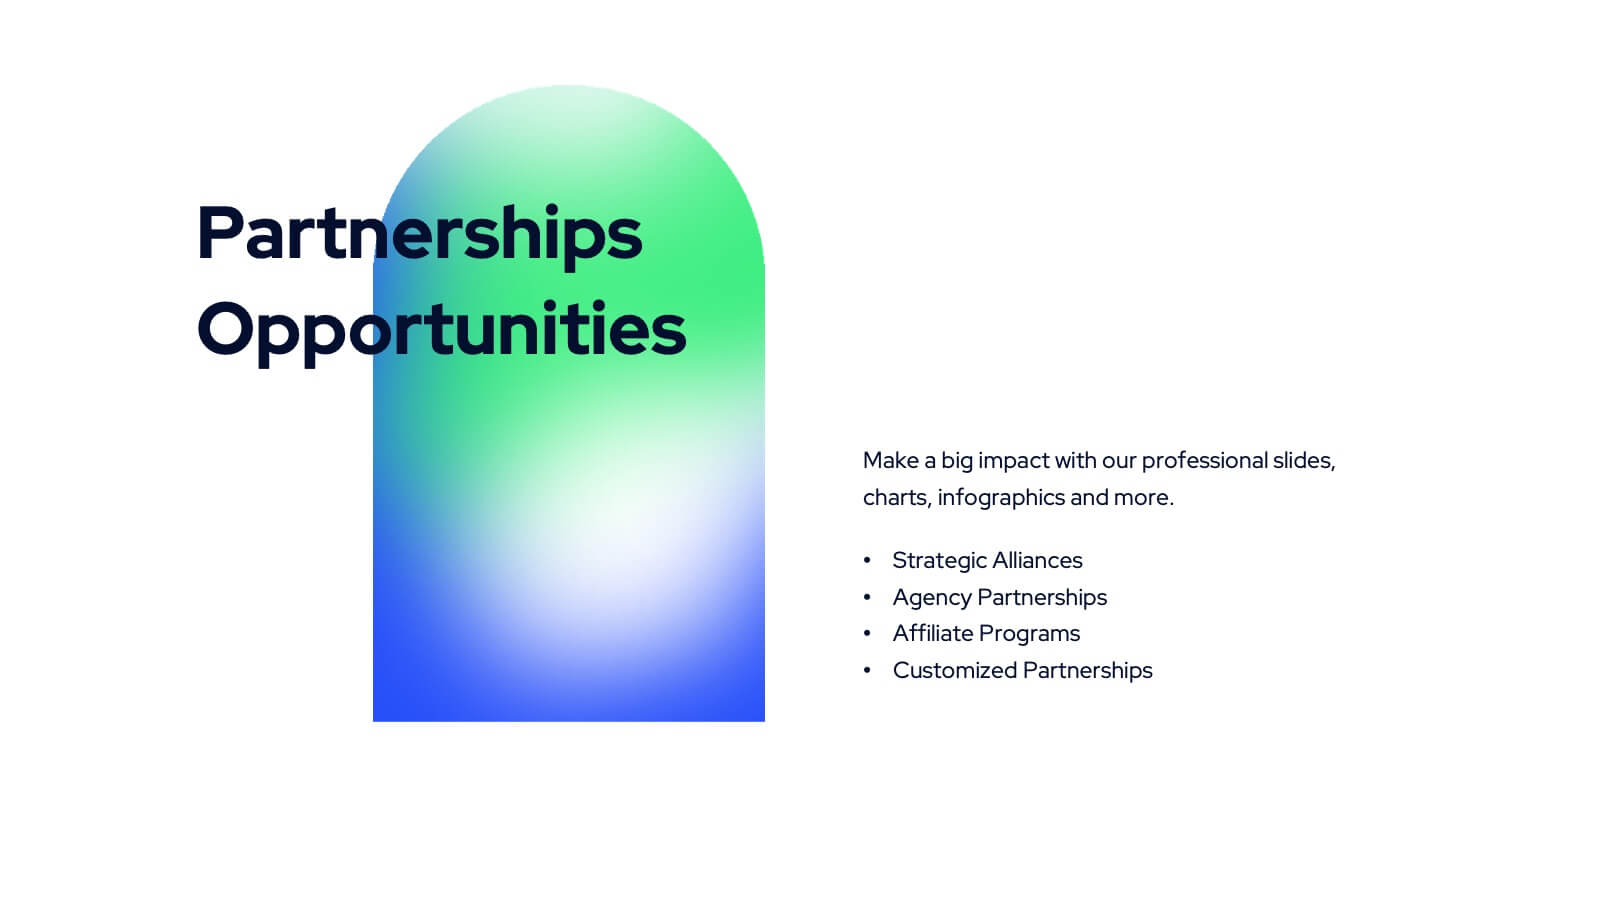
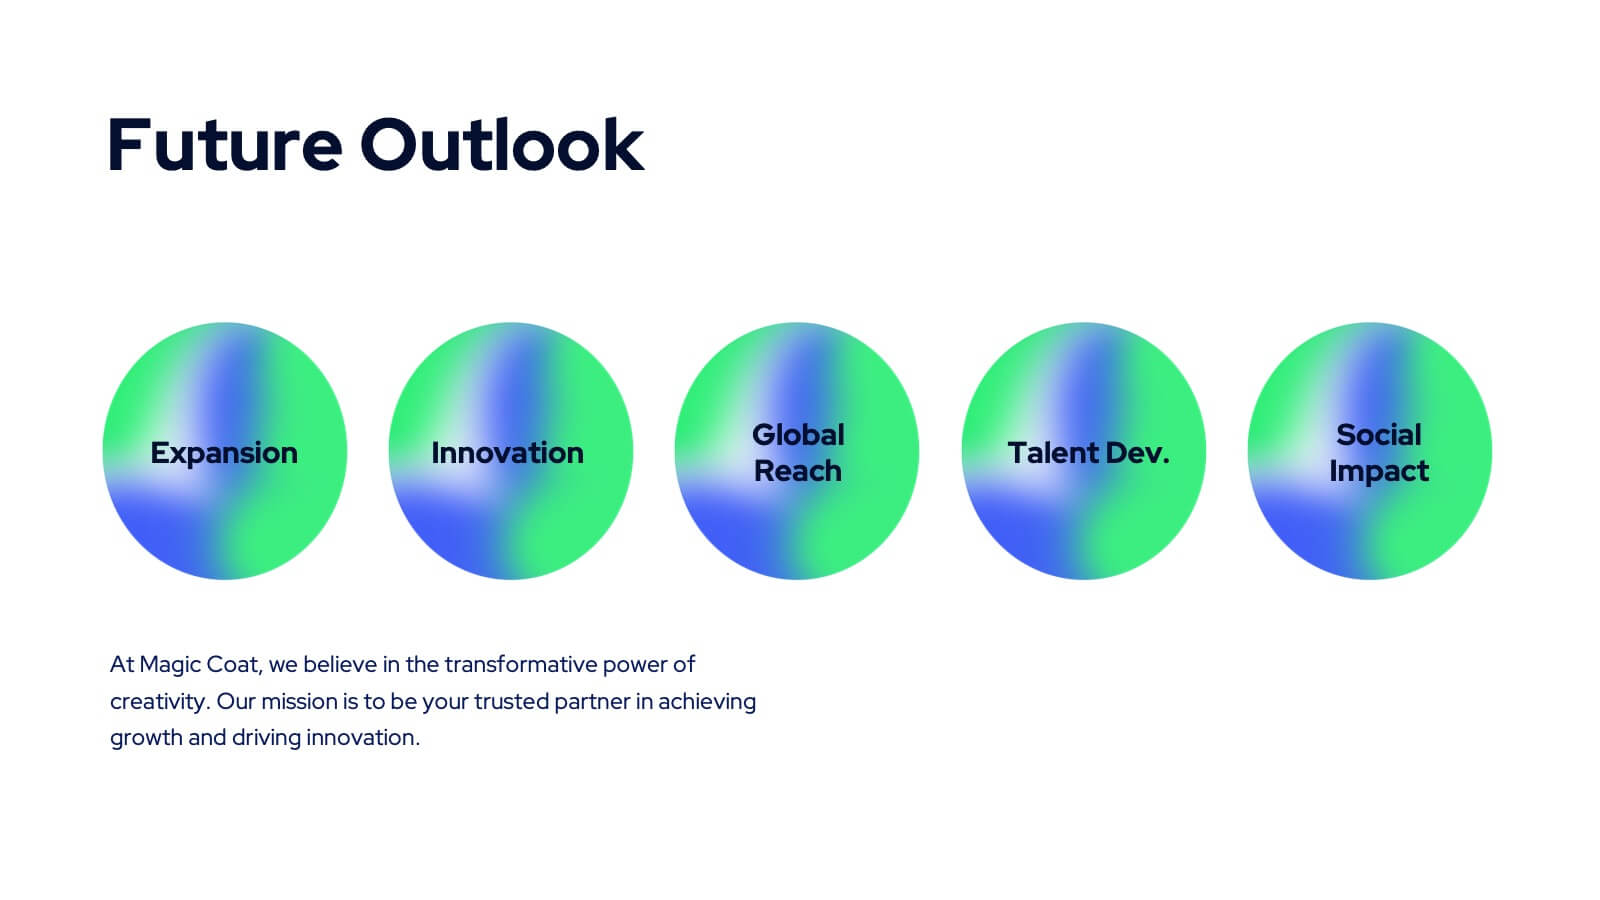
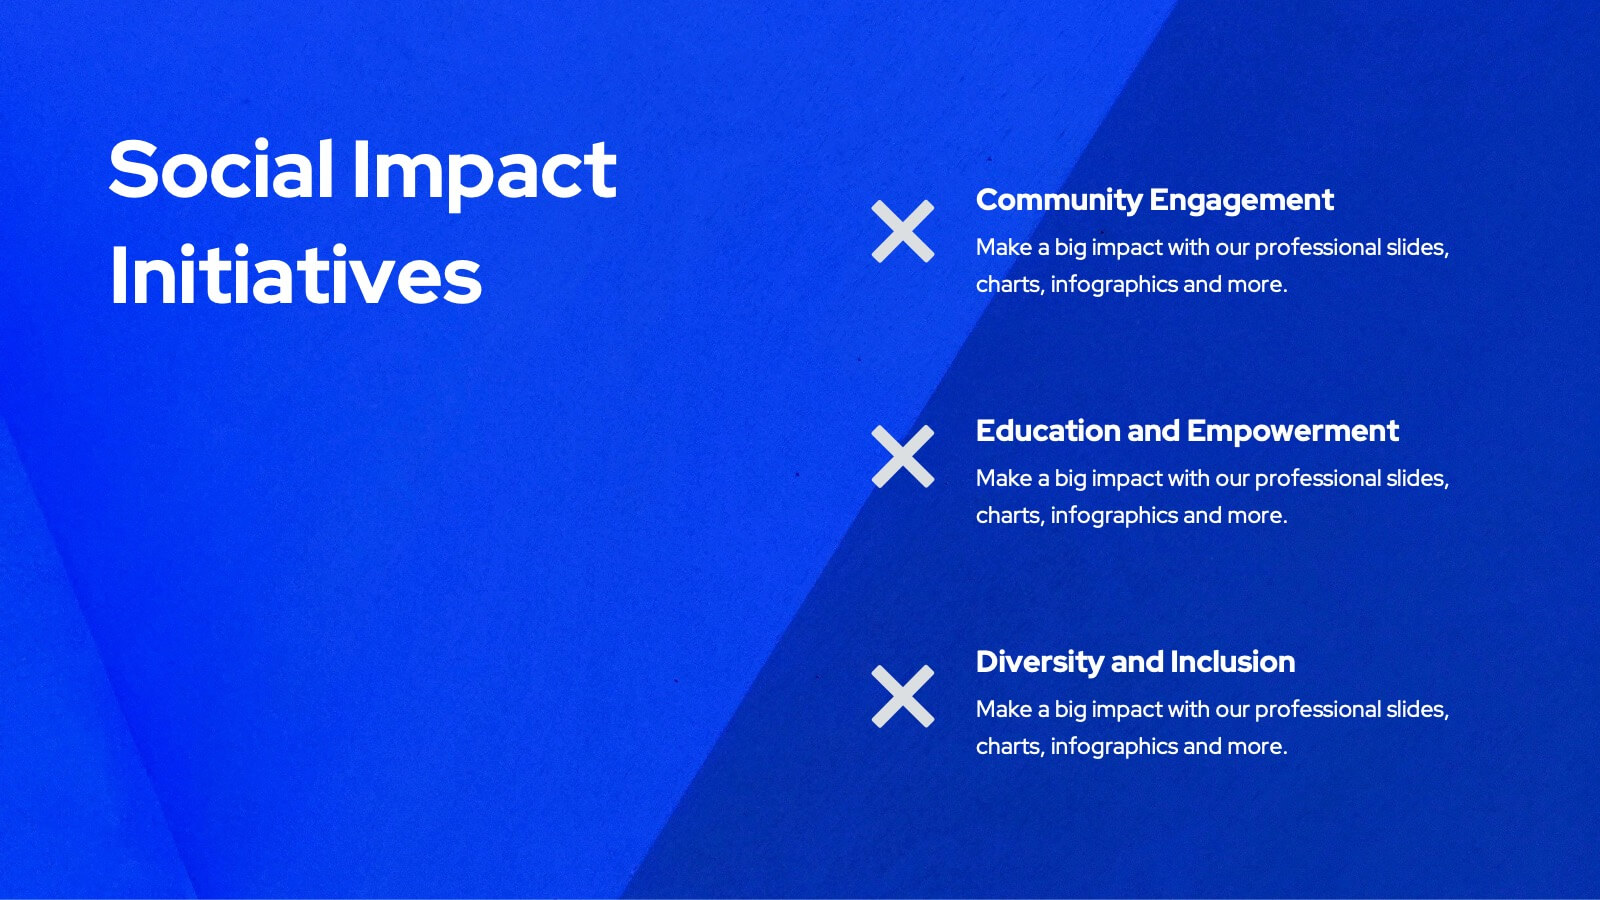
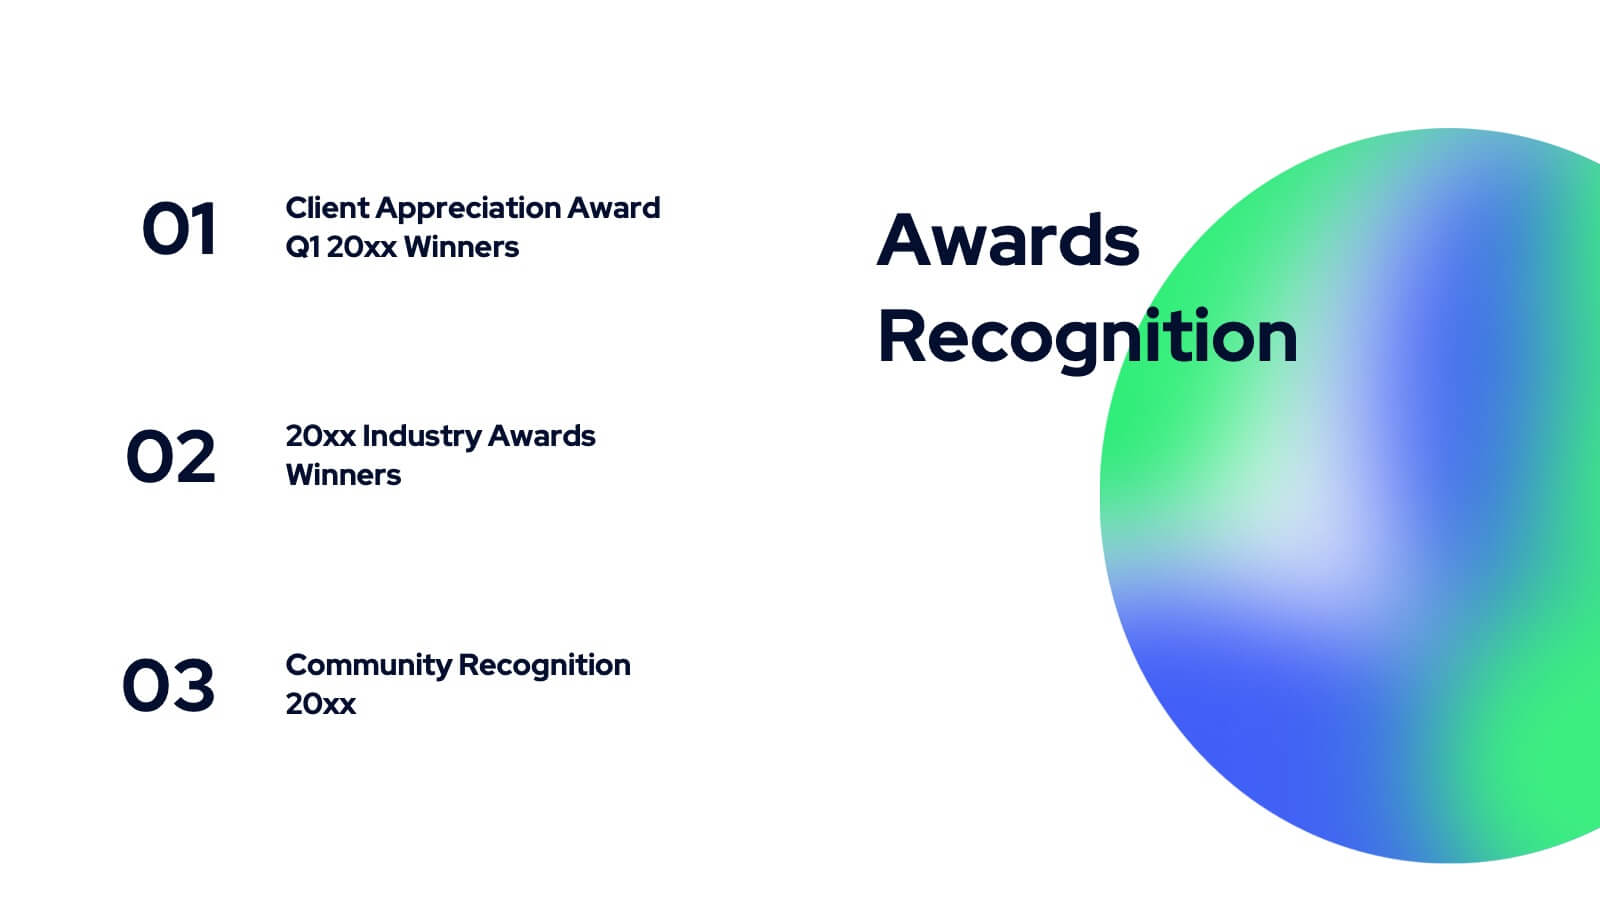
Business Partnership Development Presentation
Showcase key elements of collaboration with the Business Partnership Development Presentation. This quadrant-style layout is perfect for outlining strategies, stakeholders, or phases of a partnership. Ideal for business proposals, joint ventures, and strategic planning decks. Fully editable in PowerPoint, Keynote, and Google Slides.


7 diapositivas
Customer Loyalty Program Infographic Presentation
Introducing our new customer loyalty program infographics template, the perfect tool for any business looking to boost customer engagement and loyalty! It's easy for you to create an engaging and effective presentation with these Infographics. With our template, you can add a touch of creativity to your presentation with a fun color scheme and infographic visuals with editable text. Whether you're presenting customer rewards or loyalty program benefits, our template will help you communicate your ideas in a clear and engaging way. So why wait? Start boosting your customer engagement and loyalty today with our amazing template!


6 diapositivas
3D Infographic Design
Visualize data like never before with this bold 3D block diagram layout. Designed to break down complex figures into three key segments, it’s perfect for presenting percentages, growth areas, or metric comparisons. Easily editable in PowerPoint, Keynote, and Google Slides.


5 diapositivas
Editable RACI Chart Presentation
Streamline your team’s responsibilities with this clean and easy-to-use RACI chart template! Perfect for project managers, this presentation helps define who is Responsible, Accountable, Consulted, and Informed for each task. Simplify workflows, boost collaboration, and keep everyone aligned. Fully editable and compatible with PowerPoint, Keynote, and Google Slides for seamless customization.