


Características


¿Tienes alguna pregunta?
Recomendar


6 diapositivas
Executive Summary Slide Deck Presentation
Kick off your message with a slide that instantly pulls everything together in a clean, engaging flow. This presentation helps you highlight key insights, outline major updates, and present essential takeaways with clarity and structure. Ideal for meetings, reports, and leadership briefs. Fully compatible with PowerPoint, Keynote, and Google Slides.


2 diapositivas
Elegant Title Slide Design Presentation
Dress your presentation in sophistication with the "Elegant Title Slide," where simplicity meets style. This template elegantly frames your opening remarks in a polished and refined layout, highlighted by a chic, contemporary office backdrop. Perfect for any business aiming to impress, it's fully compatible with PowerPoint, Keynote, and Google Slides. Elevate your presentation game with this seamlessly designed slide.


4 diapositivas
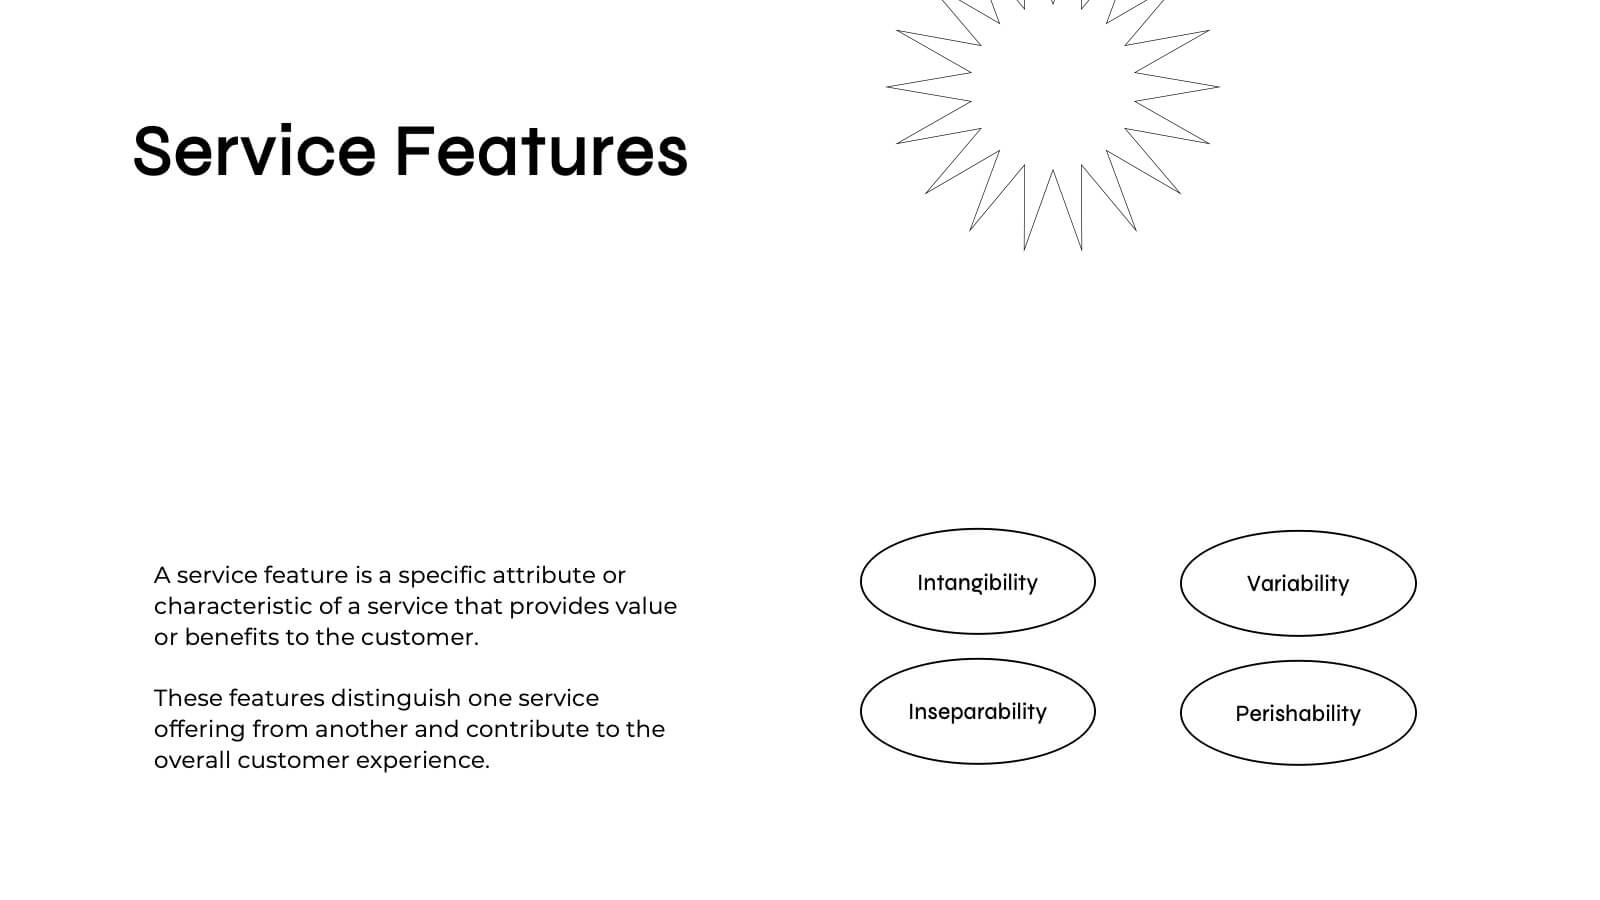
Strategic Triangle Model Slide
Visualize your core pillars with this Strategic Triangle Model Slide Presentation. Featuring a clean triangular layout with three editable segments, this template is perfect for showcasing frameworks such as mission-vision-values, policy-strategy-impact, or key business objectives. Each point of the triangle is paired with an icon and customizable text, making complex concepts easy to digest. Ideal for strategy planning, leadership discussions, or consulting proposals. Fully editable in PowerPoint, Google Slides, and Keynote.


6 diapositivas
Letter Recognition and Phonics Training Presentation
Make early learning visual and interactive with this clean, A-to-F phonics layout. Each letter icon is paired with editable text for sound associations, learning milestones, or steps in a language program. Great for educators, speech therapists, or early childhood presentations. Fully editable in PowerPoint, Keynote, and Google Slides.


5 diapositivas
Impacts of Information Technology Infographics
Information Technology has had a profound impact on various aspects of society, including business, communication, education, healthcare, and entertainment. These infographic templates are designed to help you communicate complex technological concepts in a visually compelling way, making it suitable for IT professionals, businesses, or anyone interested in understanding and highlighting the transformative power of information technology. The template features a sleek design with customizable layouts, icons, and color schemes that can be adjusted to match your branding. It is compatible with PowerPoint, Keynote, and Google Slides.


30 diapositivas
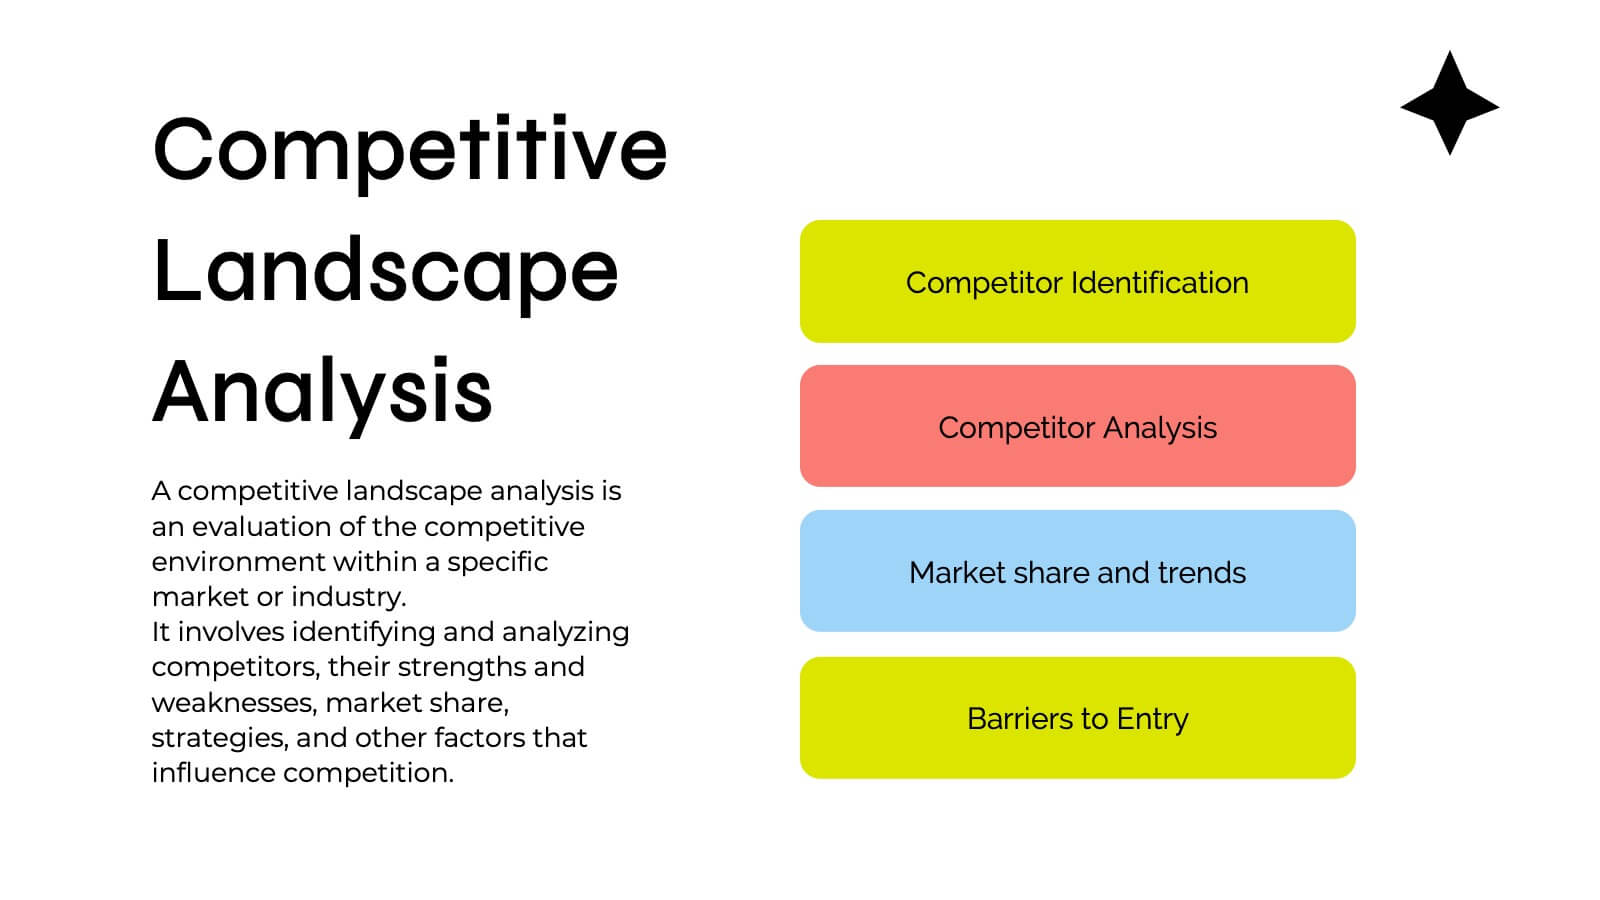
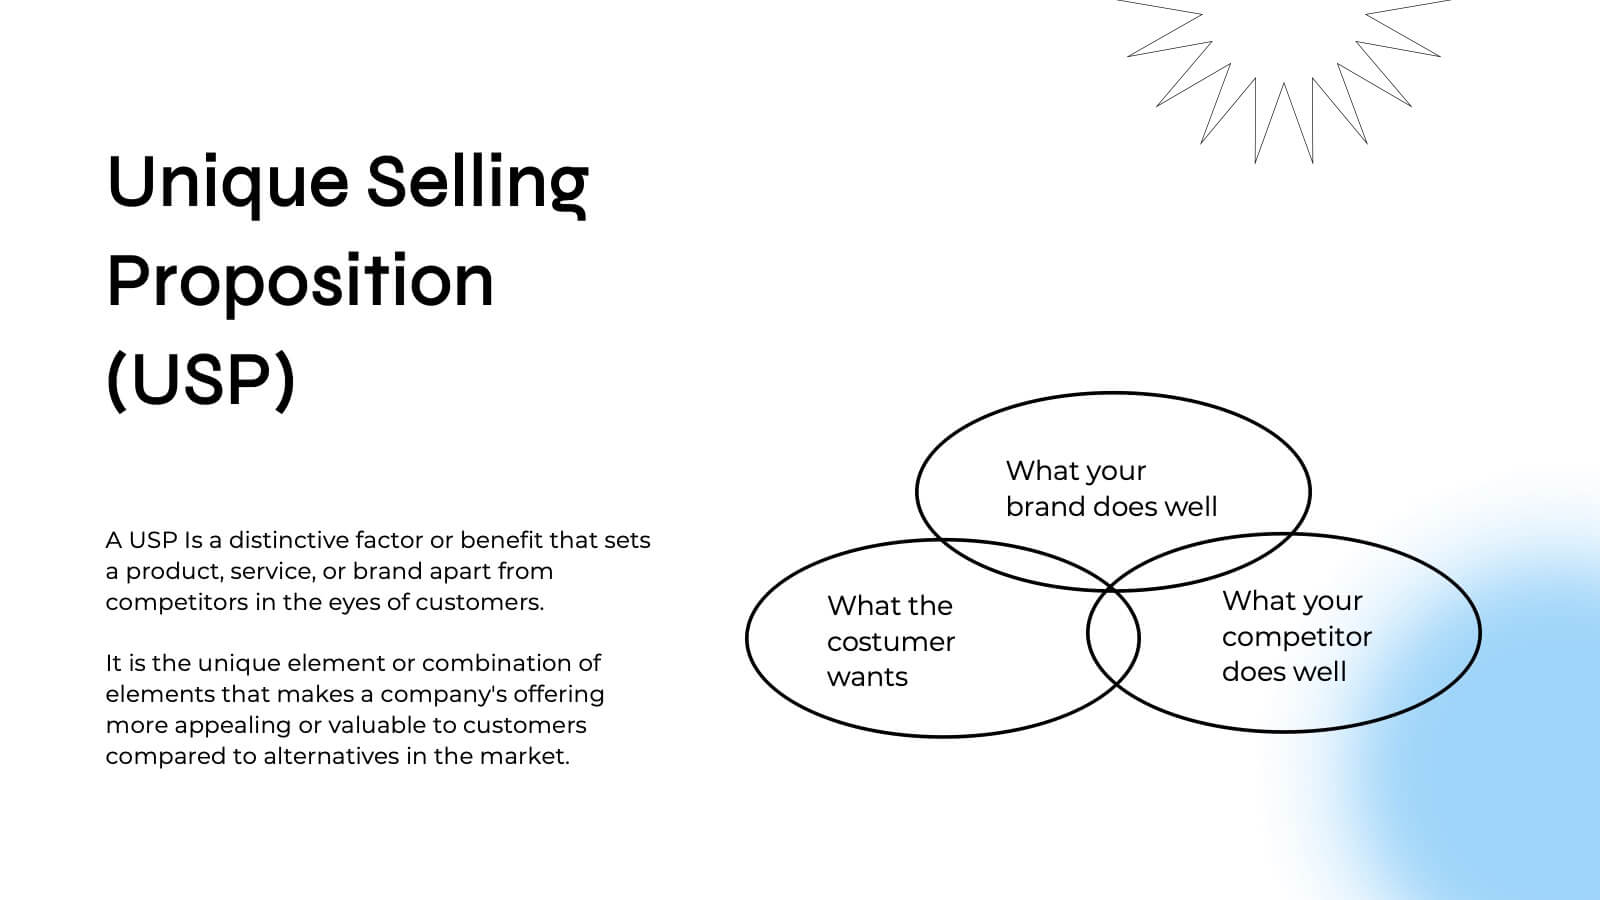
Quintara Rebranding Project Plan Presentation
Revamp your brand with confidence using this dynamic rebranding project plan presentation. Covering key aspects like brand positioning, market analysis, visual identity, and unique selling propositions, this template helps you craft a compelling brand strategy. Fully customizable and compatible with PowerPoint, Keynote, and Google Slides for a seamless, professional presentation experience.


5 diapositivas
Business Process Cycle Presentation
Energize your message with a clean, visual journey that turns complex workflows into an easy-to-follow cycle. This presentation helps you explain stages, roles, and transitions with clarity while keeping your audience focused on what matters. Designed for business process overviews and strategy talks, it works seamlessly in PowerPoint, Keynote, and Google Slides.


5 diapositivas
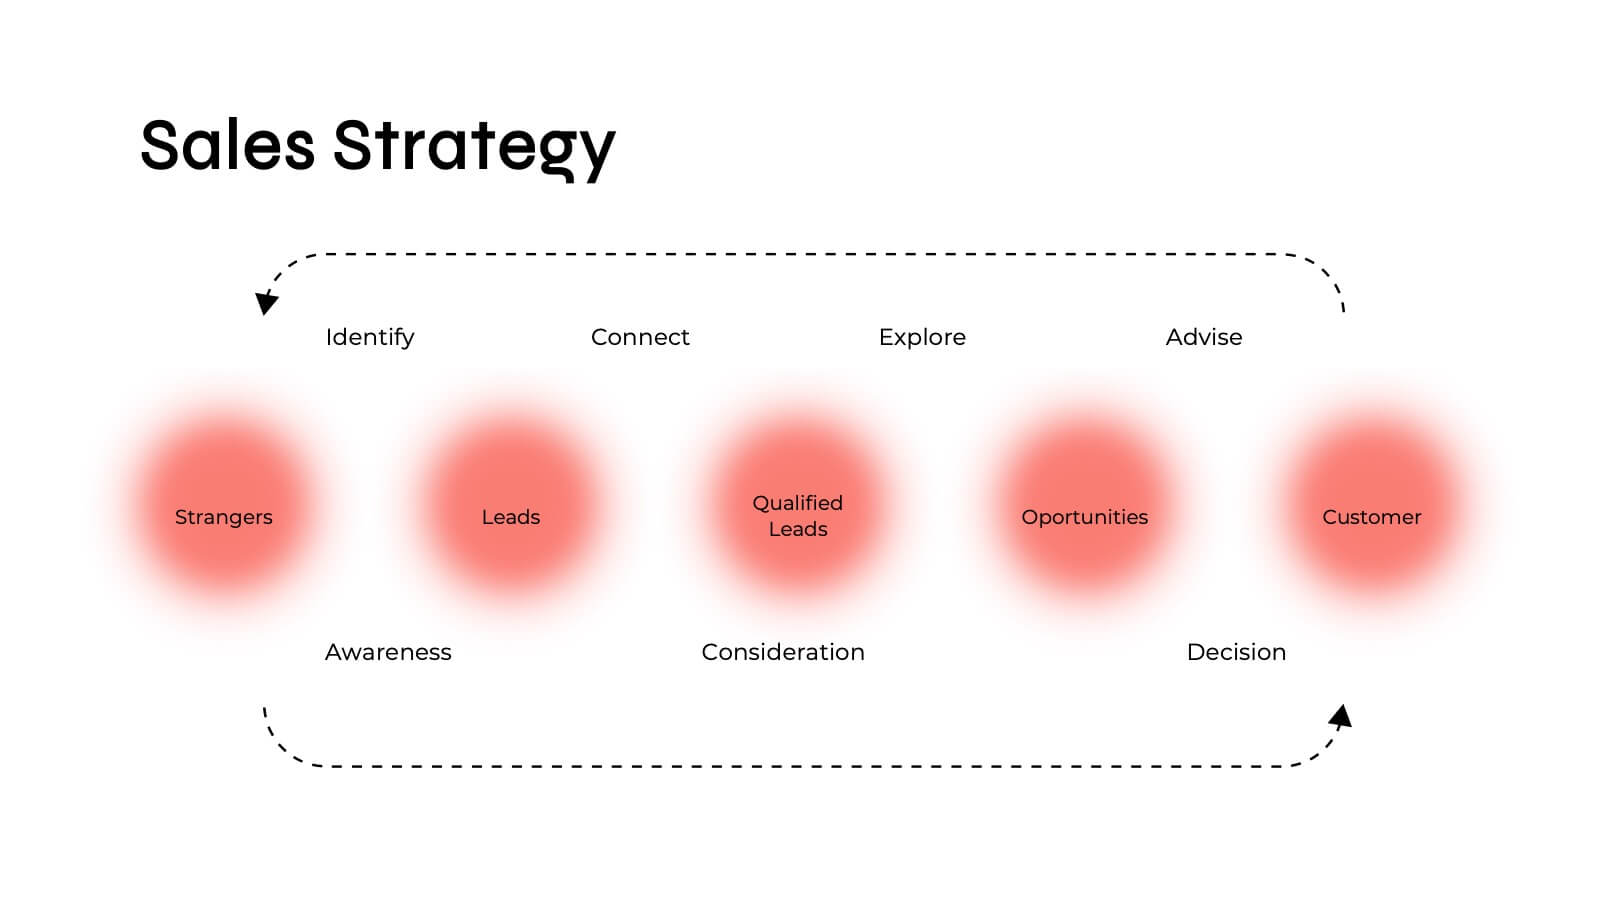
Scaling Operations and Team Expansion Presentation
Illustrate your company’s growth journey with the Scaling Operations and Team Expansion Presentation. This dynamic layout uses a circular sequence to showcase five key phases of business scaling, from small teams to full-scale departments. Perfect for strategy sessions, investor updates, and team meetings. Fully editable in Canva, PowerPoint, Keynote, and Google Slides.


5 diapositivas
Behavioral Psychology Diagram Presentation
Give your audience something to think about—literally. This bold and modern infographic layout lets you visualize complex human behavior patterns through simple, colorful brain-mapping diagrams. Perfect for presenting psychological insights, decision-making models, or behavioral science data. Fully compatible with PowerPoint, Keynote, and Google Slides for easy customization and professional use.


8 diapositivas
4-Quadrant Matrix Presentation
The "4-Quadrant Matrix Presentation" template is meticulously designed for strategic analysis and planning, perfect for visualizing business data across four key areas. Each quadrant highlights a distinct category, allowing for a comprehensive breakdown of information such as performance metrics, risk assessments, market trends, or operational efficiency. The template is color-coded to distinguish between the quadrants, making it visually engaging and easy to understand. Icons within each quadrant can be customized to symbolize different business functions or data points, enhancing the clarity and effectiveness of the presentation. This tool is ideal for executives, managers, and analysts who need to present complex data in a structured and insightful way, enabling informed decision-making and strategic planning in corporate settings.


20 diapositivas
Crescendo Creative Design Report Presentation
Transform your creative design report into a captivating presentation with a dynamic and professional template. This versatile format is tailored for designers, agencies, and creatives who want to showcase their design process, strategic approach, and project outcomes effectively. From design briefs and target audience insights to mood boards and prototypes, every slide is crafted to enhance clarity and visual appeal. Highlight unique elements, design systems, and implementation strategies with organized layouts that leave a lasting impression. Use the project timeline and feedback sections to narrate your journey and collaboration efforts seamlessly. Compatible with PowerPoint, Google Slides, and Keynote, this fully editable template adapts to your brand's needs. Engage stakeholders and clients with a polished, modern design that reflects your creative excellence.


4 diapositivas
Business KPI Metrics Dashboard Presentation
Track and present your key performance indicators clearly with this Business KPI Metrics Dashboard Presentation. Featuring modern gauge visuals, color-coded performance bars, and sectioned data blocks, this template helps you showcase financial, customer, and operational KPIs in a single glance. Fully editable and ideal for business reviews, team updates, and performance reports. Compatible with PowerPoint, Keynote, and Google Slides.


6 diapositivas
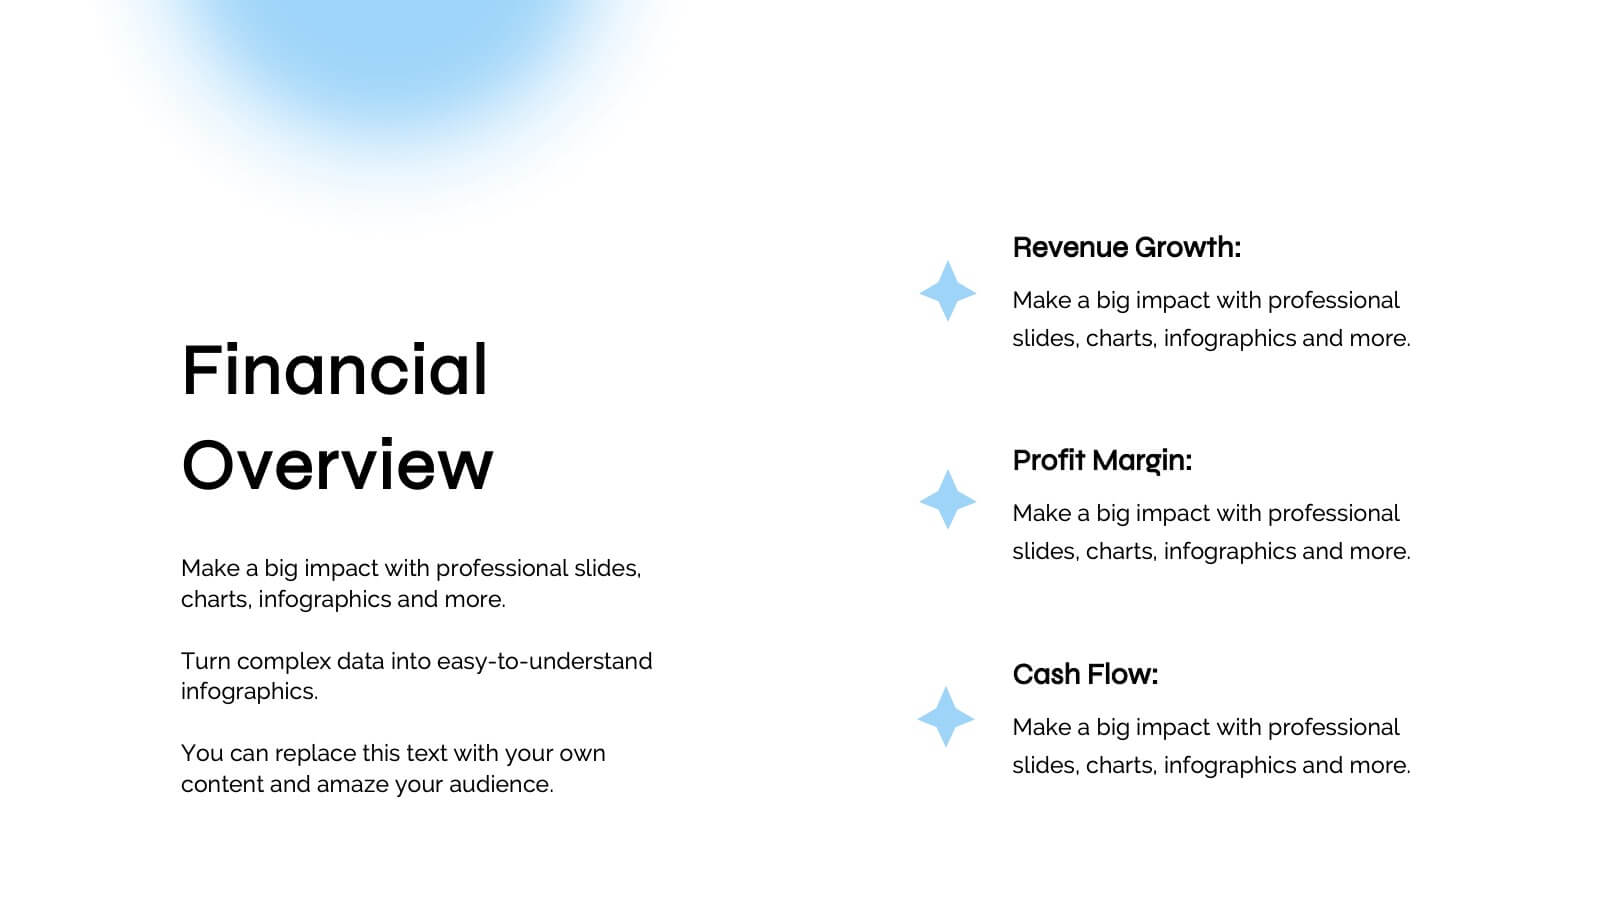
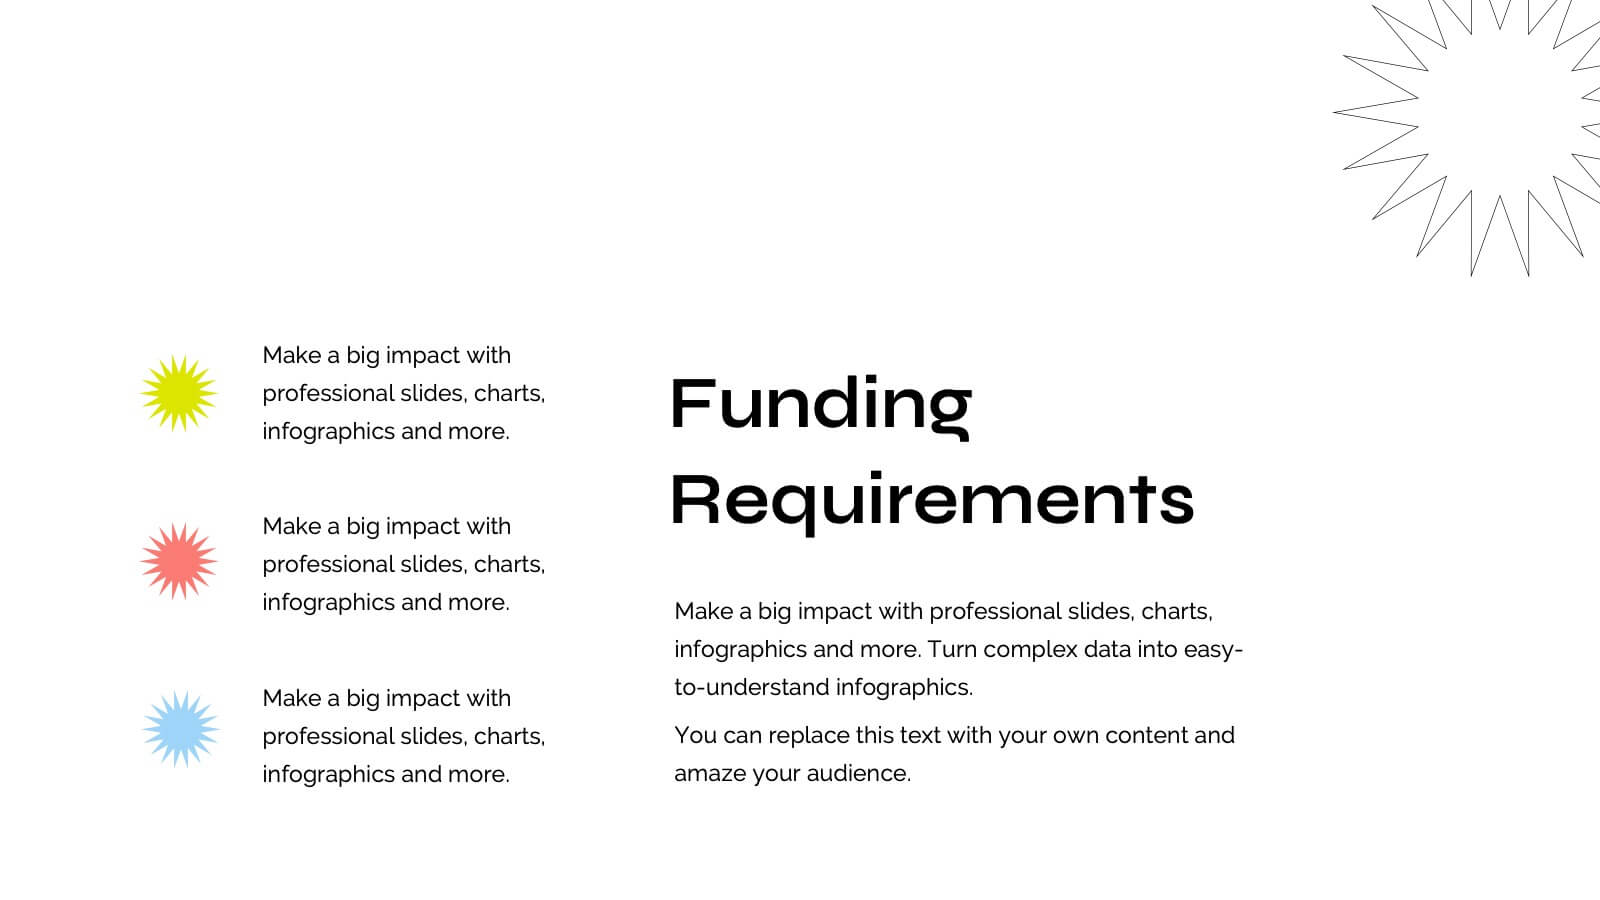
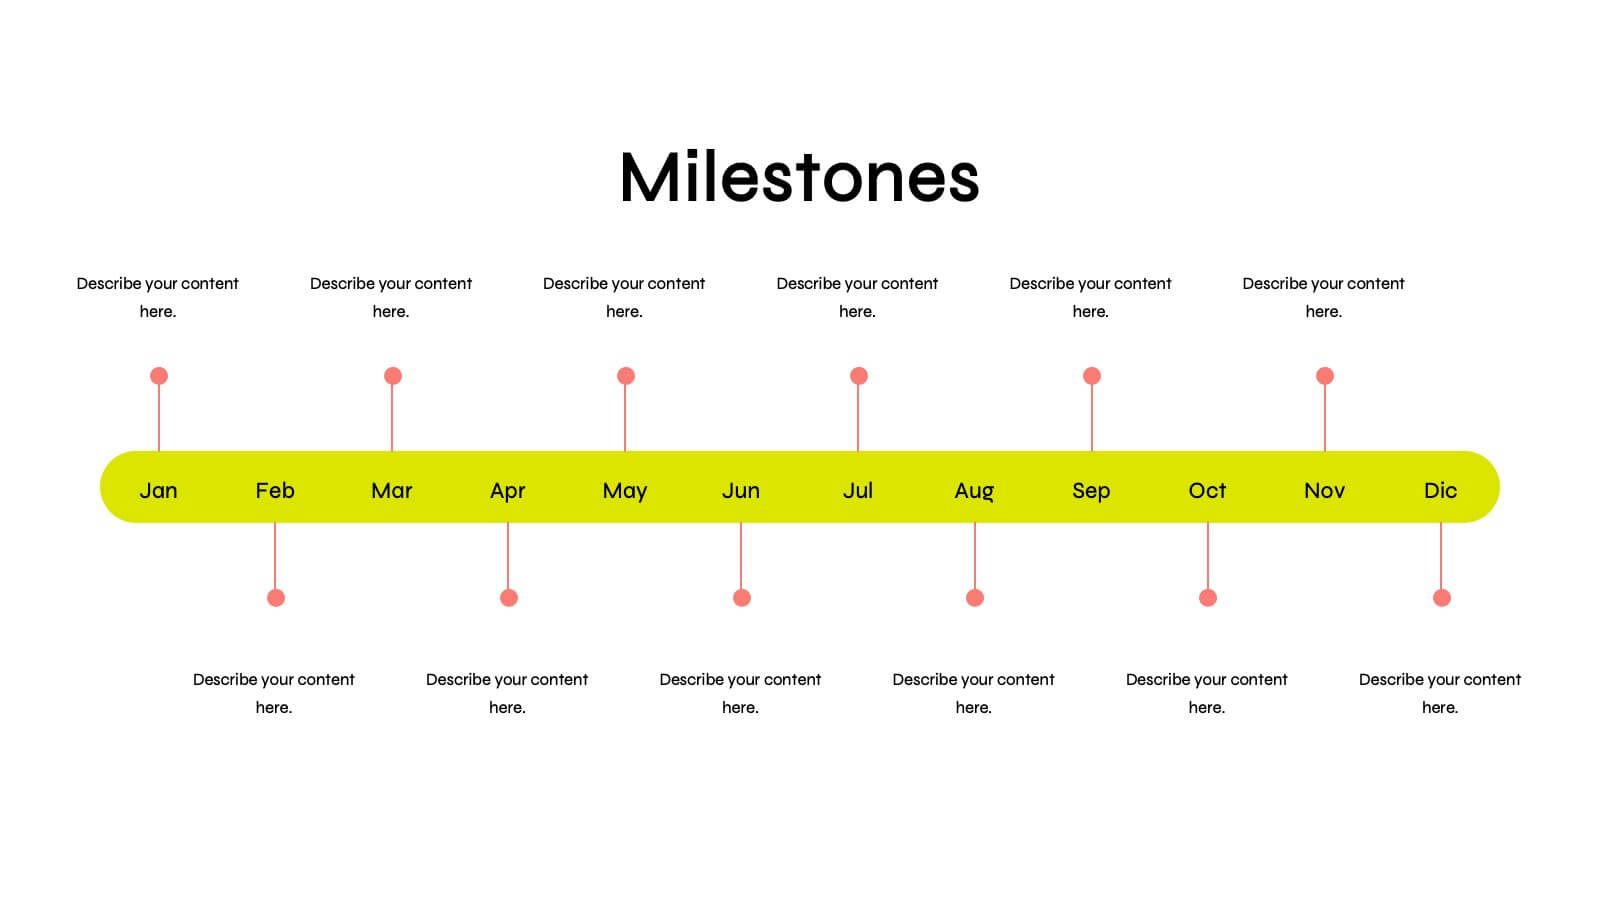
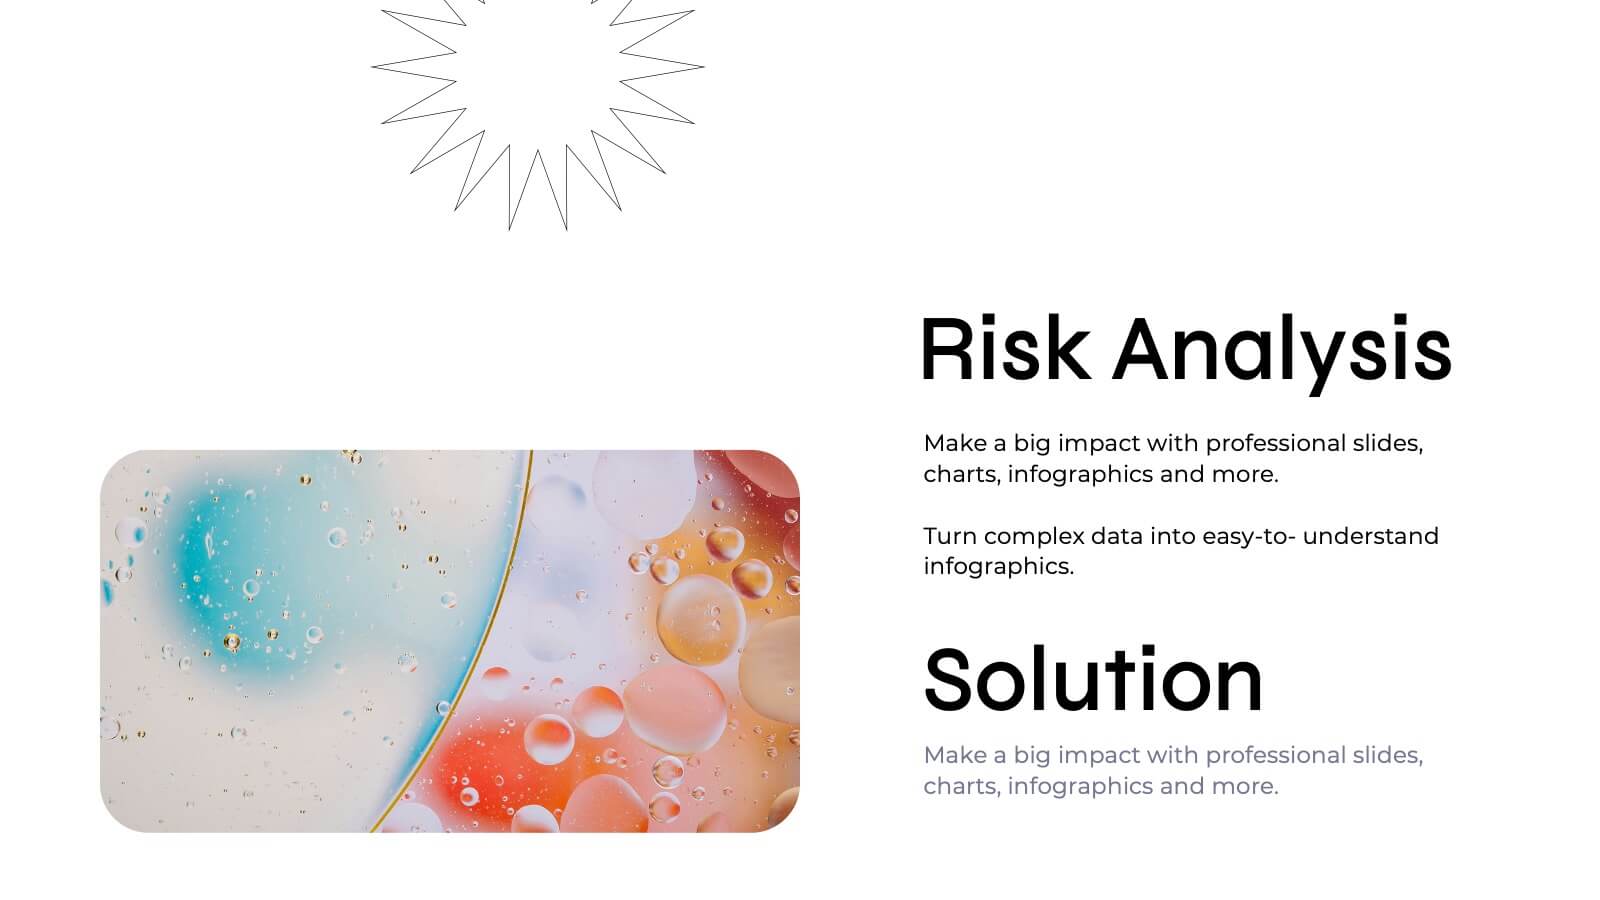
Professional Company Portfolio Presentation
Showcase Your Business Success with a Sleek Portfolio! The Professional Company Portfolio template is designed to highlight key achievements, performance metrics, and strategic insights with a modern, image-driven layout. Featuring three visually appealing sections, this template allows you to present KPIs, revenue growth, and business milestones in a compelling and structured way. Fully customizable in PowerPoint, Keynote, and Google Slides, this portfolio template is perfect for presentations, investor updates, and corporate showcases.


7 diapositivas
Science Infographic Presentation Template
A science infographic is a visual representation of scientific information or knowledge that aims to simplify and communicate complex scientific concepts in a clear and concise way. This template uses charts, images, and other elements to convey information, making it easier for your audience to understand and retain scientific information. Use this Science infographic to cover a wide range of scientific topics, from biology and physics to climate change and space exploration. This can be used in various settings, such as in educational settings, scientific publications, and popular media.

22 diapositivas
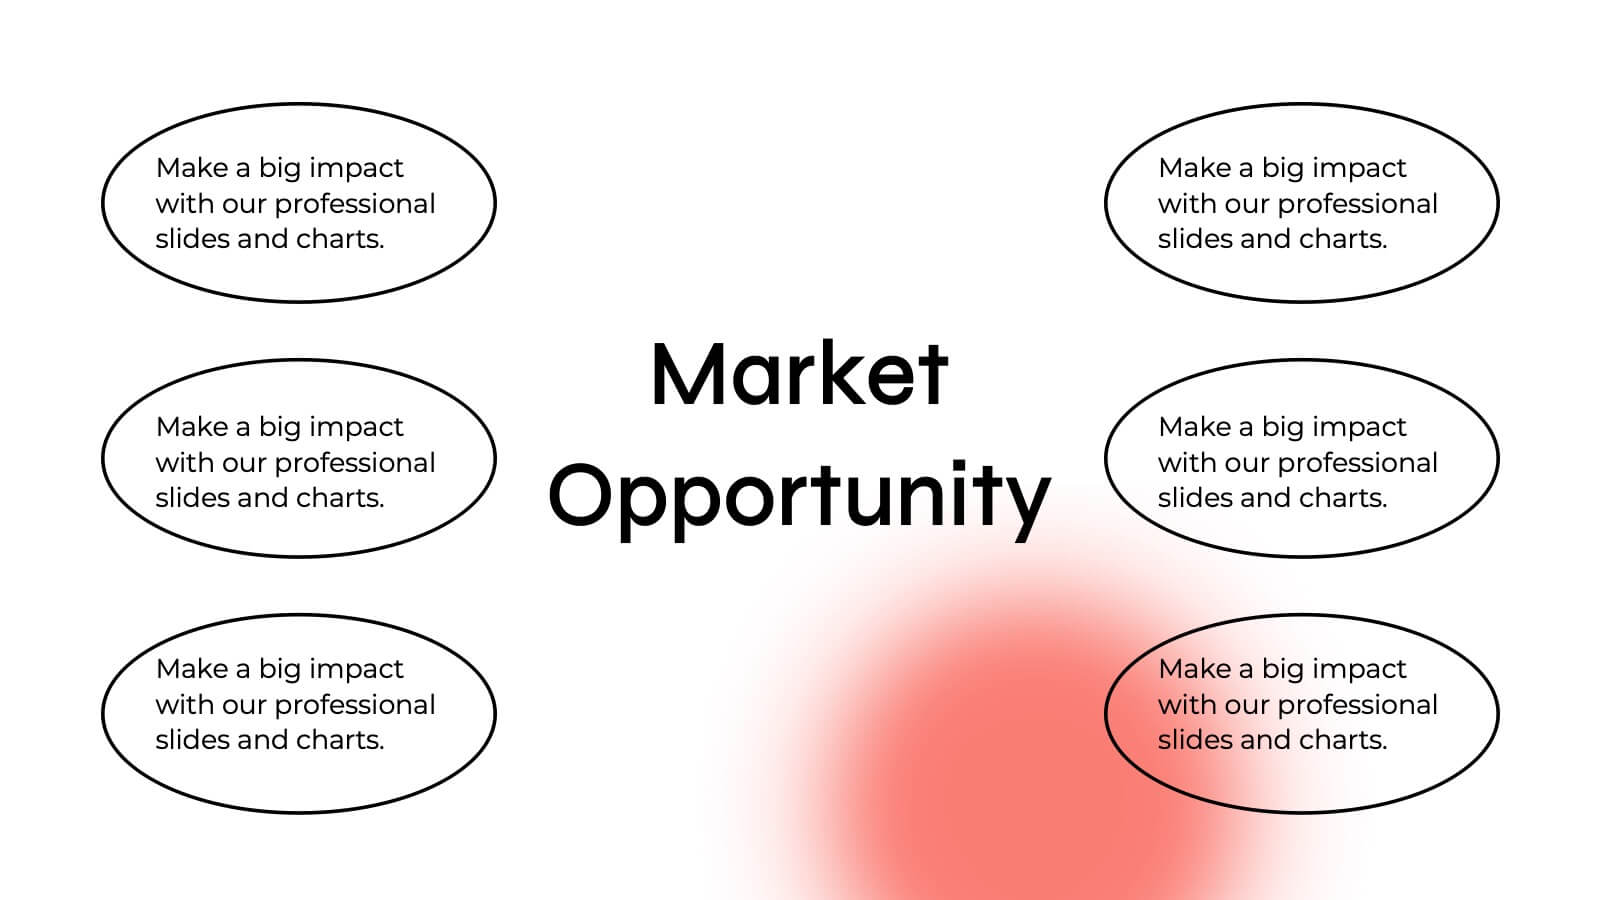
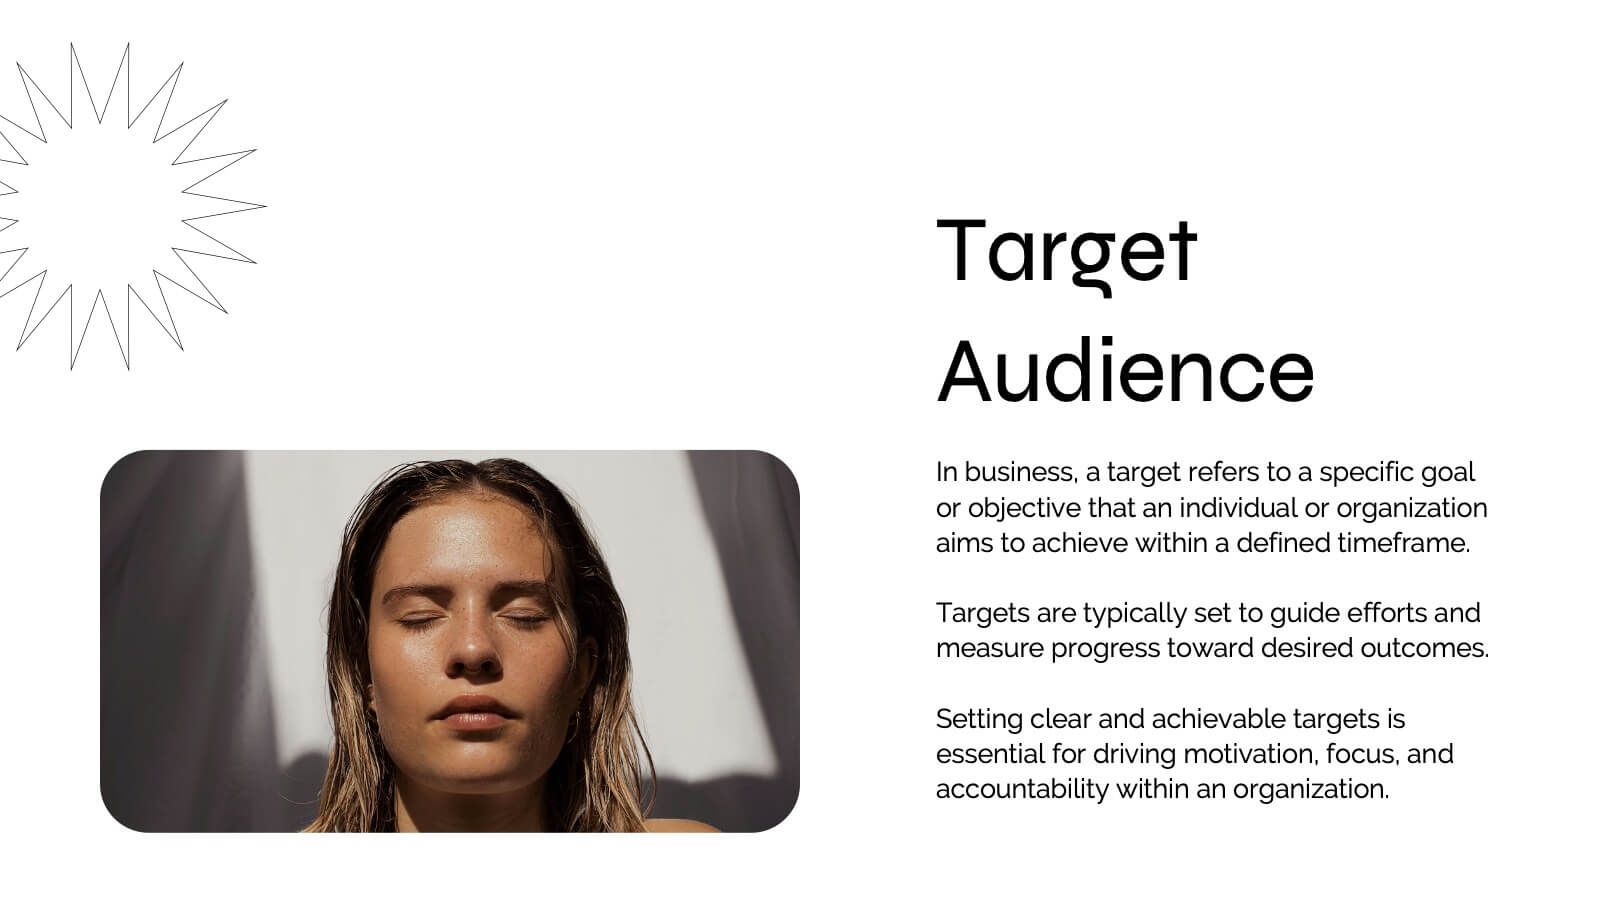
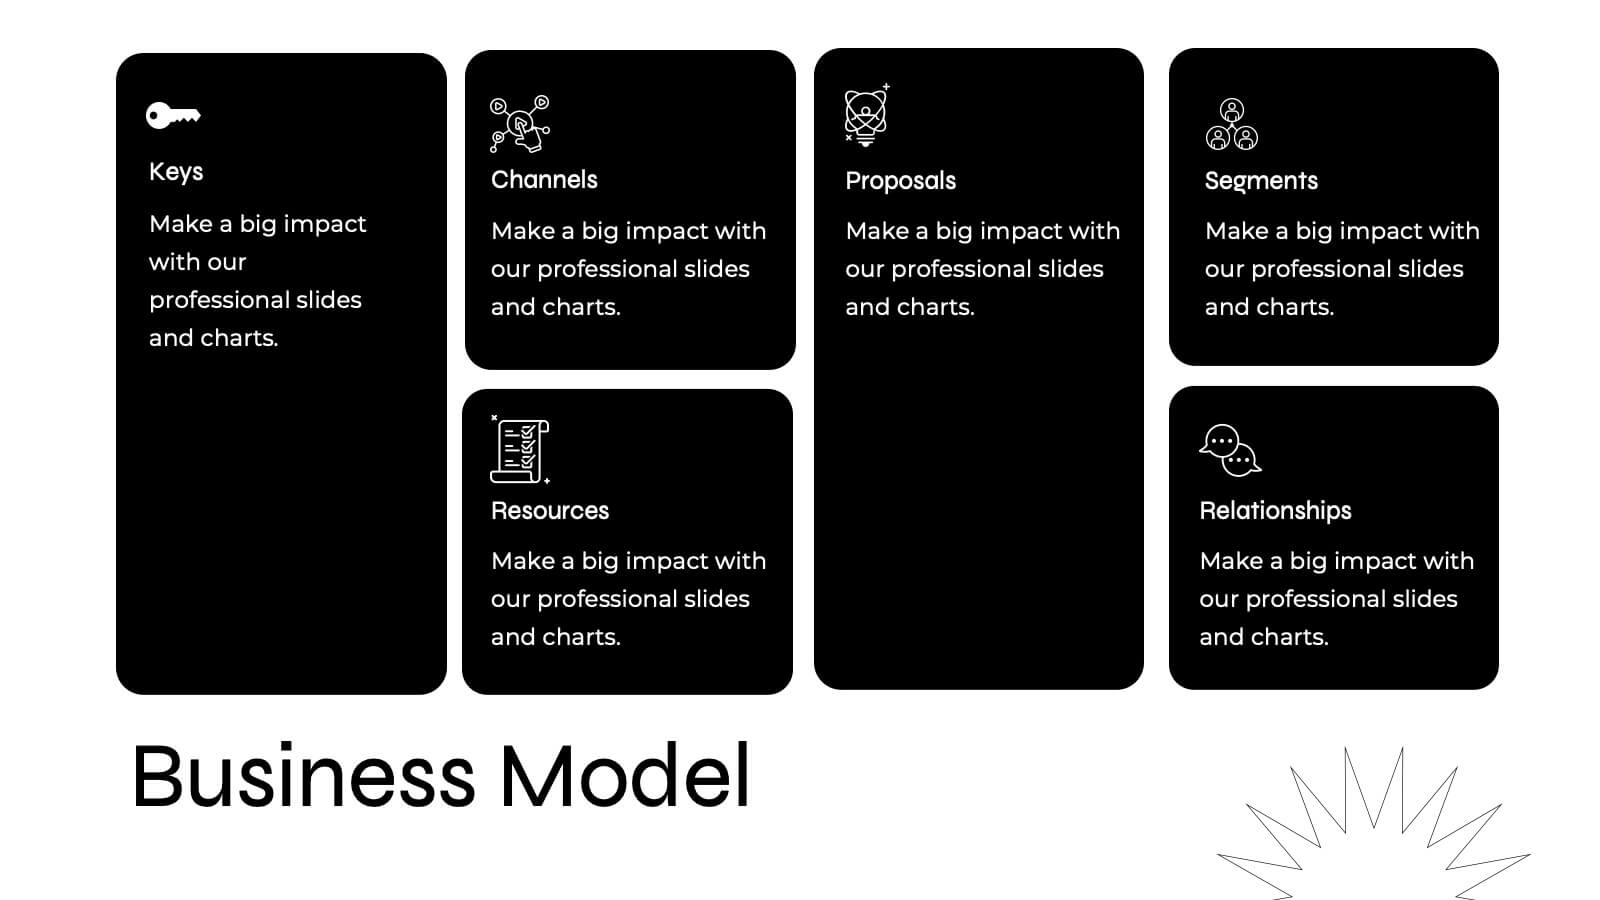
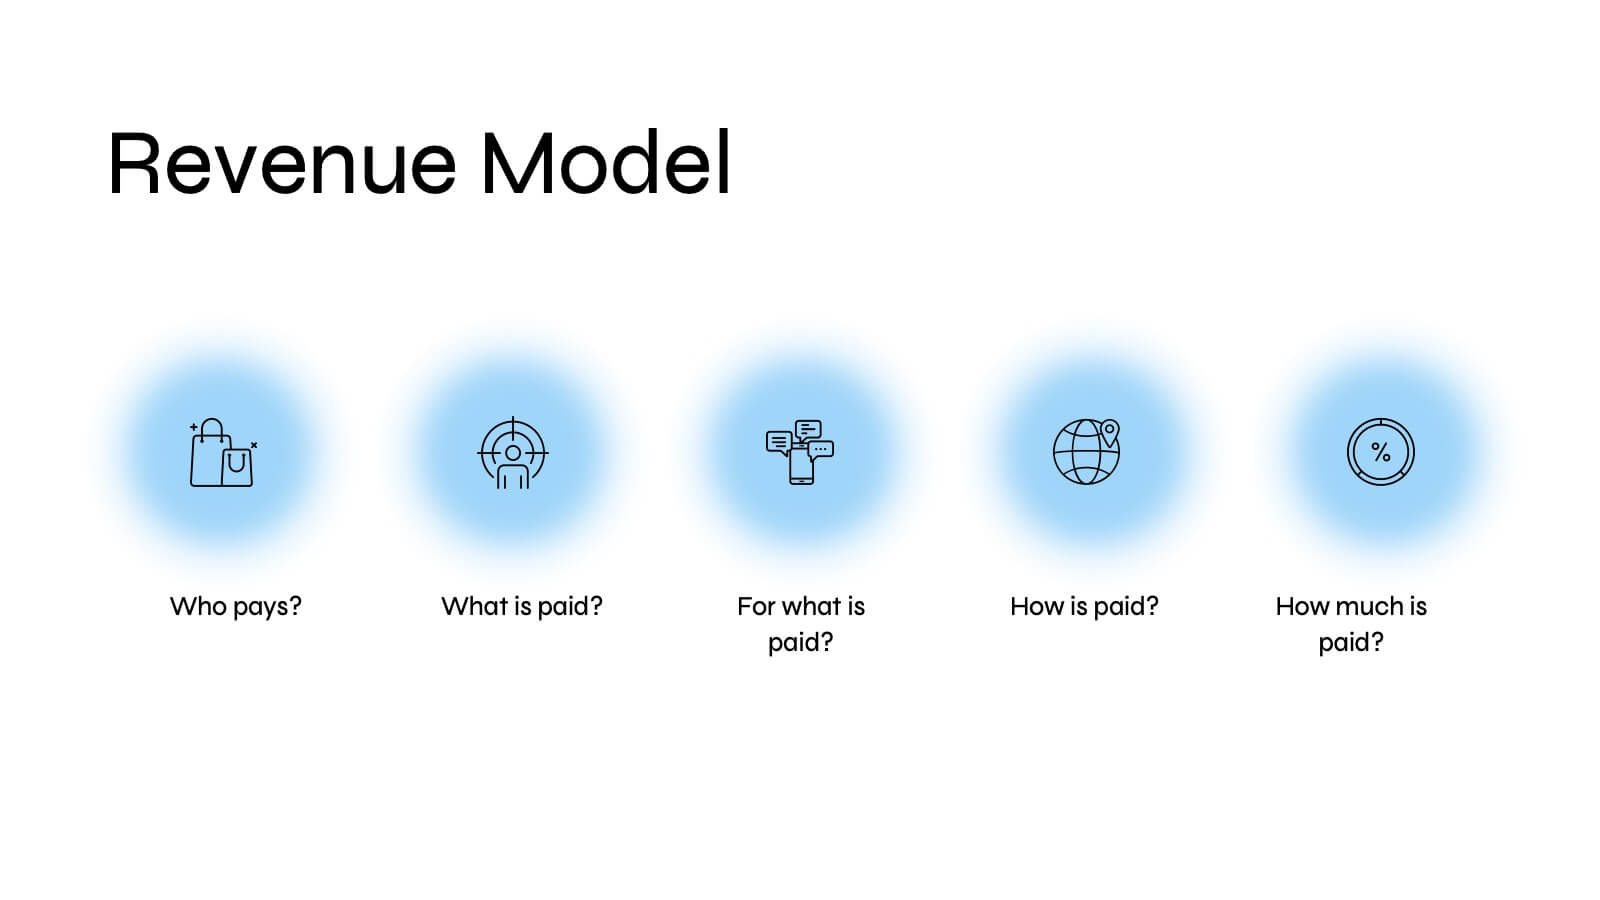
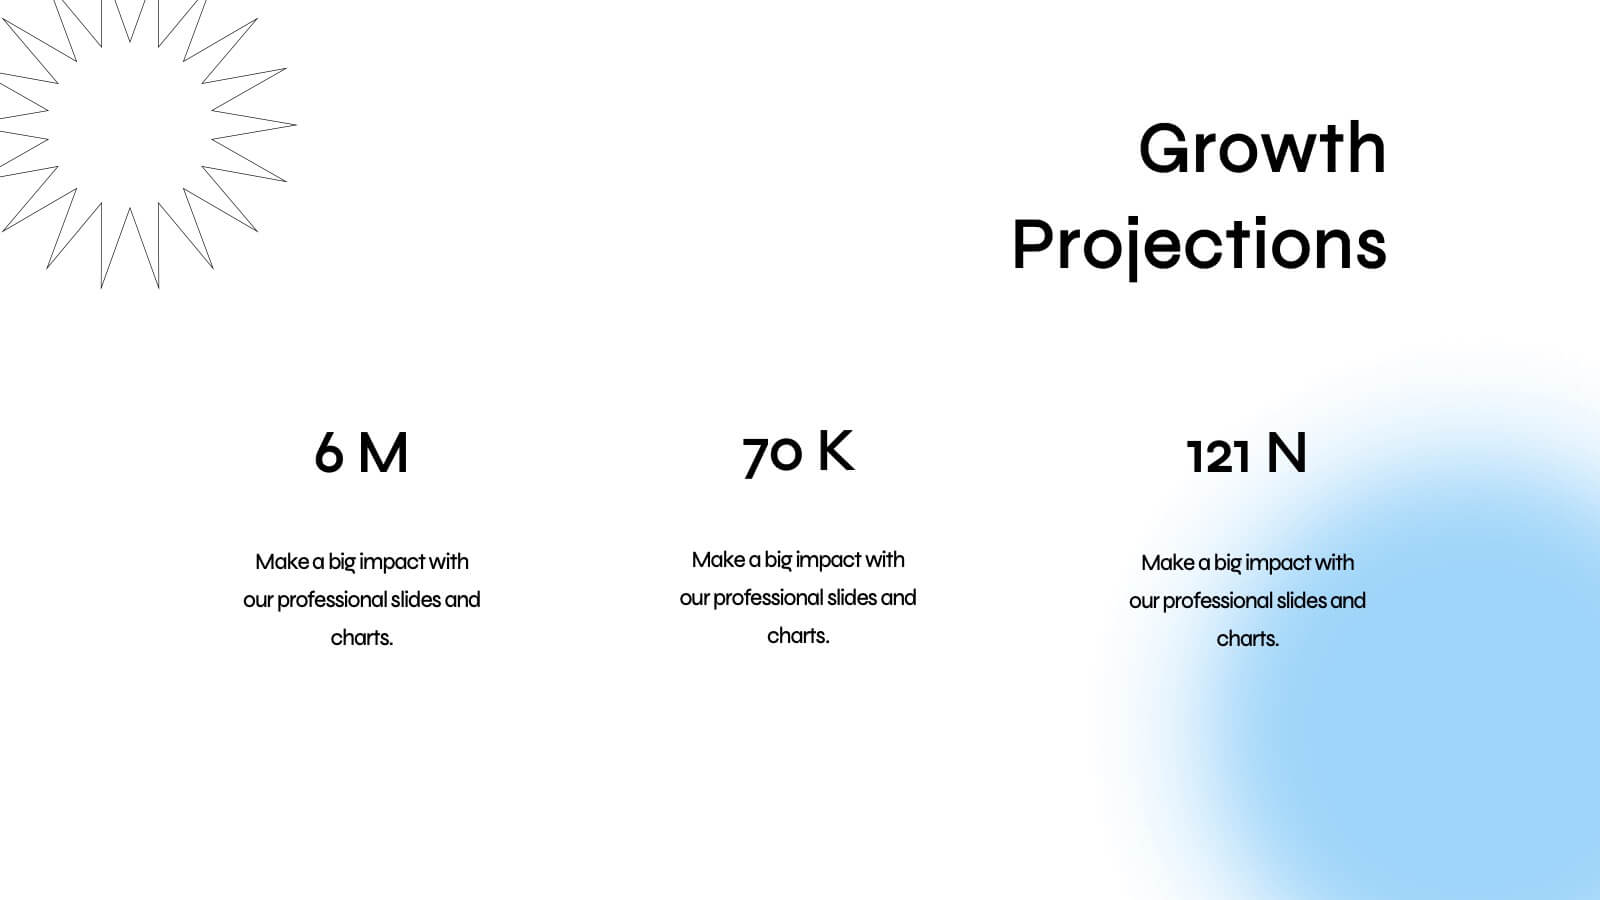
Quirinus Investor Pitch Presentation
Ready to impress investors and stakeholders? This sleek and modern pitch deck template covers all the essentials, from problem statements and market opportunities to revenue models and growth projections. Each slide is designed to convey clear and compelling information for maximum impact. Fully compatible with PowerPoint, Keynote, and Google Slides, making it the perfect tool for your next product launch!


4 diapositivas
Human Anatomy Infographic
Visualize internal body systems with clarity using this editable human anatomy slide. Ideal for educational, medical, or health-related topics, this layout helps present organs and body functions with precision. Fully customizable in PowerPoint, Keynote, and Google Slides—adjust labels, icons, and colors to fit your needs.


7 diapositivas
Professional Project Management Infographic Presentation
Project management is the process of planning, organizing, and overseeing resources and tasks to achieve goals and objectives within a defined timeframe. This template includes a clean, eye-catching design with plenty of space to add your content. This infographic template provides a step by step explanation of project management. It's the perfect way to explain complex projects easily to clients and employees. This template is compatible with Powerpoint, keynote and google slides making it easily customizable and editable. Use this for next project management research paper, presentation, etc.