


Características


¿Tienes alguna pregunta?
Recomendar


20 diapositivas
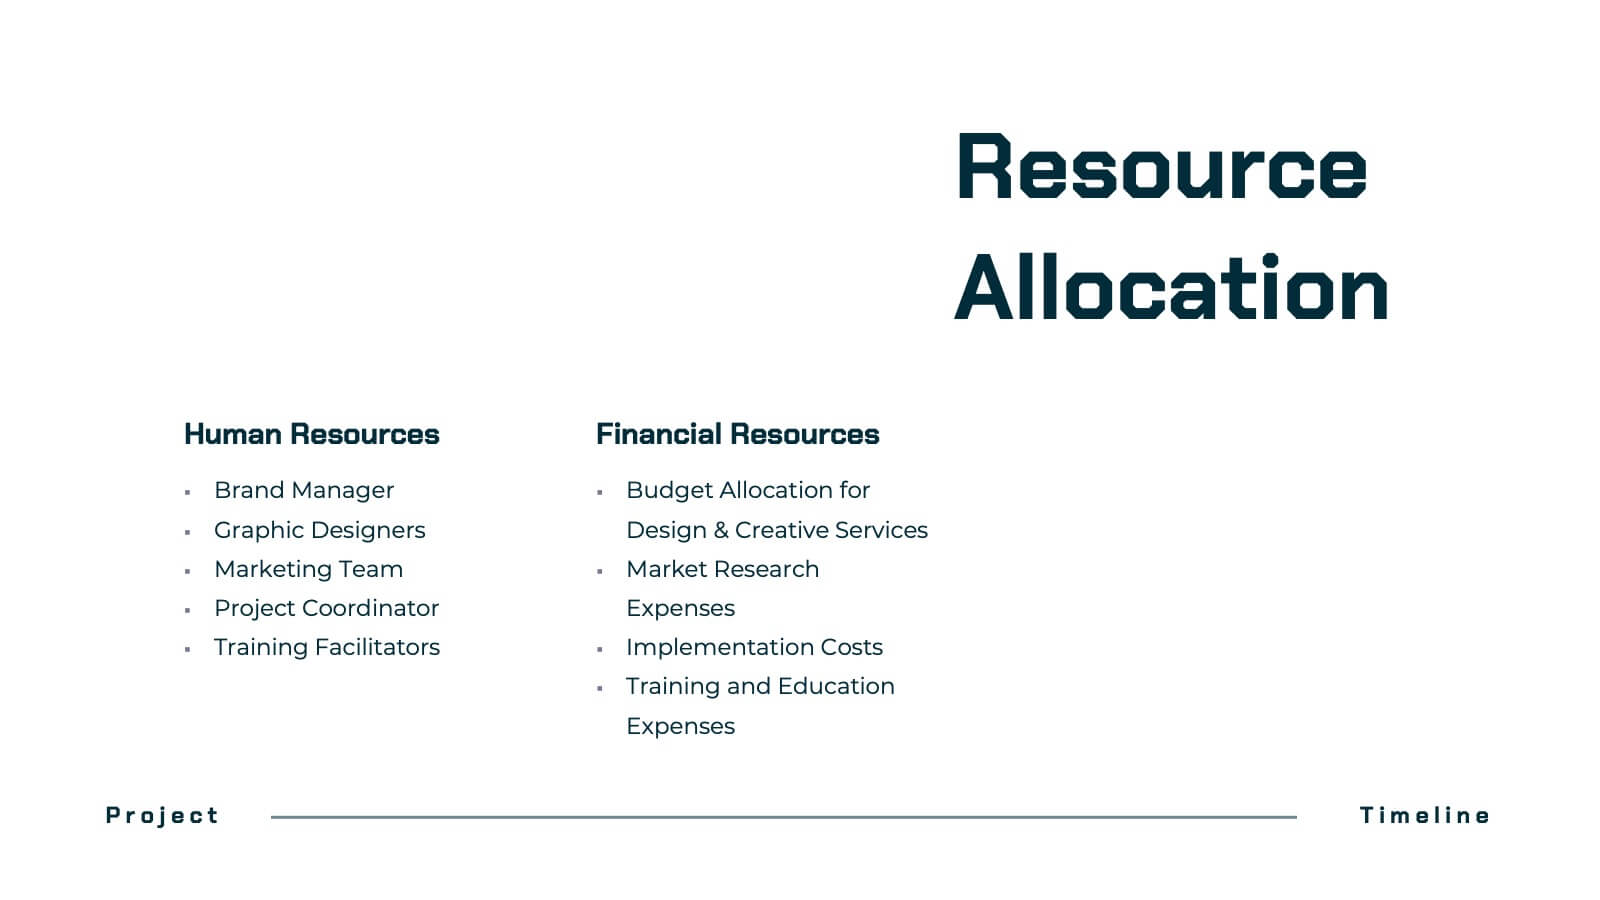
Dynastream Project Timeline Presentation
Stay on track with this detailed and well-organized project plan presentation designed for success! Covering essential areas like scope, objectives, timeline, budget breakdown, and risk management, it ensures every aspect of your project is clear and actionable. Perfect for team meetings or stakeholder updates, this template is fully compatible with PowerPoint, Keynote, and Google Slides.


7 diapositivas
Framework Infographics Presentation Template
A framework infographic is a visual representation of a structured approach or system for addressing a problem, organizing information, or making decisions. Our framework infographic is designed to help you understand complex concepts and to provide a visual roadmap that can be easily followed. This template makes an impact with a professional design, customizable text and graphics, and compelling visual content. If you need to display and share information, charts, graphs or lists in a creative way this template will guide you through each step to create a professional looking infographic.


6 diapositivas
Weekly Project Status Update Presentation
Keep your team aligned and your goals on track with this clear, structured layout designed to summarize weekly progress, milestones, and deliverables. Perfect for project managers and team leads, it turns updates into visuals that are easy to follow. Fully compatible with PowerPoint, Keynote, and Google Slides for smooth customization.


8 diapositivas
Chain of Command Mapping Presentation
Clarify your organizational flow with the Chain of Command Mapping Presentation. This template is ideal for visualizing reporting lines, departmental authority, and team structures in a clean, easy-to-follow format. Featuring modern icons, varied layouts, and editable labels, it helps simplify decision-making and responsibility tracking. Fully customizable in PowerPoint, Keynote, Canva, and Google Slides.


7 diapositivas
Roadmap Guide Infographic
A roadmap guide is a visual representation of the steps you need to take in order to reach your destination. A roadmap infographic is a great way to show your clients what the future will look like. Use this template to create an infographic that's high-energy, enthusiastic, and engaging. This infographic is designed to help guide you by showing where you are now, what direction you're going, and where you need to go next. This template is fully customizable and compatible with Powerpoint, Keynote, and Google Slides. Break down complex plans into easily digestible visual elements.


6 diapositivas
Efficient Workflow Management
Highlight process optimization, task delegation, or team productivity strategies using this linear gear-style workflow design. Perfect for operations leaders, project managers, or consultants presenting step-by-step plans. Fully customizable in PowerPoint, Keynote, and Google Slides—edit icons, text, and colors to fit your message.


5 diapositivas
Product Development Empathy Mapping
Bridge the gap between user insight and product success. This empathy mapping slide is perfect for product development teams to capture what users see, hear, think, feel, and experience—along with their pains and gains. Fully customizable and compatible with PowerPoint, Keynote, and Google Slides.


21 diapositivas
Mythspire Market Research Presentation
This market research template offers a clean design for presenting objectives, data collection, analysis, and findings. Perfect for showcasing research methodologies, visualizations, and actionable recommendations. Fully customizable and ideal for business or academic presentations. Compatible with PowerPoint, Keynote, and Google Slides.


4 diapositivas
Consumer Psychology in Marketing
Ever wonder what’s really going on inside a shopper’s mind? This infographic presentation explores the psychology behind consumer decisions, helping you visualize key buying patterns, emotional triggers, and marketing insights with clear, modern visuals. Fully customizable and easy to edit in PowerPoint, Keynote, and Google Slides.


7 diapositivas
Business People Networking Infographic
Networking is the lifeblood of any thriving business. Our business people networking infographic, designed in a pristine white backdrop with striking orange highlights and sophisticated black nuances, encapsulates the essence of professional connections and collaborations. It provides a visual representation of how relationships can foster growth, open opportunities, and catalyze success. Tailored for business leaders, conference organizers, and networking event planners, this template offers a compelling narrative of networking's power. Fully optimized, it's compatible with leading presentation platforms: PowerPoint, Keynote, and Google Slides.


6 diapositivas
Market Share Analysis Pie Chart
Clearly communicate competitive positioning with this market share pie chart layout. Ideal for showcasing data segments such as revenue splits, customer base percentages, or geographic market distribution. Each pie chart highlights a distinct insight, with editable text and values. Compatible with PowerPoint, Keynote, and Google Slides.


5 diapositivas
Step-by-Step Strategy Guide Presentation
Present your ideas with clarity and impact using this clean, structured layout made for professionals who value organization and design. Perfect for outlining strategies, steps, or lists, it keeps your message focused and engaging. Easily customizable and fully compatible with PowerPoint, Keynote, and Google Slides for polished results.


6 diapositivas
Commercial Real Estate Infographics
Explore the world of Commercial Real Estate with our customizable infographic template. This template is fully compatible with popular presentation software like PowerPoint, Keynote, and Google Slides, allowing you to easily customize it to illustrate and communicate various aspects of commercial real estate. The Commercial Real Estate infographic template offers a visually engaging platform to outline the different types of commercial properties, investment strategies, market trends, and the benefits of investing in commercial real estate. Whether you're a real estate professional, investor, business owner, or simply interested in the world of commercial properties, this template provides a user-friendly canvas to create informative presentations and educational materials. Deepen your knowledge of Commercial Real Estate with this SEO-optimized infographic template, thoughtfully designed for clarity and ease of use. Customize it to showcase property types (e.g., office, retail, industrial), financing options, risk management, and the potential for income and growth, ensuring that your audience gains valuable insights into this lucrative sector. Start crafting your personalized infographic today to explore the realm of Commercial Real Estate.


12 diapositivas
Timeline Path to Market Strategy Presentation
Outline your market strategy with this step-by-step timeline slide. Ideal for product launches, go-to-market plans, or business rollouts. Includes 6 editable phases with directional arrows, year markers, and text boxes for customization. Fully compatible with PowerPoint, Keynote, and Google Slides—perfect for marketers, strategists, and business development teams.


6 diapositivas
Startup Business Launch Framework Presentation
Showcase your startup journey with the Startup Business Launch Framework Presentation. This step-by-step visual illustrates four key stages in your business launch process—from ideation to execution—using ascending blocks and modern icons. Ideal for founders, incubators, and pitch decks. Fully customizable in PowerPoint, Keynote, Google Slides, and Canva.


5 diapositivas
Employee Benefits and Compensation Presentation
Effectively communicate your company’s value proposition with this Employee Benefits and Compensation Presentation. This clean and professional diagram highlights four key benefit categories in a circular flow, perfect for HR teams, onboarding materials, or internal strategy reviews. Easily editable in PowerPoint, Keynote, or Google Slides, it's ideal for showcasing wellness perks, bonuses, insurance, and more.


7 diapositivas
Budget Forecasting and Planning Infographic
The Budget Forecasting and Planning infographic template is designed to simplify financial planning and forecasting. It is compatible with PowerPoint, Google Slides, and Keynote. This set of slides offers a variety of charts, including bar graphs and dot matrices, to compare projected and actual budget figures over different periods. The template uses a color-coding system to differentiate between quarters or fiscal years, and it provides placeholders for detailed descriptions of budget items. It's an excellent tool for financial analysts, accountants, and business managers who need to present budget forecasts, variances, and financial strategies in a clear and visually engaging manner.