Data-Driven Feedback Analysis Presentation
PowerPoint Template and Google Slides Theme


Características
Etiquetas
- Eliminar de favoritos
Plantilla de PowerPoint
1 MB
Plantilla de Google Slides
Enlace externo
Plantilla de Keynote
2 MB
Recomendar
- Eliminar de favoritos
Plantilla de PowerPoint
1 MB
Plantilla de Google Slides
Enlace externo
Plantilla de Keynote
2 MB
6 diapositivas
Evolution of an Industry Through Time Presentation
Visualize industry transformation with the Evolution of an Industry Through Time Presentation. This timeline-style layout is perfect for highlighting key milestones, technological shifts, or growth stages across decades. Ideal for consultants, educators, or corporate strategists. Fully editable in Canva, PowerPoint, Keynote, and Google Slides for easy adaptation.
- Eliminar de favoritos
Plantilla de PowerPoint
1 MB
Plantilla de Google Slides
Enlace externo
Plantilla de Keynote
2 MB
6 diapositivas
Team Work Environment Infographic
A team work environment refers to the conditions and culture within a group of individuals who come together to work collaboratively on a common goal or project. This infographic template highlights the importance of teamwork and fosters a positive team-oriented workplace culture. The design emphasizes the key elements and benefits of a collaborative work environment, encouraging employees to work together effectively and efficiently. This infographic features illustrations that depict employees working together, collaborating, and supporting one another. This reinforces the idea of teamwork and unity within the organization.
- Eliminar de favoritos
Plantilla de PowerPoint
1 MB
Plantilla de Google Slides
Enlace externo
Plantilla de Keynote
1 MB
8 diapositivas
Meeting Agenda Presentation
Streamline your meeting agendas with our "Meeting Agenda Presentation" template. This design features a central node linked to four key points, each representing a separate agenda item, ensuring a clear and organized discussion flow. Color-coded segments aid in visually distinguishing between topics, making it easy for participants to follow and engage. Ideal for team meetings, project updates, and strategic discussions, this template enhances communication and efficiency. Its intuitive layout keeps your sessions on track and productive. Compatible with PowerPoint, Keynote, and Google Slides, it's an essential tool for any professional aiming to optimize their meeting presentations.
- Eliminar de favoritos
Plantilla de PowerPoint
1 MB
Plantilla de Google Slides
Enlace externo
Plantilla de Keynote
1 MB
4 diapositivas
Value Innovation with Blue Ocean Strategy Presentation
Showcase the balance between value creation and innovation using this dual puzzle layout. Perfect for comparing customer benefits and strategic actions side by side. Each piece is icon-supported for clarity and visual appeal. Fully editable in PowerPoint, Keynote, and Google Slides—ideal for strategy, business development, or executive briefings.
- Eliminar de favoritos
Plantilla de PowerPoint
1 MB
Plantilla de Google Slides
Enlace externo
Plantilla de Keynote
2 MB
10 diapositivas
Post-Pandemic Business Strategy Presentation
Help your team adapt to the new normal with this sleek and professional slide layout. Featuring a sanitizer bottle graphic as a central metaphor, the design visually supports your content on strategic recovery, operational safety, or workflow changes. Includes four editable text sections, each with modern icons. Ideal for HR, leadership updates, or business continuity plans. Compatible with PowerPoint, Keynote, and Google Slides.
- Eliminar de favoritos
Plantilla de PowerPoint
1 MB
Plantilla de Google Slides
Enlace externo
Plantilla de Keynote
1 MB
6 diapositivas
7S Framework for Organizational Alignment Presentation
Present a cohesive organizational strategy using the 7S Framework slide. With hexagonal visuals highlighting key elements—Strategy, Structure, Systems, Shared Values, Style, Staff, and Skills—this template simplifies complex alignment concepts. Ideal for leadership, consulting, or HR presentations. Fully editable for PowerPoint, Google Slides, and Keynote to match your brand.
- Eliminar de favoritos
Plantilla de PowerPoint
1 MB
Plantilla de Google Slides
Enlace externo
Plantilla de Keynote
1 MB
4 diapositivas
Construction Project Planning
Streamline your workflow and improve clarity with this vibrant project planning wheel designed for construction professionals. This slide helps visualize key phases—such as planning, team coordination, and logistics—using color-coded segments and editable icons. Perfect for architects, contractors, and project managers. Fully customizable in PowerPoint, Keynote, and Google Slides.
- Eliminar de favoritos
Plantilla de PowerPoint
1 MB
Plantilla de Google Slides
Enlace externo
Plantilla de Keynote
1 MB
5 diapositivas
Editable Mind Mapping Presentation
Clarify complex thoughts with the Editable Mind Mapping Presentation. This sleek template features a central profile design with five branching points to visualize ideas, processes, or strategies. It's perfect for brainstorming sessions, team collaboration, or project planning. Fully customizable and compatible with PowerPoint, Keynote, and Google Slides.
- Eliminar de favoritos
Plantilla de PowerPoint
1 MB
Plantilla de Google Slides
Enlace externo
Plantilla de Keynote
1 MB
5 diapositivas
Strategic Roadmap with Milestone Tracks
Chart your progress with clarity using the Strategic Roadmap with Milestone Tracks Presentation. This visual template showcases a dotted milestone path connecting key yearly events or business phases—perfect for illustrating timelines, strategic goals, and transformation journeys. Fully editable in PowerPoint, Keynote, and Google Slides.
- Eliminar de favoritos
Plantilla de PowerPoint
5 MB
Plantilla de Google Slides
Enlace externo
Plantilla de Keynote
7 MB
26 diapositivas
The Origins of Carnival Presentation
Dive deep into the vibrant and rich history of carnival celebrations around the world with this colorful, engaging, and beautifully designed presentation template. Designed to bring the festive spirit of these global celebrations to life, each slide bursts with the energy and exuberance of carnival's rich traditions. From the lively streets of Rio to the masks of Venice, the template explores the origins and evolution of carnival through a series of beautifully crafted slides. Featuring a palette that captures the flamboyance of carnival costumes and the rhythm of the samba, this template provides a perfect backdrop for educators, historians, or event organizers to share their insights. The layouts are carefully structured to guide the audience through a timeline of historical events, key figures, and cultural significances, enriched with maps, iconic imagery, and thematic icons. Infographics and comparative slides are intricately designed to highlight the diversity of carnival practices across different cultures, making complex information easily digestible and visually appealing. Whether it's for a classroom setting, a cultural seminar, or a festive corporate event, this template ensures your presentation will be as captivating as a carnival parade.
- Eliminar de favoritos
Plantilla de PowerPoint
1 MB
Plantilla de Google Slides
Enlace externo
Plantilla de Keynote
1 MB
5 diapositivas
Financial Overview and Money Flow Presentation
Showcase financial performance and money distribution with this clear, layered infographic. Each stack segment represents a key insight—ideal for budgets, cost analysis, or income flow presentations. Simple yet visually effective, it's perfect for helping stakeholders see the full picture. Fully compatible with PowerPoint, Keynote, and Google Slides.
- Eliminar de favoritos
Plantilla de PowerPoint
1 MB
Plantilla de Google Slides
Enlace externo
Plantilla de Keynote
1 MB
4 diapositivas
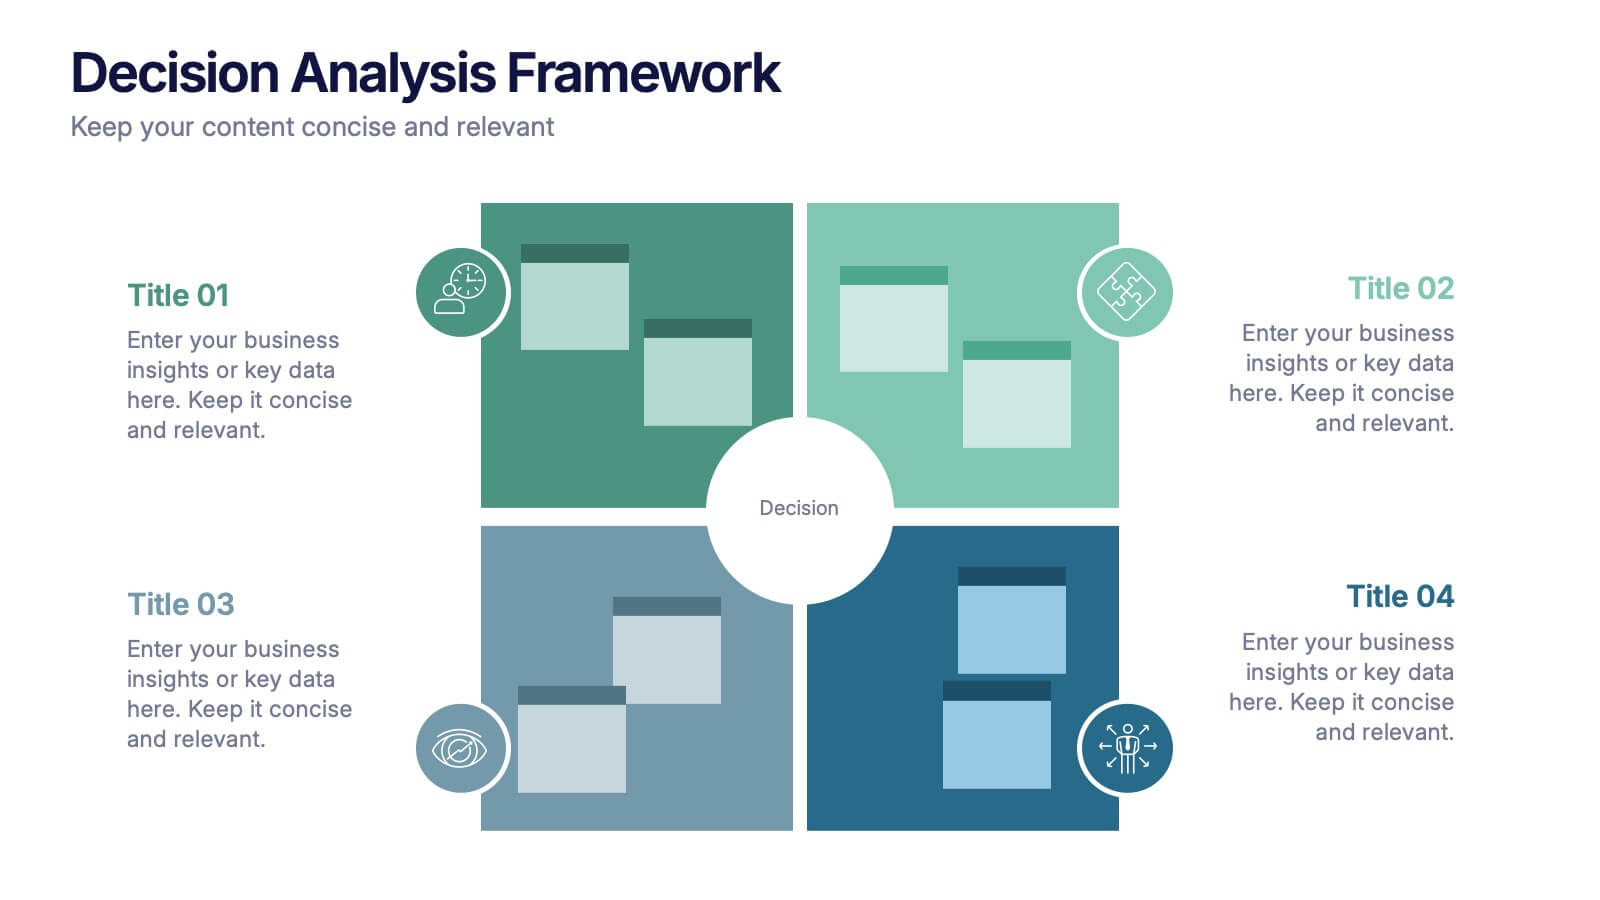
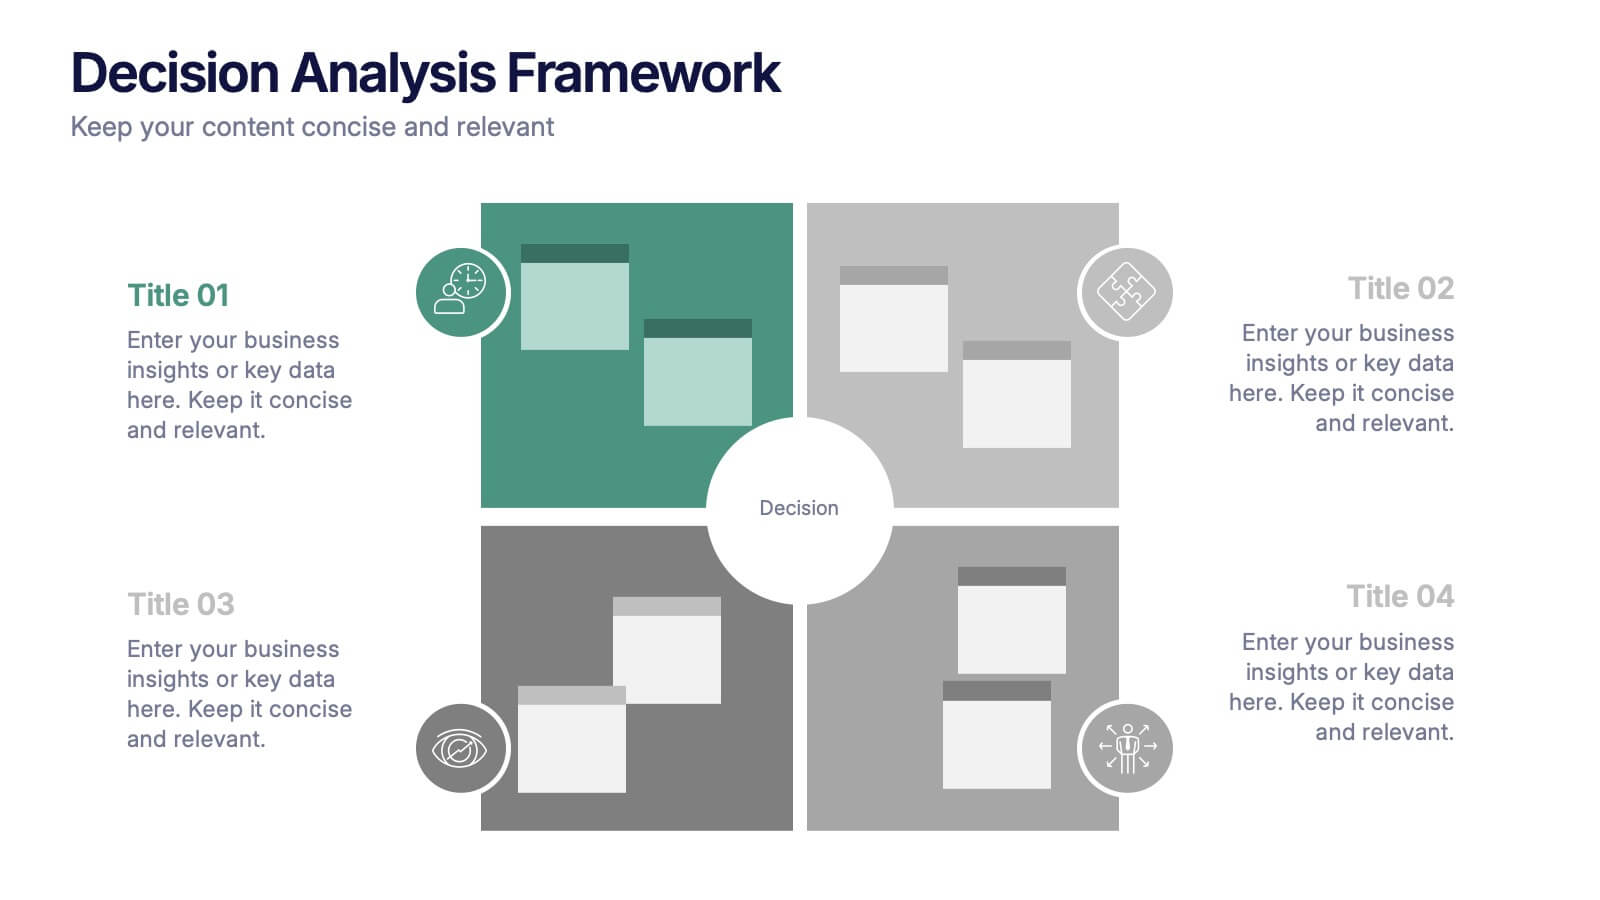
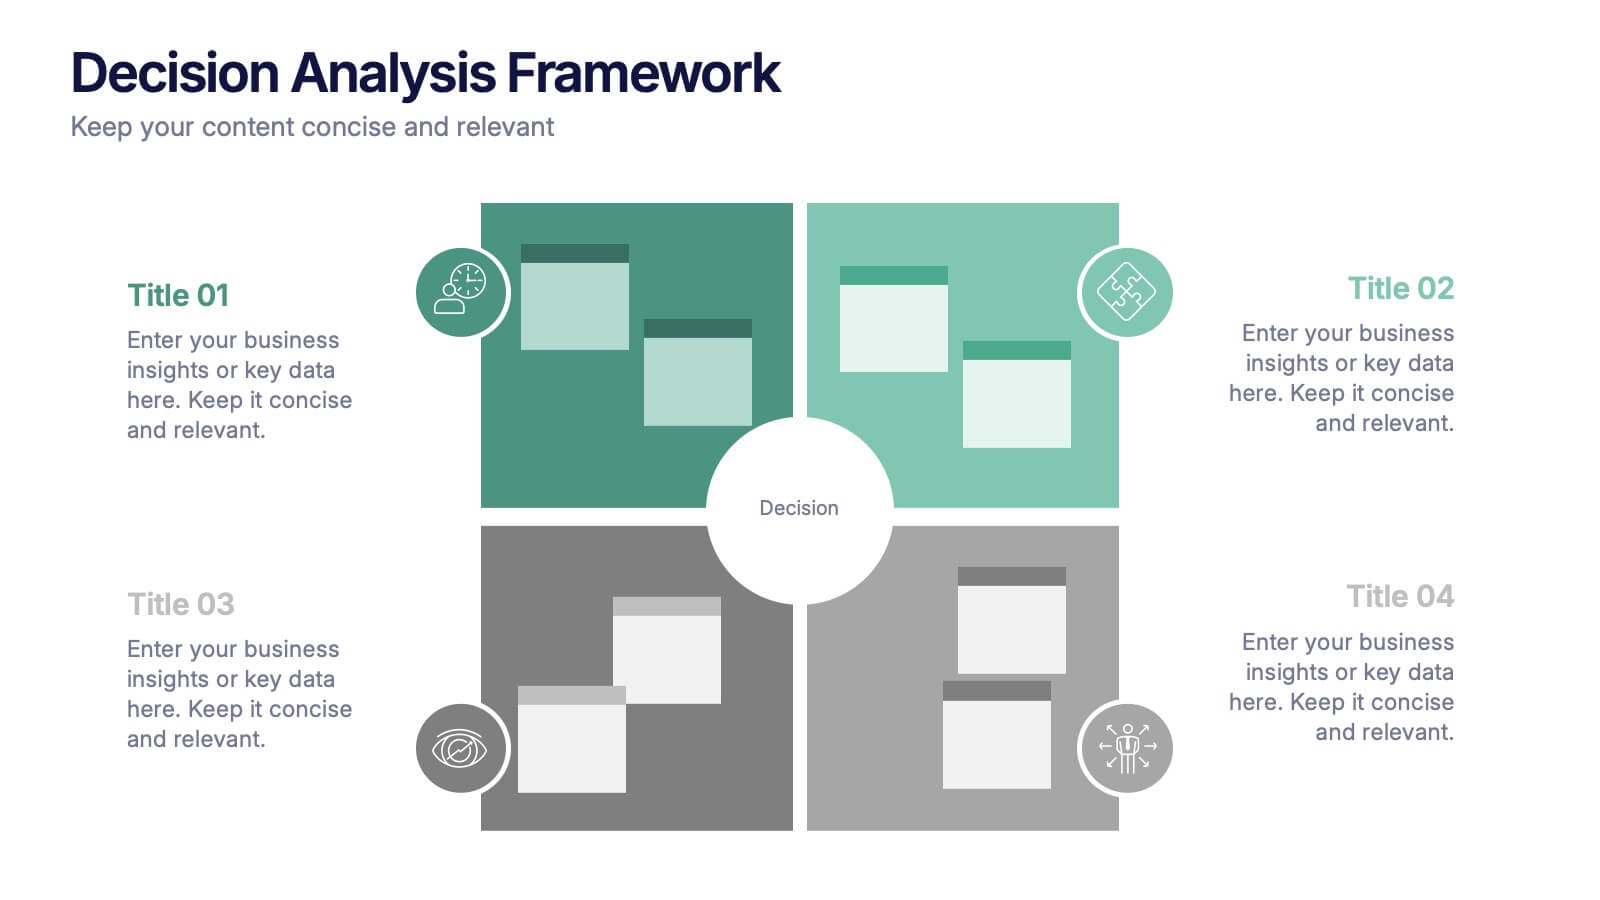
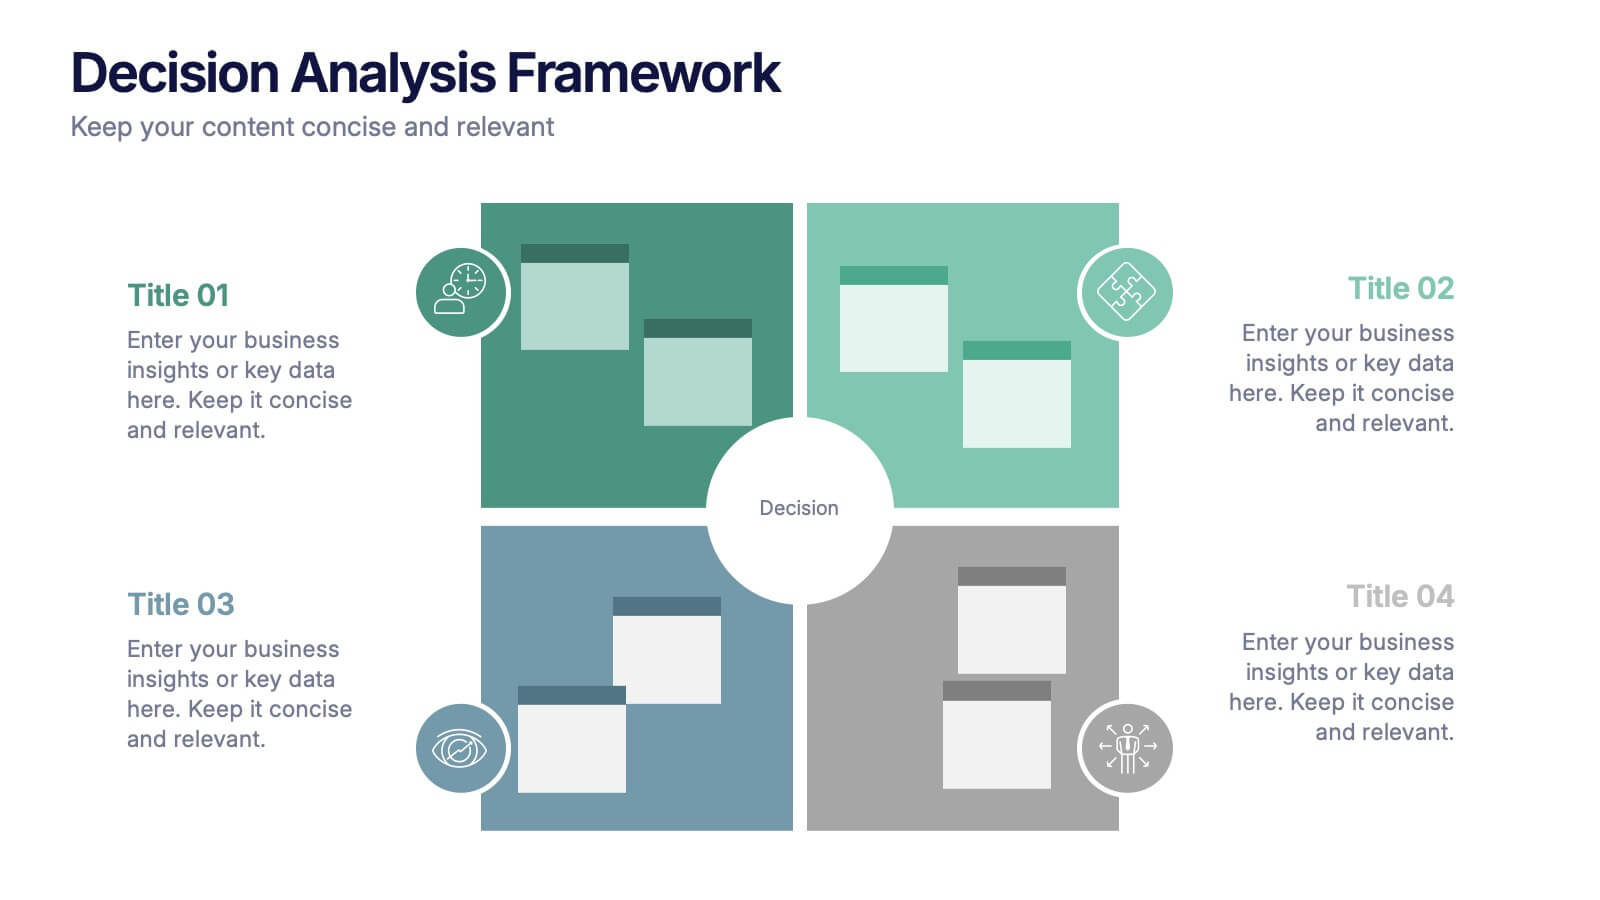
Decision Analysis Framework Presentation
Make every choice smarter with this structured and visually balanced template designed to showcase options, outcomes, and key insights. Ideal for strategy meetings or data-driven reports, it helps you present decisions with confidence and clarity. Fully editable and compatible with PowerPoint, Keynote, and Google Slides for seamless customization.
- Eliminar de favoritos
Plantilla de PowerPoint
1 MB
Plantilla de Google Slides
Enlace externo
Plantilla de Keynote
2 MB
6 diapositivas
Funding Request Project Proposal
Visually communicate your project's financial needs using this tiered Funding Request Project Proposal slide. With a stacked layout ideal for outlining budget categories or funding stages, it’s perfect for grant applications, investor decks, or internal pitches. Fully customizable in PowerPoint, Keynote, and Google Slides.
- Eliminar de favoritos
Plantilla de PowerPoint
1 MB
Plantilla de Google Slides
Enlace externo
Plantilla de Keynote
1 MB
5 diapositivas
Digital Marketing Infographics
Digital Marketing refers to the use of digital channels, platforms, and strategies to promote products, services, and brands to reach and engage with target audiences. These infographic templates are perfect for explaining concepts, illustrating processes, showcasing data, or comparing information. They are commonly used in digital marketing to provide information to clients, educate consumers, and promote products and services. These Infographics can be shared on social media, websites, and blogs to increase engagement and drive traffic to a brand's online presence. Compatible with Powerpoint, Keynote, and Google Slides.
- Eliminar de favoritos
Plantilla de PowerPoint
Enlace externo
Plantilla de Google Slides
Enlace externo
Plantilla de Keynote
Enlace externo
7 diapositivas
Venn Diagram Statistics Infographic Presentation
Venn diagrams are important because they show relationships between two or more ideas. The circles—either filled in with color or left empty—create a picture of how things relate to one another, while arrows show which things are overlapping. This template is easy to use and has a cool green color scheme that is easy on the eyes. It has a customizable layout to make your presentation unique! With this template, you can create awesome Venn Diagrams that will help you compare and contrast information in a way that is easy to understand. This is perfect for school projects or even work presentations.
- Eliminar de favoritos
Plantilla de PowerPoint
1 MB
Plantilla de Google Slides
Enlace externo
Plantilla de Keynote
2 MB
10 diapositivas
Business Growth and Market Statistics Presentation
Showcase key business growth trends and market insights with the "Business Growth and Market Statistics" presentation templates. These visuals are crafted to enhance clarity in communicating growth drivers, market dynamics, and performance metrics effectively. Ideal for corporate presentations, they're compatible with PowerPoint, Keynote, and Google Slides, ensuring a professional look across all platforms.
- Eliminar de favoritos
Plantilla de PowerPoint
1 MB
Plantilla de Google Slides
Enlace externo
Plantilla de Keynote
2 MB
6 diapositivas
Remote Learning and Virtual Classrooms Presentation
Visualize the modern classroom experience with this six-step layout centered around a laptop graphic. Each point is displayed in a colorful speech bubble, making it perfect for showcasing online learning tools, virtual engagement strategies, or course delivery methods. Ideal for educators, trainers, and e-learning professionals, this slide is fully editable and works seamlessly in PowerPoint, Keynote, and Google Slides.


