


Características


¿Tienes alguna pregunta?
Recomendar


6 diapositivas
Break Even Options Infographic
Break-even analysis is a financial calculation that helps businesses determine the point at which their total revenue equals their total costs, resulting in neither a profit nor a loss. This infographic template provides a clear visual representation of the concept of breakeven in options trading, helping traders understand the point at which profits and losses balance out. This template is a valuable tool for businesses to assess the level of sales needed to cover their costs and begin making a profit. Use this template to provide your viewers insights and help make informed decisions to optimize operations.


5 diapositivas
Space Science Infographics
Space science, also known as astronomy, is the scientific study of celestial objects, phenomena, and the physical universe beyond Earth. These infographic templates explore various aspects of space science and astronomy. They are designed to present complex concepts and data in a visually engaging format, making it accessible to a wide range of audiences. These infographics incorporate stunning cosmic illustrations and visuals to represent celestial bodies, space phenomena, and scientific concepts related to space science. They covers a range of key topics in space science, such as black holes, the solar system, space exploration, and more.


26 diapositivas
Company Profile Geometric Presentation
A company profile is a document or presentation that provides an overview of a business or organization. This presentation template serves as a marketing tool to showcase the company's strengths, capabilities, products, history, and achievements. Use this template to effectively showcases your company's identity, values, and services. The presentation is designed to leave a lasting impression on potential clients, partners, investors, and stakeholders. With its clean lines and geometric elements, the template exudes a sense of sophistication and contemporary style. Compatible with Powerpoint, Keynote, and Google Slides.


4 diapositivas
Veterinary Medicine and Animal Health Presentation
Bring animal healthcare insights to life with this playful and professional slide, featuring an illustrated dog and four food bowls to represent key veterinary topics. Ideal for clinics, pet wellness brands, or animal science presentations. Fully editable in PowerPoint, Keynote, or Google Slides.


5 diapositivas
Climate Change Effects Infographics
Climate Change refers to long-term shifts in weather patterns and average temperatures on Earth. These infographic templates aim to raise awareness about the urgent need for climate action and illustrate the consequences of environmental changes. These can serve as impactful tools for discussing the consequences of climate change. Whether used in educational settings, environmental campaigns, or climate conferences, this template effectively communicates the urgency of the situation and encourages individuals and communities to take action to mitigate the impacts of climate change. Compatible with Powerpoint, Keynote, and Google Slides.


5 diapositivas
Medical Systems and Drug Research Overview Presentation
Present critical insights with this heart-themed infographic, ideal for showcasing medical systems, drug development stages, or treatment data. The visual layout supports four key points with a clear, engaging style. Fully customizable in PowerPoint, Keynote, and Google Slides—perfect for researchers, healthcare analysts, and pharmaceutical presentations.


8 diapositivas
Concept Mapping with Bubble Map Presentation
Create a visually engaging Concept Mapping with Bubble Map presentation to organize ideas, processes, or strategies effectively. This customizable template enhances clarity in brainstorming sessions, strategic planning, and educational content. Compatible with PowerPoint, Keynote, and Google Slides.


5 diapositivas
Business Issue Root Cause Identification
Pinpoint the real reasons behind business challenges with this clear and visual layout. This root cause identification template breaks down effects and traces them back to their sources, making it easier to align your team and propose actionable solutions. Fully customizable in PowerPoint, Keynote, and Google Slides.


7 diapositivas
Pyramid Model Infographic
A pyramid model is a visual representation that uses the structure of a pyramid to convey information, concepts, or hierarchies in a clear and visually engaging manner. Our Pyramid Model Infographic template is the perfect tool to depict your concepts in a structured way. This template embodies an essence, enabling you to present your ideas in a way that's both powerful and timeless. This infographic is a powerful representation of your ideas, allowing you to showcase their strength, structure, and enduring potential. Use this template to construct a visual masterpiece that stands tall, just like the pyramids of ancient times!


6 diapositivas
Sustainability Management Analysis Infographics
Explore the world of Sustainability Management with our customizable infographic template. This template is fully compatible with popular presentation software like PowerPoint, Keynote, and Google Slides, allowing you to easily customize it to illustrate and communicate various aspects of sustainability management. The Sustainability Management infographic template offers a visually engaging platform to explore and explain the principles, strategies, and initiatives related to sustainability within organizations. Whether you're a sustainability professional, business leader, or simply interested in environmental responsibility, this template provides a user-friendly canvas to create informative presentations and educational materials. Deepen your understanding of Sustainability Management with this SEO-optimized infographic template, thoughtfully designed for clarity and ease of use. Customize it to highlight key sustainability goals, best practices, metrics, and the importance of sustainable business practices, ensuring that your audience gains a comprehensive understanding of this critical field. Start crafting your personalized infographic today to delve into the world of Sustainability Management.


24 diapositivas
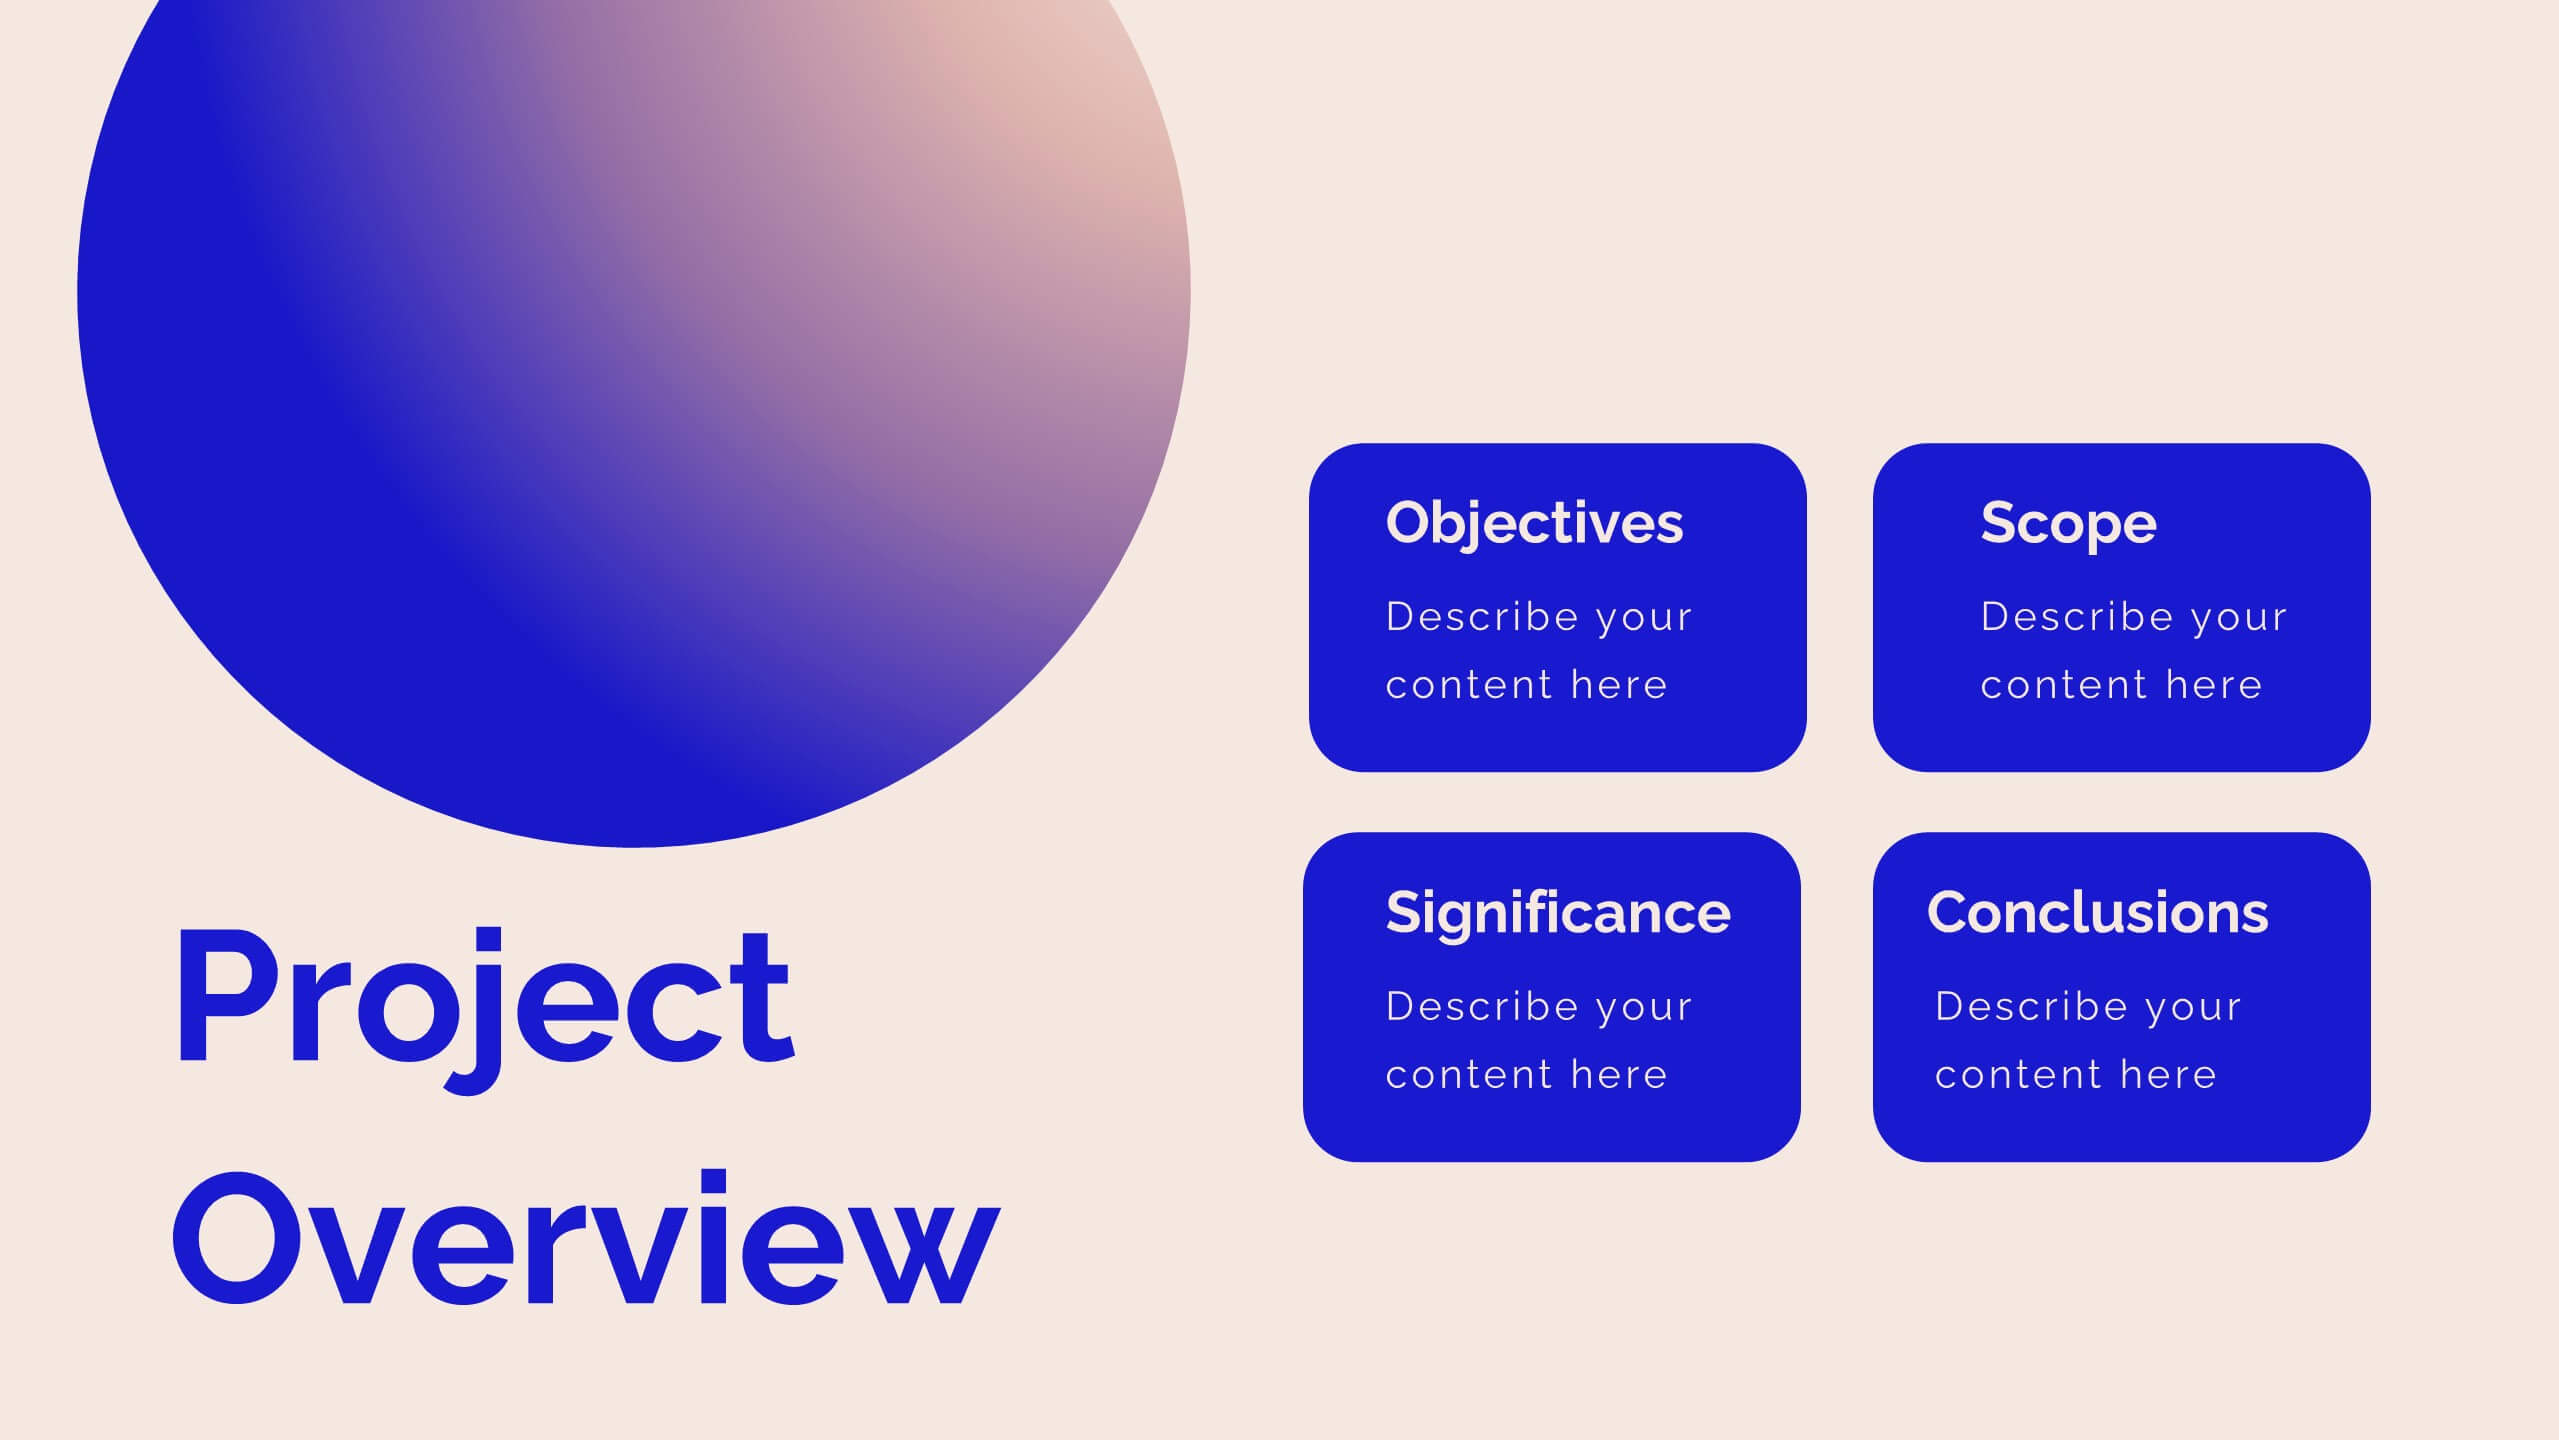
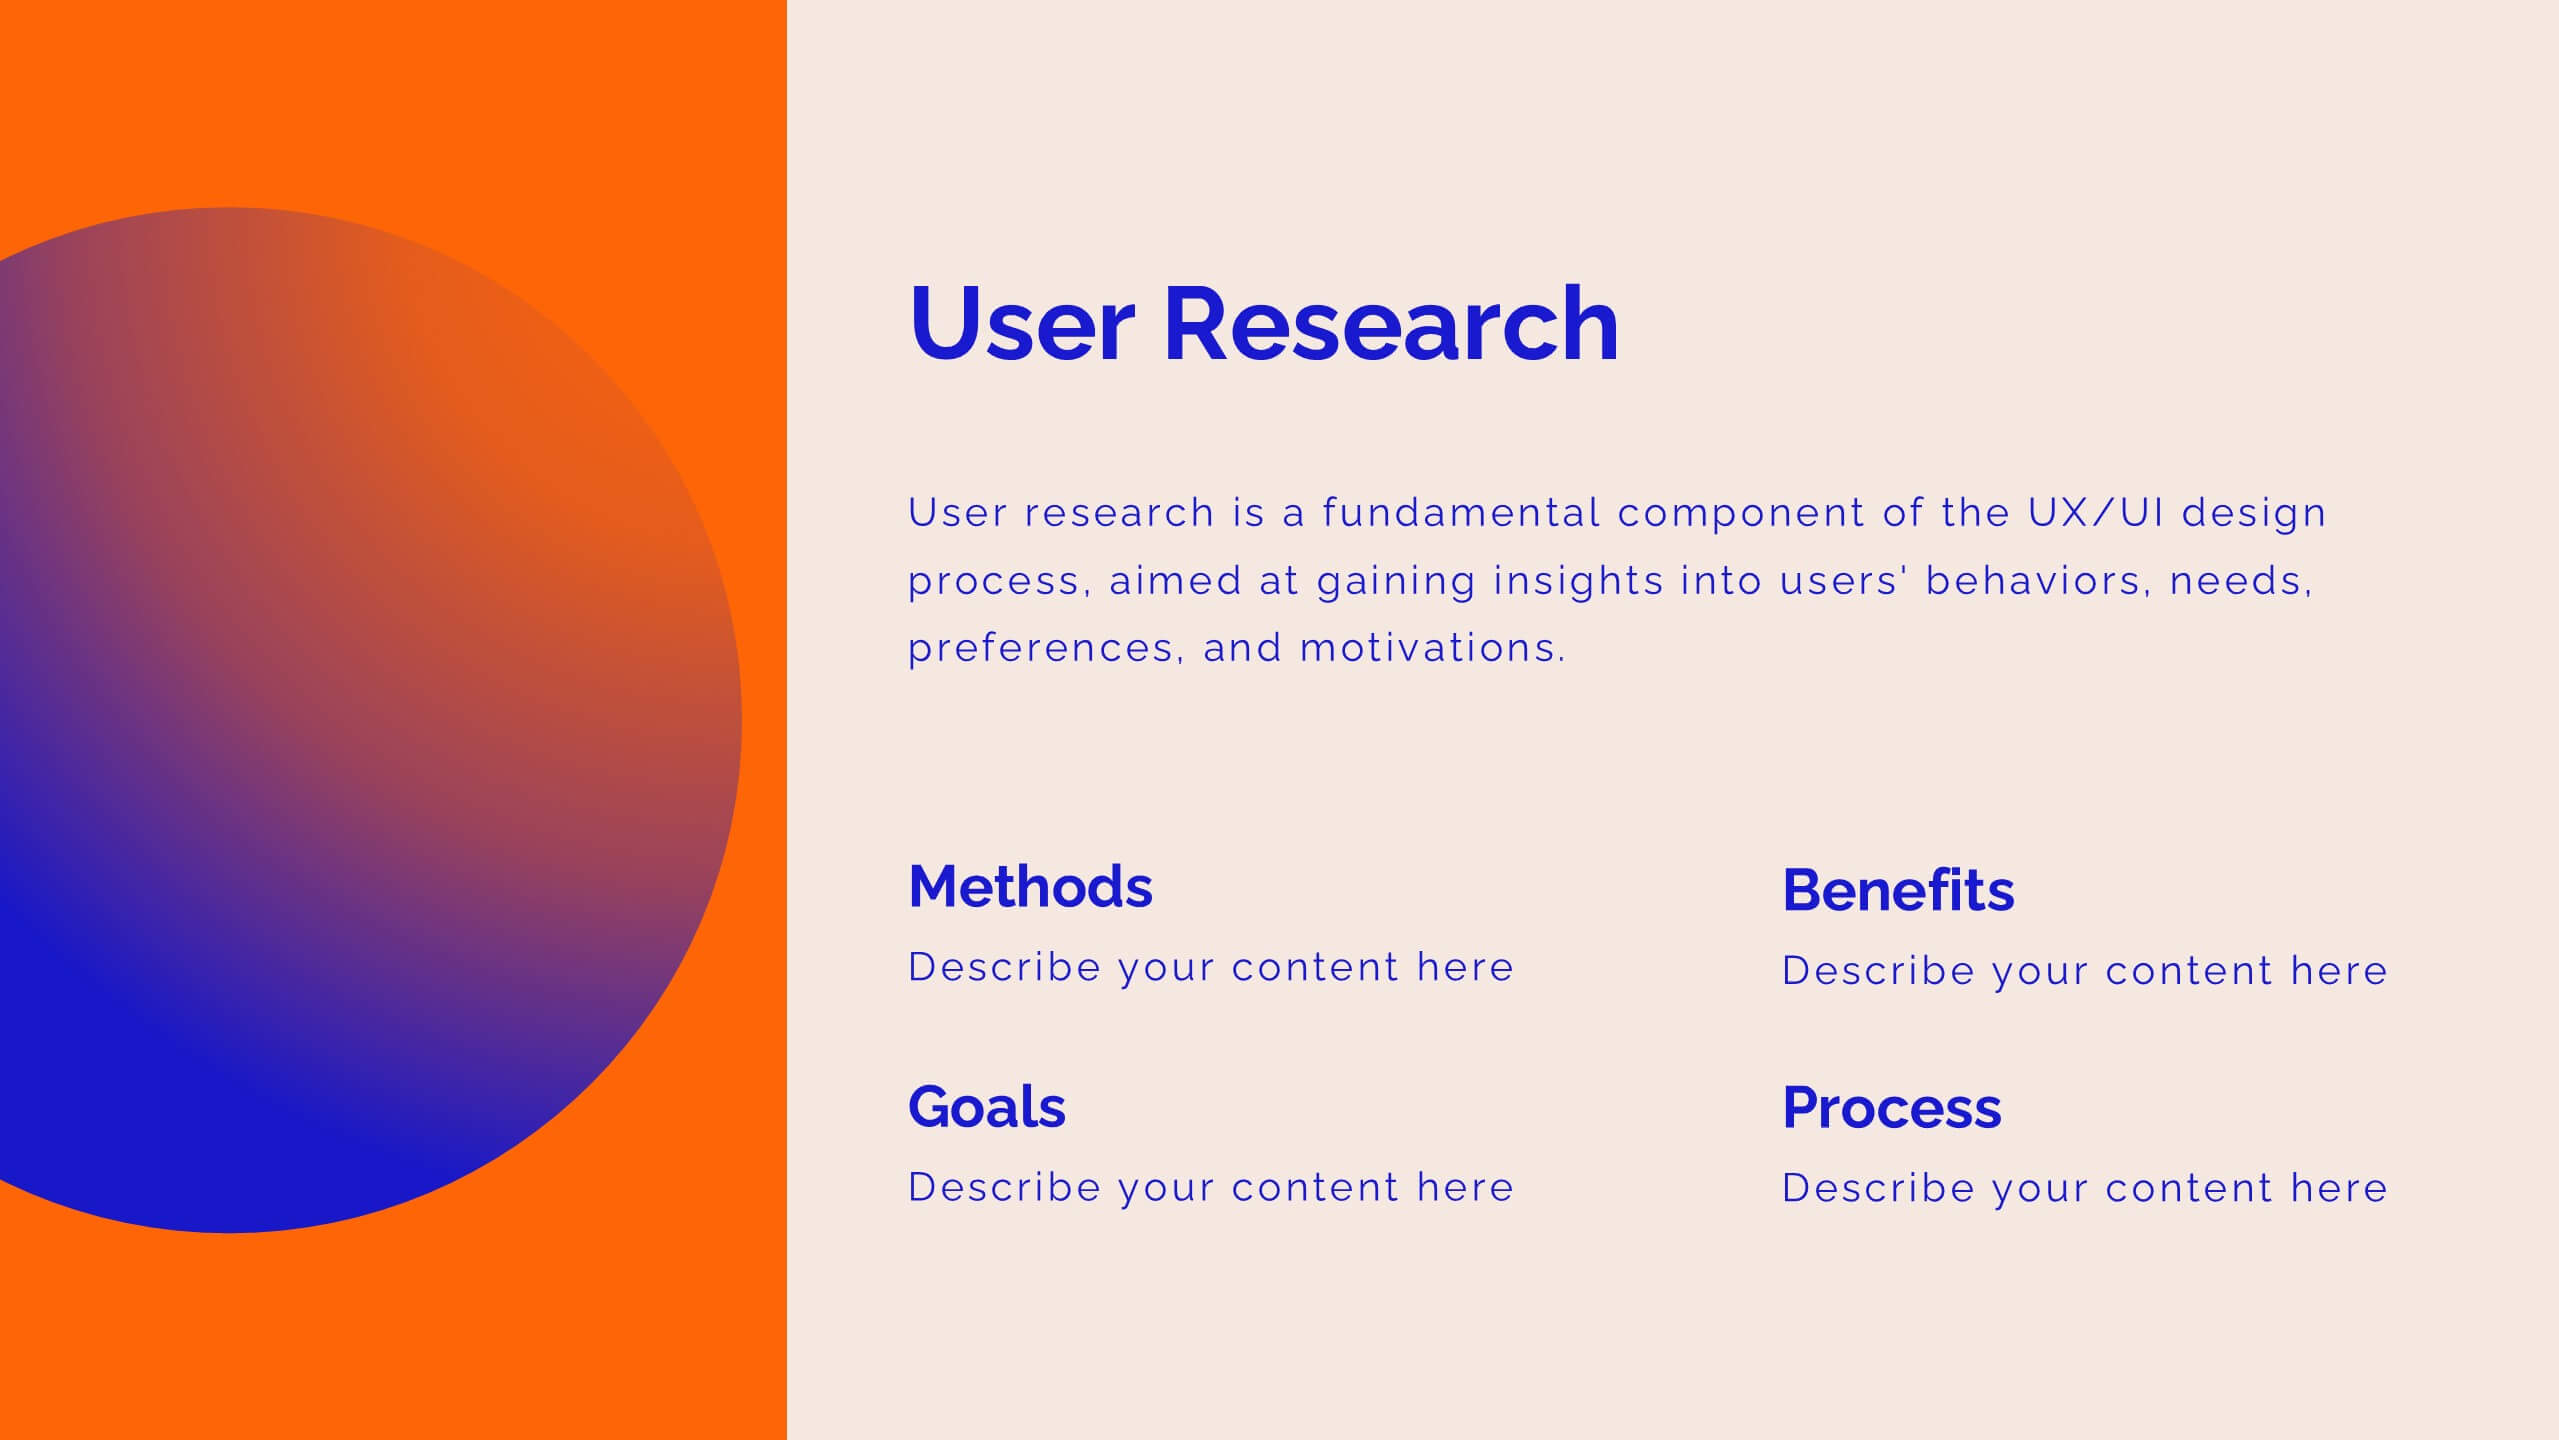
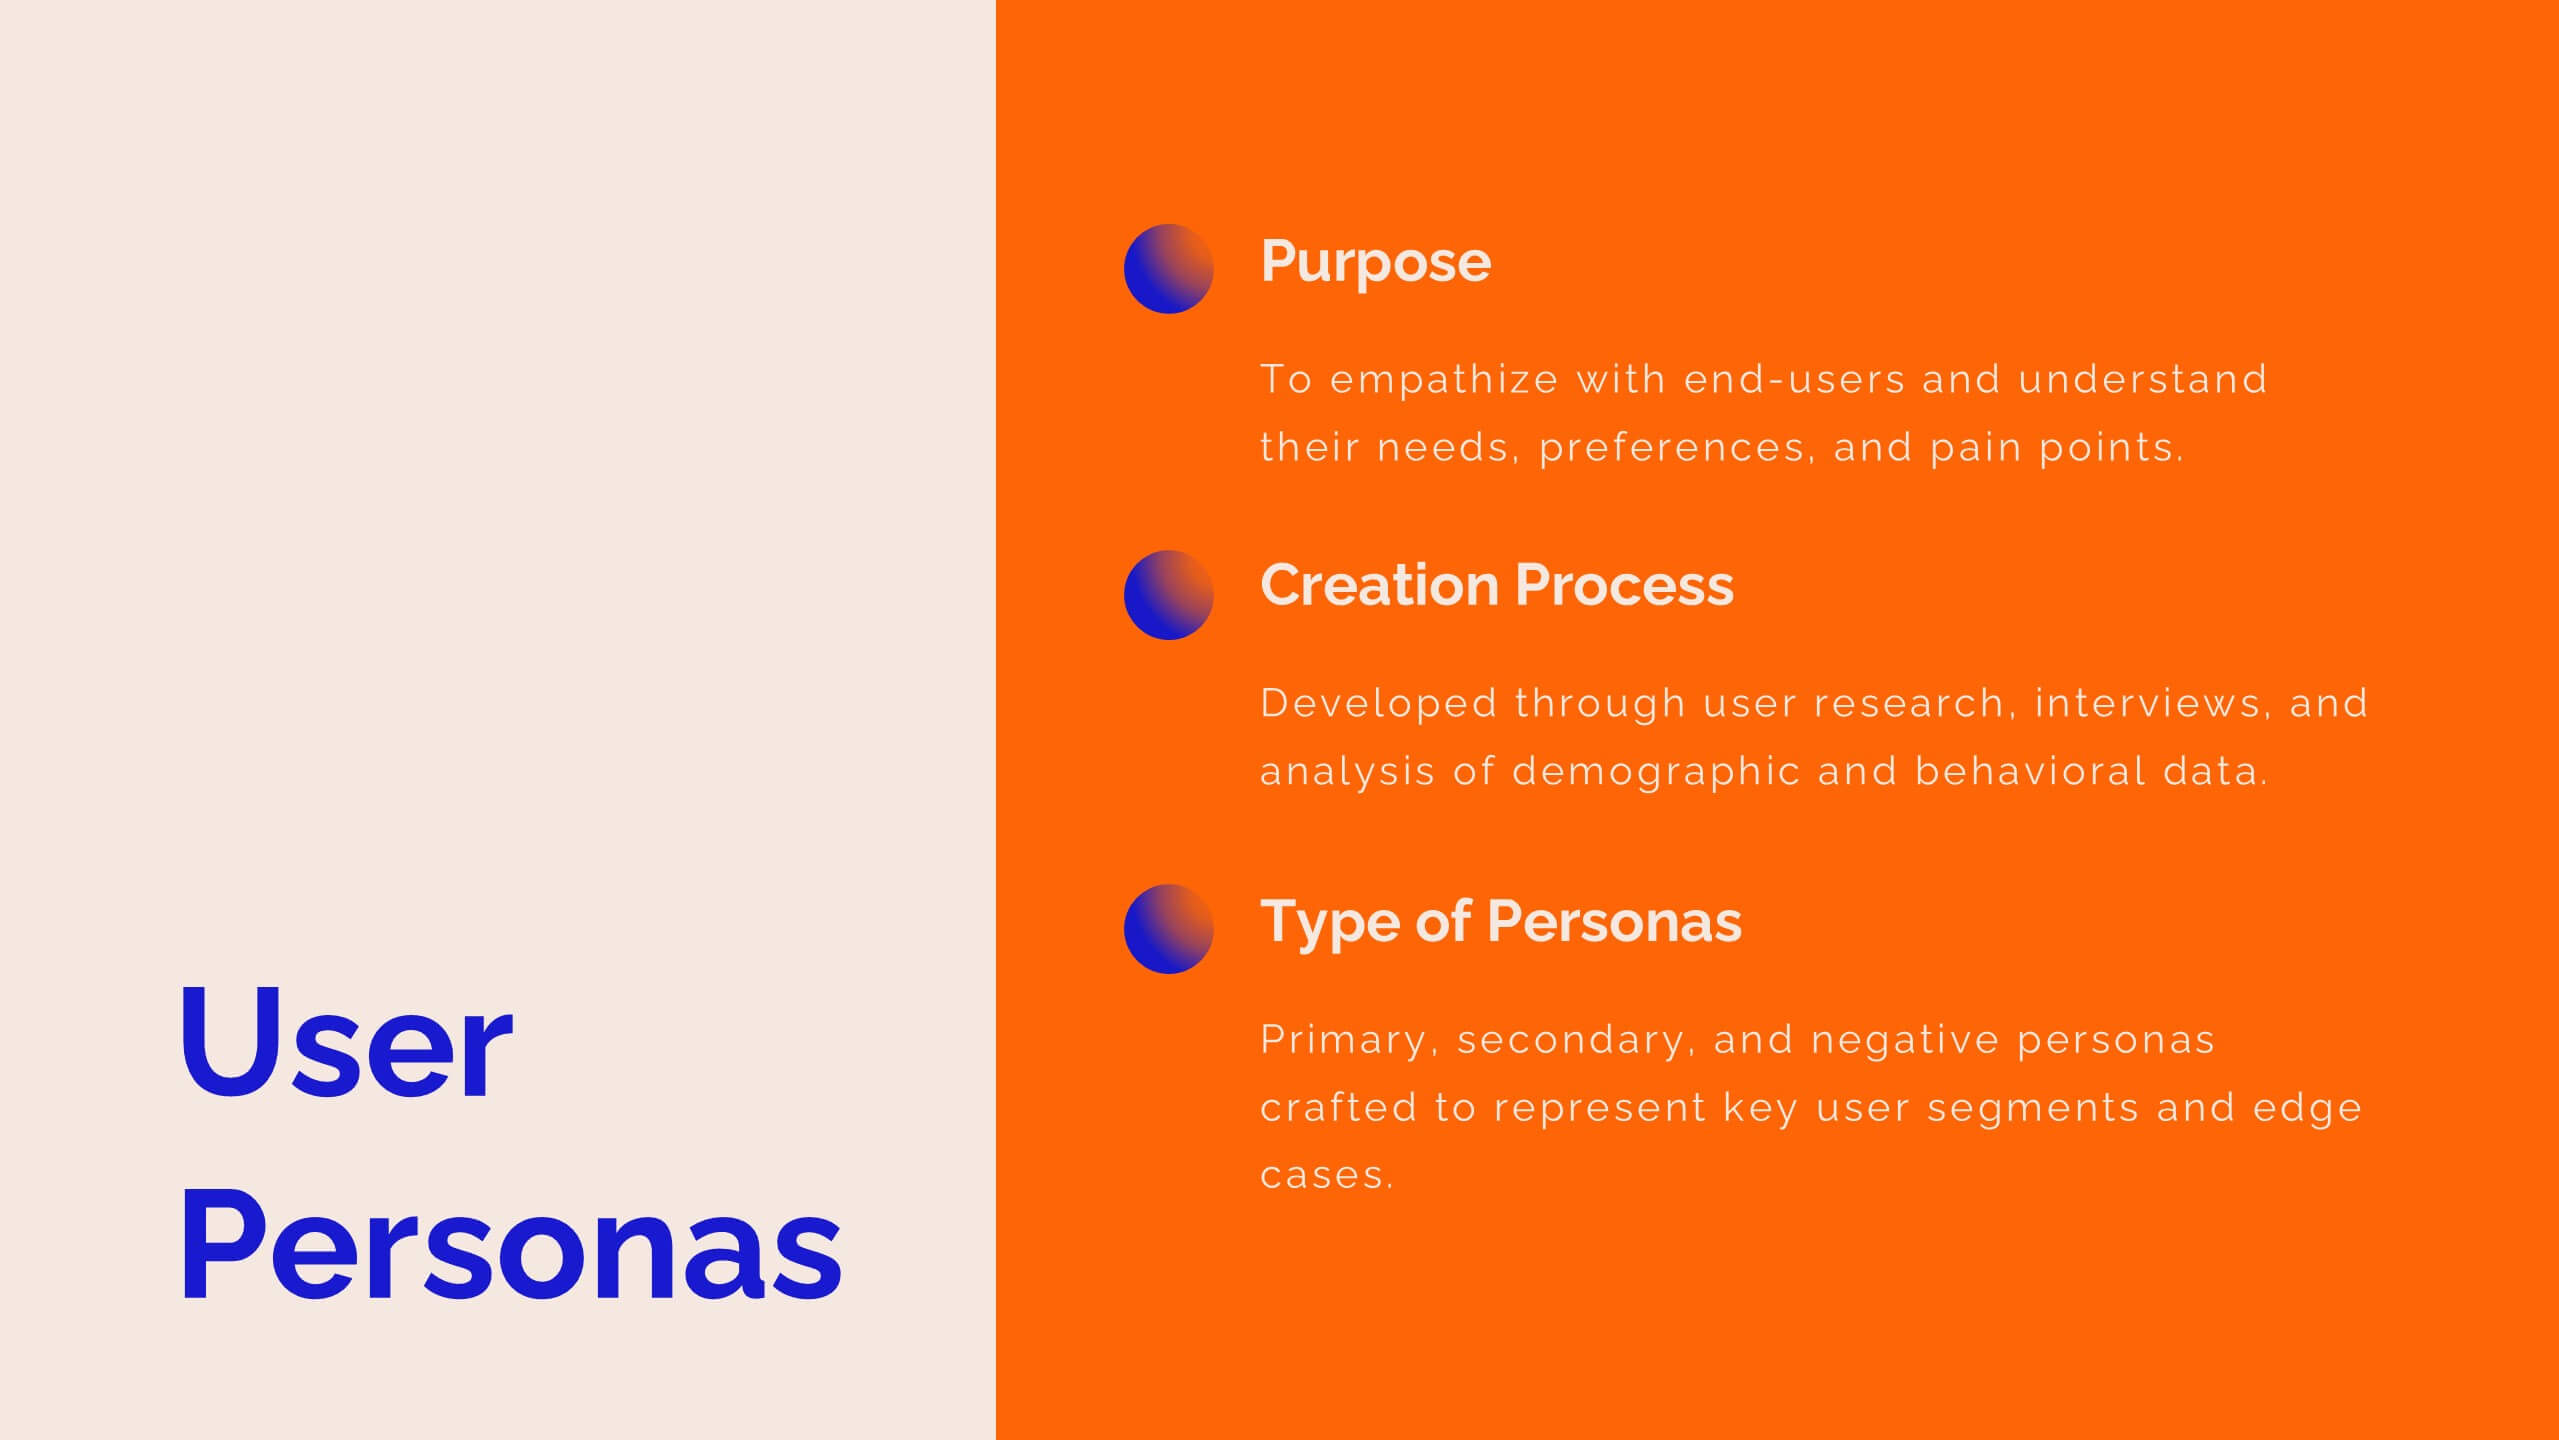
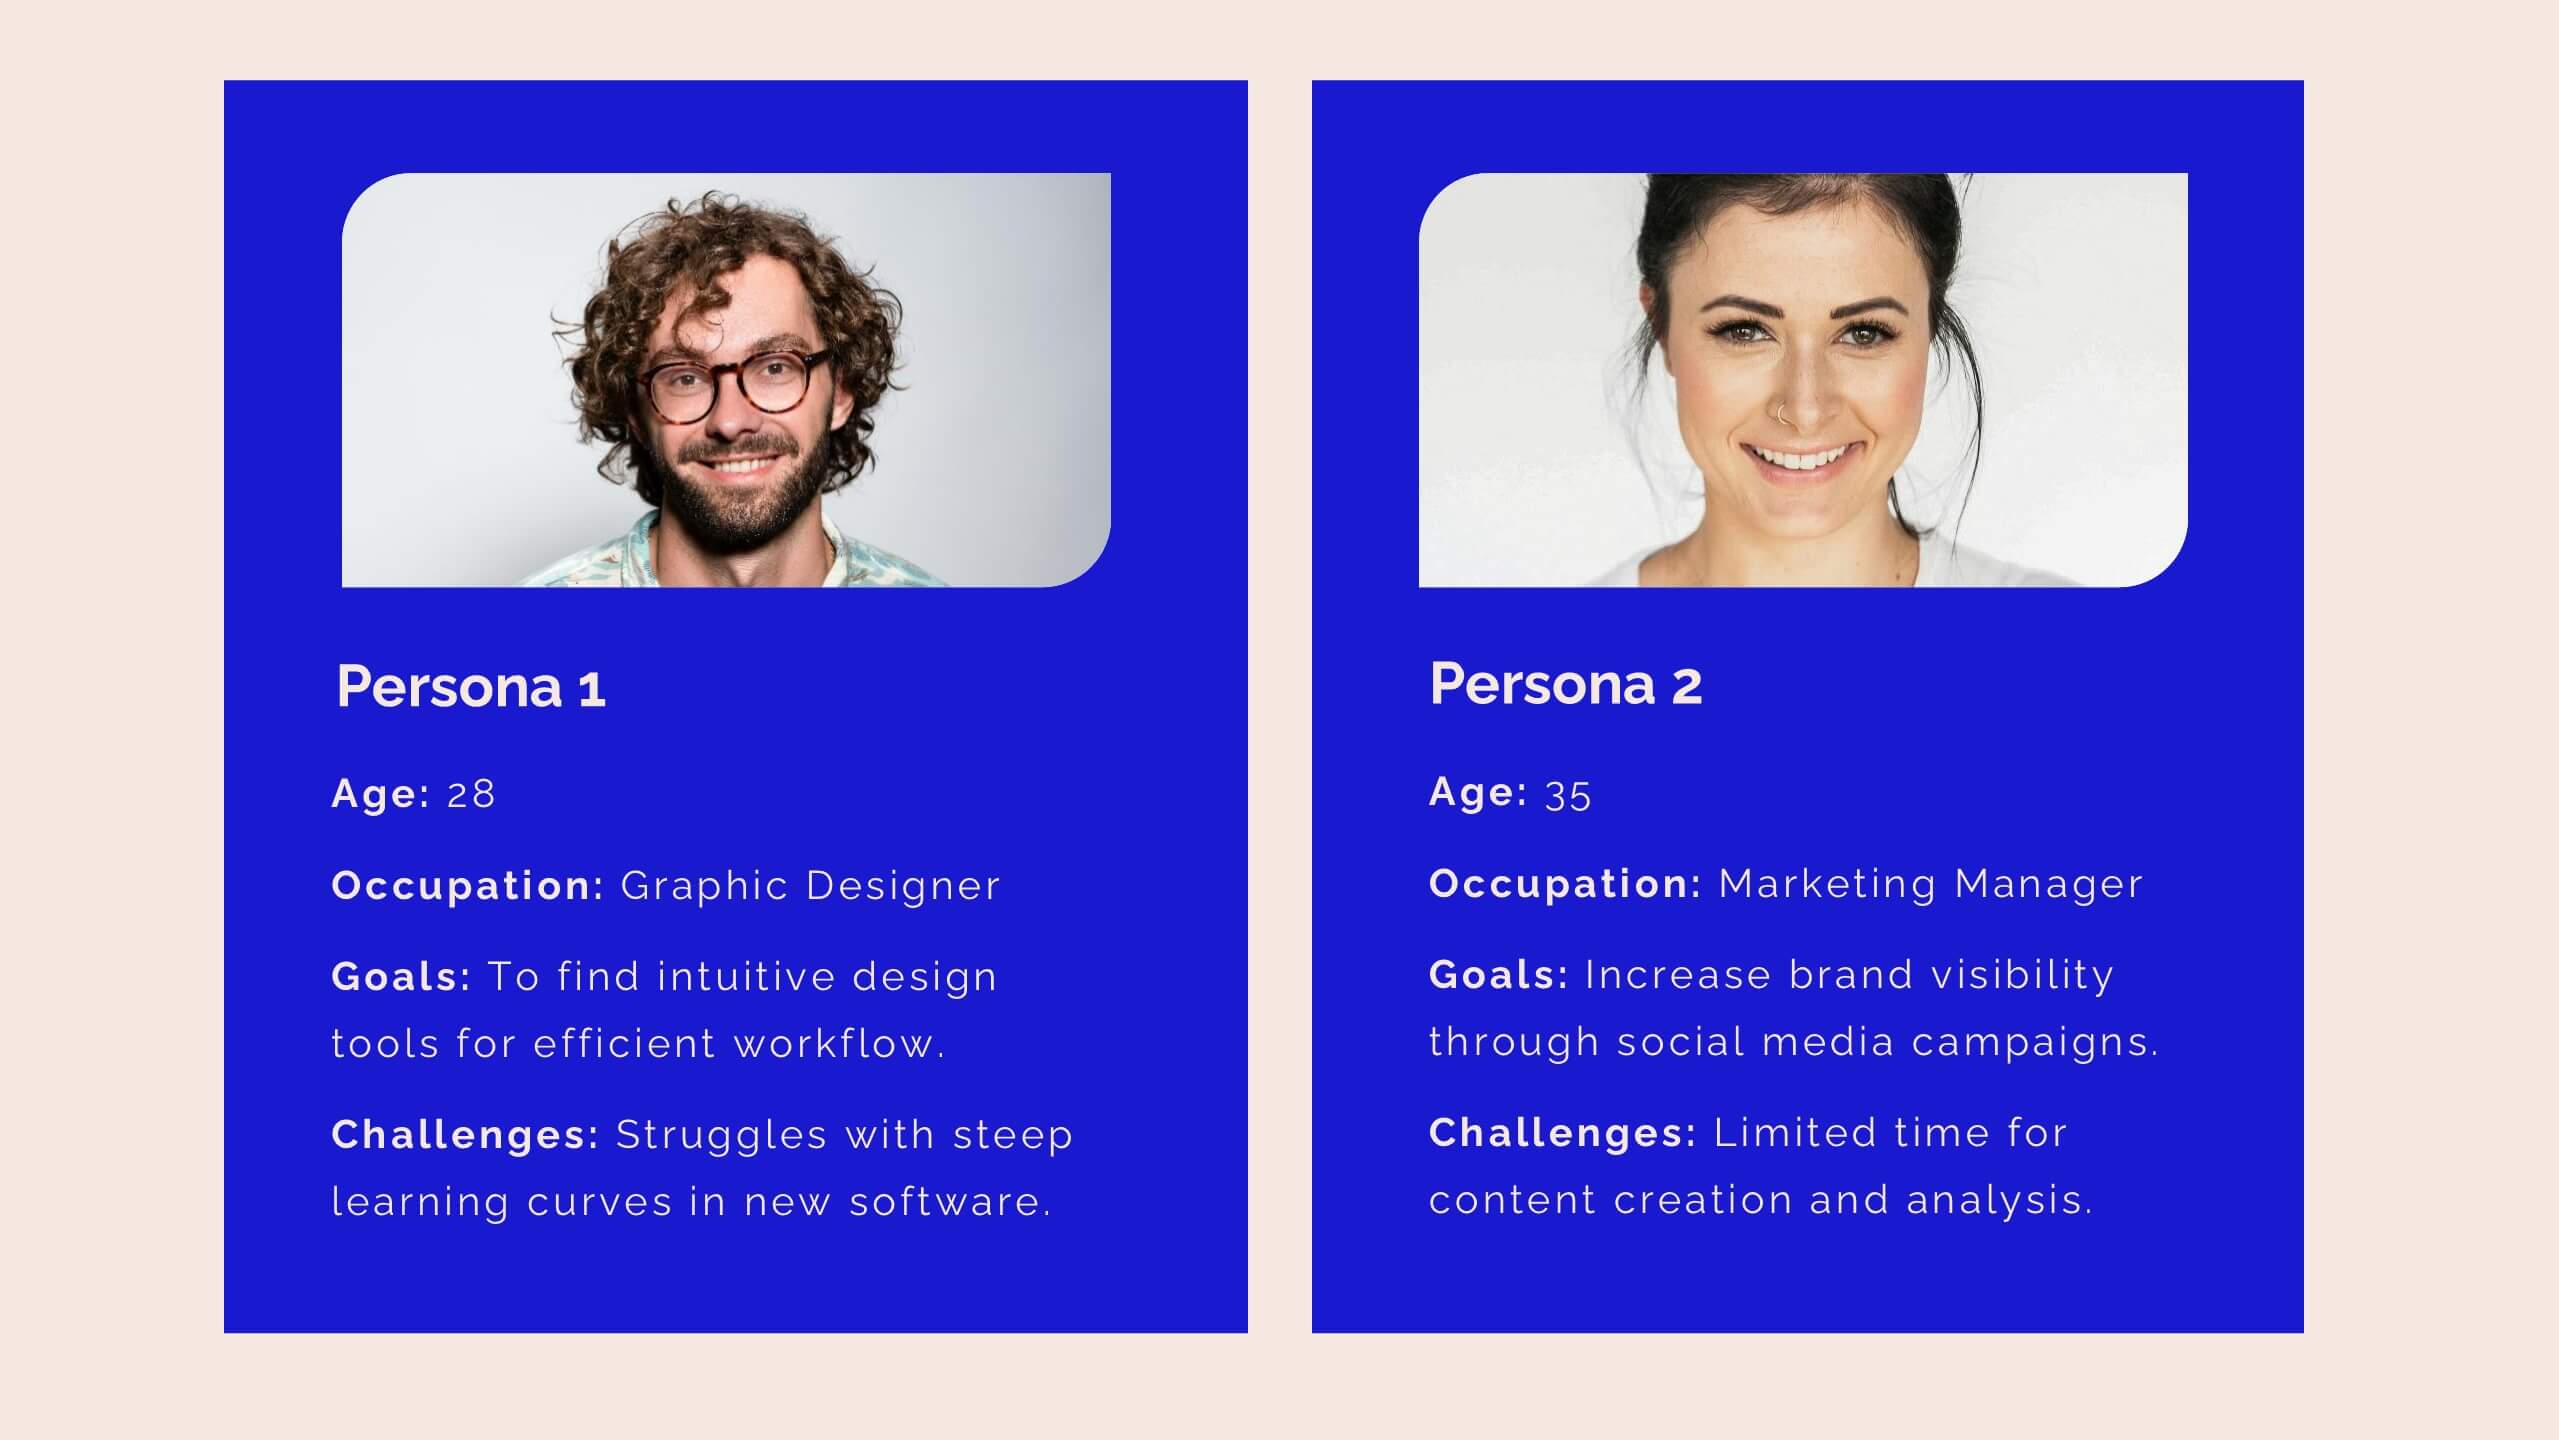
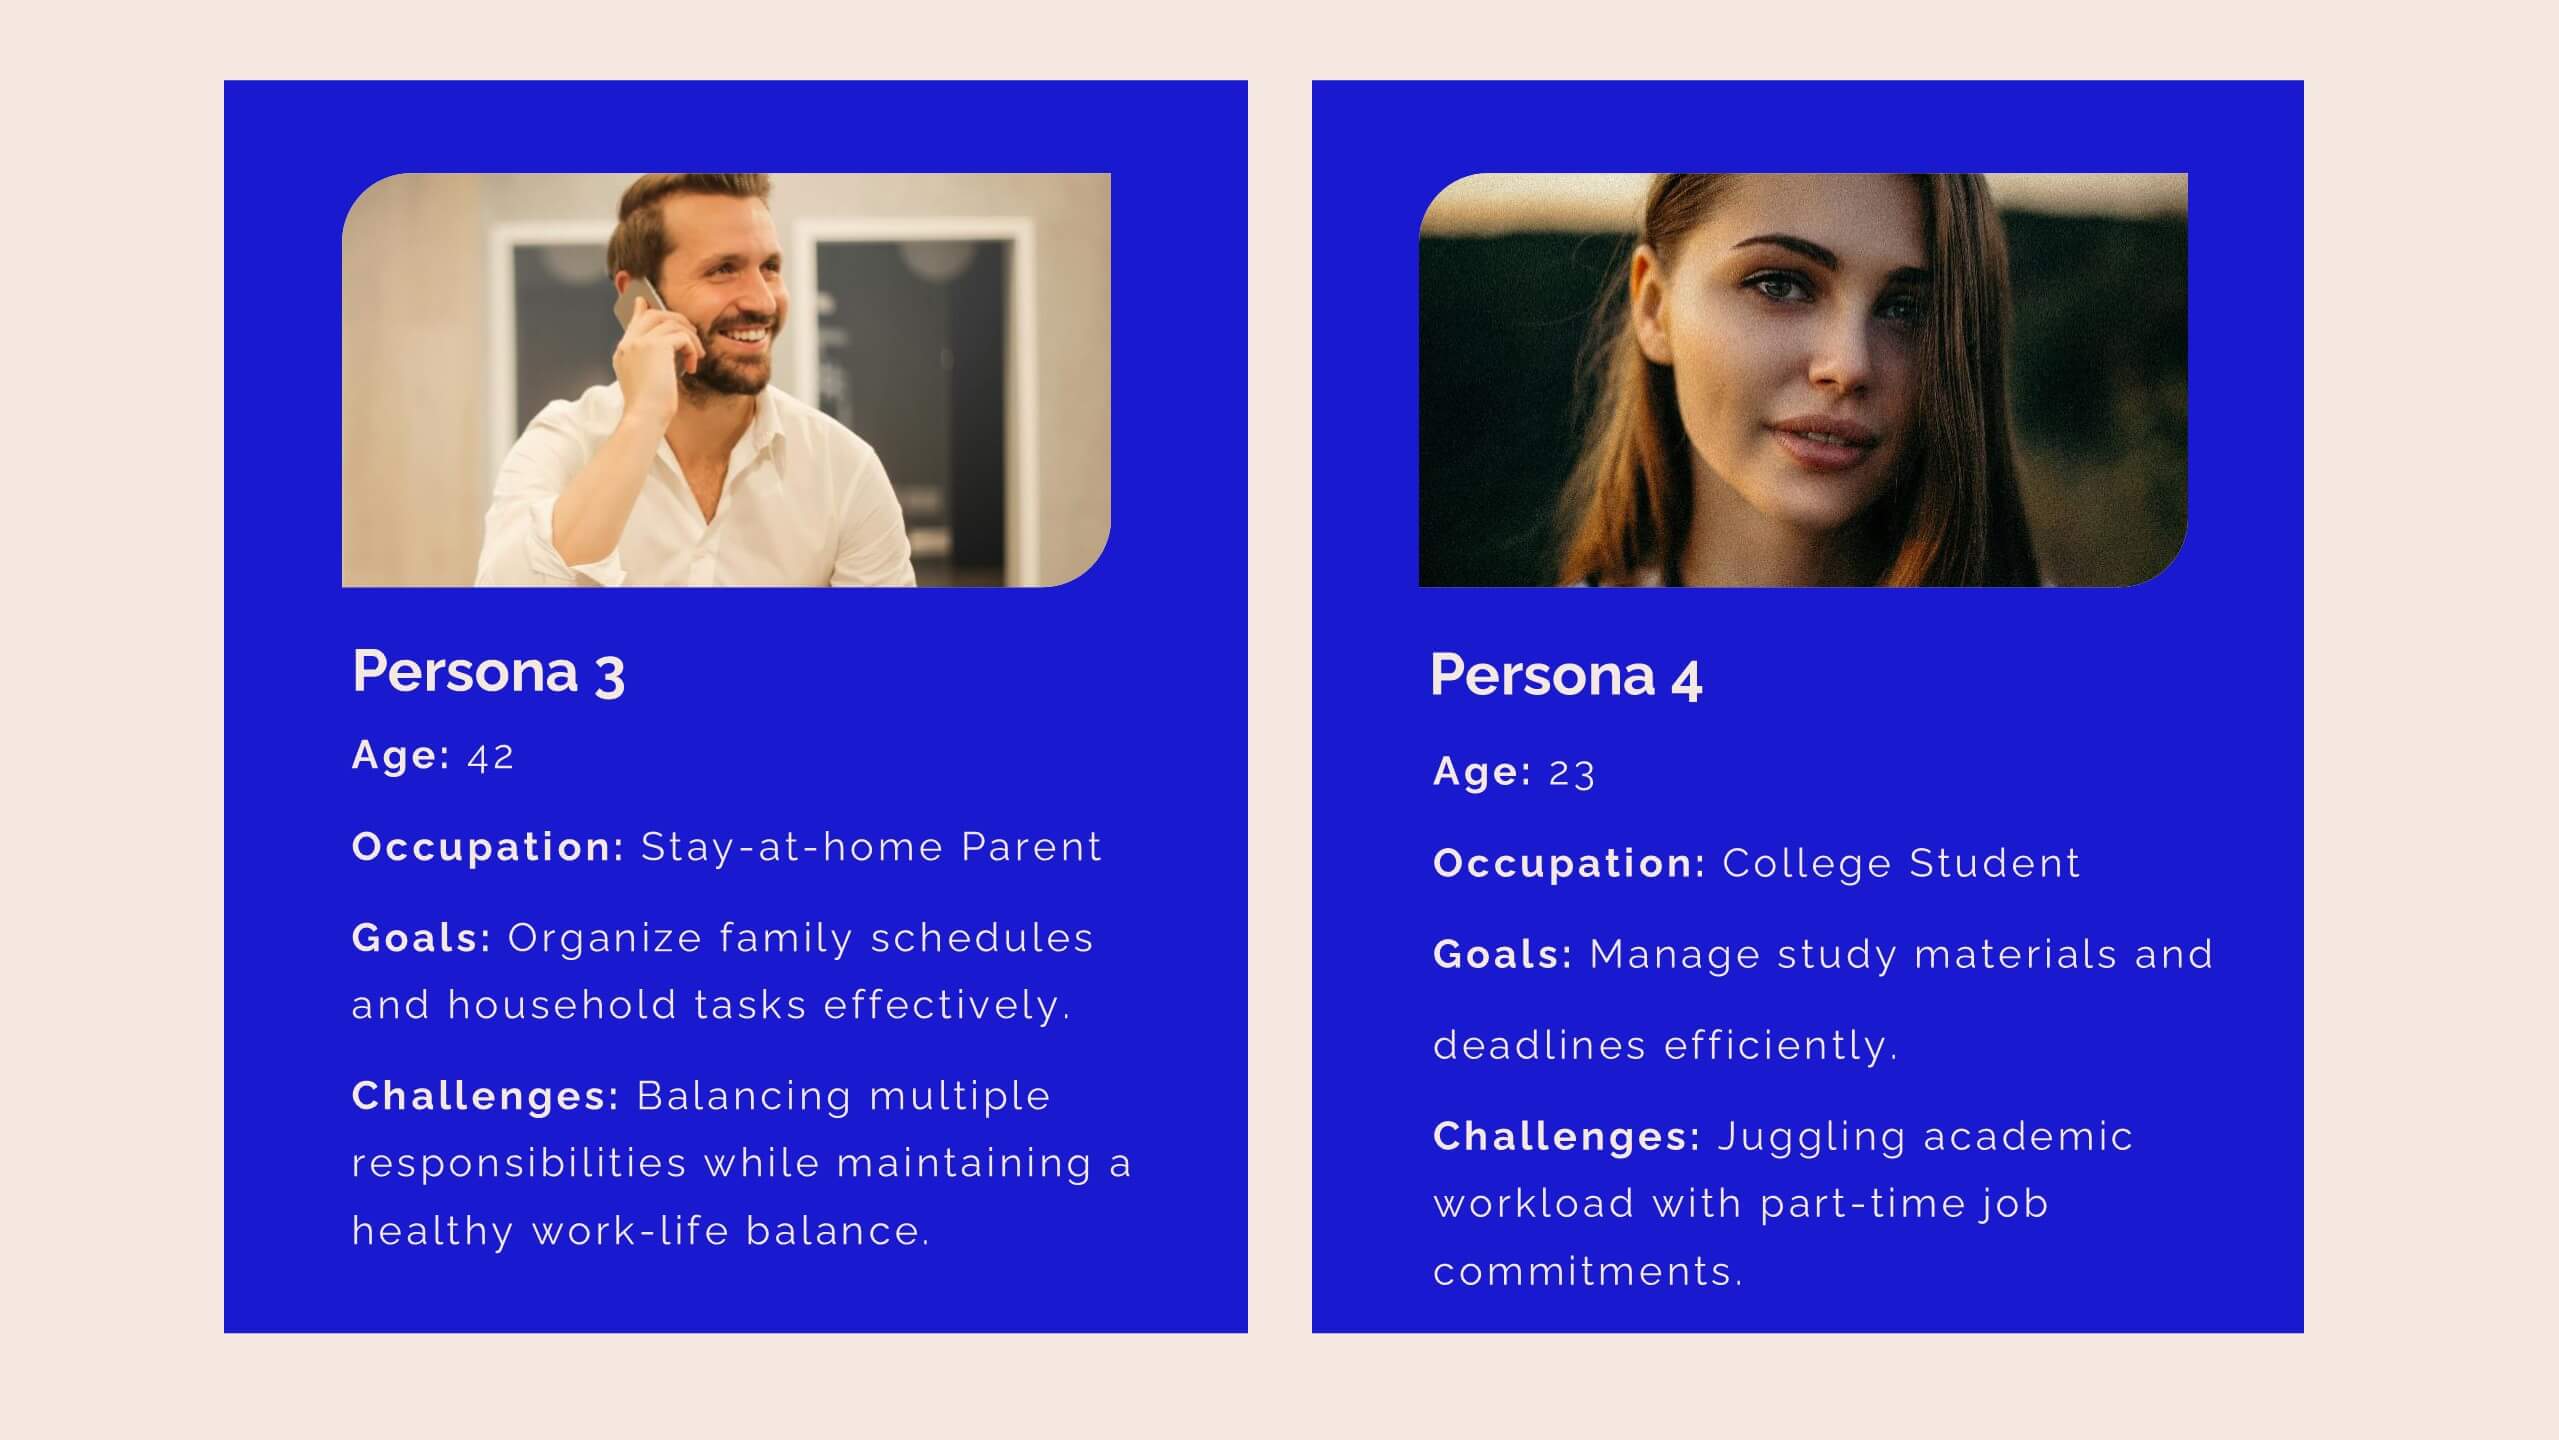
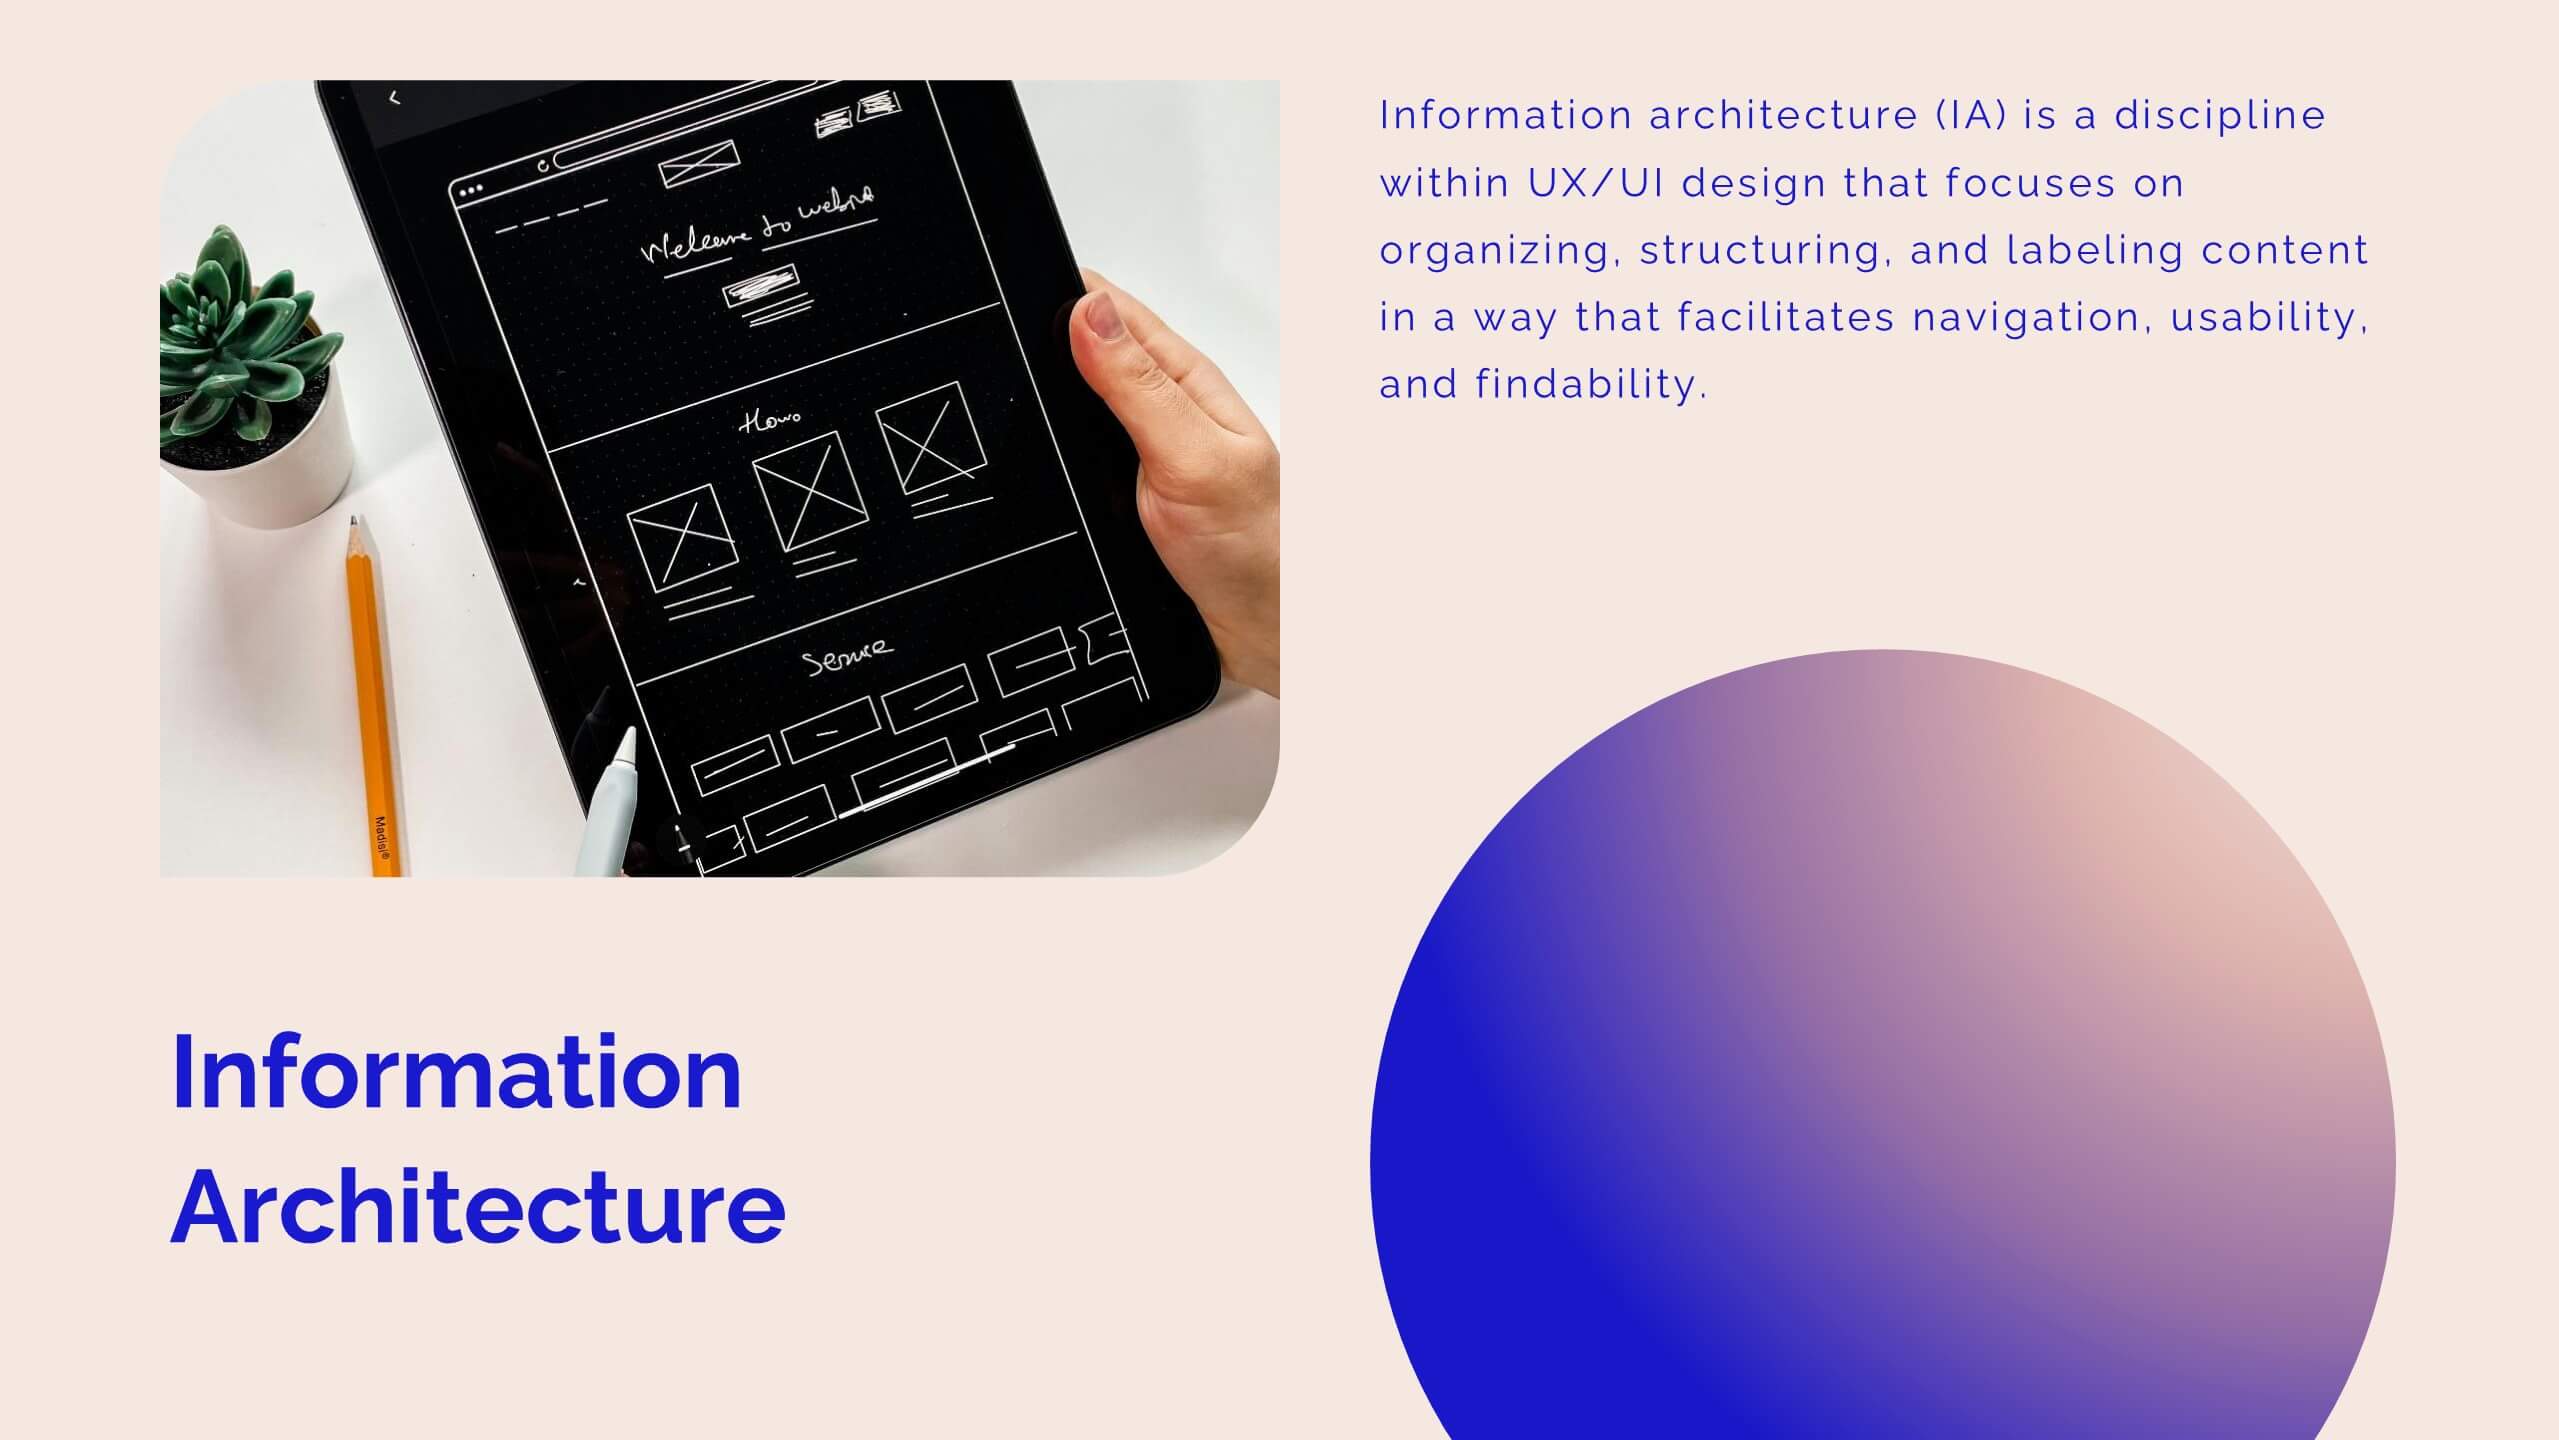
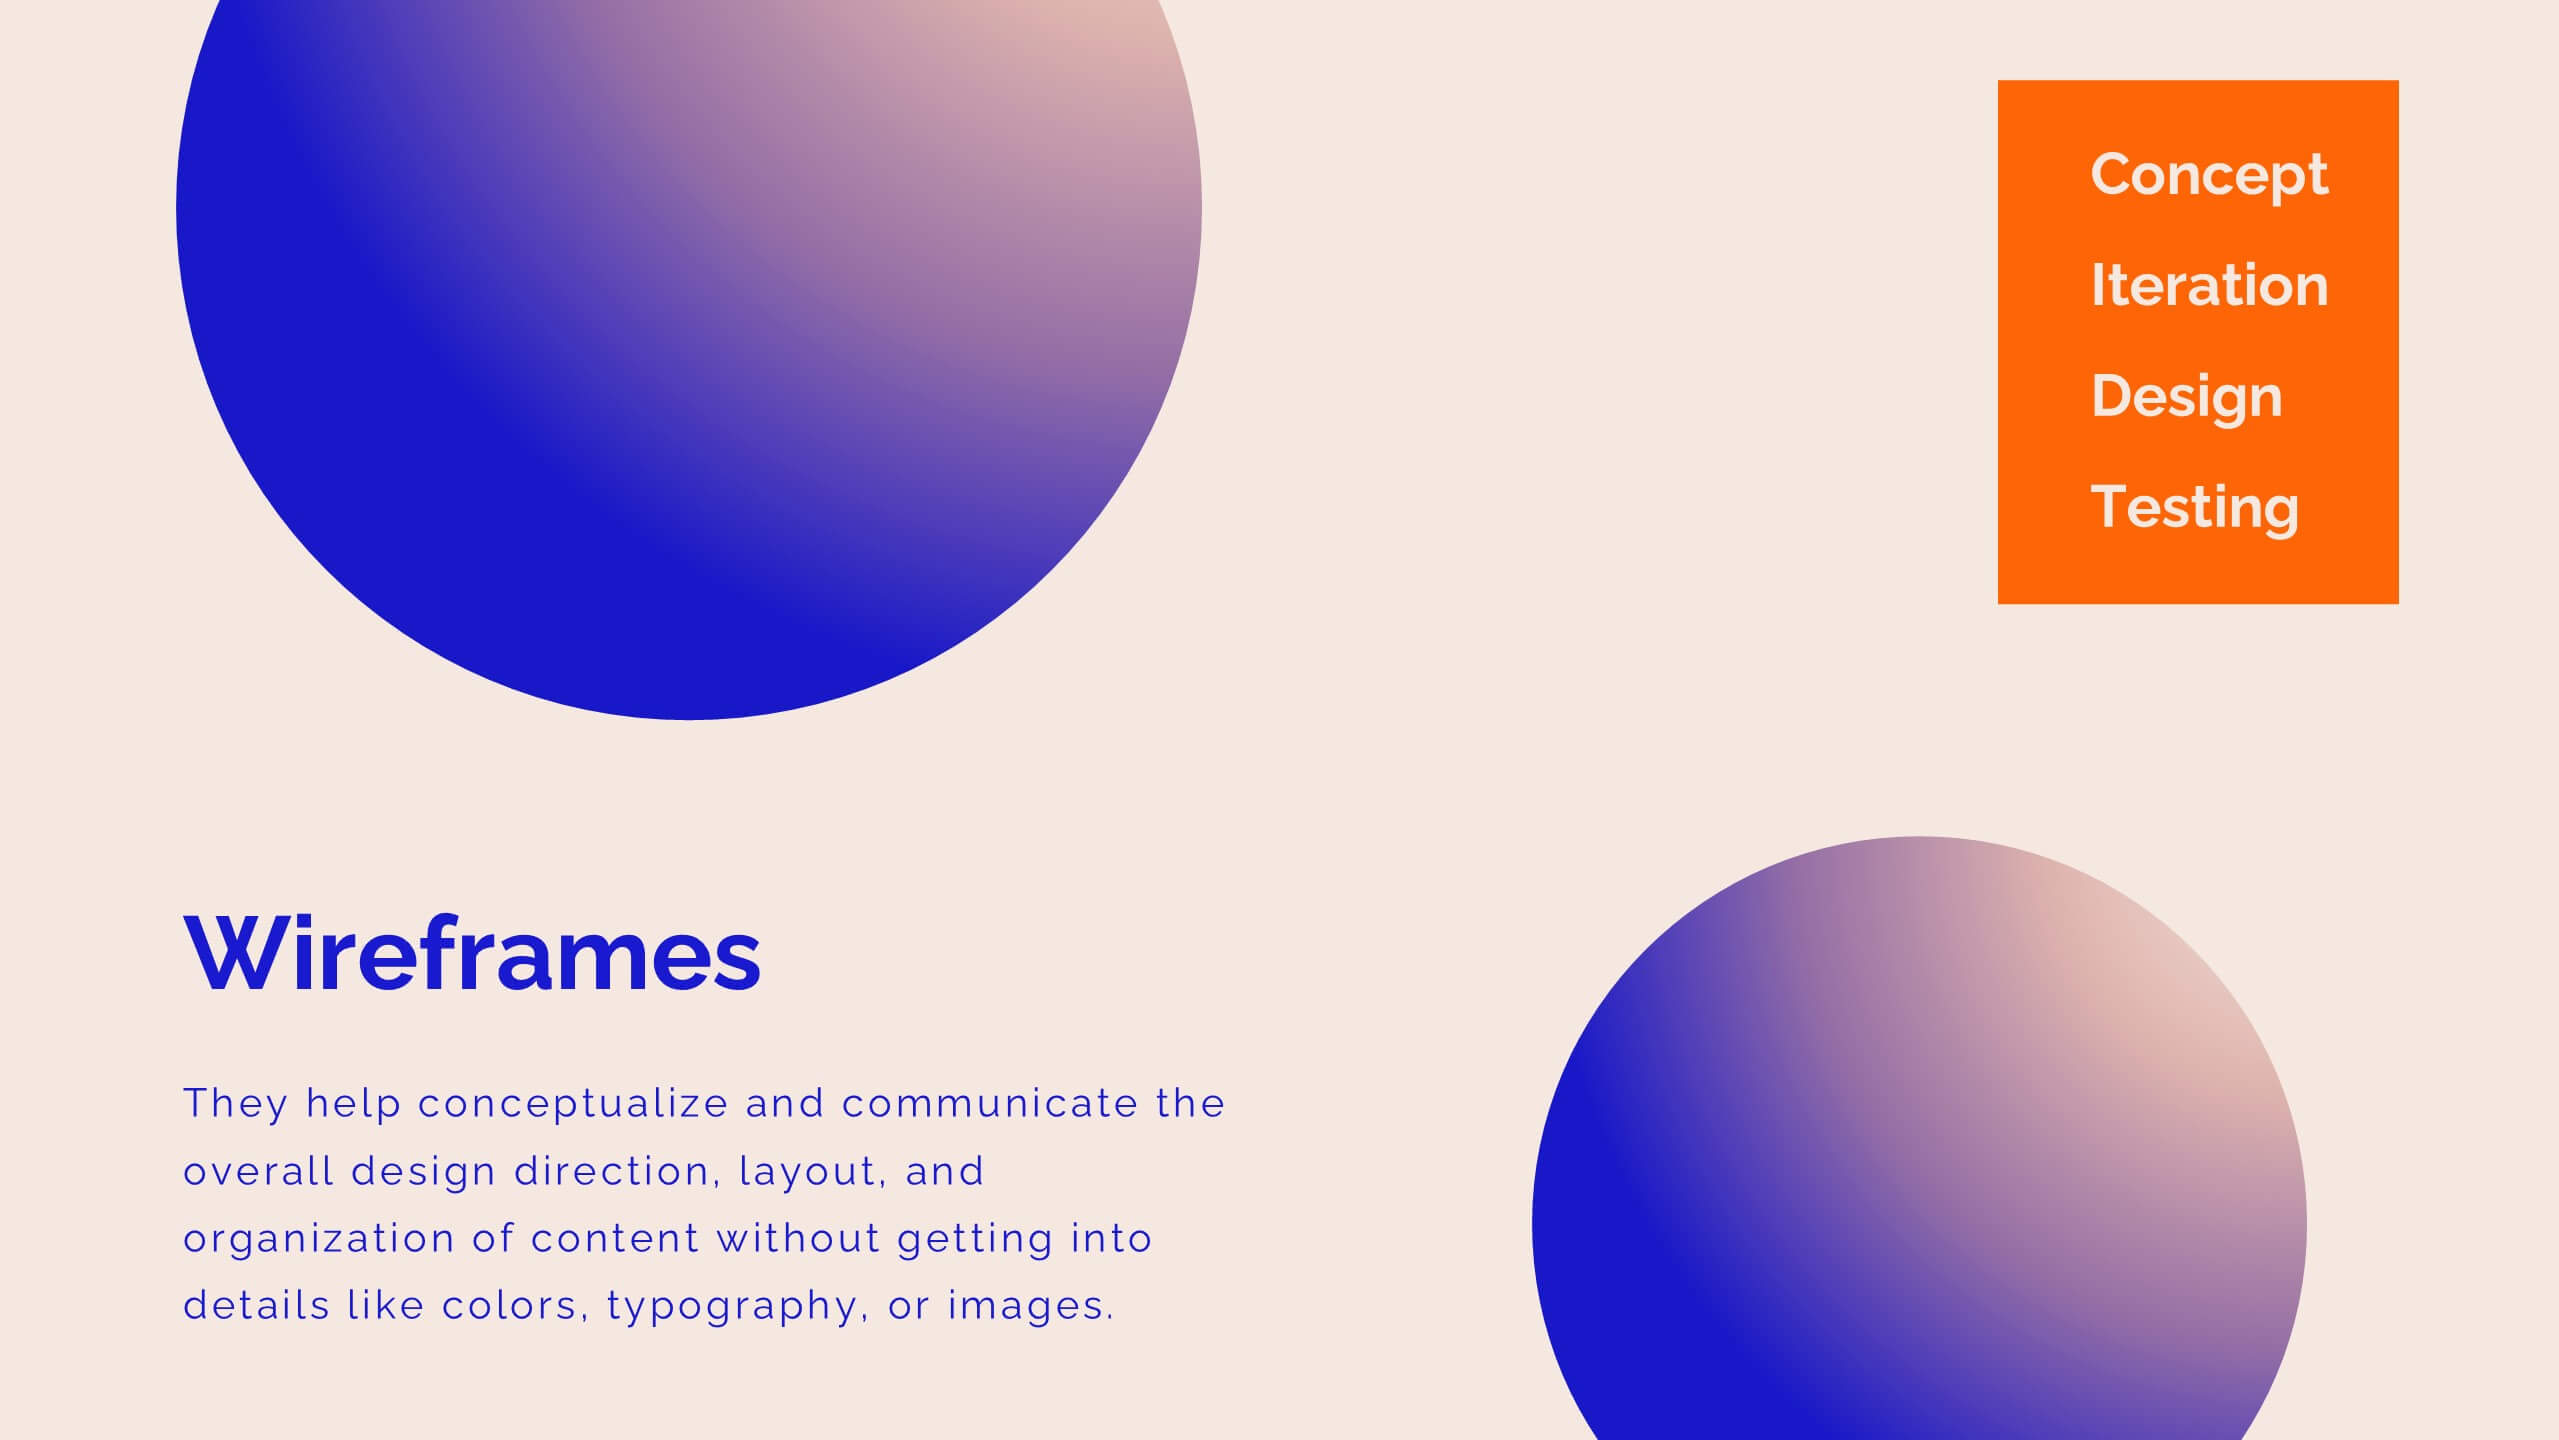
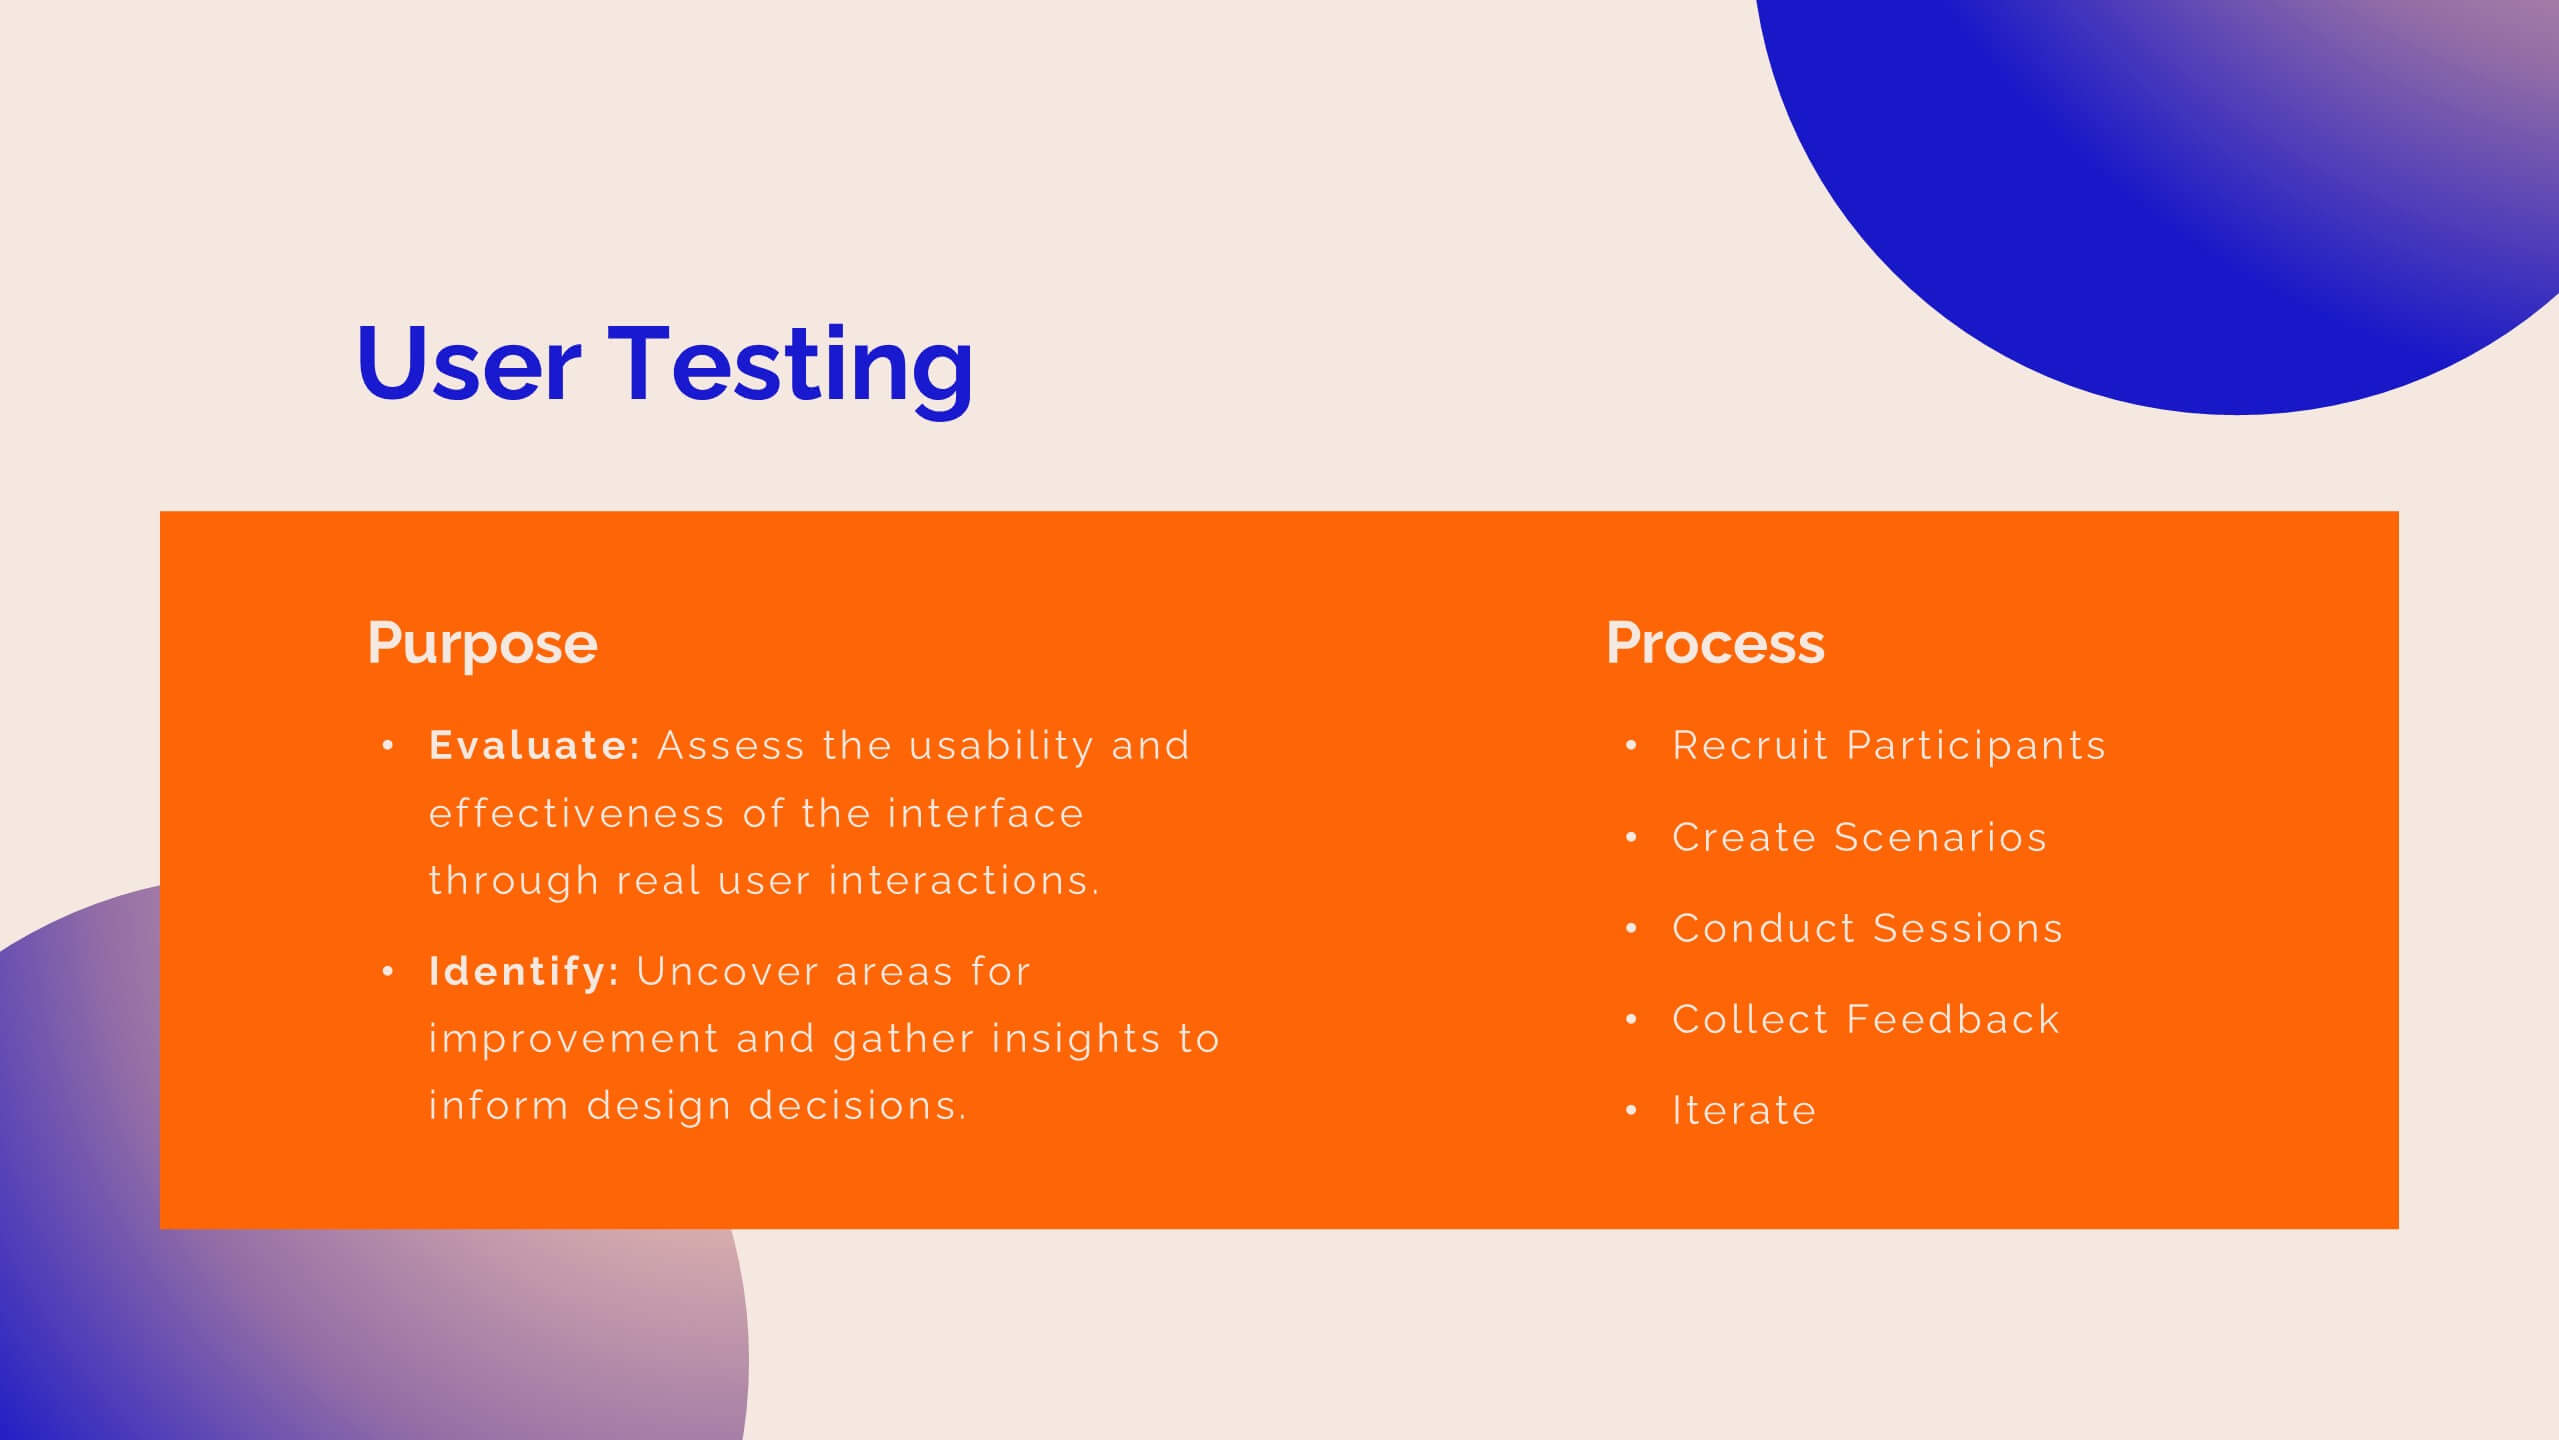
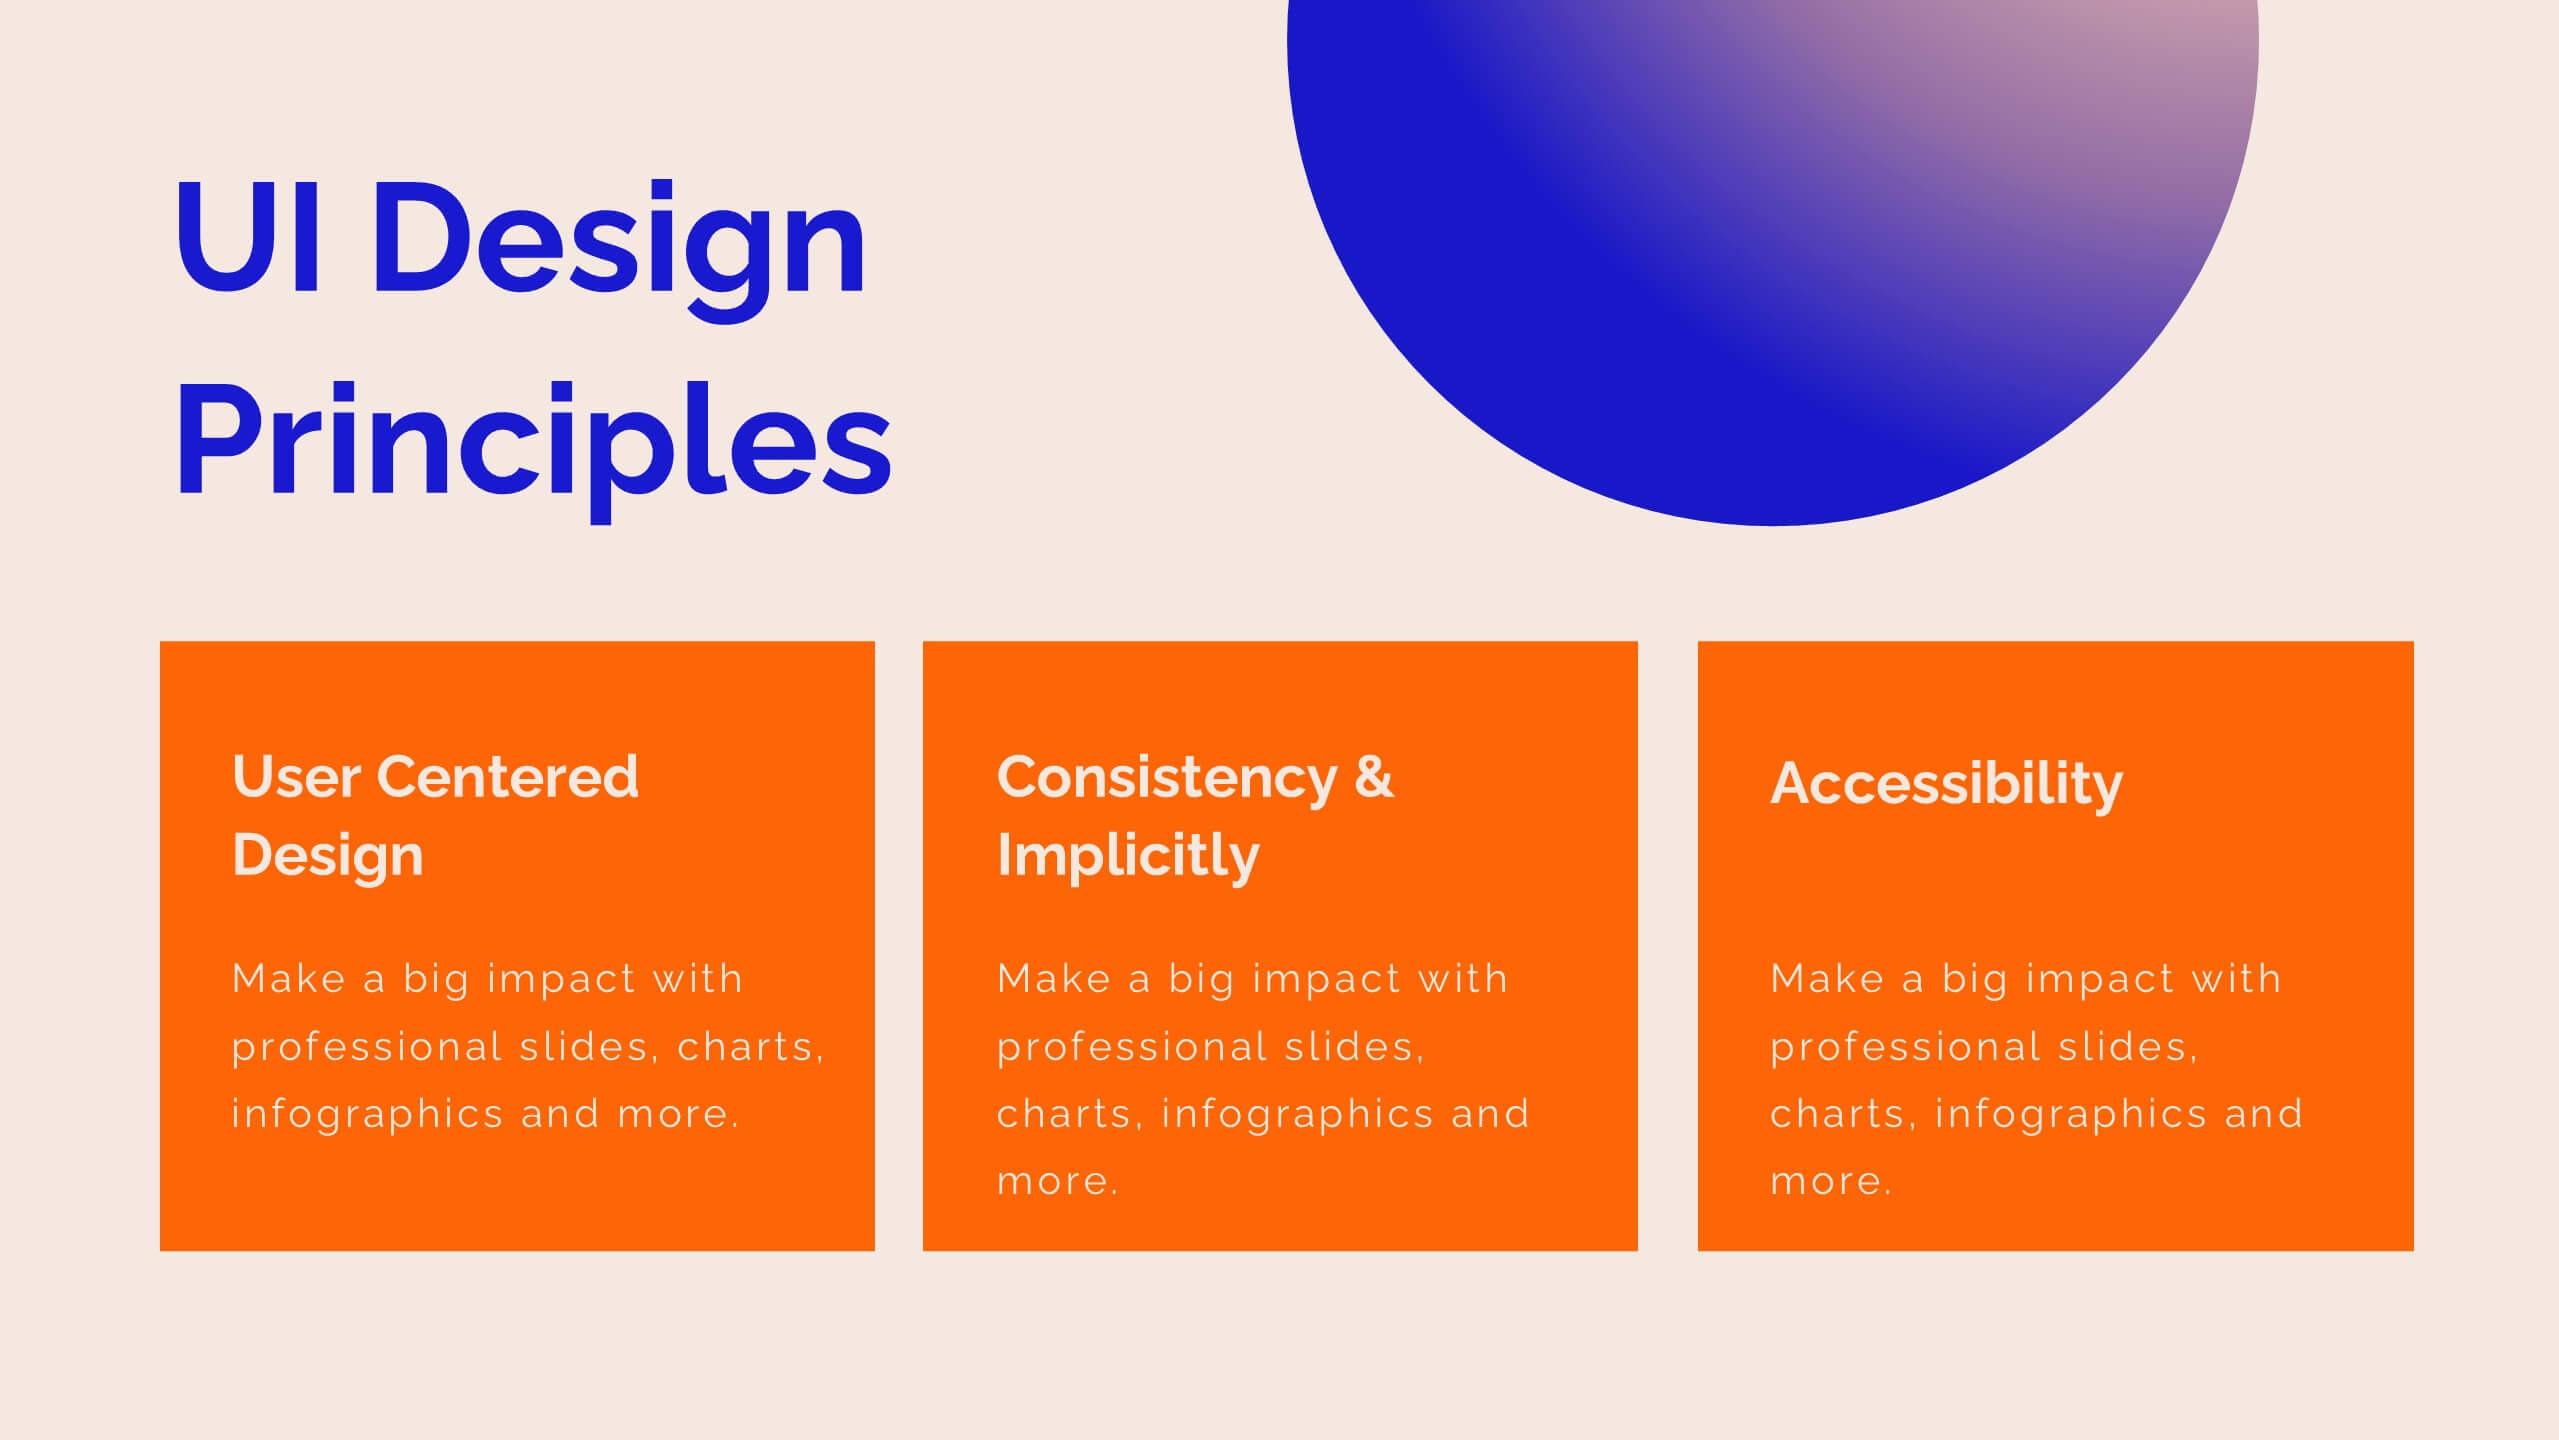
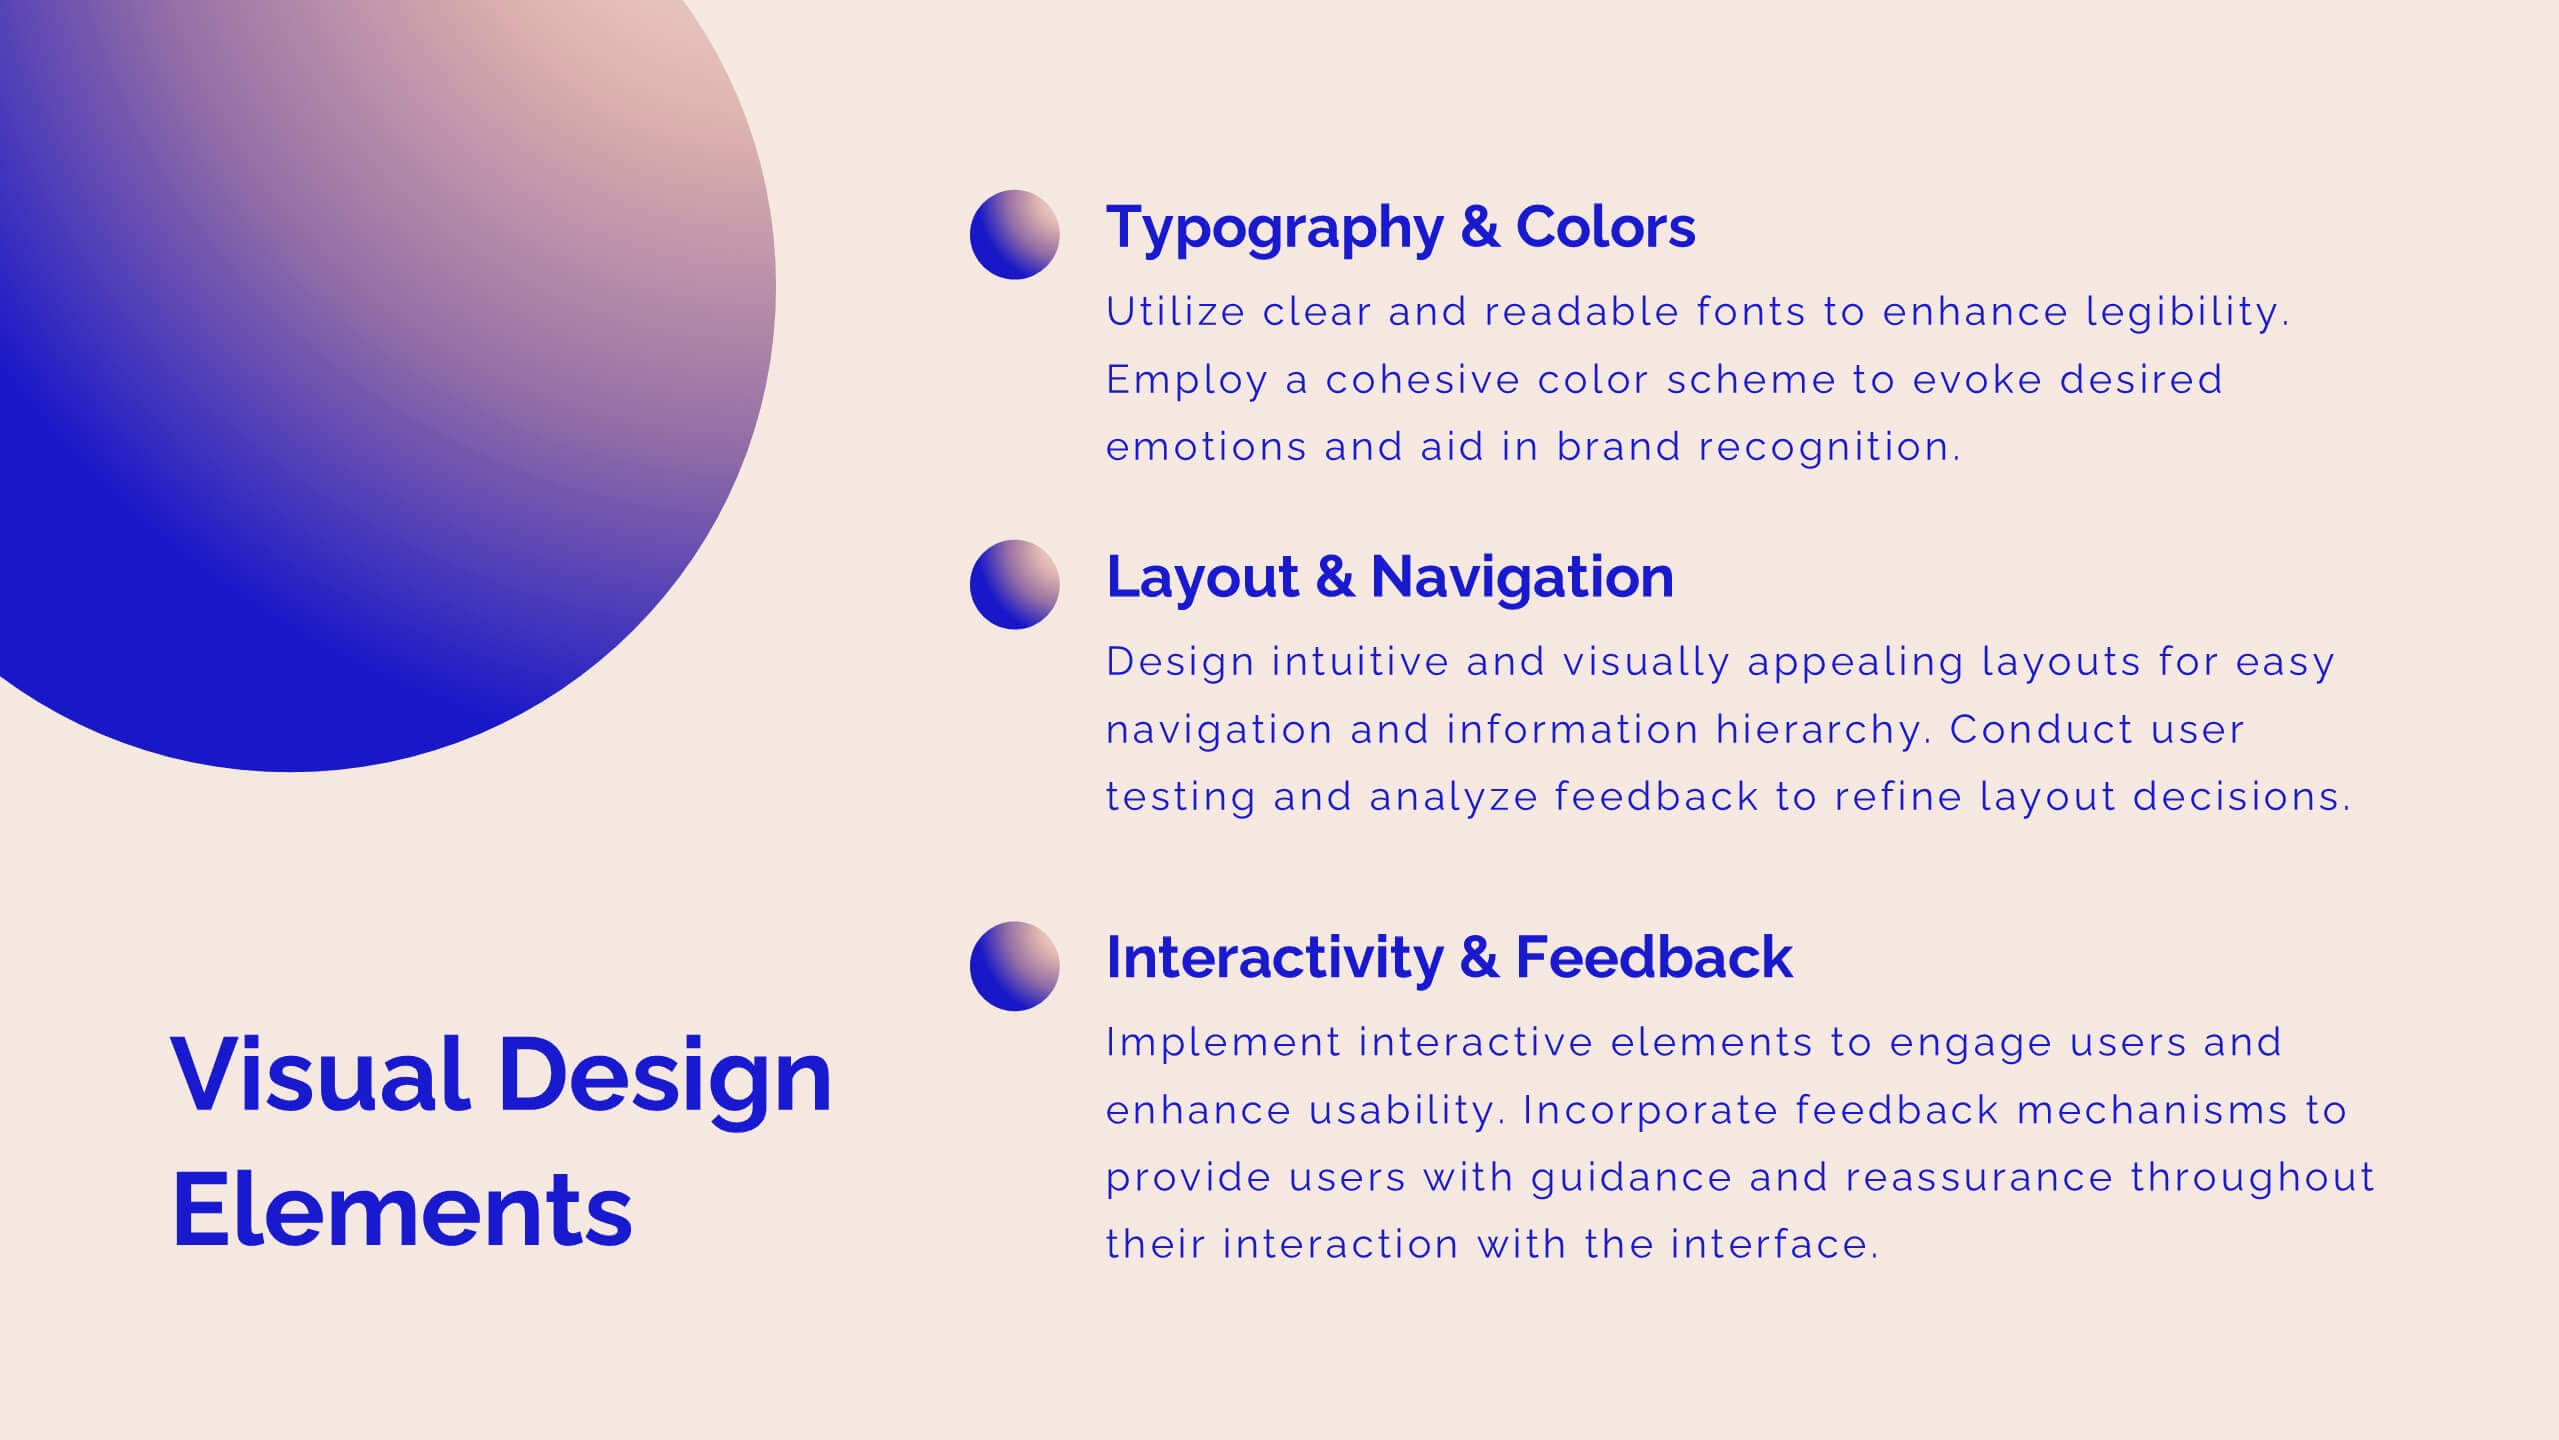
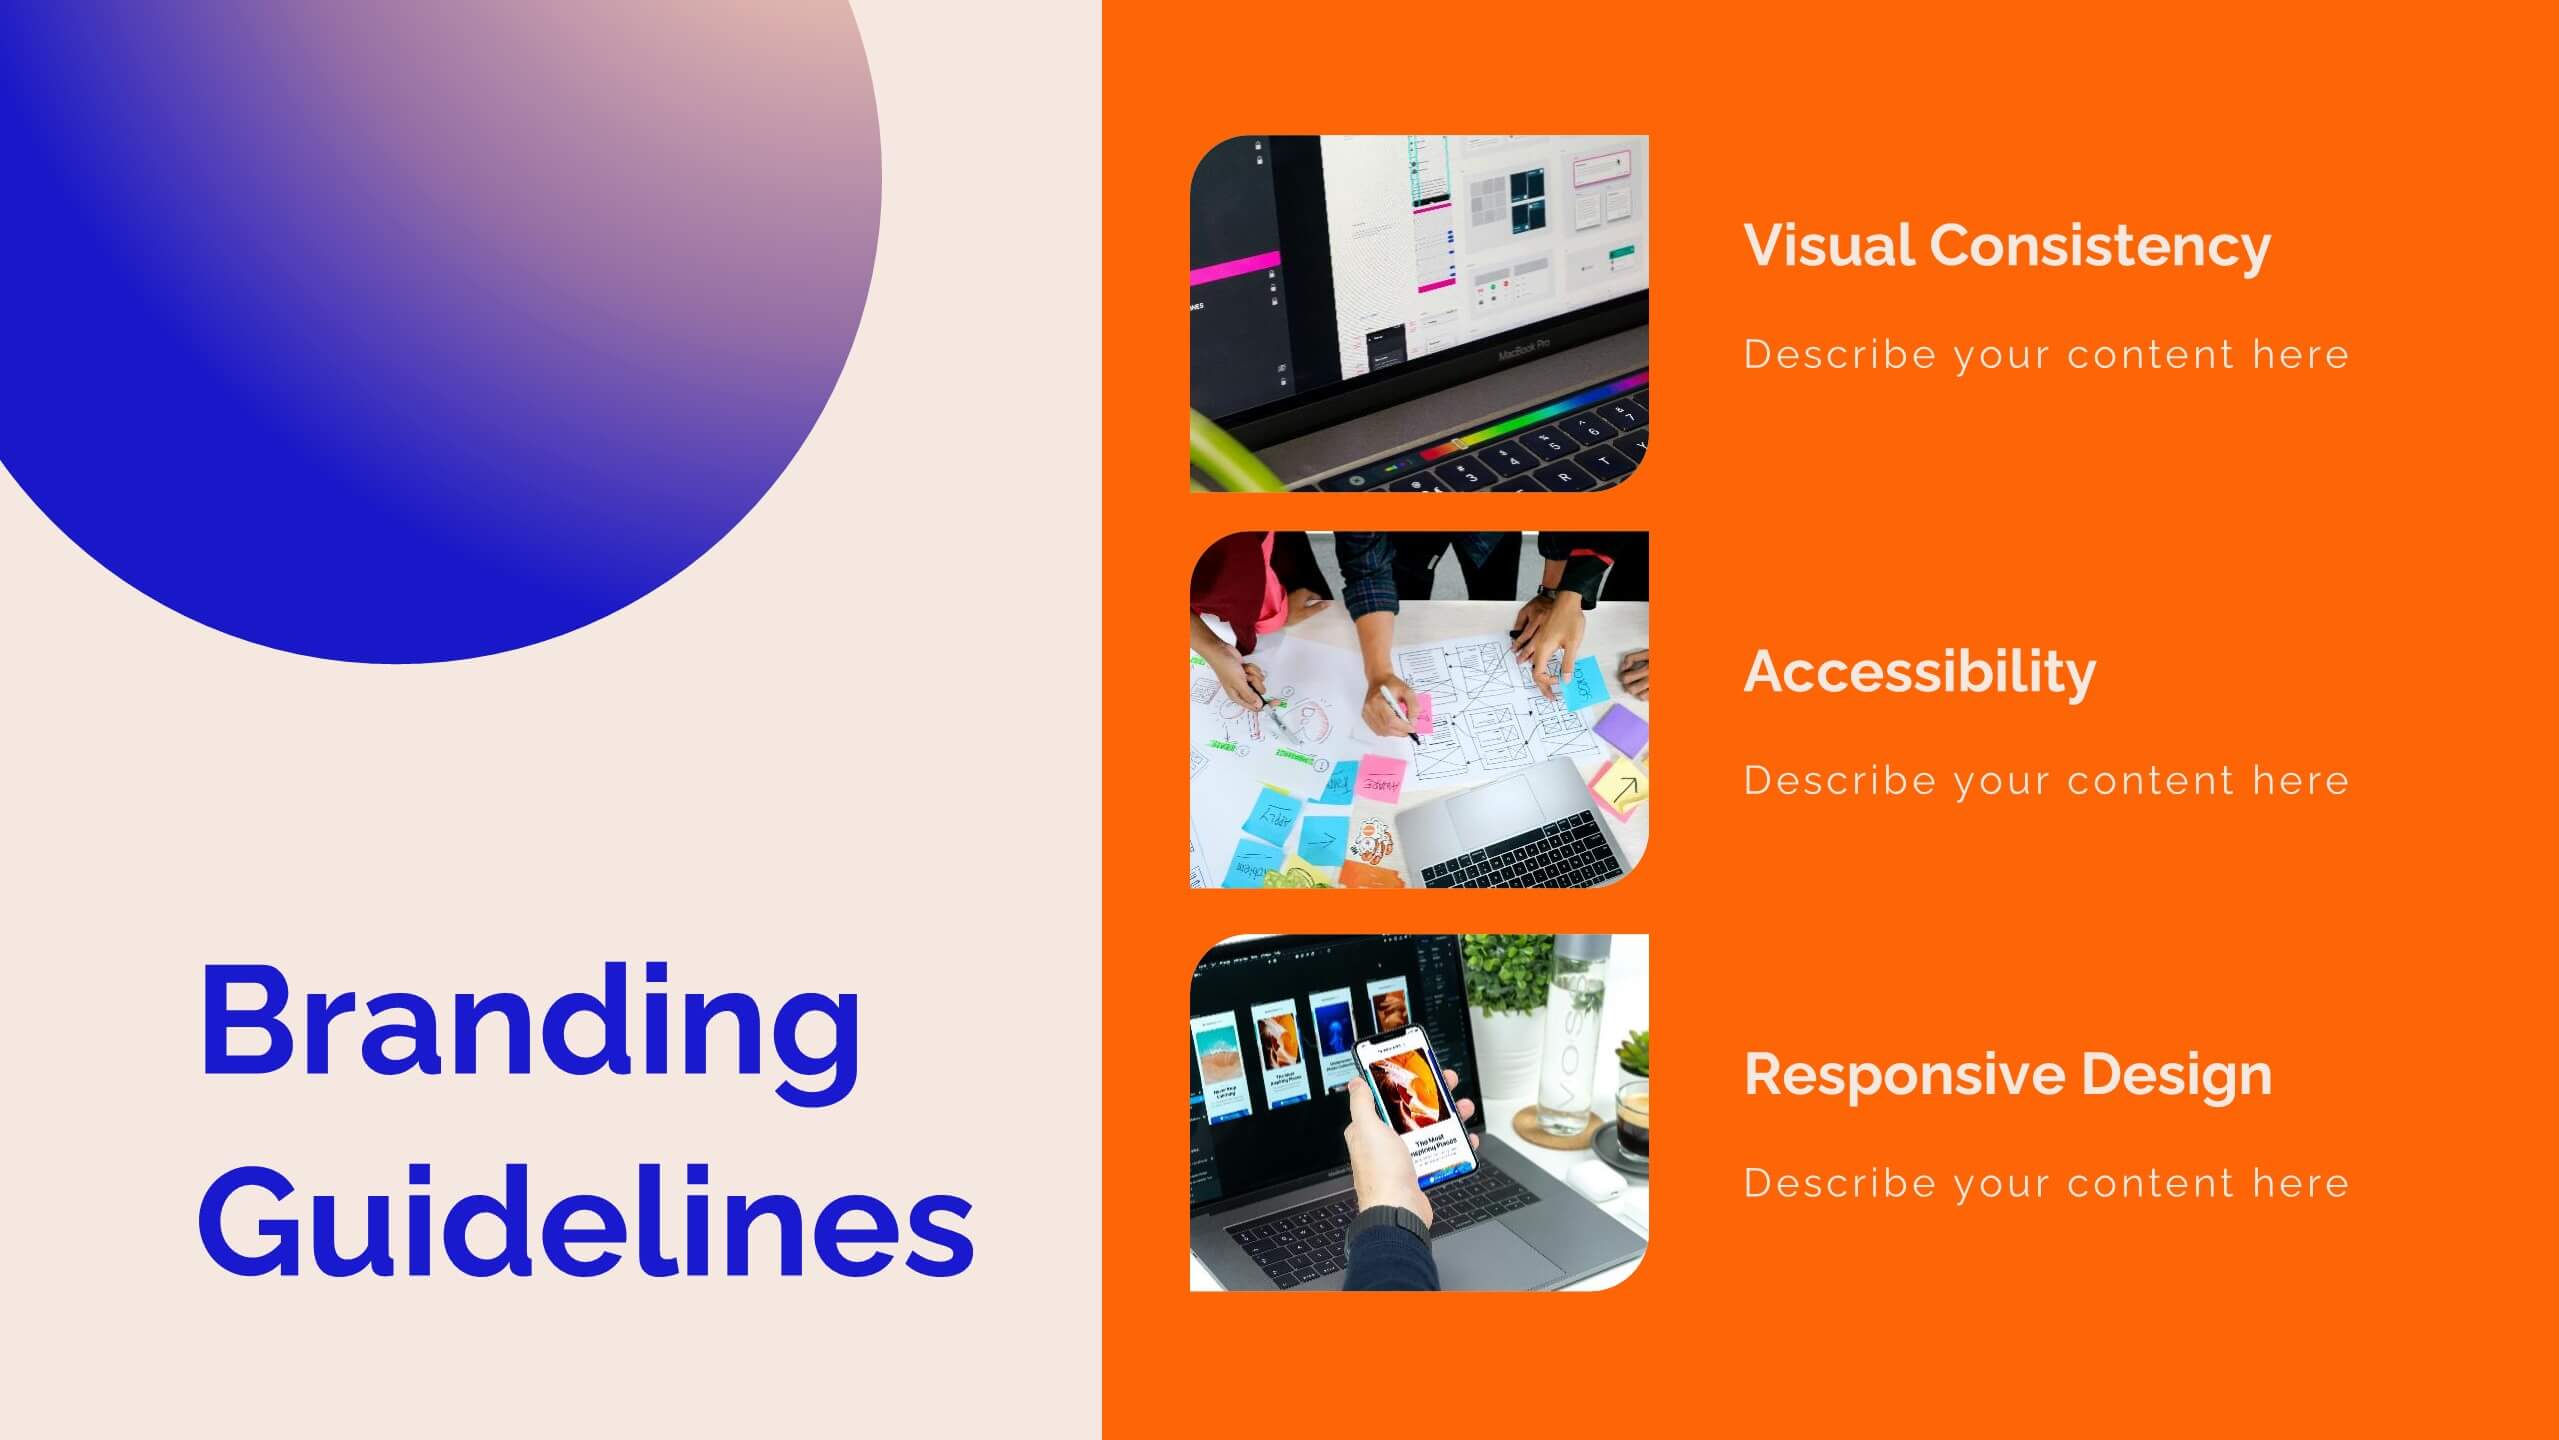
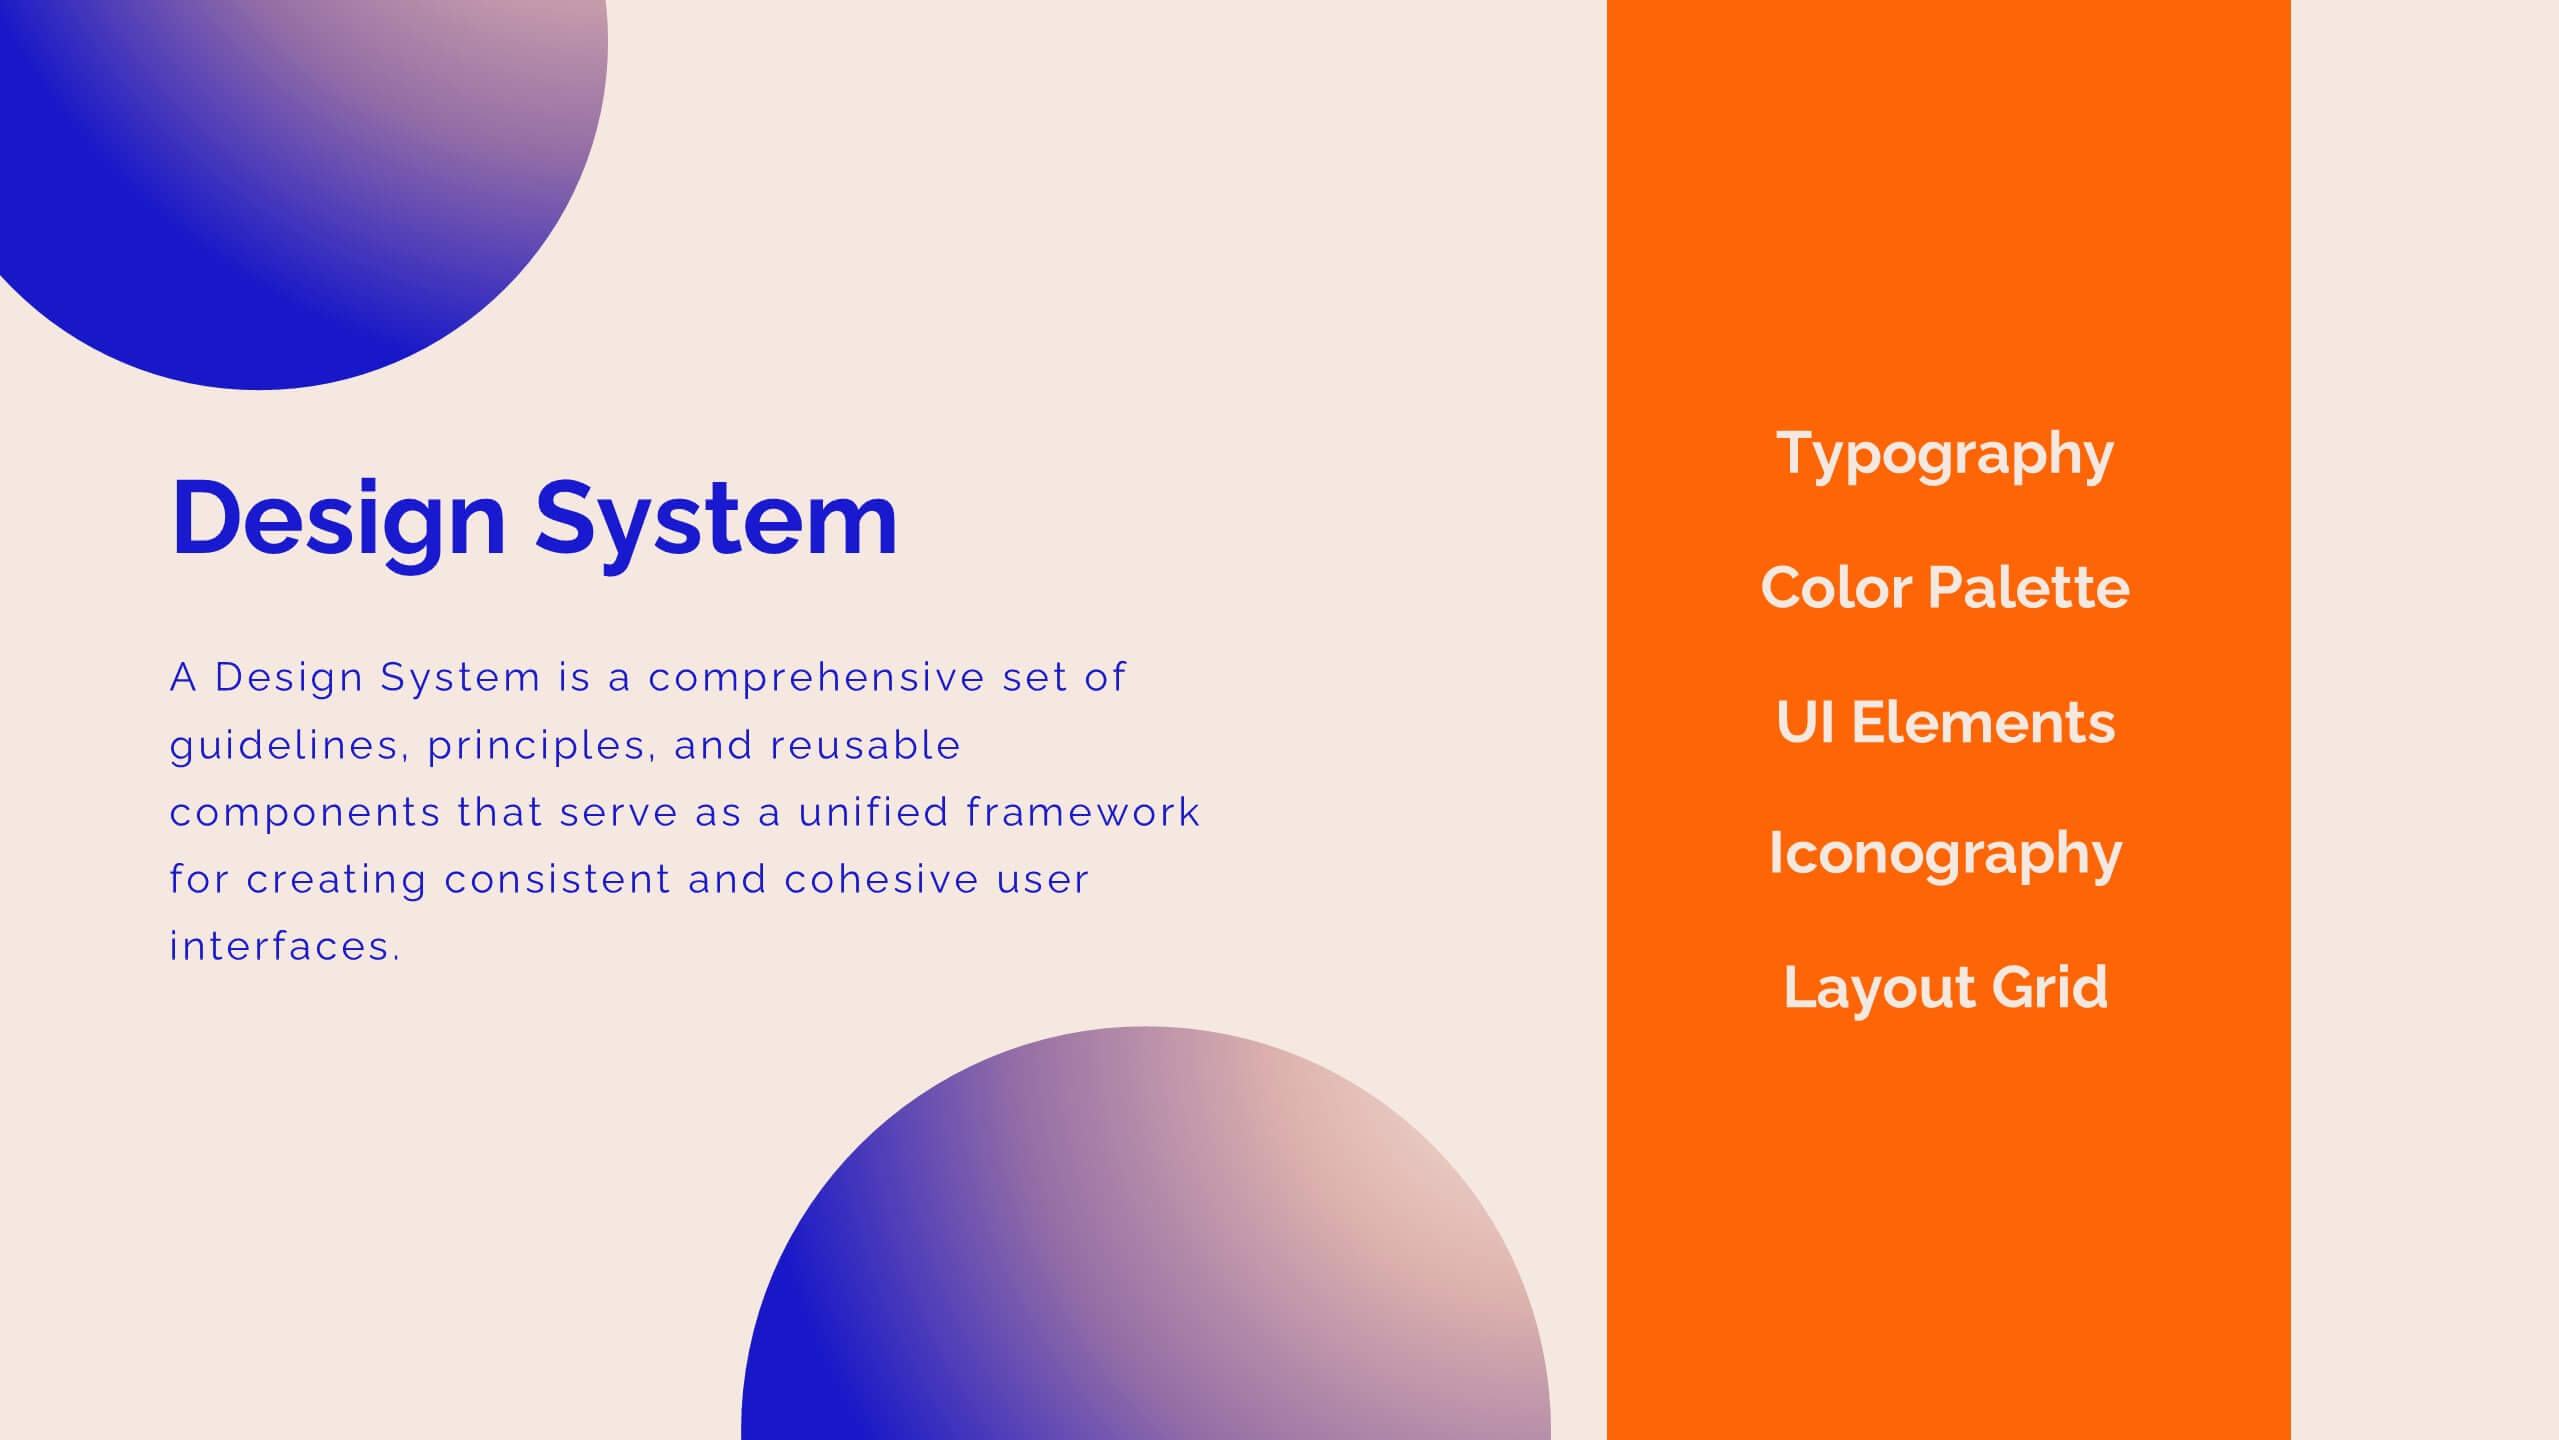
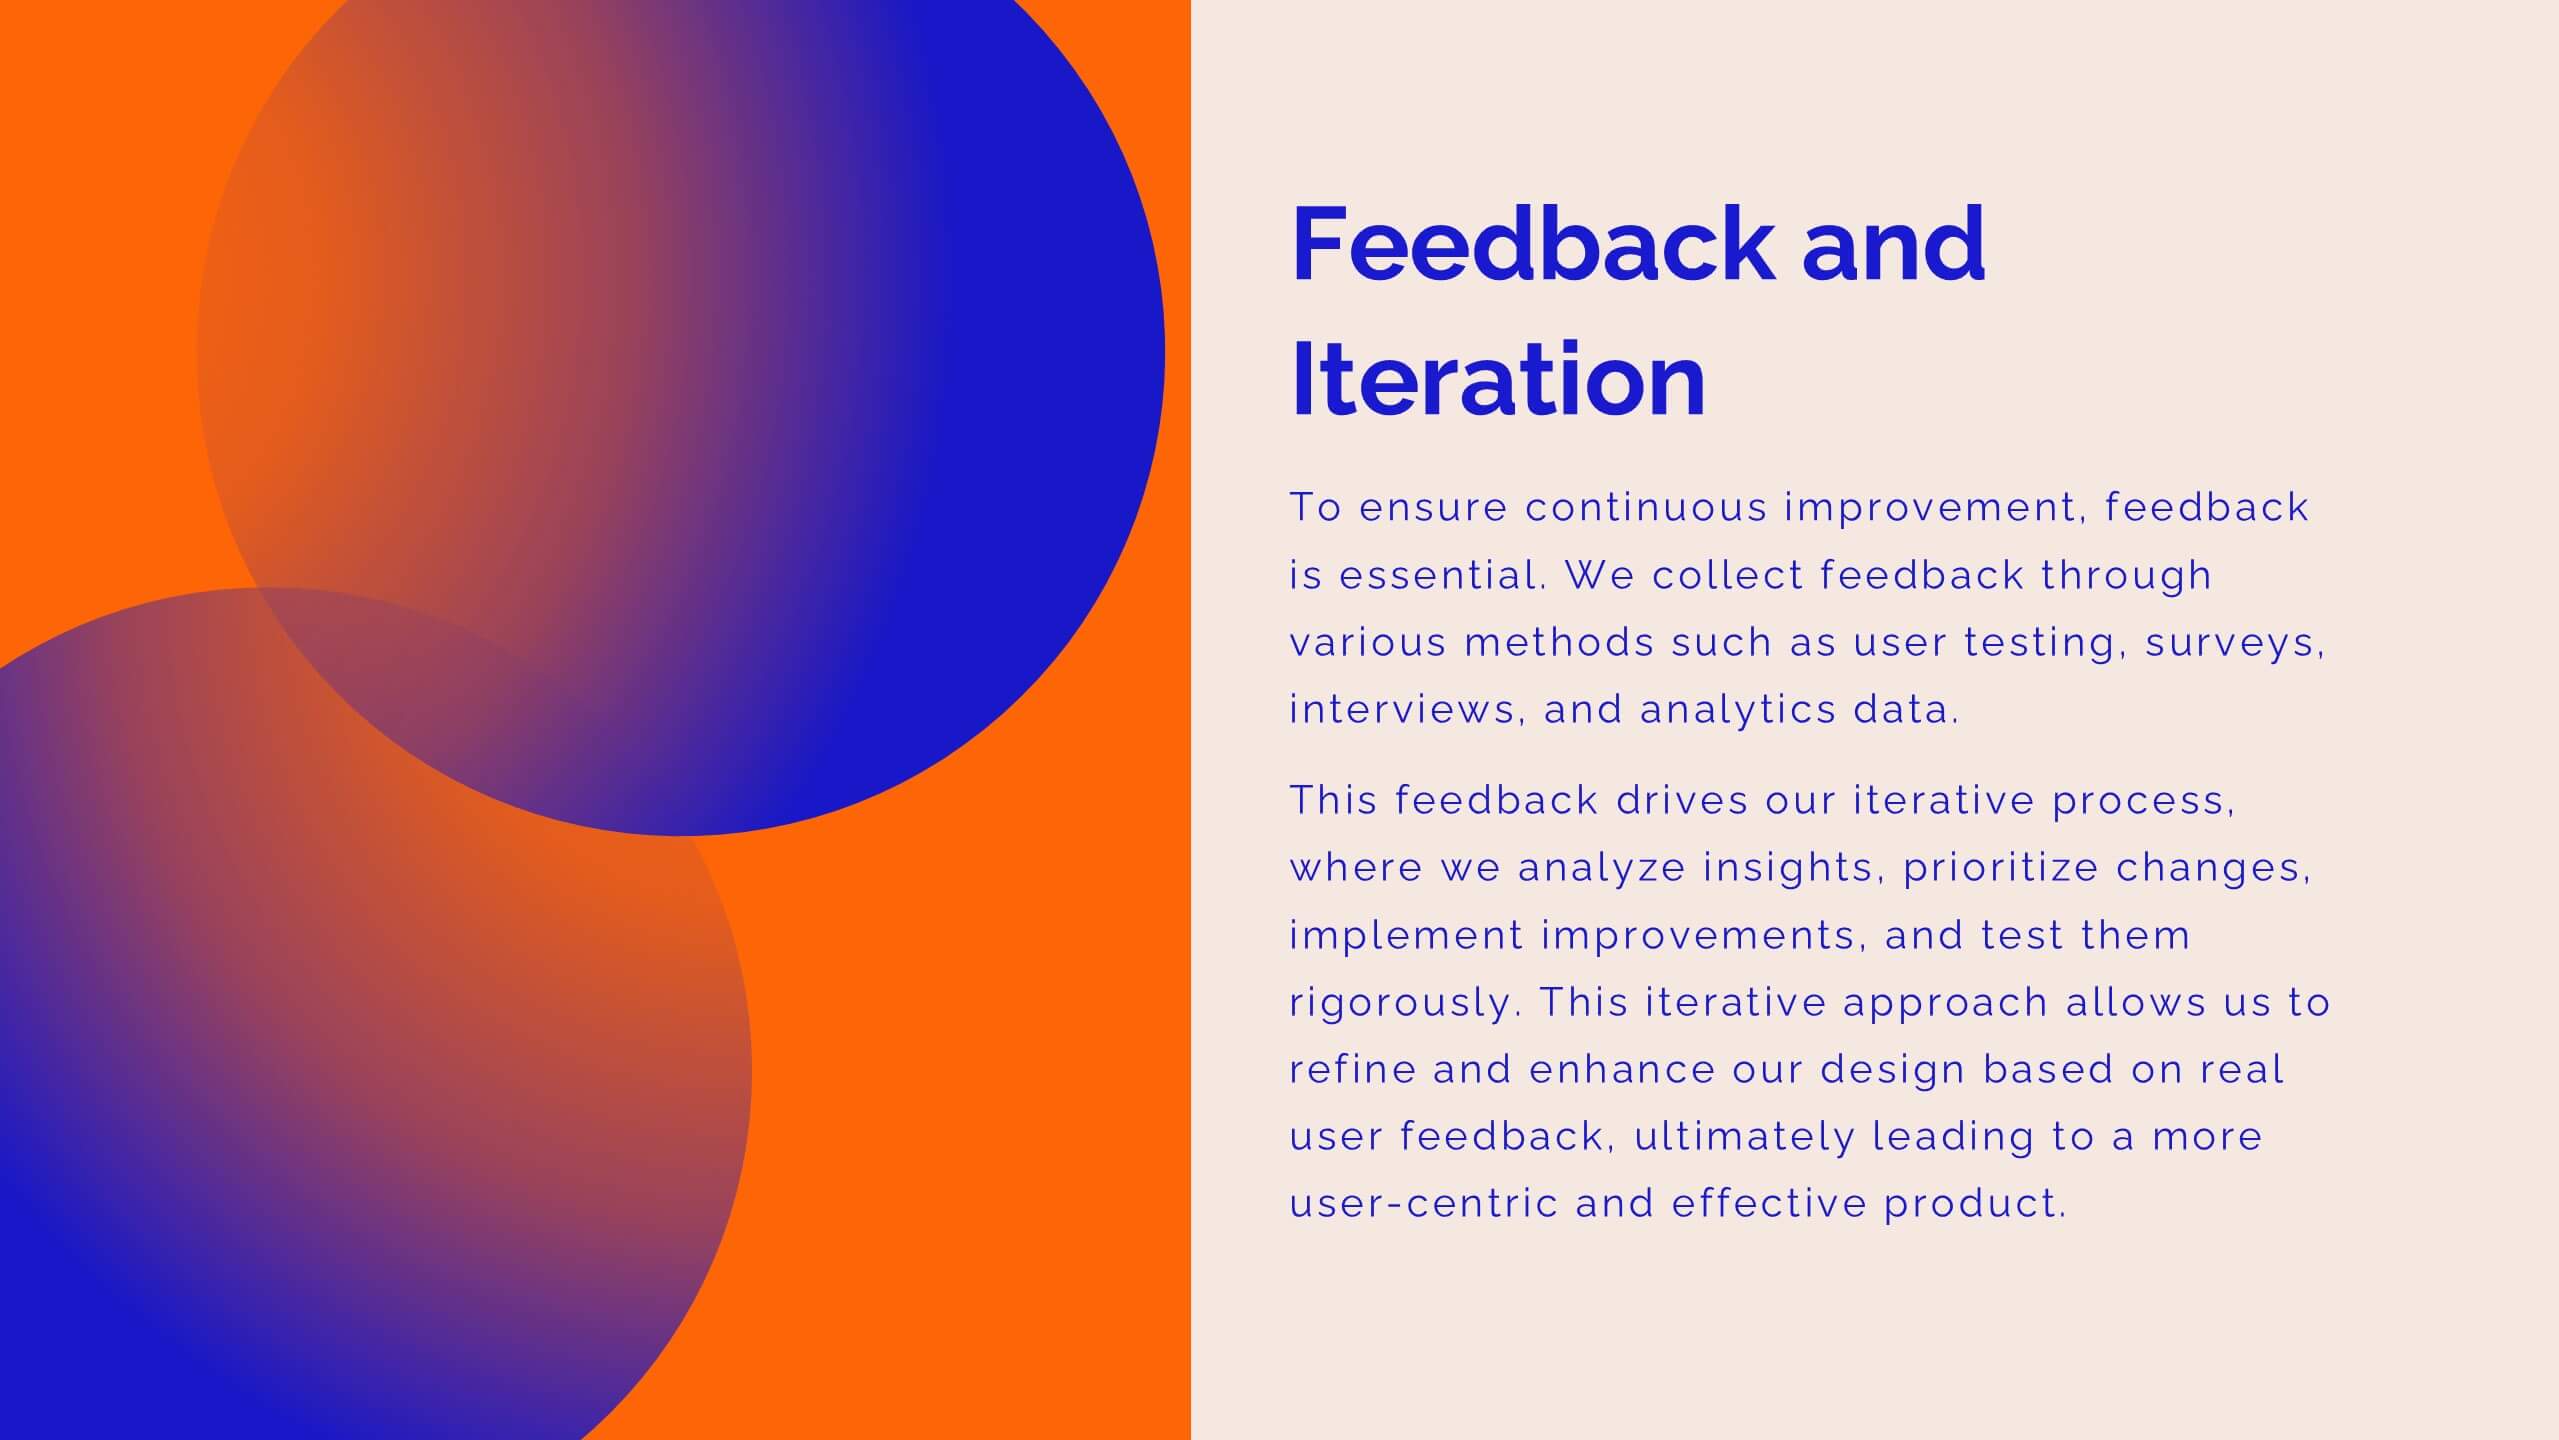
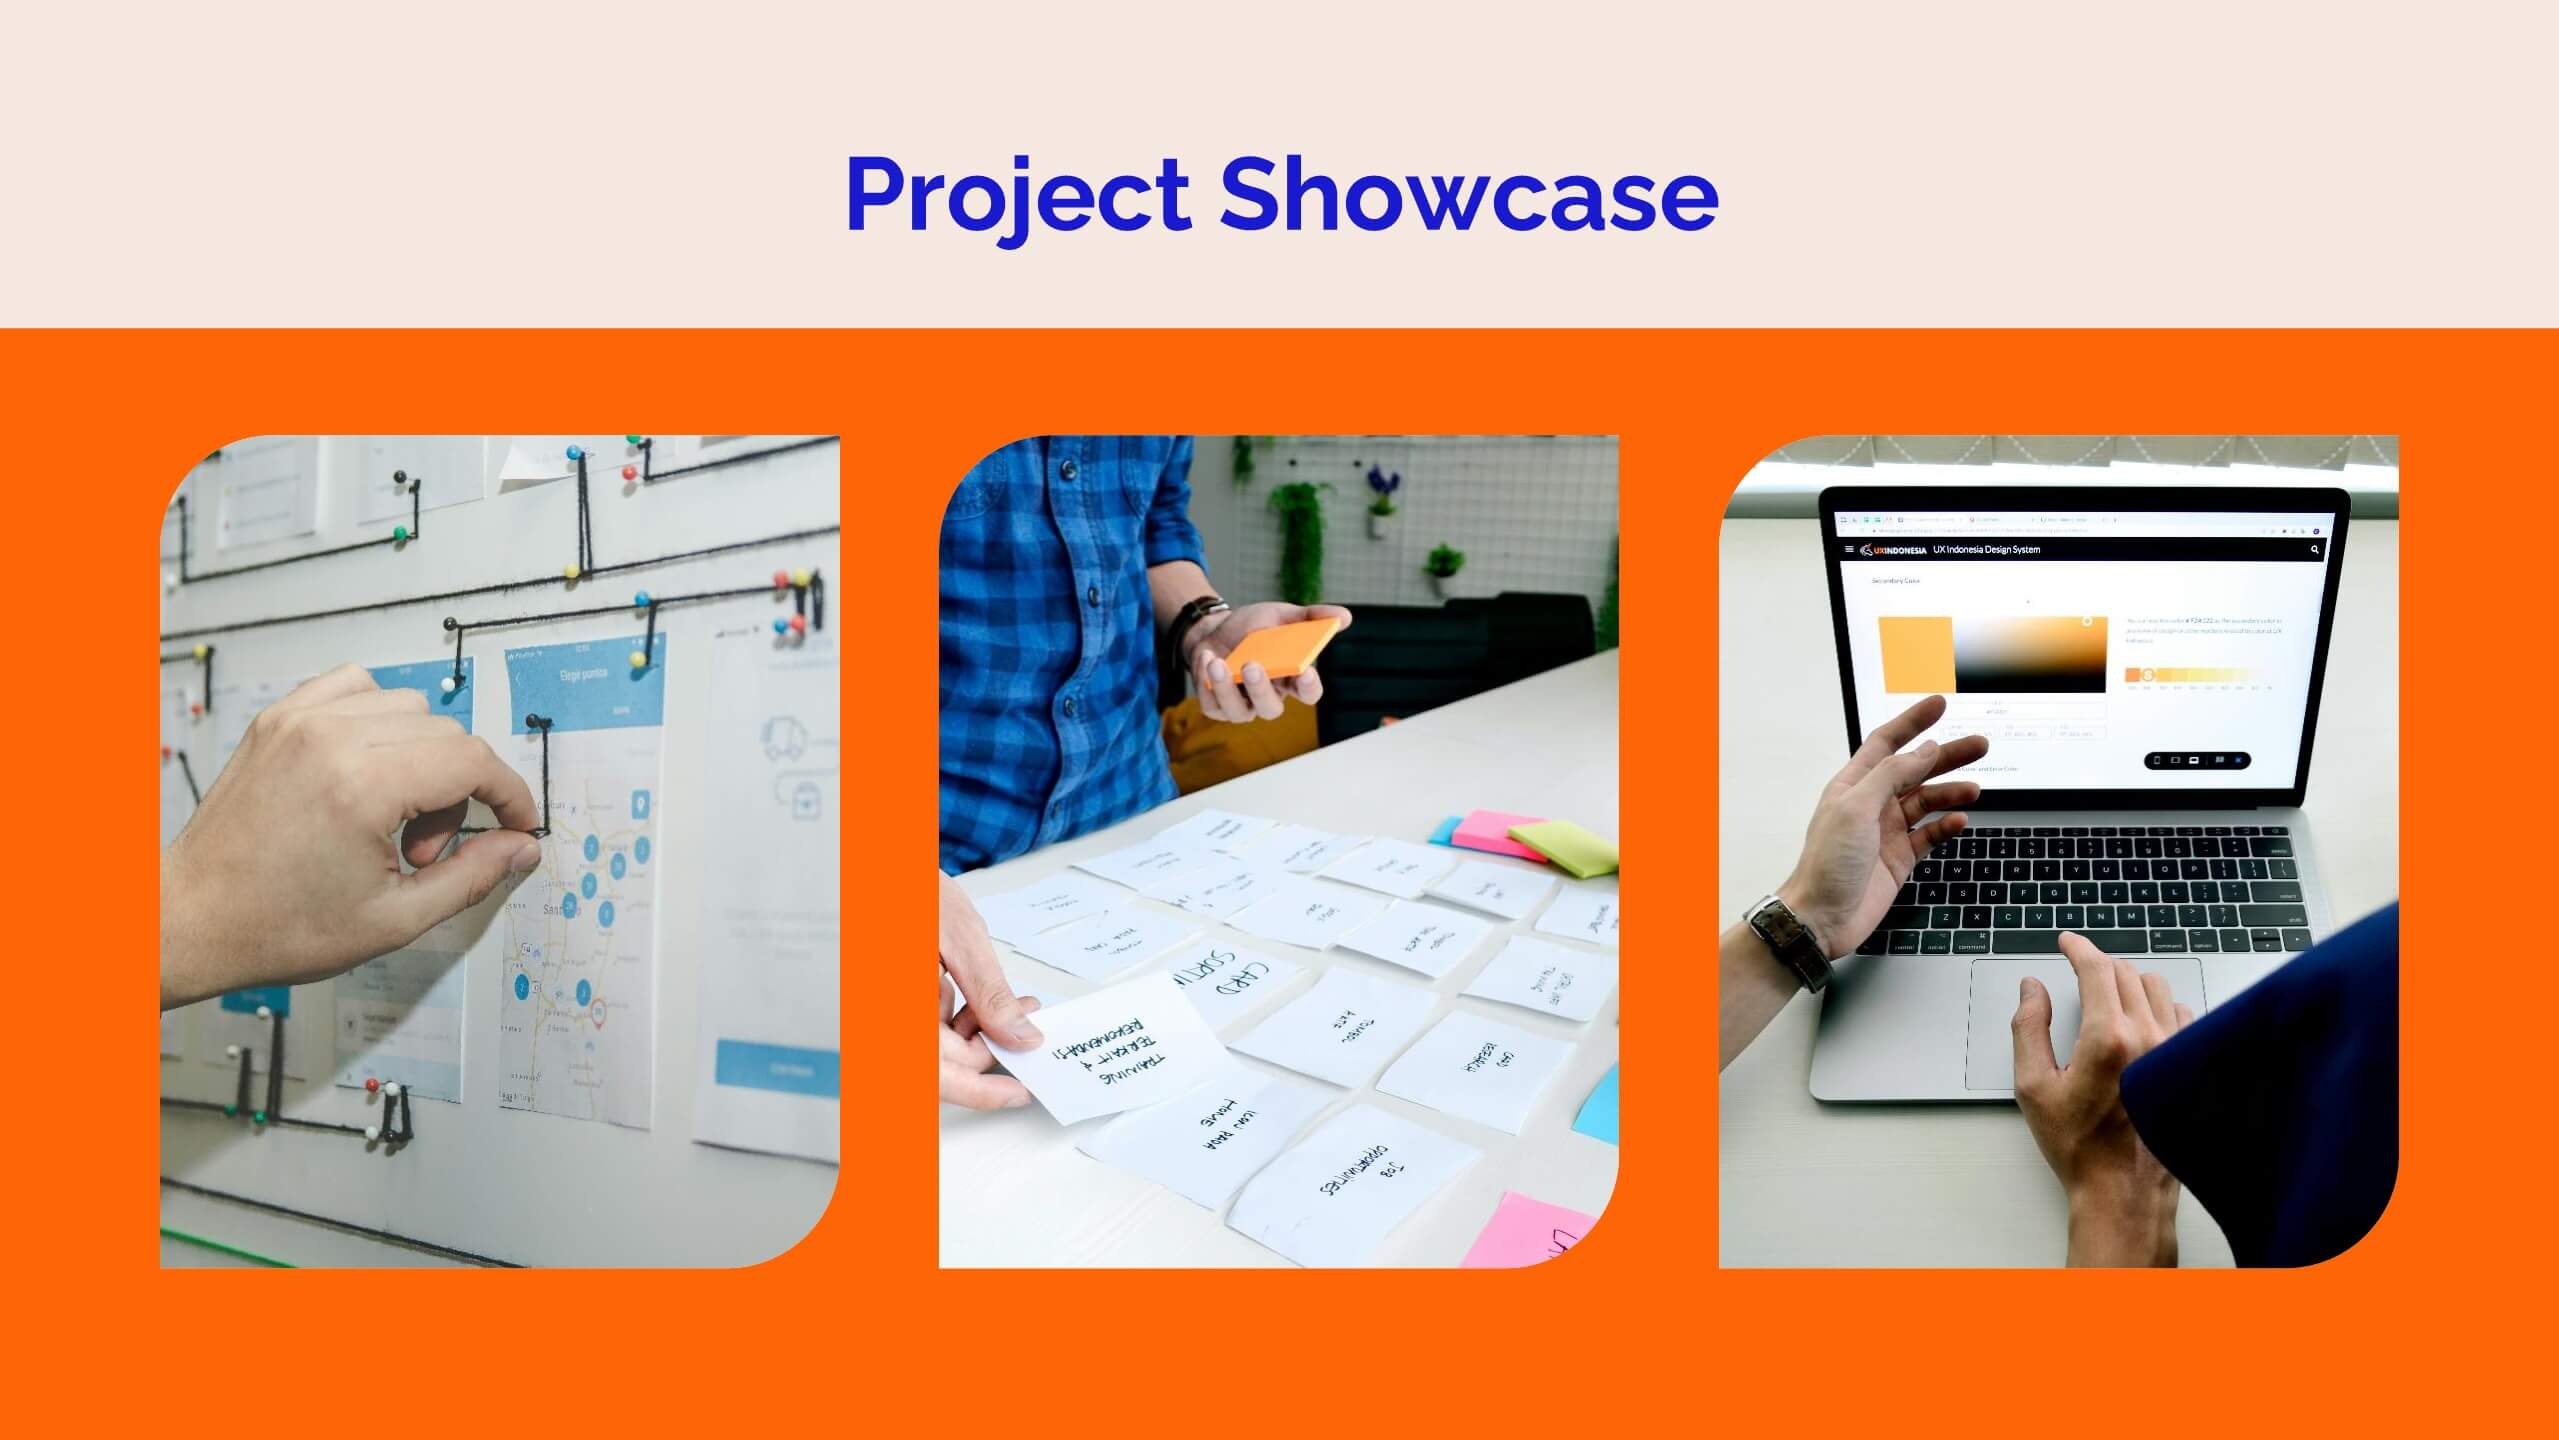
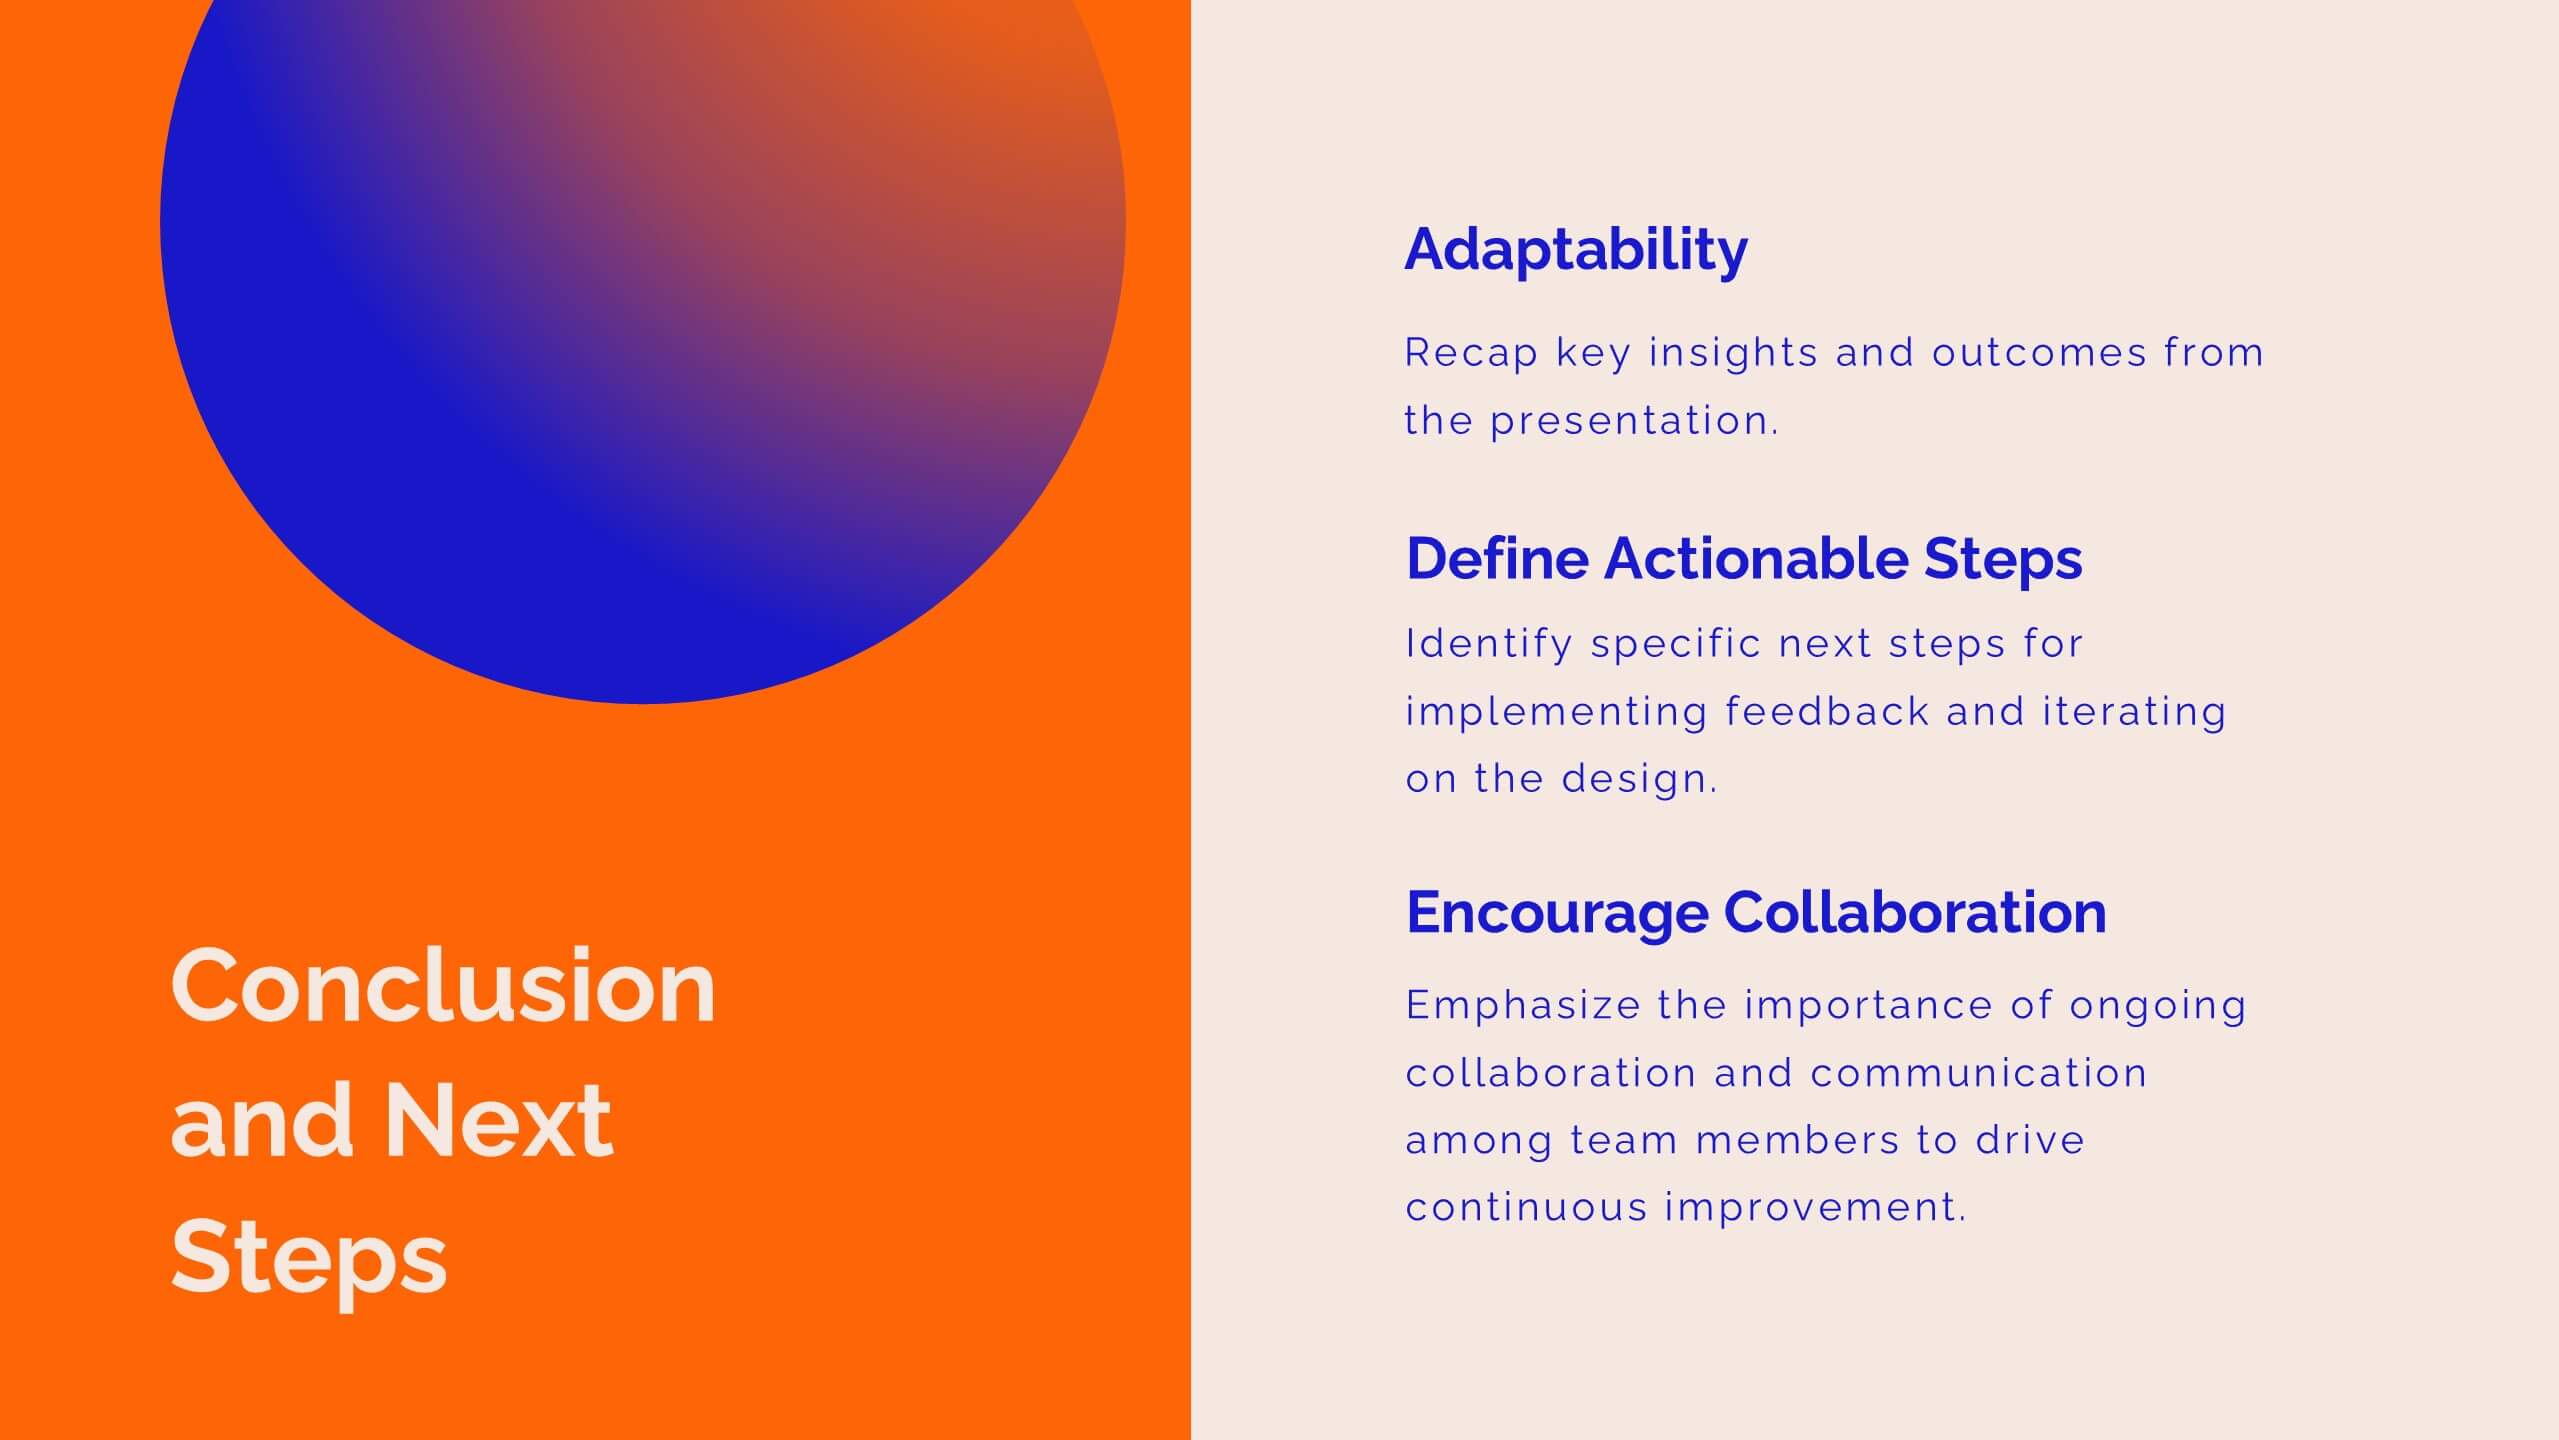
Niobium UX Research Report Presentation
Present your UX research findings with clarity and style using this vibrant UX research report template! It includes sections for user personas, wireframes, user testing, and design principles, making it ideal for sharing research insights. Fully customizable and compatible with PowerPoint, Keynote, and Google Slides, it's perfect for UX professionals and design teams.


6 diapositivas
Economic Trends in Africa Map Presentation
The Economic Trends in Africa Map template visually presents economic data across Africa. It displays regional economic shifts and trends, using an interactive map and related graphs. Ideal for analysts and investors, it offers clear insights for strategic decisions. Compatible with PowerPoint, Keynote, and Google Slides.


6 diapositivas
Porter's Five Forces Market Analysis Presentation
Gain a competitive edge with this Porter's Five Forces market analysis template! Designed to help businesses assess industry dynamics, this structured layout highlights competitive rivalry, supplier power, buyer influence, new market entries, and substitute threats. Perfect for strategists and analysts. Fully customizable and compatible with PowerPoint, Keynote, and Google Slides.


6 diapositivas
Business Process Flowchart Presentation
Streamline your workflow with the Business Process Flowchart presentation. This structured and visually engaging template helps you map out processes, optimize efficiency, and improve communication within your team. Designed for business analysts, managers, and strategists, this fully editable slide ensures clarity in decision-making and operations. Compatible with PowerPoint, Keynote, and Google Slides.


6 diapositivas
Problem-Solving Framework for Business Success Presentation
Streamline your approach to complex challenges with this 6-step business problem-solving framework. This professional slide layout clearly separates each stage—from identifying the issue to implementing solutions—using easy-to-edit circular markers and concise content boxes. Ideal for consulting pitches, internal planning, or strategy development, this slide is fully customizable in PowerPoint, Keynote, and Google Slides.


6 diapositivas
Real Estate Property Market Overview Presentation
Present key property market insights using this structured, easy-to-follow layout. The slide features six labeled sections flanking a central house graphic—ideal for highlighting data points, regional comparisons, or investment factors. Fully customizable in Canva, PowerPoint, and Google Slides, making it perfect for real estate reports, pitches, or client presentations.


12 diapositivas
Business Event Planning Schedule Presentation
Optimize your event planning with the Business Event Planning Schedule template, which streamlines your organization efforts by providing a clear timeline from January to June. It's perfect for entering key business insights or data at various stages. Designed for adaptability, this template ensures your planning remains concise and relevant. Compatible with PowerPoint, Keynote, and Google Slides, it integrates effortlessly into your workflow.