


Características


¿Tienes alguna pregunta?
Recomendar


5 diapositivas
Cloud Computing for Business Presentation
Present your cloud strategy with clarity using this modern five-point diagram. Each cloud icon is linked to a central device, symbolizing data flow, security, storage, and infrastructure services. Ideal for IT presentations, cloud migration plans, or SaaS workflows. Fully editable in PowerPoint, Keynote, and Google Slides.


4 diapositivas
Business Growth in Numbers Presentation
Showcase business performance with the Business Growth in Numbers Presentation template. Designed for sales reports, financial reviews, and market analysis, this template includes visualized statistics, percentage comparisons, and trend graphs to highlight key growth metrics. Fully customizable and compatible with PowerPoint, Keynote, and Google Slides, it ensures clear and compelling data storytelling.


4 diapositivas
E-Learning LMS Deployment Strategy Presentation
Break down your LMS rollout with clarity and style using this collaborative e-learning strategy visual. With its unique pencil-and-laptop layout, this infographic is perfect for trainers, course creators, and EdTech professionals mapping out a deployment process. Fully compatible with PowerPoint, Keynote, and Google Slides for flexible customization.


4 diapositivas
Turning Ideas into Impact Presentation
Showcase your transformation journey from concept to achievement with this bold visual layout. The three-step diagram—idea, action, success—makes it ideal for project planning, product development, or strategic execution. Easily editable in PowerPoint, Keynote, and Google Slides for pitch decks, business roadmaps, or innovation workflows. Clean, modern, and impactful.


7 diapositivas
Veterinary Infographic Presentation Template
Veterinarians are the doctors of the animal world. Veterinary medicine is the branch of science and profession concerned with the prevention, diagnosis and treatment of disease, disorder, dysfunction and injury in animals. This template includes a comprehensive list of veterinary medicine infographics. They have appealing illustrations completely customizable for you. Use this template to create your veterinary medicine study notes for each chapter. It is a great way to remember what you learned. You can use this template to organize your notes, review labs and as a study guide for tests.


6 diapositivas
Business Model Canvas Proposition Infographic
The Business Model Canvas is a strategic management tool that provides a visual framework for describing, analyzing, and developing a business model. This infographic template visually represents the key components of a business model using the Business Model Canvas framework. This framework provides an overview of how a business creates, delivers, and captures value. This template is designed to be a comprehensive way to map out all the key components of a business model. This infographic is a versatile tool perfect for startups, established companies, and entrepreneurs to visualize, communicate, and iterate on their business models.


8 diapositivas
Market Research Survey Analysis Presentation
Present your Market Research Survey Analysis with this visually engaging template, designed for clear data visualization and insights presentation. Featuring an intuitive infographic layout, this template allows you to highlight key survey findings, customer insights, and strategic takeaways. Fully customizable in PowerPoint, Keynote, and Google Slides, you can adjust colors, edit text, and modify icons to align with your business needs.


20 diapositivas
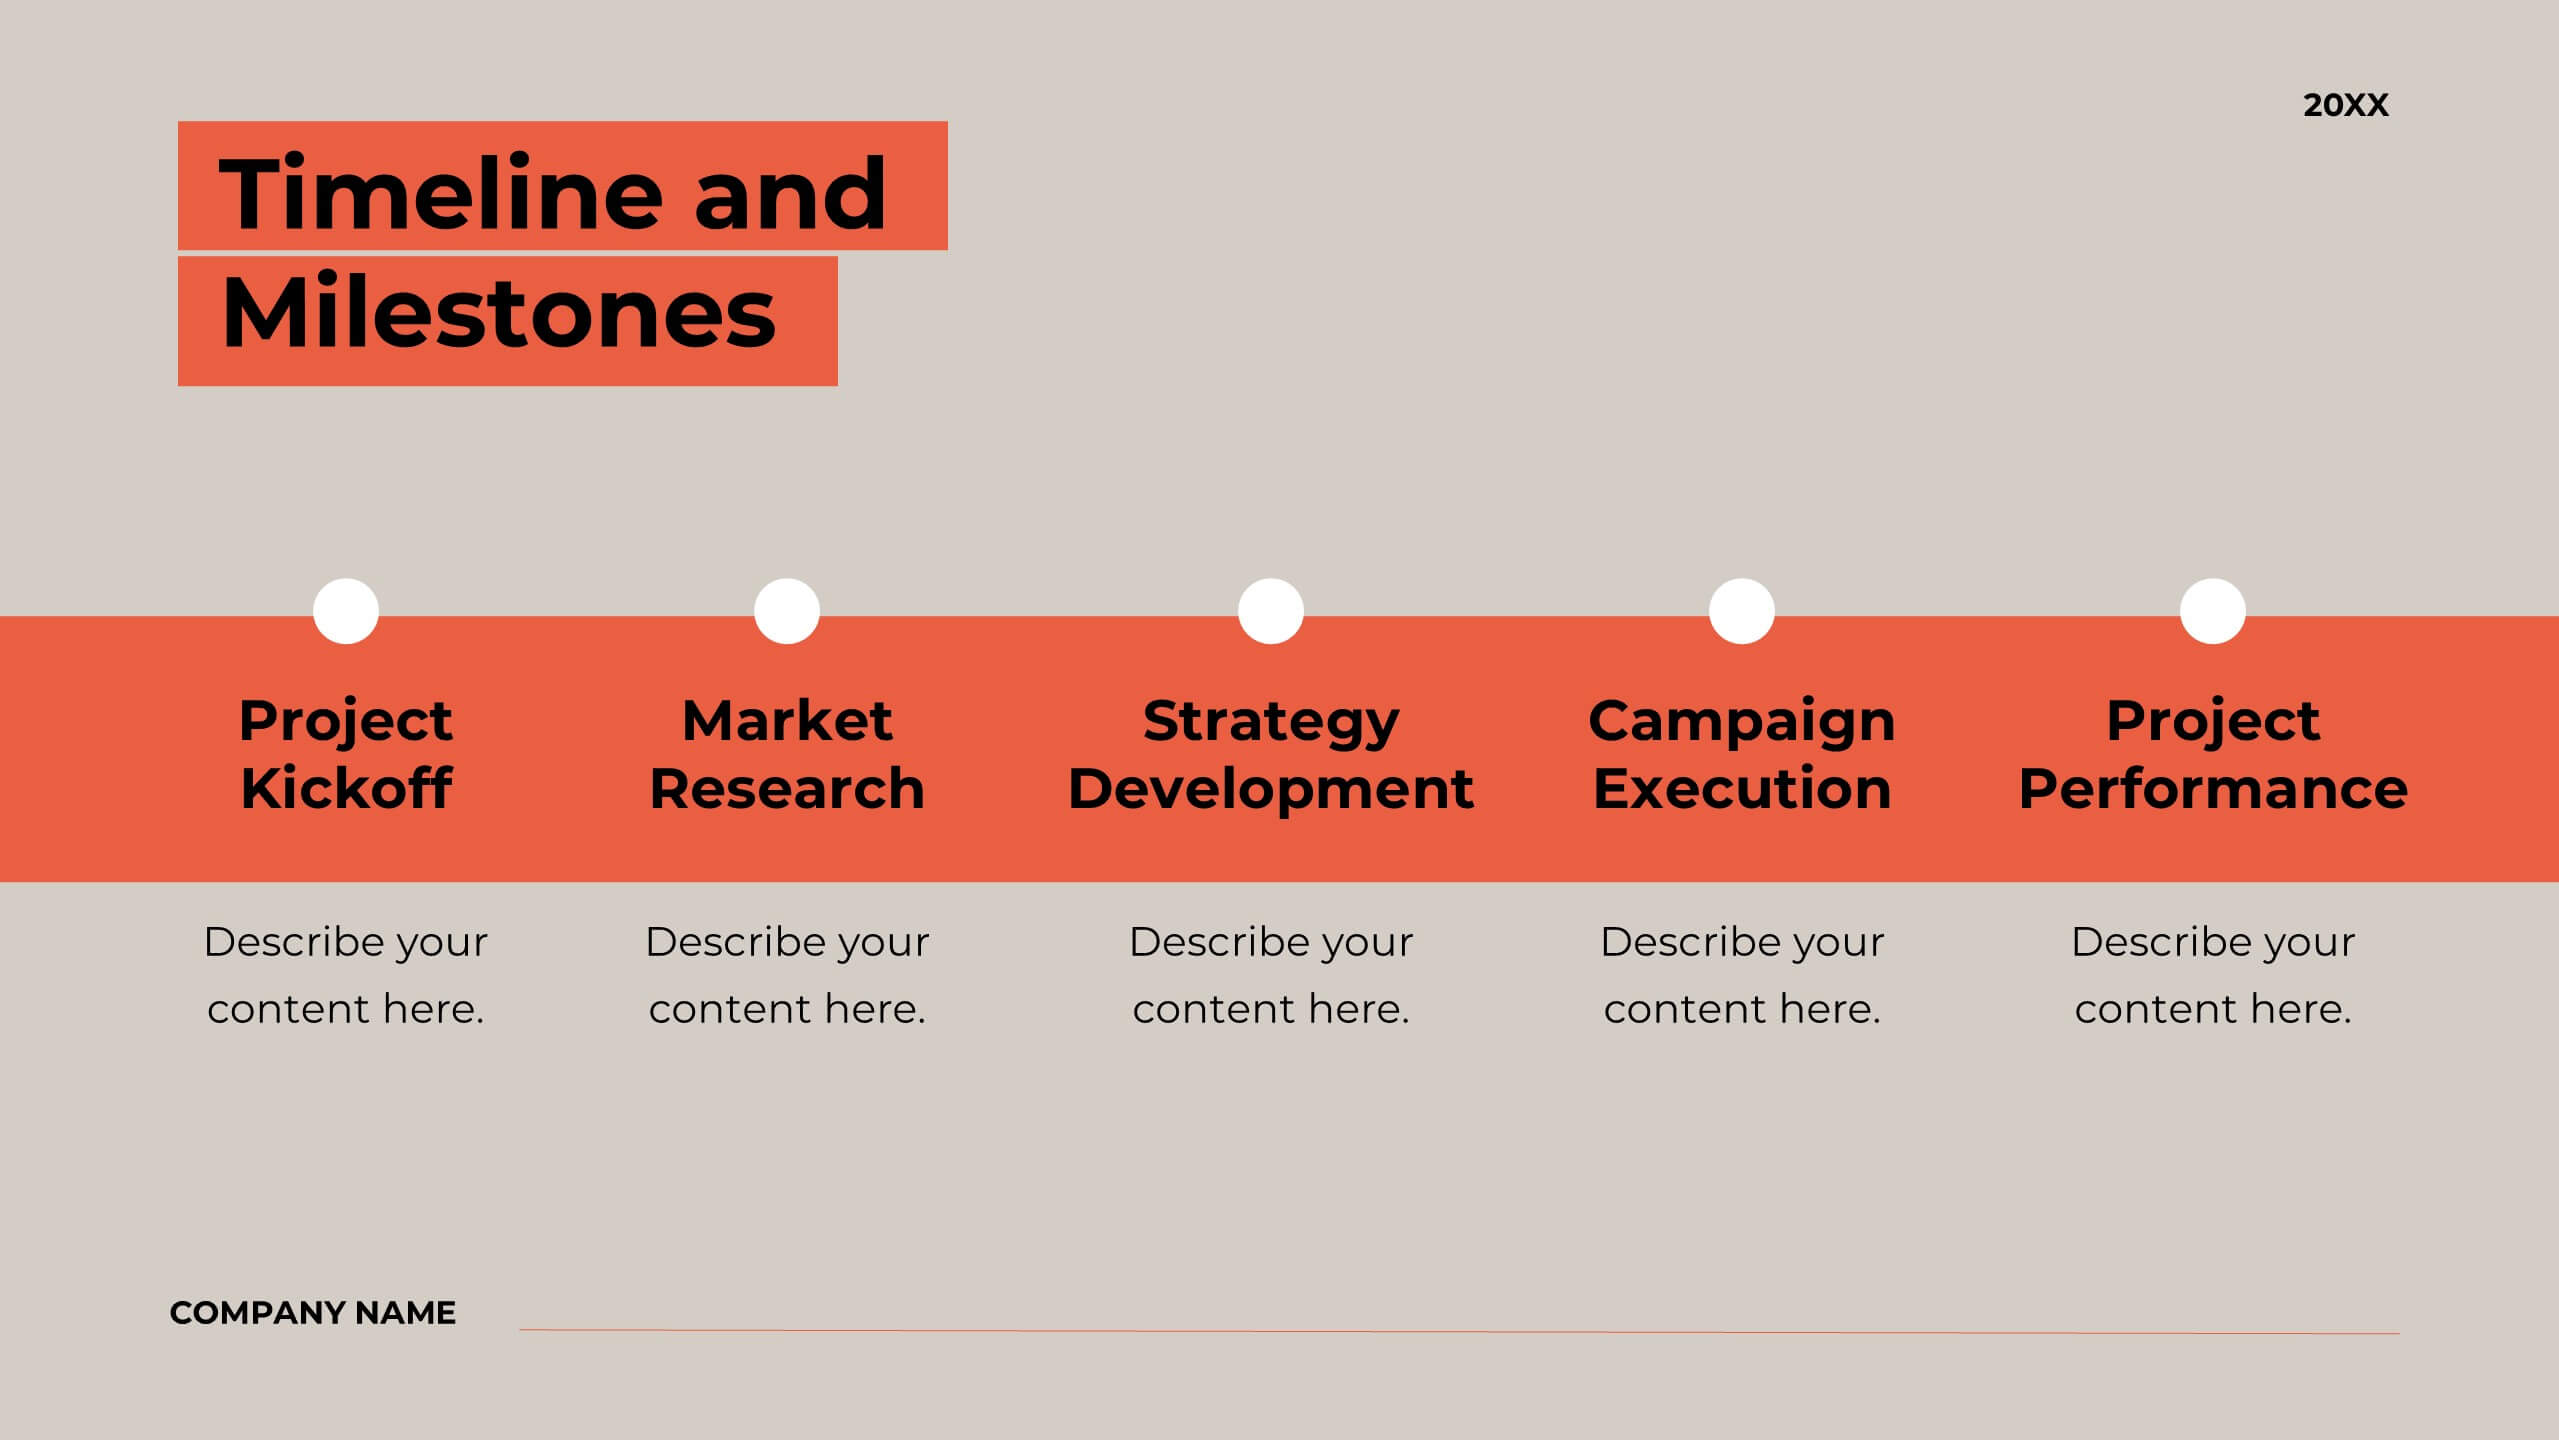
Bentom Marketing Proposal Presentation
This marketing proposal template is crafted to communicate your strategy with impact. With sections covering company overview, project summary, objectives, methodology, budget breakdown, and deliverables, it provides a professional layout for presenting key details to clients. Tailor it to fit your needs, and present confidently using PowerPoint, Keynote, or Google Slides.


6 diapositivas
Problem-Solving Framework for Business Success Presentation
Streamline your approach to complex challenges with this 6-step business problem-solving framework. This professional slide layout clearly separates each stage—from identifying the issue to implementing solutions—using easy-to-edit circular markers and concise content boxes. Ideal for consulting pitches, internal planning, or strategy development, this slide is fully customizable in PowerPoint, Keynote, and Google Slides.


7 diapositivas
Mind Map Infographic Presentation Template
A mind map is a diagram that allows you to visualize how related ideas and concepts are connected to one another. It is especially good for brainstorming, planning and organizing. A mind map allows you to organize information in a way that shows your thinking process and gives you the opportunity for deeper understanding. This template will help others understand how you think about a particular subject or topic. Use this template to "brainstorm" a topic, and create an interesting mind map. You can also use it to share your ideas with others, or to visually organize your thoughts.


20 diapositivas
Aeneas Sales Proposal Presentation
Seal your next deal with this professional sales proposal template. It covers key sections like objectives, pricing strategy, and target market, offering a comprehensive layout for your pitch. Ideal for impressing clients, it's compatible with PowerPoint, Keynote, and Google Slides for smooth, impactful presentations.


15 diapositivas
Business Journal Infographic
A Business Journal Infographic is a visual representation of data, information, or concepts related to business topics that typically follow the style and format often found in business journals or publications. This infographic is designed to present complex information quickly and clearly. The purpose of this is to convey information in a visually engaging and easily digestible format, making it easier for readers to grasp complex business concepts or data. With this template transform your business narrative into a captivating visual story that not only informs but inspires readers to delve into the world of entrepreneurship.


3 diapositivas
Business Self-Introduction
Make a memorable first impression with this clean, skill-focused introduction slide. Ideal for presenting professional backgrounds, role highlights, and expertise levels. Great for resumes, team intros, or portfolio decks. Fully editable in PowerPoint, Keynote, and Google Slides.


14 diapositivas
Key Takeaways Summary Presentation
Summarize important insights effectively with this key takeaways summary template! Designed to highlight crucial points in a visually engaging format, this layout is perfect for reports, presentations, and meetings. Keep your audience focused on the most valuable information. Fully customizable and compatible with PowerPoint, Keynote, and Google Slides.


3 diapositivas
Project Completion Checklist Presentation
Keep projects on track with the Project Completion Checklist template. This structured layout helps you monitor tasks, update statuses, and document progress seamlessly. Featuring status indicators, date tracking, and notes sections, this template enhances productivity and organization. Fully customizable and compatible with PowerPoint, Keynote, and Google Slides for effortless use.


6 diapositivas
Customer Perceived Value Analysis
Visualize what matters most to your audience using this customer-centric diagram. Perfect for marketers, brand strategists, and CX professionals looking to present value drivers, motivations, or user insights. Easily editable in PowerPoint, Keynote, and Google Slides—customize colors, icons, and text to align with your brand.


6 diapositivas
Framework for Business Hierarchies Presentation
Clearly define organizational layers with the Framework for Business Hierarchies Presentation. This pyramid-style layout is perfect for illustrating chain-of-command, leadership structures, or functional roles from executive to operational levels. The template features color-coded tiers, editable icons, and fully customizable text to suit your business model. Ideal for PowerPoint, Canva, Keynote, and Google Slides.