


Características


¿Tienes alguna pregunta?
Recomendar


5 diapositivas
Timeline Road Infographics
Timelines are important tools for organizing and presenting information chronologically. This timeline infographic is designed to help ensure that all your tasks are completed on time, and that the project stays on track. This is perfect for identifying potential issues that may arise during a project, so that they can be addressed before they become major problems. This template consists of a road or a horizontal line, with markers or milestones placed at specific intervals. Each marker represents a significant event or achievement, and is accompanied by a short description, date or time frame.


6 diapositivas
Education Services Infographic
Education services refer to the various activities and resources provided to facilitate learning and knowledge acquisition. This infographic template showcases various education services and their benefits. This infographic is designed to highlight the different aspects of education services and their impact on individuals and society as a whole. The infographic features a vibrant and eye-catching design that captures attention and engages viewers. The use of bright colors and appealing illustrations makes the infographic visually appealing and memorable. Compatible with Powerpoint, Keynote, and Google Slides.


7 diapositivas
RAPID Accuracy Infographic Presentation
A RAPID Matrix Infographic is a visual tool used in project management and decision-making processes to clarify and assign roles and responsibilities to individuals or groups involved in a project. This template is designed to provide clarity and structure to the decision-making and project management processes. This template includes grids and tables that list the different activities, tasks, or decisions related to the project, and assigns roles and responsibilities to each activity. Easily customize and modify this template to fit specific team or organization's decision-making process.


7 diapositivas
Money Market Infographic
The money market is a sector of the financial market where short-term borrowing and lending occur, typically in the form of highly liquid and low-risk instruments. Navigate the financial landscape with our Money Market Infographic. This colorful and informative template is designed to help you understand the dynamics of the money market, empowering you to make sound financial decisions. Compatible with Powerpoint, Keynote, and Google Slides. This infographic demystifies the money market, offering valuable insights and knowledge to help you navigate the world of investments and financial growth.


6 diapositivas
Business Mission Statement Presentation
Here is a vivid "Business Mission Statement" presentation template tailored to elucidate your company's core objectives and strategic goals. This template features a unique brain-design interface that symbolizes thought leadership and innovative thinking, ideal for sharing insights that resonate deeply with your team or stakeholders. Compatible with PowerPoint, Keynote, and Google Slides, it's the perfect tool for broadcasting your mission with clarity and impact.


8 diapositivas
Health and Safety Training
Create impactful safety briefings with this visual slide designed around a caution-sign layout. Perfect for outlining training modules, compliance steps, or workplace hazard procedures, it presents four key points using icons and color-coded elements. Fully customizable in PowerPoint, Keynote, and Google Slides.


4 diapositivas
HR Management Strategy Presentation
An engaging, structured design that turns complex planning into a clear, visual story. This presentation guides audiences through essential strategic steps, helping teams understand goals, processes, and people-centered initiatives with ease. Clean icons and modern layouts keep every point focused and professional. Fully compatible with PowerPoint, Keynote, and Google Slides.


4 diapositivas
Organizational Layered Structure Presentation
Visualize team dynamics and reporting lines with this clean and professional organizational layered structure template. Designed to help you present hierarchy, roles, and responsibilities across departments, this slide is perfect for HR, operations, or executive updates. Easily editable and fully compatible with PowerPoint, Keynote, and Google Slides.


5 diapositivas
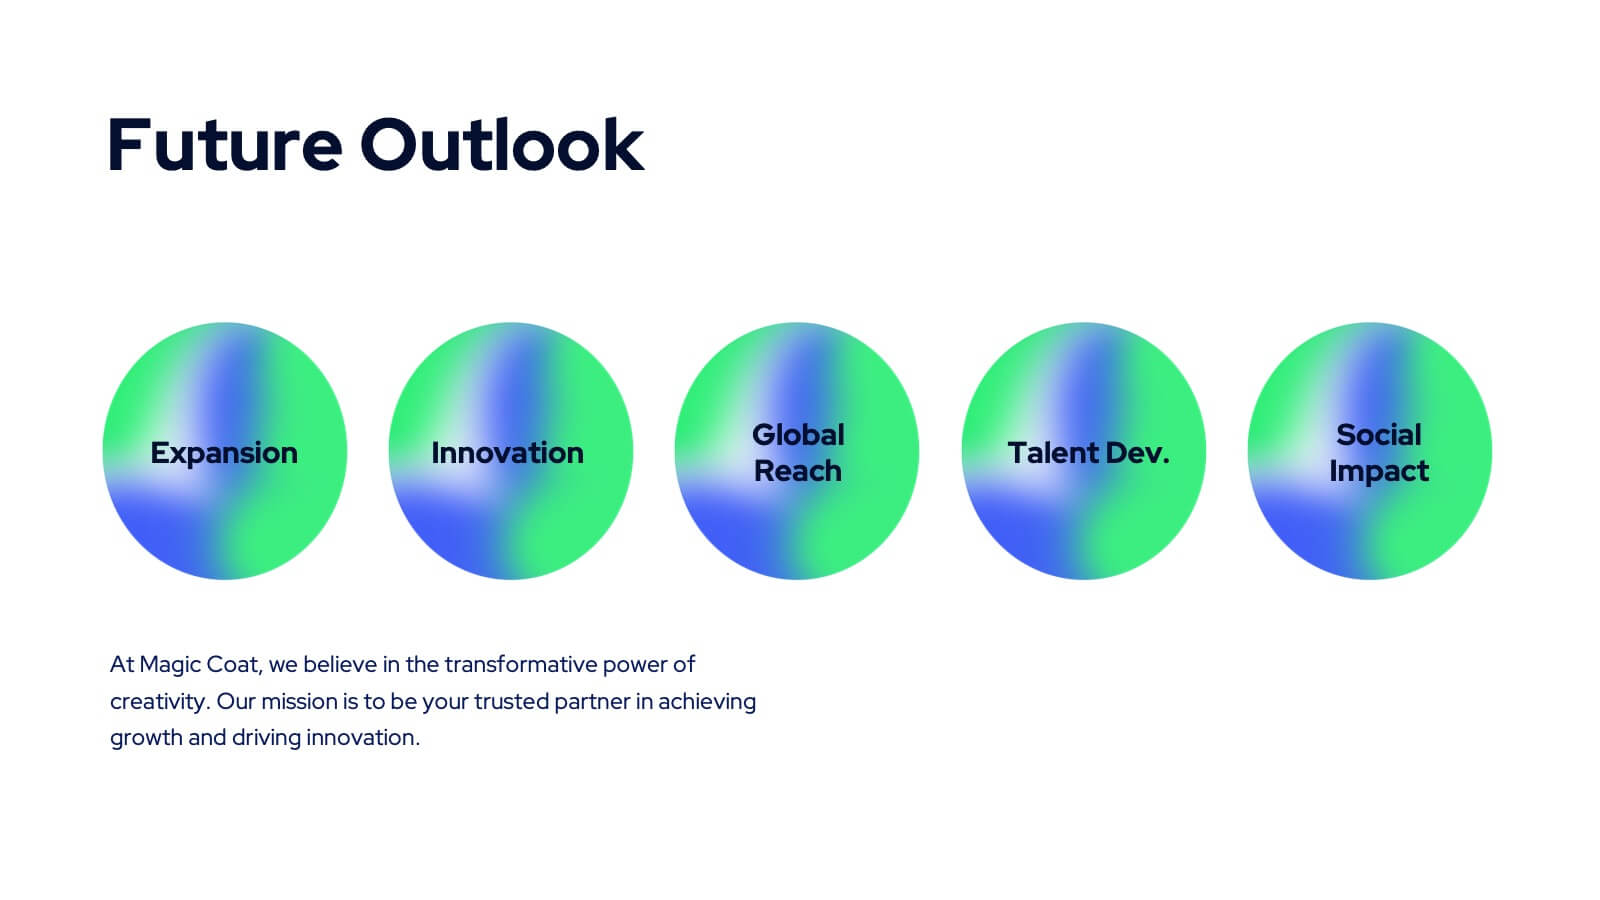
Strategic Planning with Concentric Circles
Draw your audience in with a visual that’s as focused as your message! This strategic concentric circles template helps you map out layered priorities, interconnected goals, or phased strategies in a clean, compelling way. Fully customizable and compatible with PowerPoint, Keynote, and Google Slides for seamless presentation design.
22 diapositivas
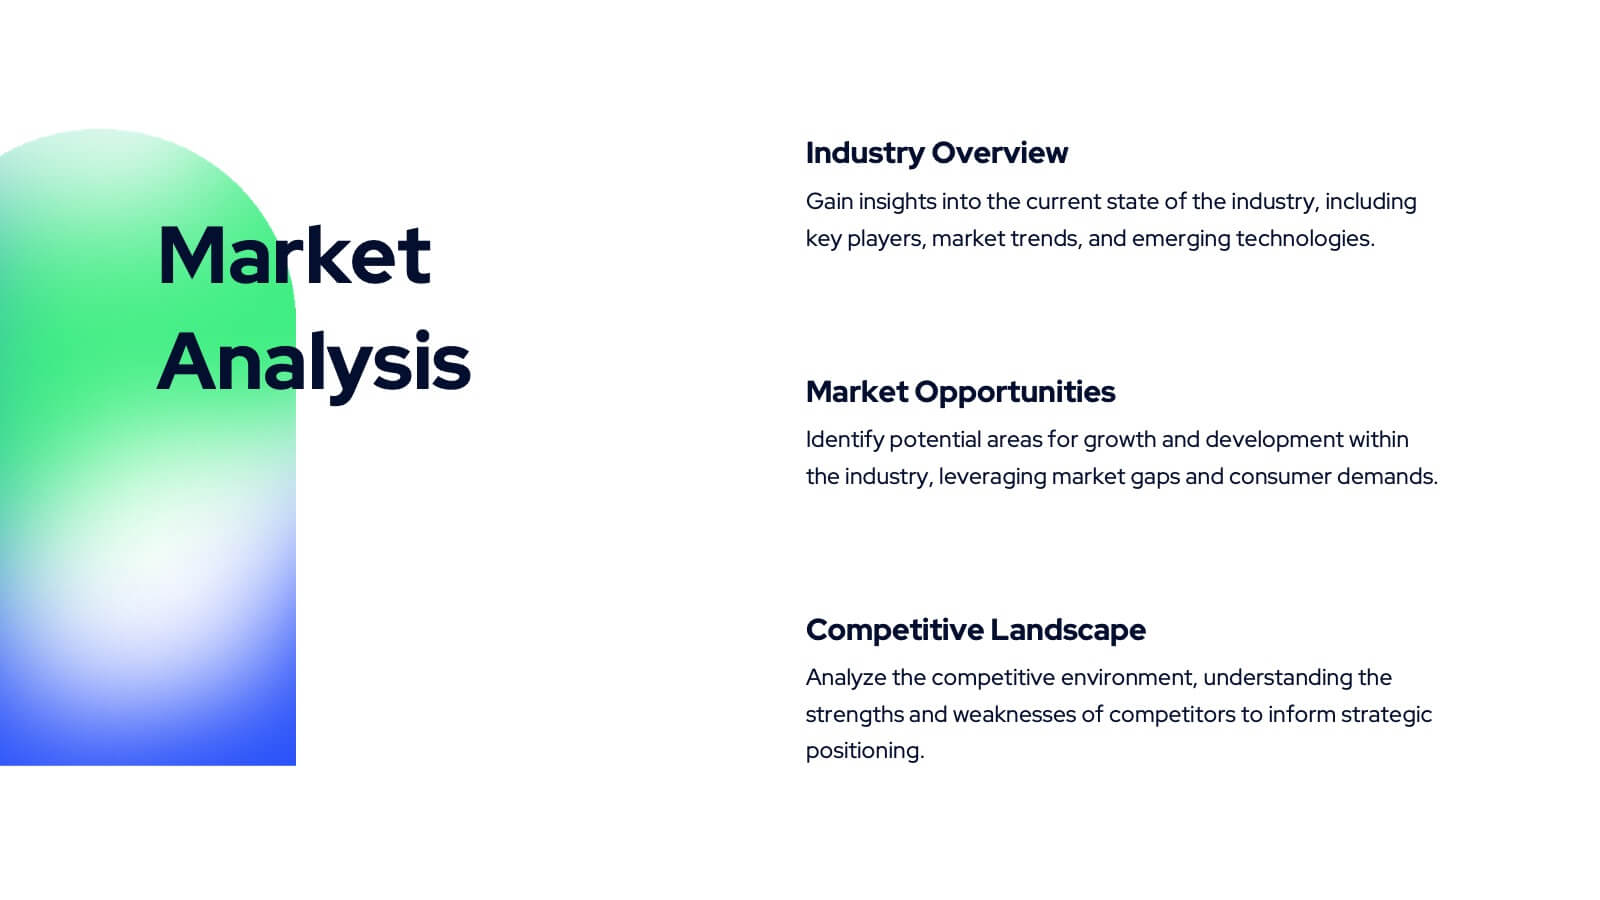
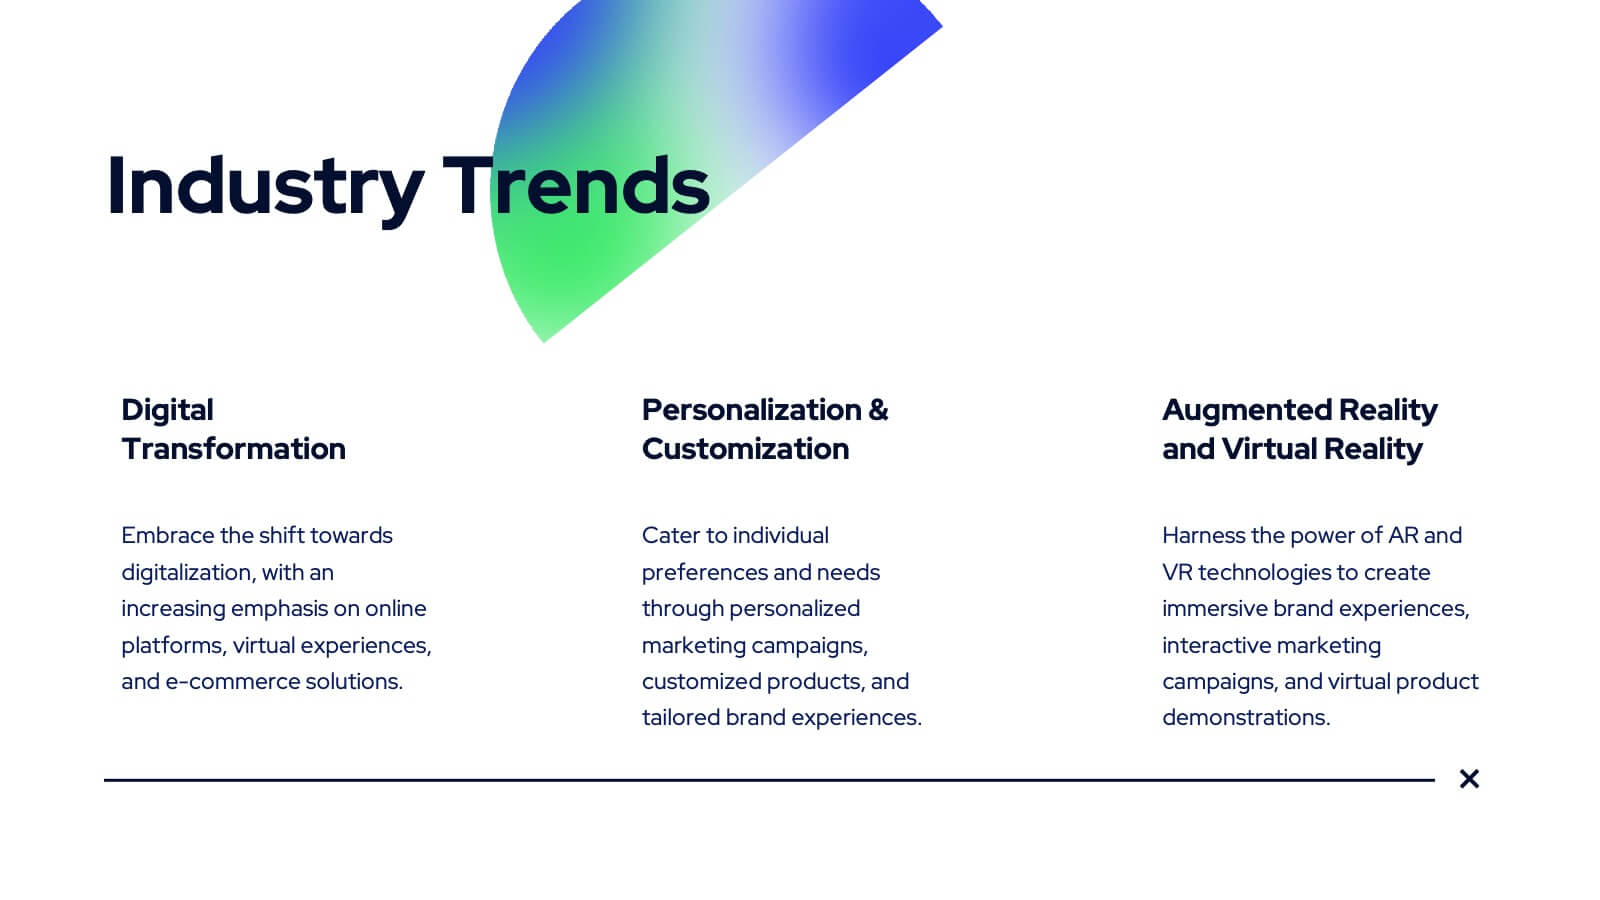
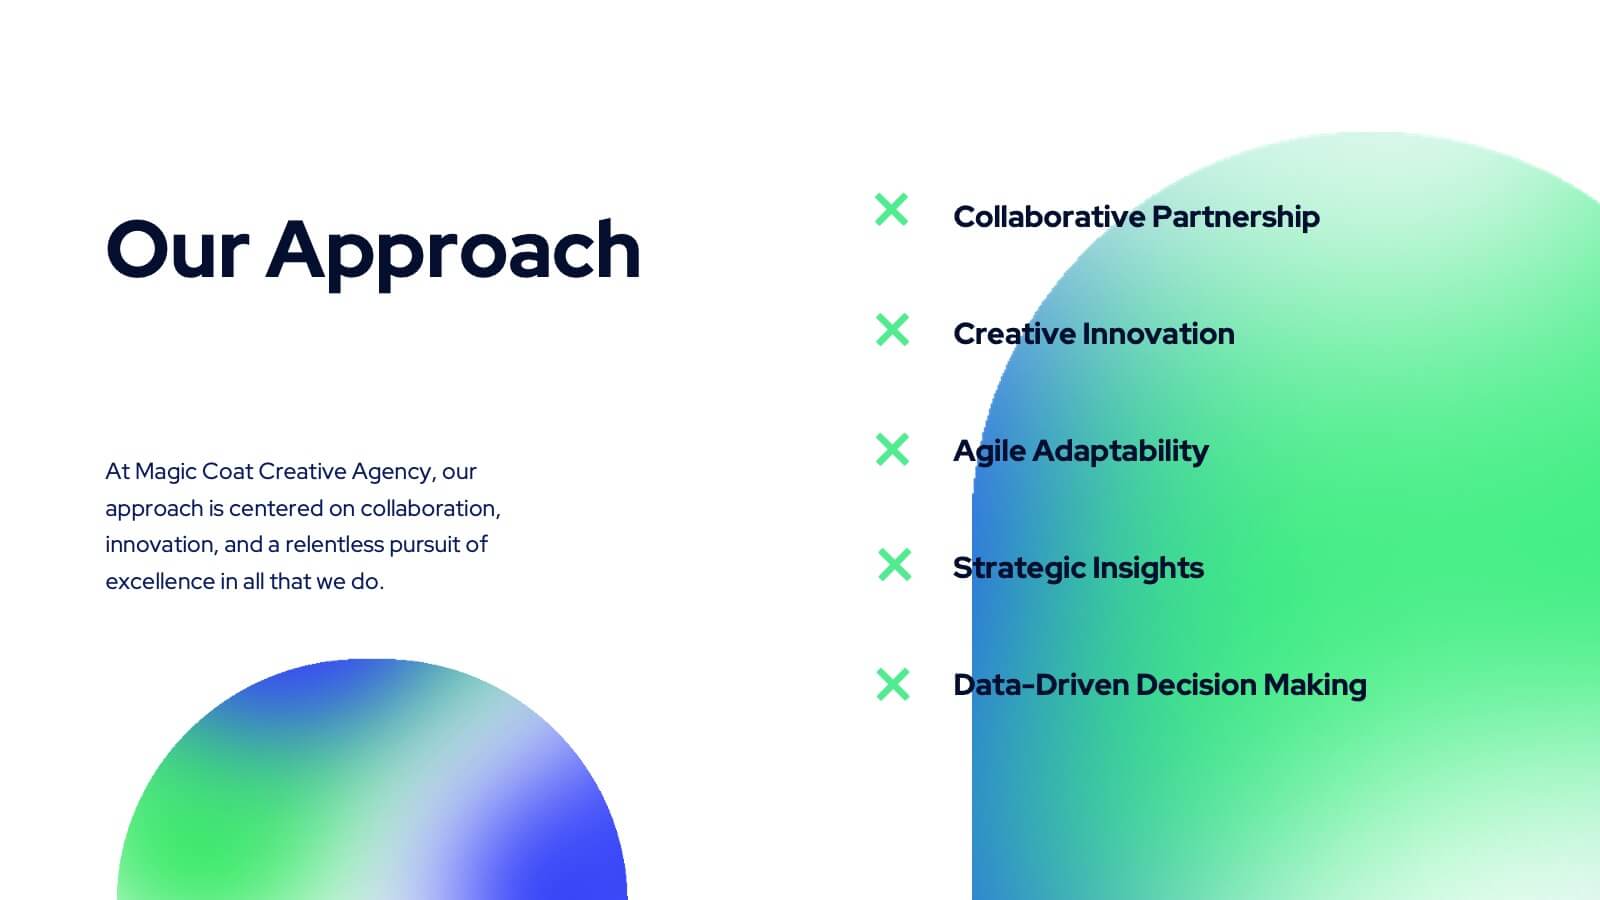
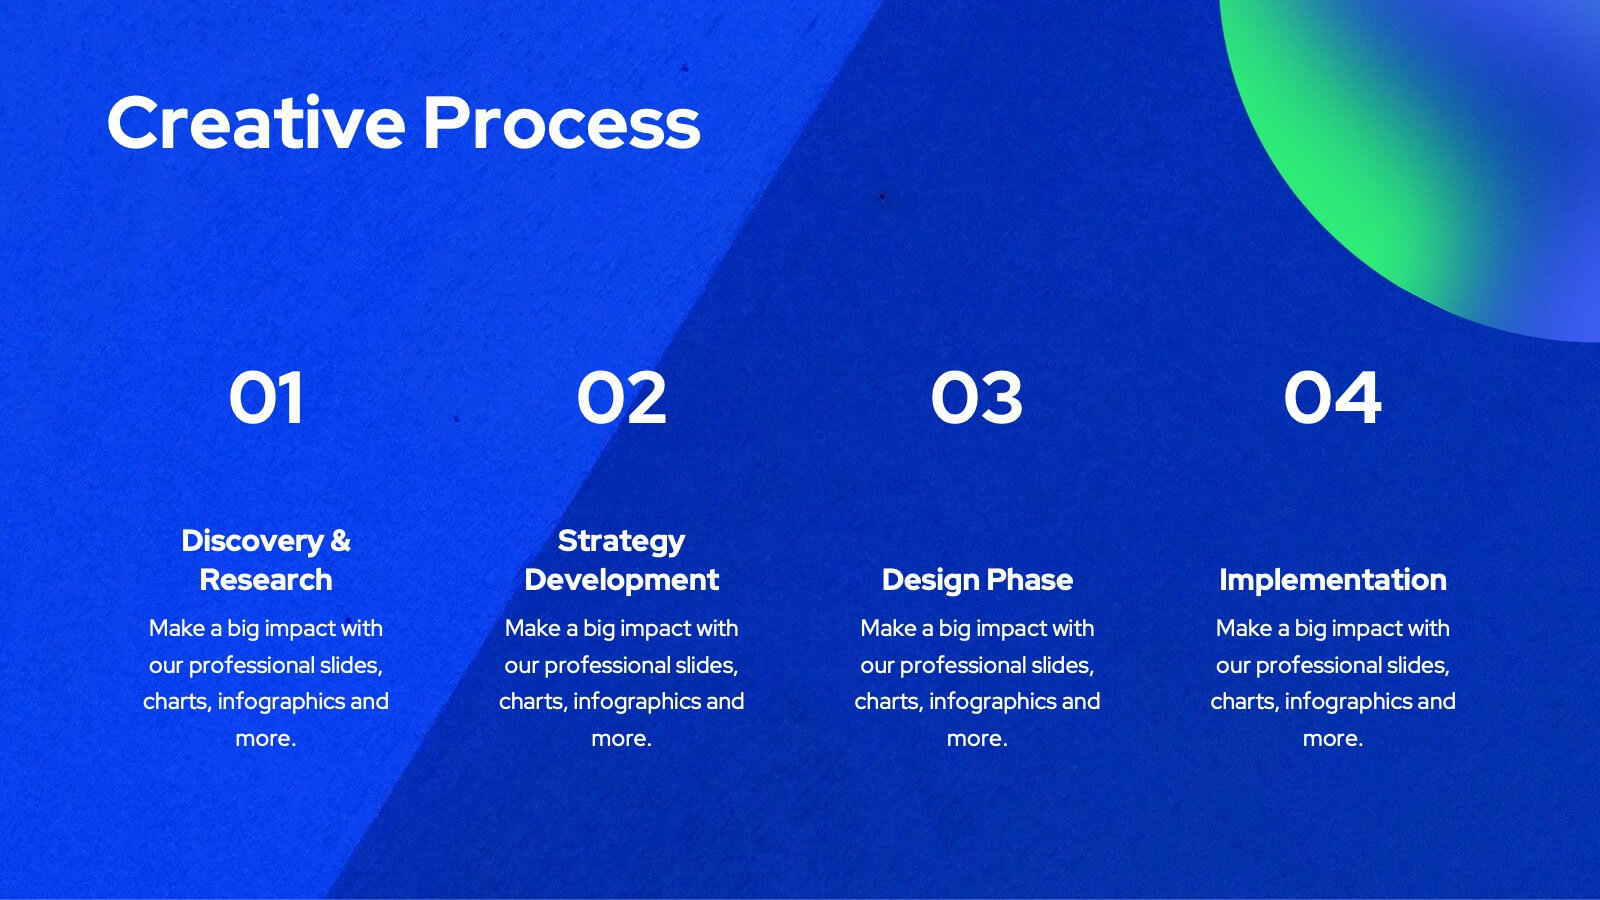
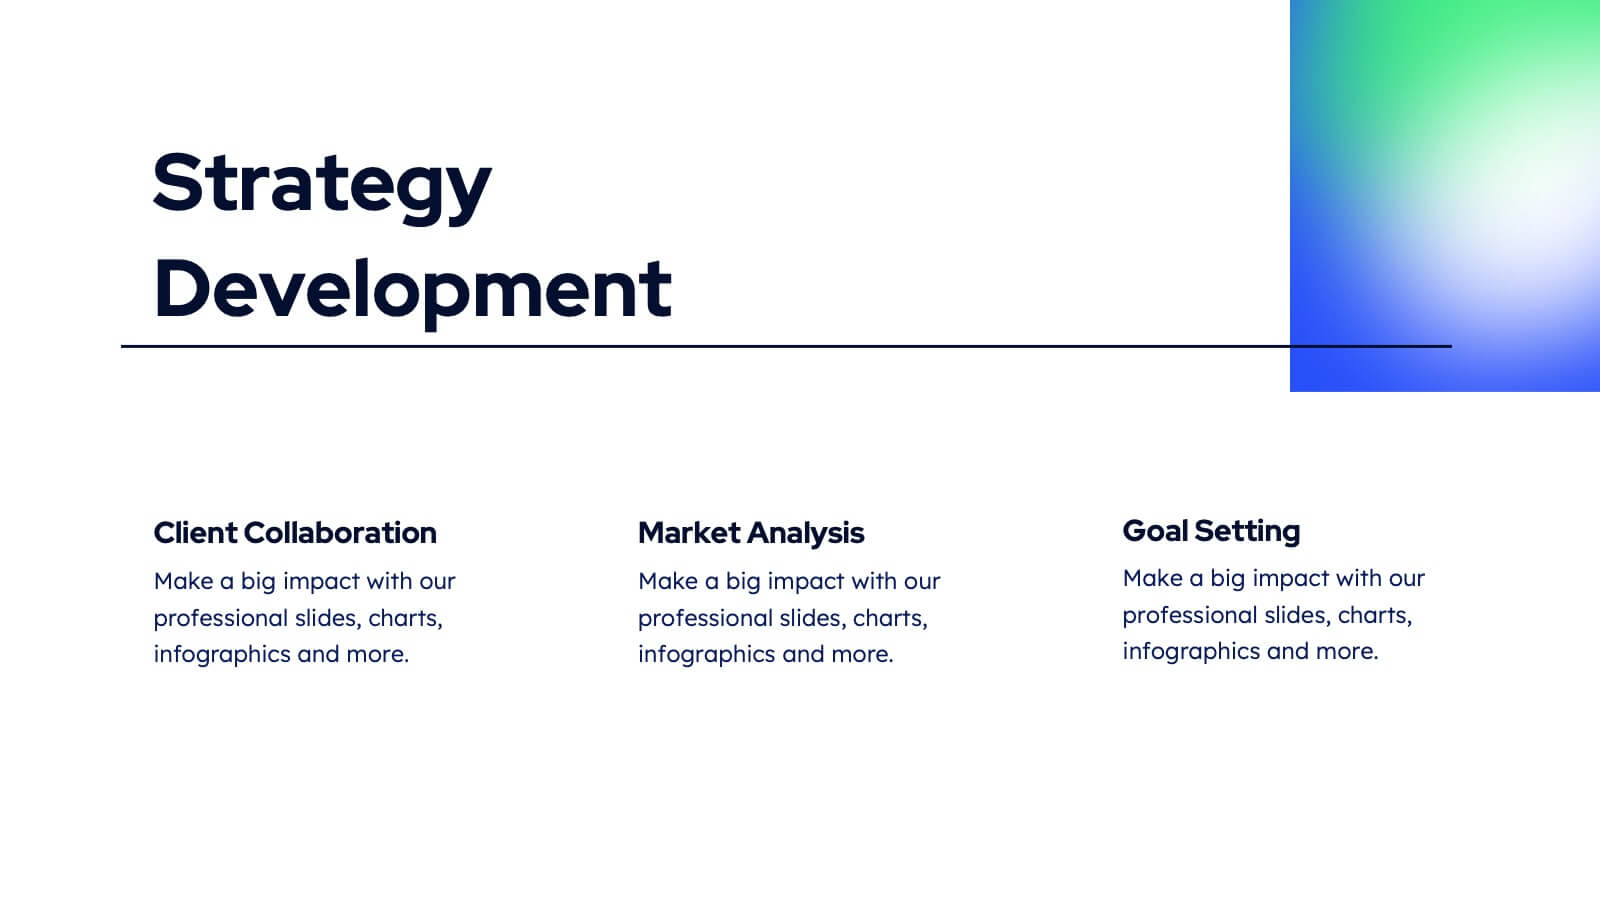
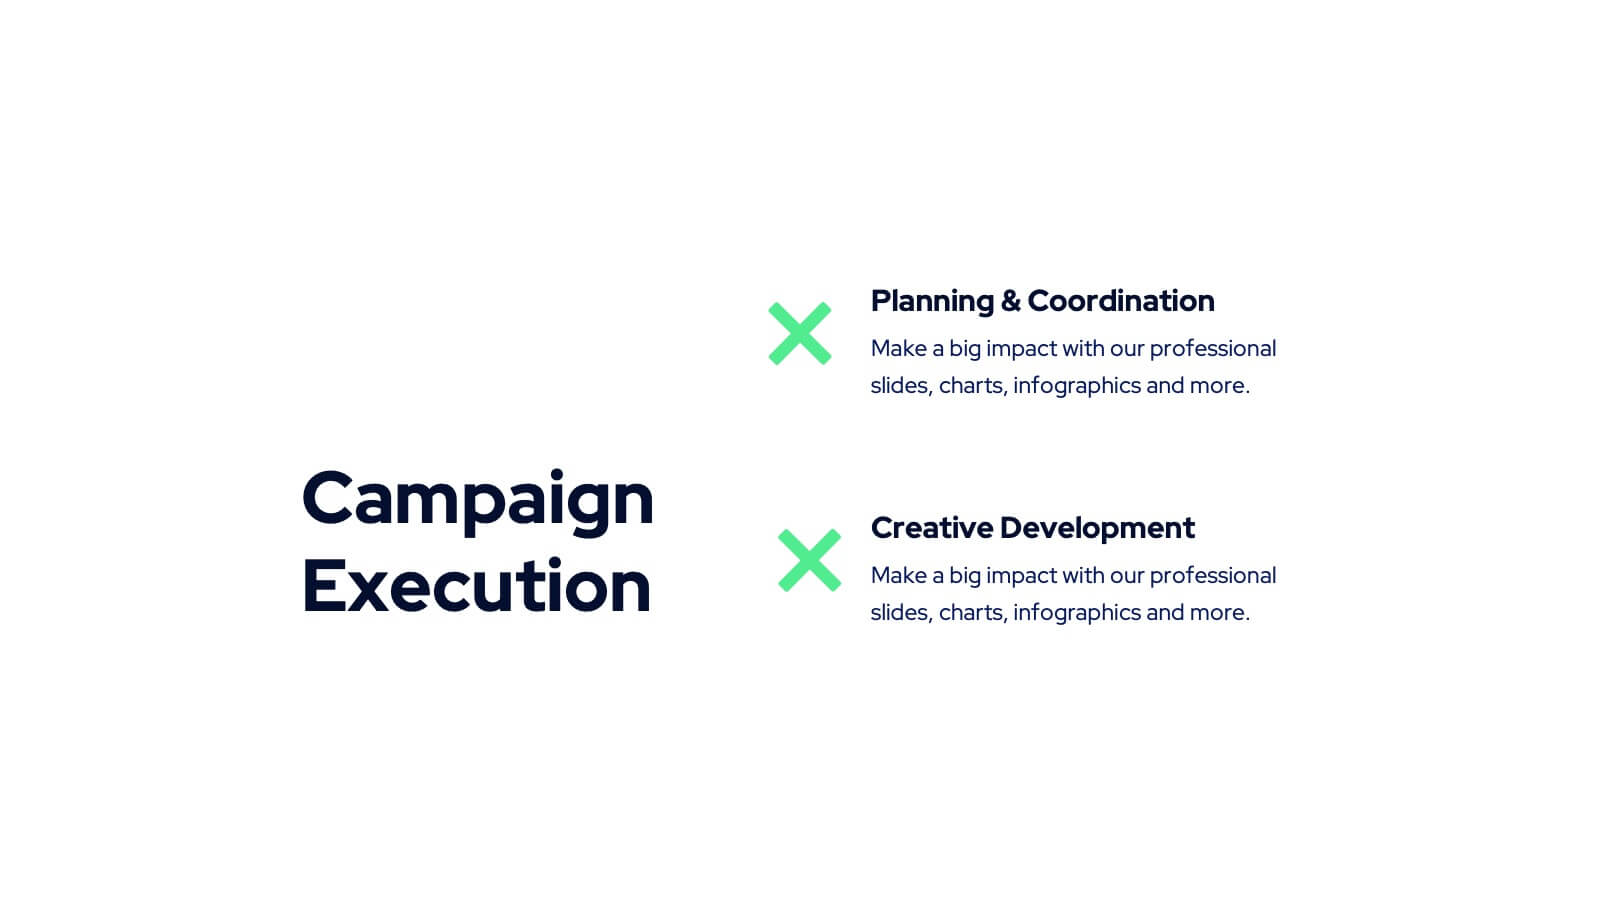
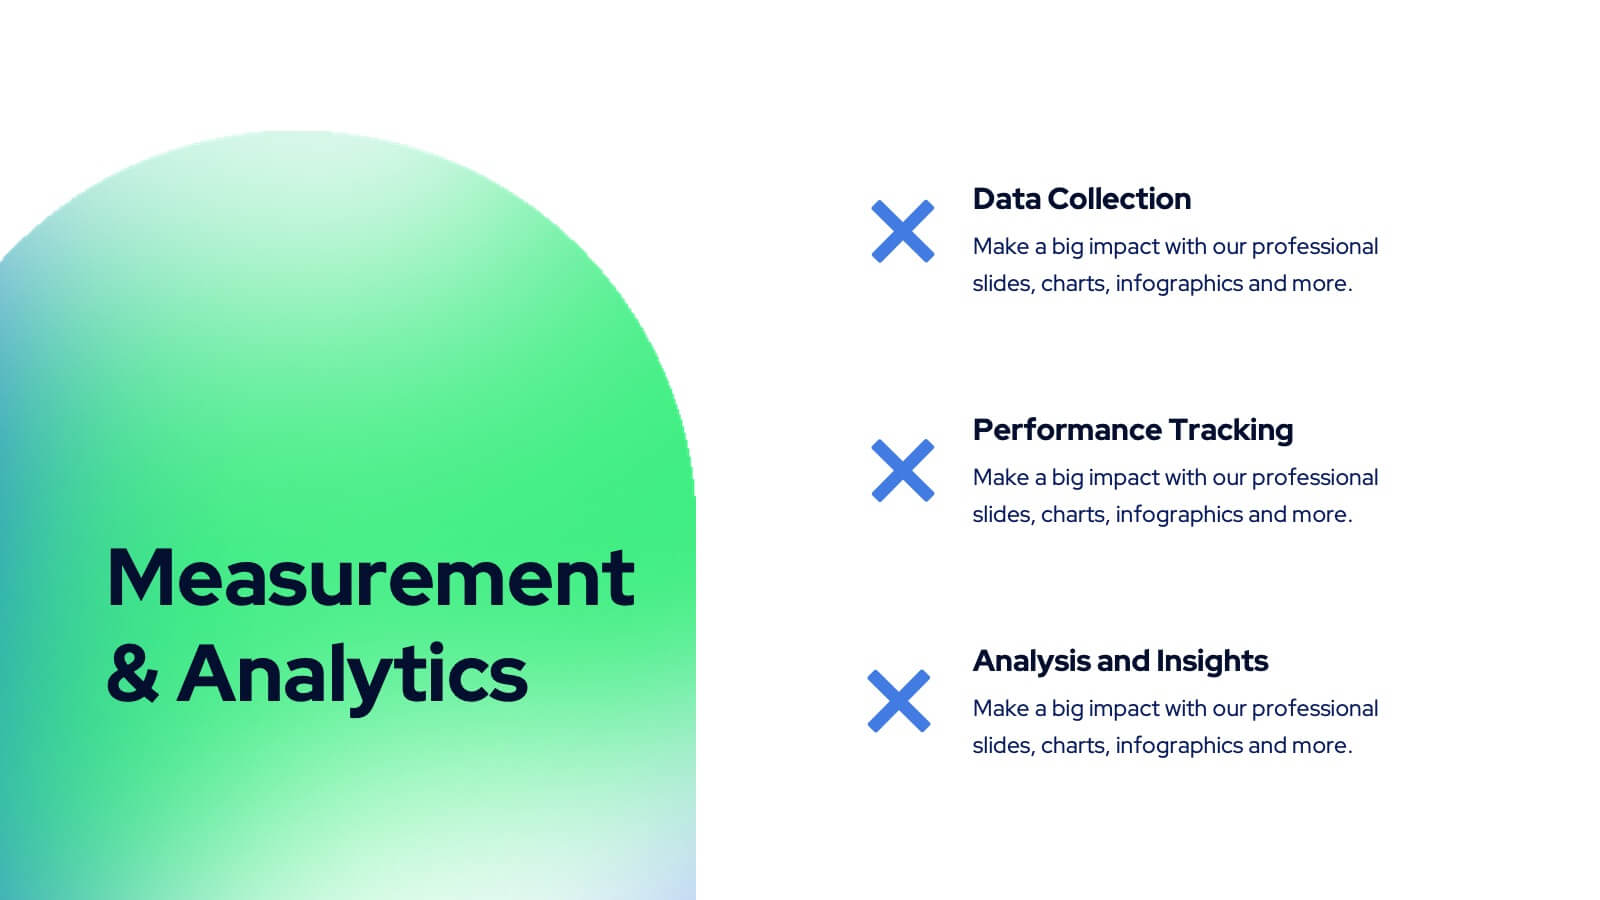
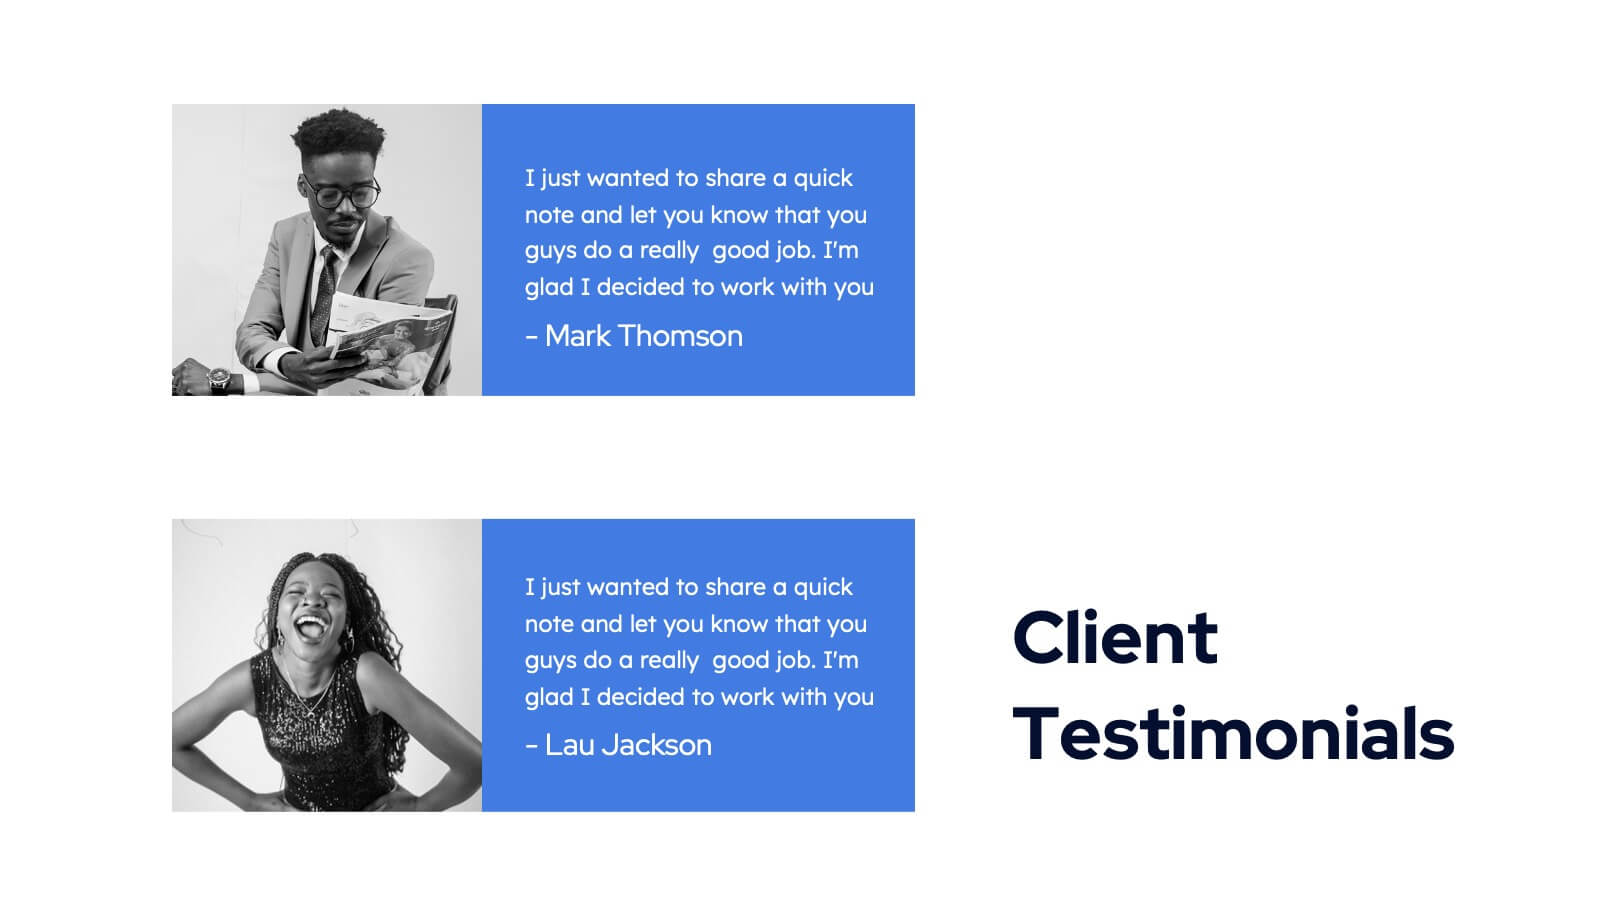
Tanzanite Full-Service Agency Project Plan Presentation
Showcase your agency's strengths with this bold and modern portfolio presentation template! From client success stories and case studies to market analysis and strategy development, this template highlights your expertise and approach. Perfect for agencies looking to present their services, creative processes, and partnerships. Compatible with PowerPoint, Keynote, and Google Slides, making it easy to impress any audience.


6 diapositivas
Concept Matching Puzzle Infographic
Visualize interconnected ideas with the Concept Matching Puzzle Infographic Presentation. Shaped like a head silhouette, this infographic uses five interlocking puzzle pieces to highlight the synergy of concepts—ideal for training, teamwork, decision-making, or idea development. Each segment is icon-tagged and paired with text for clarity. Fully editable in PowerPoint, Keynote, and Google Slides.


6 diapositivas
Project Timeline Calendar Presentation
Kick your planning into high gear with a clean, colorful layout that makes tracking progress feel effortless. This presentation helps you map tasks across the week, visualize timelines, and communicate project schedules with absolute clarity. It’s fully editable and works seamlessly in PowerPoint, Keynote, and Google Slides.


6 diapositivas
Risk Prevention and Security Measures Presentation
Enhance your safety strategy with this professional infographic slide. Designed to highlight five key risk and security areas, it features a clean, diamond layout with icon-based callouts. Ideal for business continuity plans, risk assessments, or compliance reports. Fully editable in PowerPoint, Keynote, and Google Slides.


3 diapositivas
Persona Mapping for Target Audience Presentation
Get clear on who you're speaking to with this visual persona mapping slide. Ideal for marketing plans, customer research, or segmentation strategies, this layout helps you define and compare target audience types with clean icons and text space. Fully editable and works with PowerPoint, Keynote, and Google Slides.


2 diapositivas
Professional Cover and Title Layout
Make a bold first impression with this stylish and modern cover slide template. Featuring a balanced design of imagery and typography, it's perfect for business reports, marketing decks, or strategic plans. Fully editable in PowerPoint, Keynote, and Google Slides for effortless customization.


7 diapositivas
RAPID Profit Matrix Infographic
Delve into the systematic world of decision-making with our RAPID Matrix infographic. Cloaked in the trustworthiness of blue tones and complemented by the proactive energy of green, our template elucidates the RAPID framework—Recommend, Agree, Perform, Input, Decide—in an engaging and comprehensible manner. Adorned with exact infographics, distinct icons, and tailored image placeholders, it demystifies roles and responsibilities within decision-making processes. Perfectly calibrated for Powerpoint, Keynote, or Google Slides. An invaluable tool for project managers, business leaders, or any team seeking clarity in its decision-making process. Engage, clarify, and execute with precision.


6 diapositivas
Empathy to Prototype Framework Presentation
Transform ideas into real-world solutions with a clear, step-by-step framework that connects creativity with action. This presentation helps you visualize each stage of innovation—from understanding users to testing prototypes—in a professional, engaging way. Fully compatible with PowerPoint, Keynote, and Google Slides for effortless customization and presentation.