


Características


¿Tienes alguna pregunta?
Recomendar


5 diapositivas
Value Chain Business Model Presentation
Spark fresh insight into how your organization creates value with this clean, arrow-based layout that makes every step feel intuitive and action-ready. This presentation breaks down key activities, support processes, and improvement opportunities in a clear visual flow perfect for strategy discussions. Fully compatible with PowerPoint, Keynote, and Google Slides.


7 diapositivas
Statistics Infographics Presentation Template
A statistical infographic is a visualization of your data that helps people understand and analyze it. They can be used to tell stories, support arguments and make a persuasive case. Statistical infographics are a quick and easy way to convey complex data in an informative and visually engaging way. Use this template to create a statistical infographic that is accurate and easy to read. This template includes pie charts, bar graphs, and other visual representations you can use to present your data. Statistics are very useful and important in every field, from business to education.


7 diapositivas
Financial Forecasting with Statistics Presentation
Unlock your financial future with the "Financial Forecasting with Statistics" presentation templates. These slides are designed to clearly present growth forecasts, trends, and statistics, empowering you to make informed decisions. Ideal for financial analysts and corporate strategists, these templates are fully compatible with PowerPoint, Keynote, and Google Slides.


7 diapositivas
Sustainability Management Infographics Presentation Template
Sustainability management is a management discipline that enables organizations to understand and integrate the environmental, social and economic aspects of sustainability in all their activities. A community will be more likely to reduce energy, water and waste if they have the management available to set goals for their business. This template is perfect if you are looking for sustainability and elements needed to meet your goals. This template is designed to support an organization's efforts to improve its performance, packed with illustrations you can customize and add your own tips too.


8 diapositivas
Investment and Risk Business Case Presentation
Assess investment risks with confidence using this dynamic business case template. Designed for clear visualization, it categorizes risk levels from high to low, helping professionals analyze financial decisions effectively. Perfect for finance, business strategy, and market evaluation, this template is fully compatible with PowerPoint, Keynote, and Google Slides.


6 diapositivas
Annual Scheduling with Calendar Milestones Presentation
Make your year feel like a well-oiled machine with this bold, color-coded visual layout. It helps you map out project phases, monthly milestones, and long-term plans with clarity and structure. Ideal for strategy meetings or annual reviews, this editable template works seamlessly in PowerPoint, Keynote, and Google Slides.


5 diapositivas
Creative Geometric Layouts Presentation
Give your content a fresh, modern spark with bold geometric elements that guide attention and create a clean visual rhythm. This presentation helps you structure ideas clearly, highlight key sections, and maintain a polished, creative look throughout your slides. Fully editable and compatible with PowerPoint, Keynote, and Google Slides.


2 diapositivas
Professional Cover and Title Layout
Make a bold first impression with this stylish and modern cover slide template. Featuring a balanced design of imagery and typography, it's perfect for business reports, marketing decks, or strategic plans. Fully editable in PowerPoint, Keynote, and Google Slides for effortless customization.


6 diapositivas
Break Even Options Infographic
Break-even analysis is a financial calculation that helps businesses determine the point at which their total revenue equals their total costs, resulting in neither a profit nor a loss. This infographic template provides a clear visual representation of the concept of breakeven in options trading, helping traders understand the point at which profits and losses balance out. This template is a valuable tool for businesses to assess the level of sales needed to cover their costs and begin making a profit. Use this template to provide your viewers insights and help make informed decisions to optimize operations.


6 diapositivas
Corporation Schedule Infographics
Elevate your corporate presentations with our Corporation Schedule infographic, expertly designed for compatibility with Powerpoint, Keynote, and Google Slides. This practical and polished infographic is an exceptional resource for managers, team leads, and event coordinators planning and presenting schedules, timelines, and agendas. The infographic is structured to visually organize and communicate a corporation's schedule, making it an invaluable tool for outlining project timelines, meeting agendas, or corporate event itineraries. Its clear, concise format is specifically tailored to the business environment, where readability and quick comprehension are paramount. Integrating this infographic into your presentation will not only enhance its professional appearance but also facilitate effective time management and ensure alignment across teams. Whether you’re detailing a week-long conference schedule or outlining a project’s phases, this infographic provides a streamlined approach to sharing that information with your audience. It’s a strategic way to keep everyone informed and focused on the company's key timeframes and objectives.


5 diapositivas
AIDA Digital Marketing Infographics
Immerse yourself in the dynamic world of digital marketing with our AIDA digital marketing infographics. This template, drenched in striking cream, red, and blue hues, adopts a vertical design, perfect for professionals, marketers, and educators looking to elucidate the renowned AIDA model (Attention, Interest, Desire, Action). Each section is enriched with creative graphics, icons, and image placeholders, simplifying complex marketing strategies into digestible visual narratives. It's the quintessential tool for captivating presentations, compelling marketing pitches, or educational materials in digital marketing workshops.


6 diapositivas
Strategic Business Planning Presentation
Bring your ideas to life with a slide design that makes strategic planning feel bold, focused, and easy to follow. This presentation walks through key business objectives, priorities, and action steps using clean visuals and intuitive layouts. Perfect for teams presenting strategy, goals, and long-term planning. Fully compatible with PowerPoint, Keynote, and Google Slides.


4 diapositivas
Introductory Message with Mission and Vision Presentation
Present your company’s mission and vision with clarity and impact. This professional slide layout includes space for a personalized message and two key highlights. Ideal for strategy decks, company overviews, or leadership presentations—fully editable in Canva, PowerPoint, or Google Slides to match your branding and communication goals.


23 diapositivas
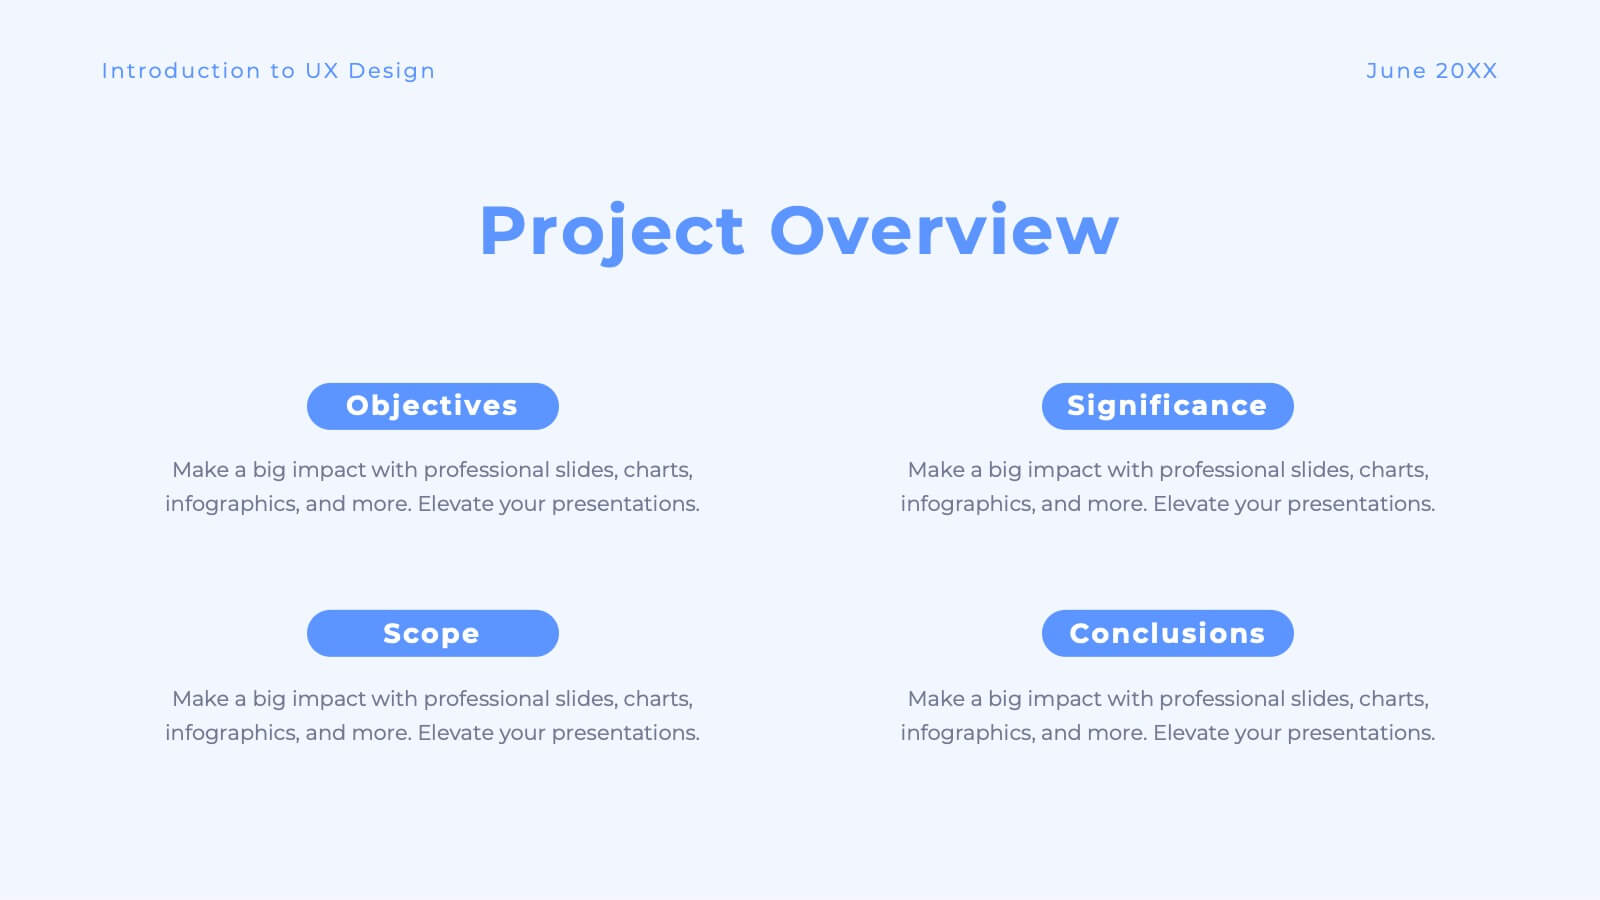
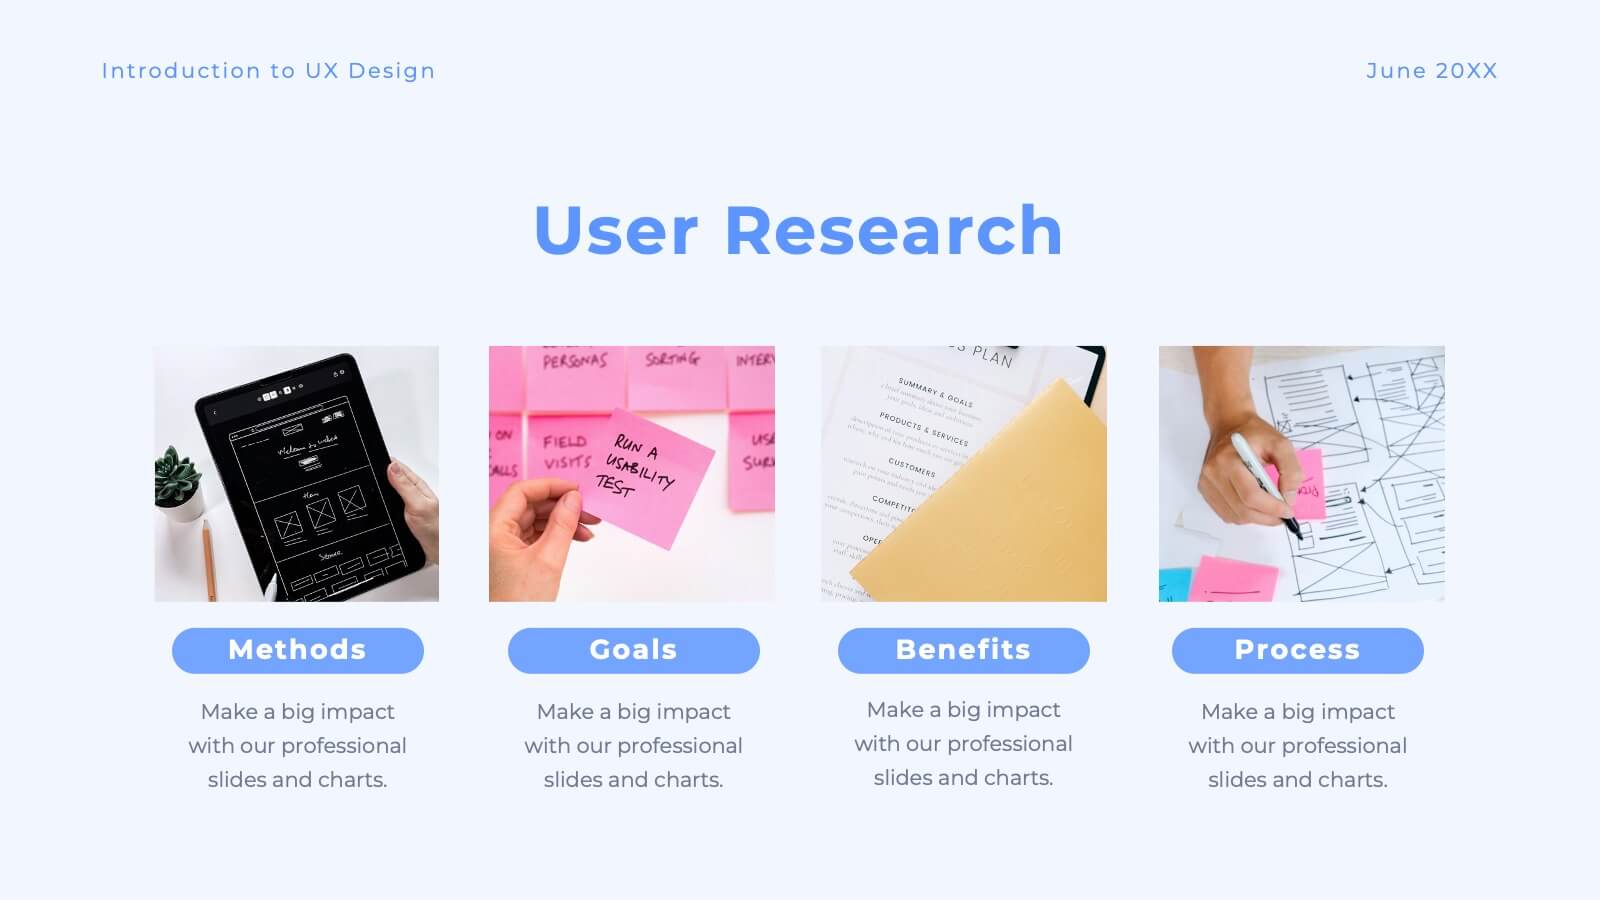
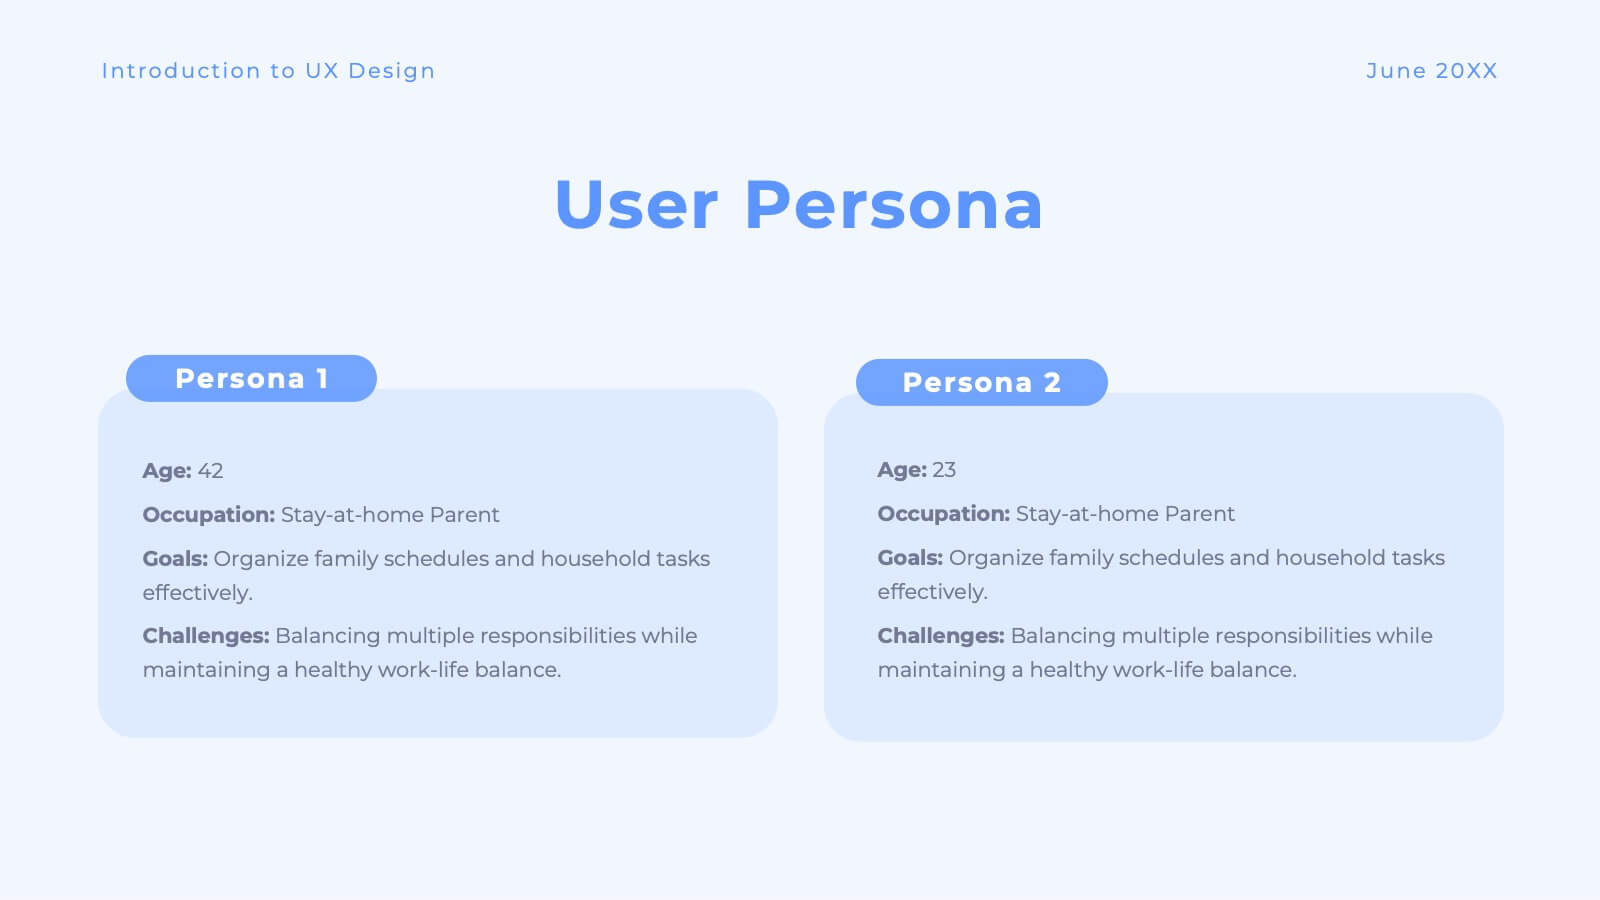
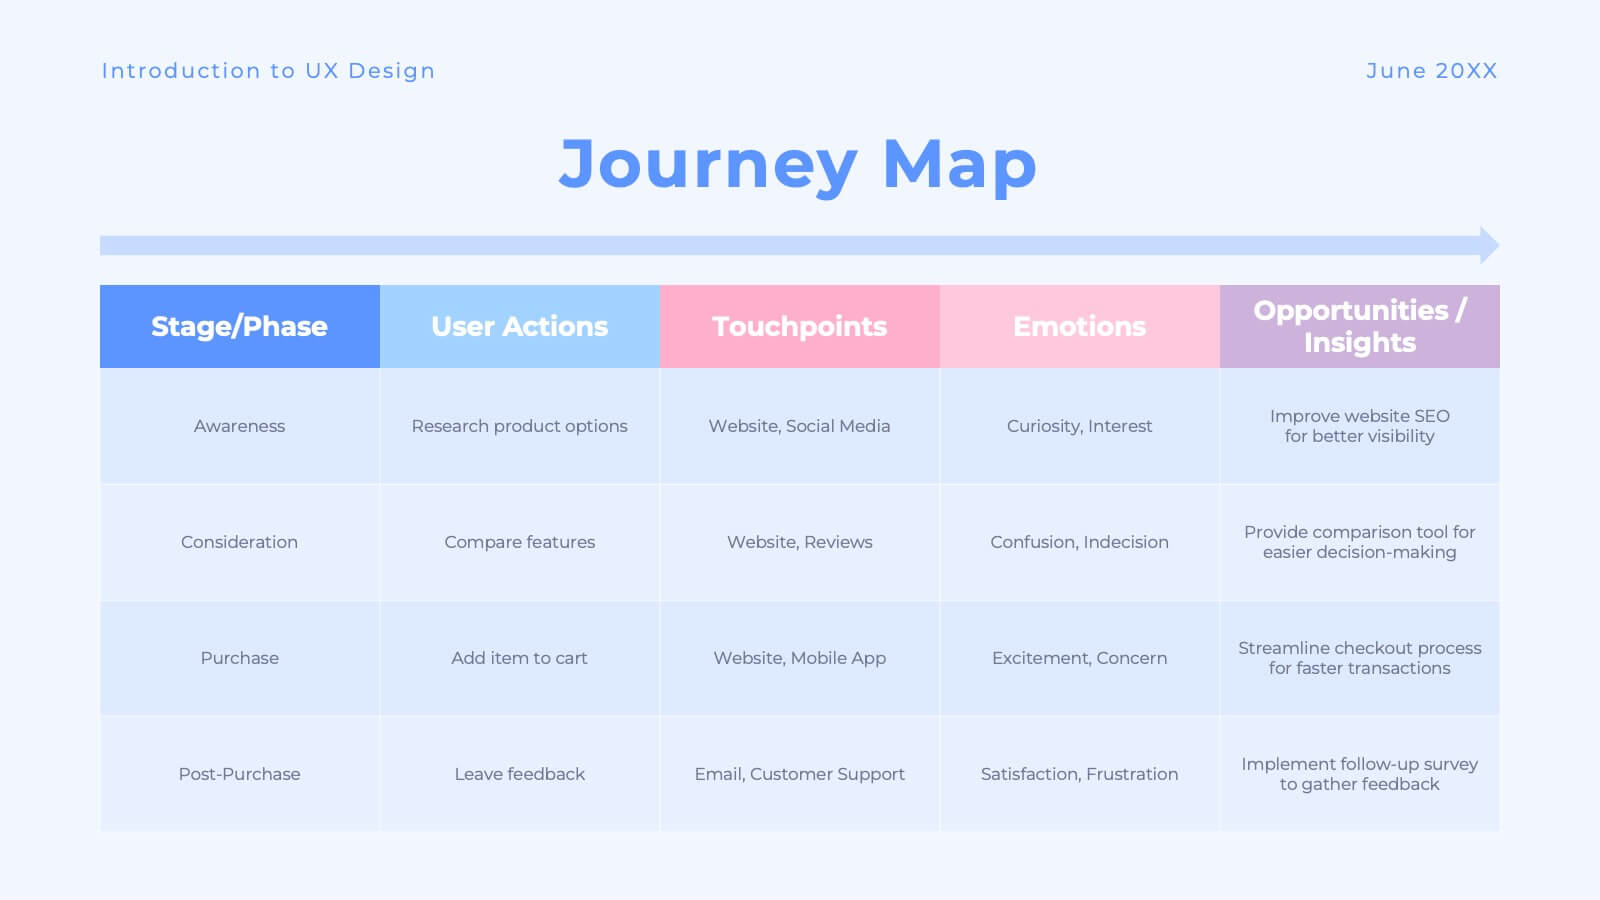
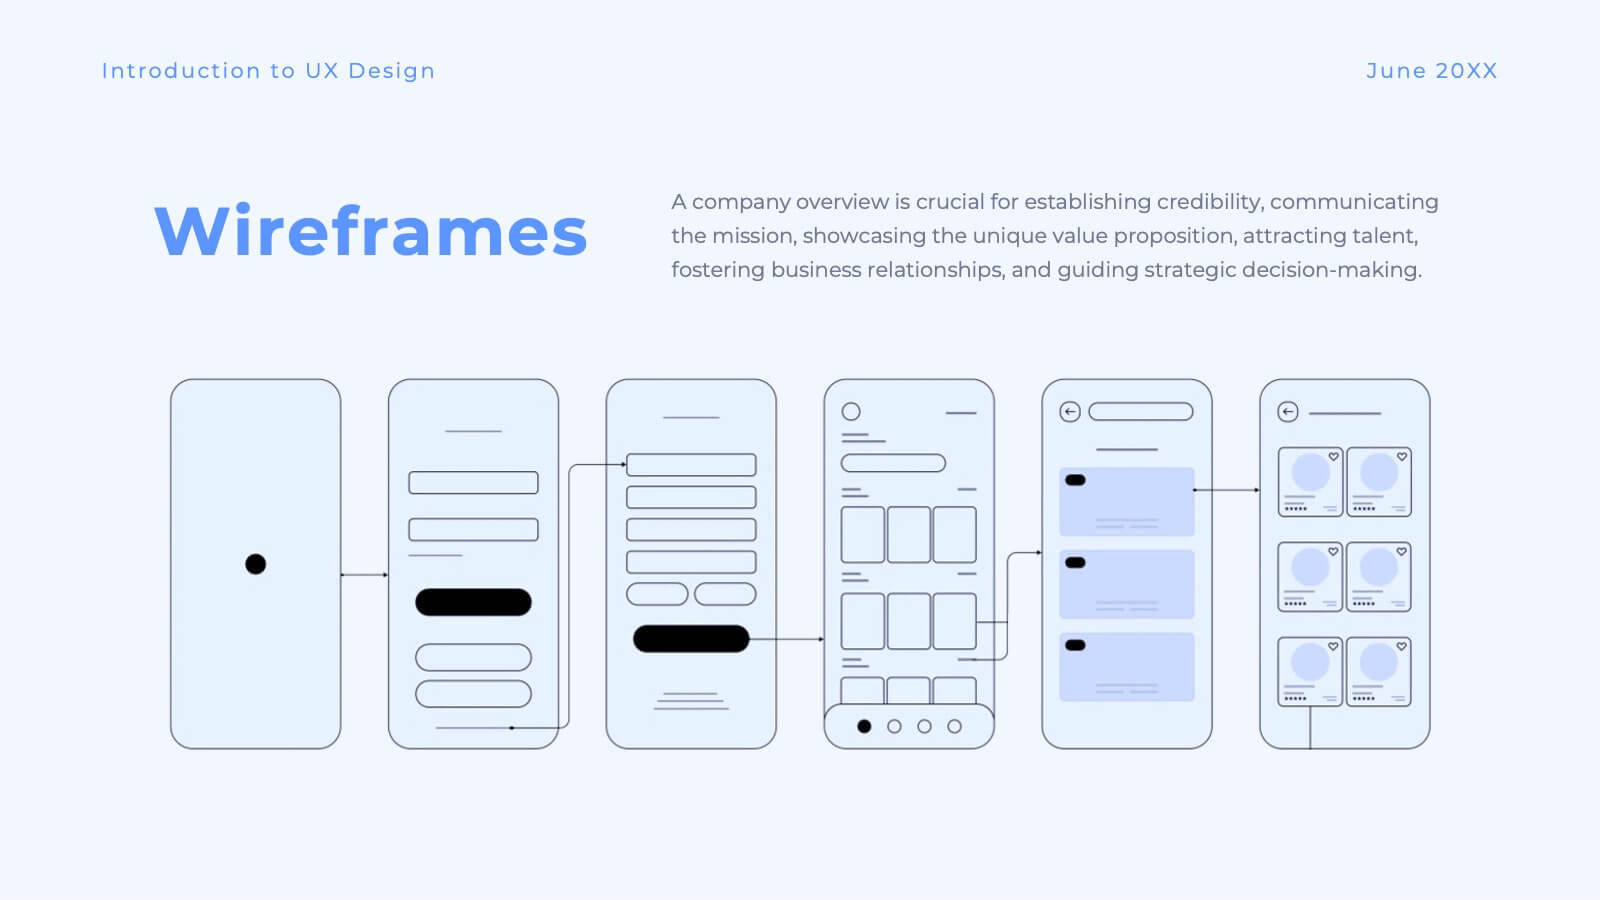
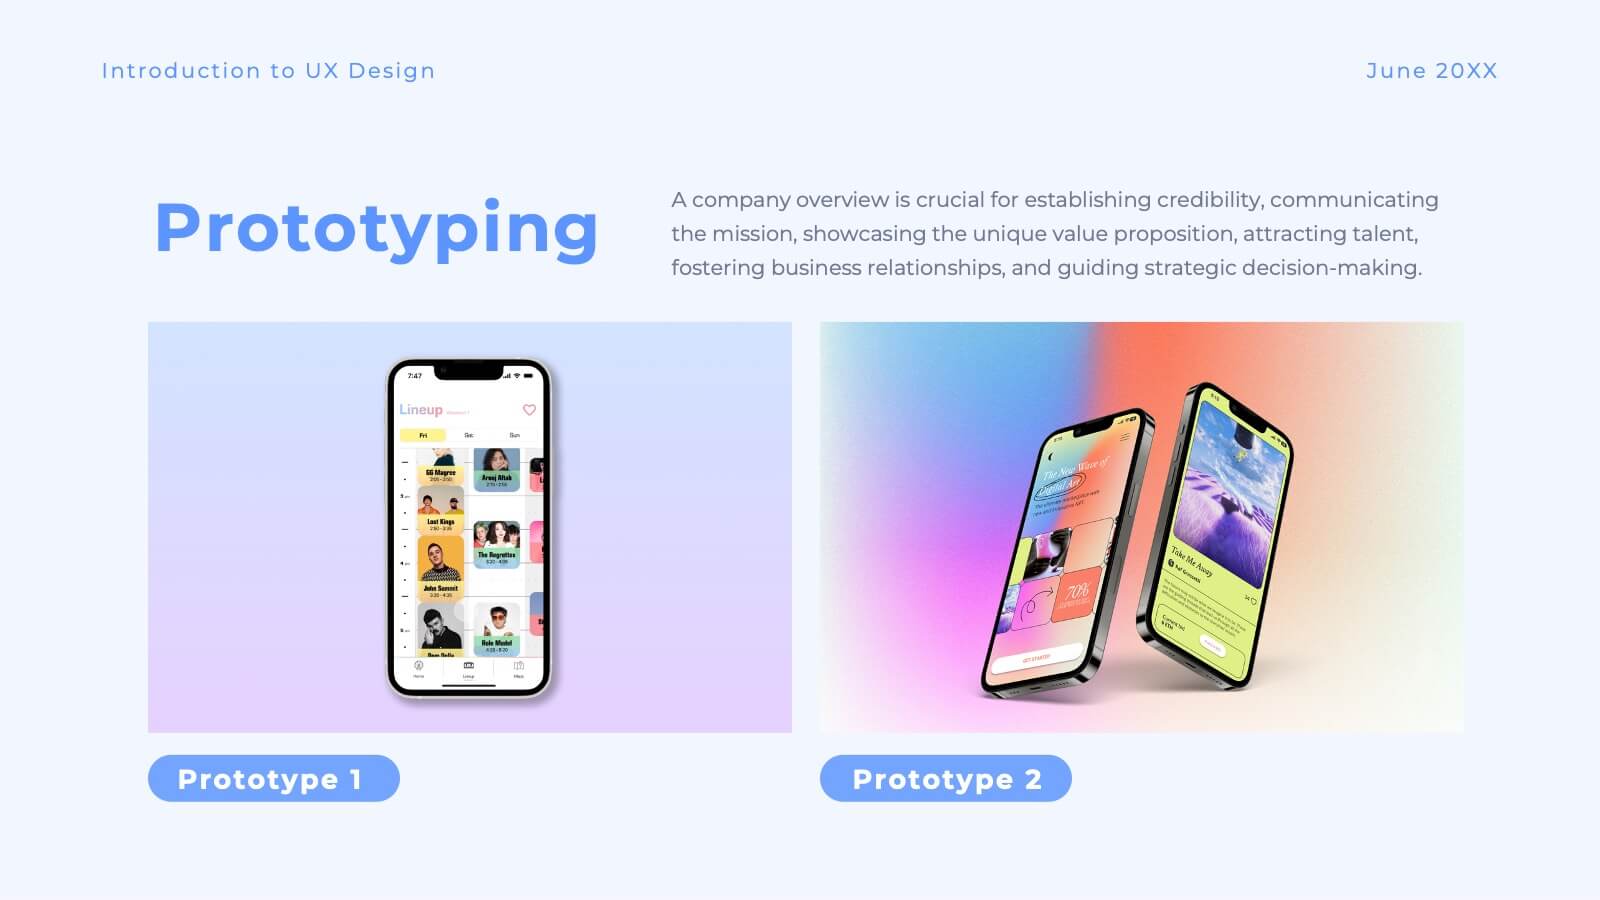
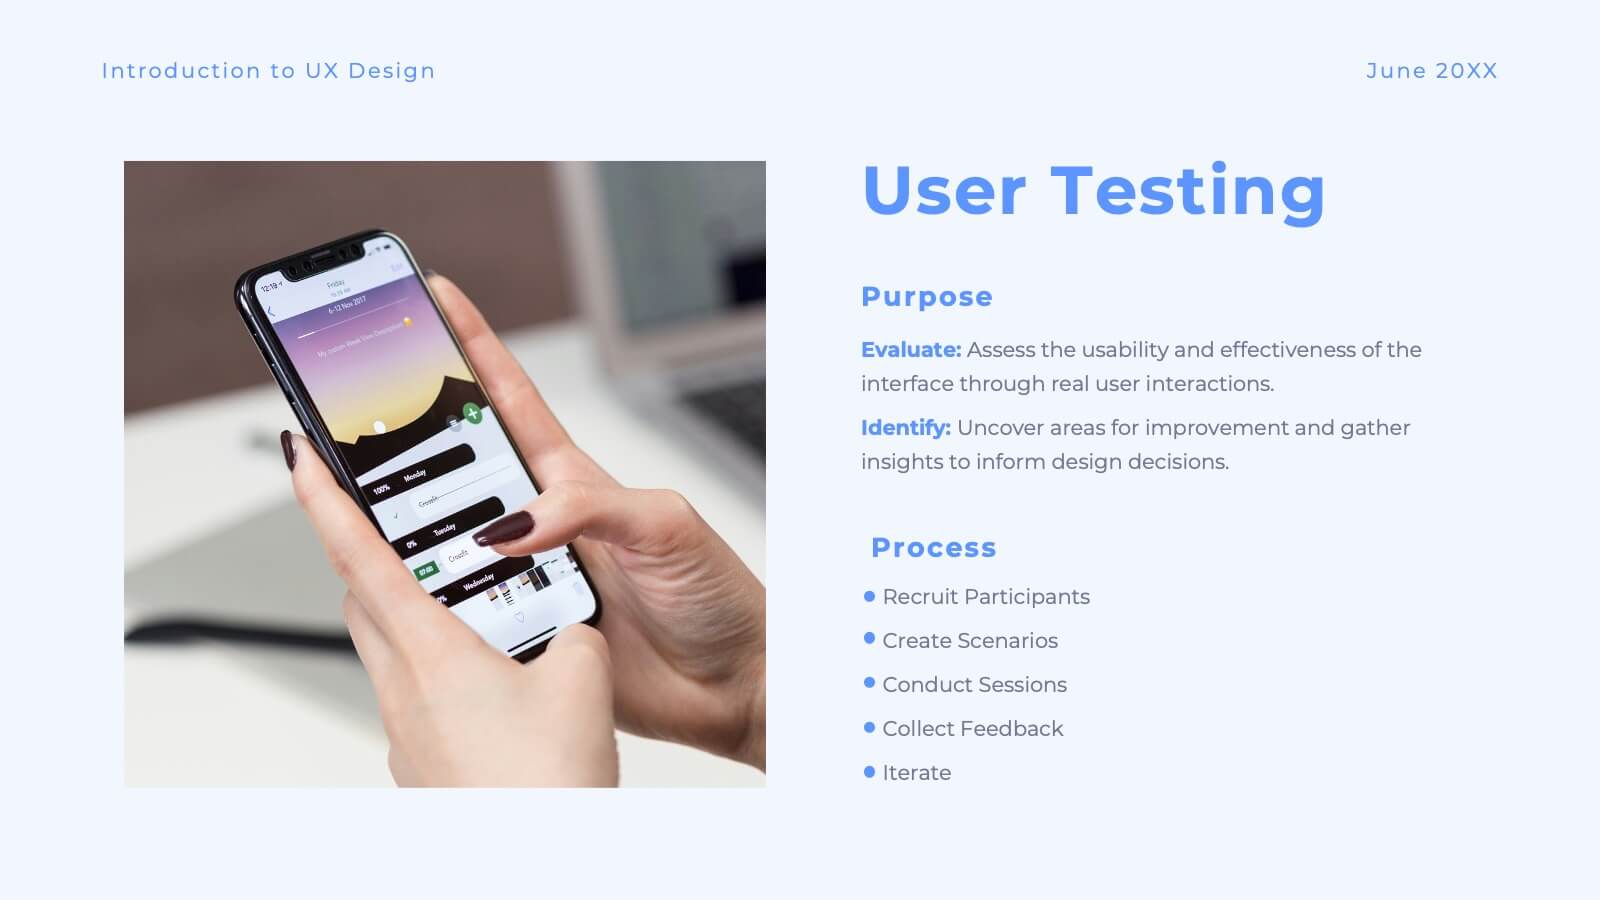
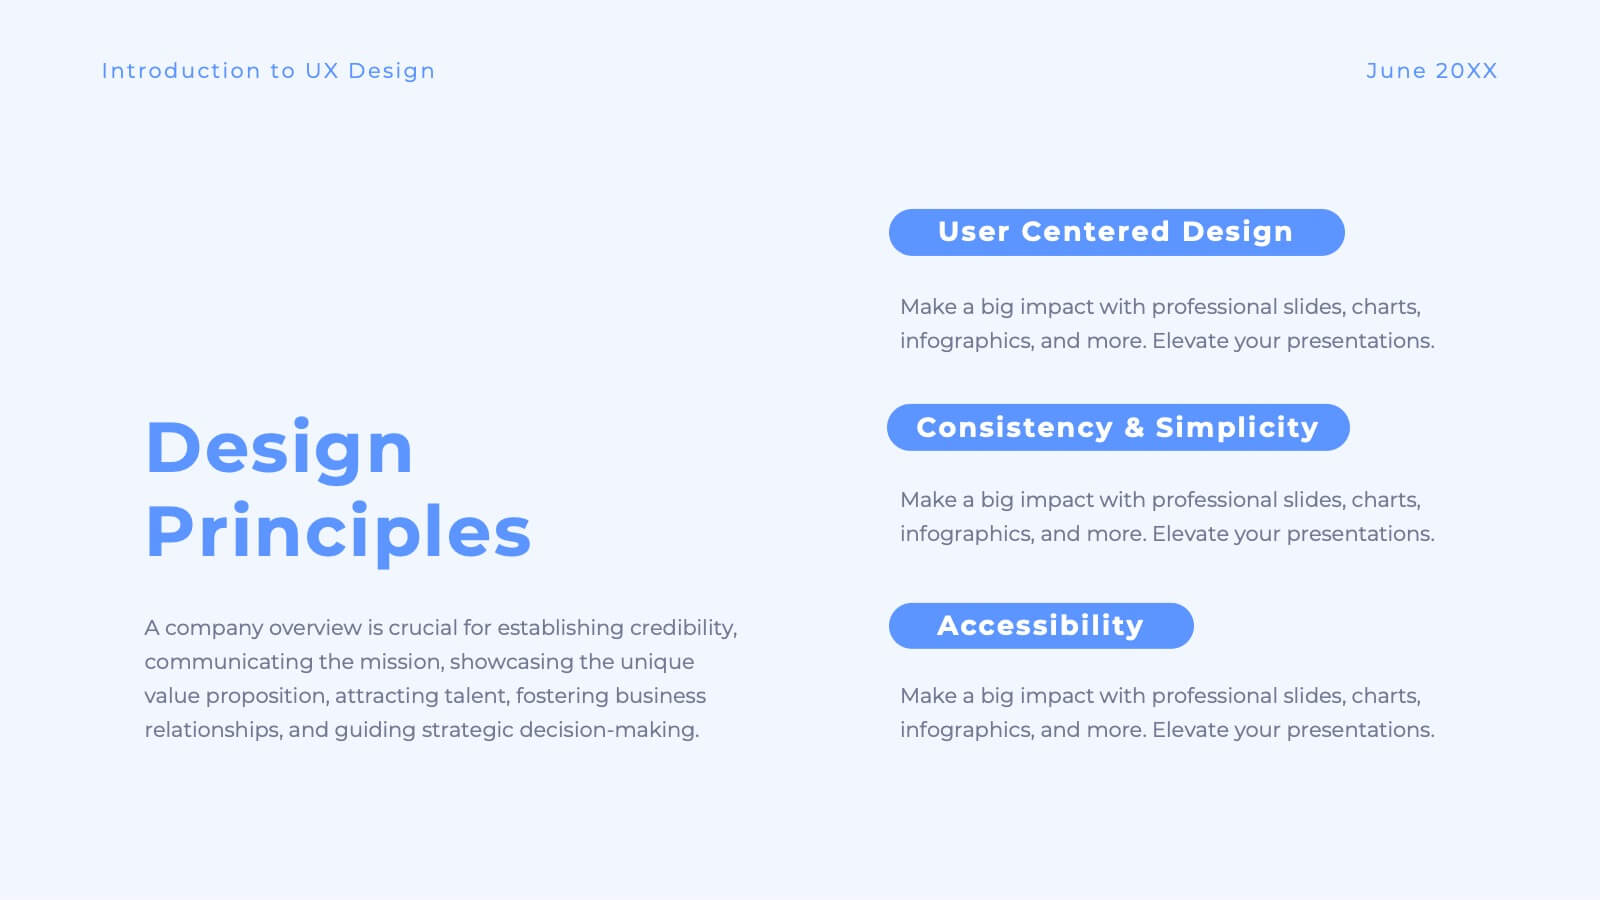
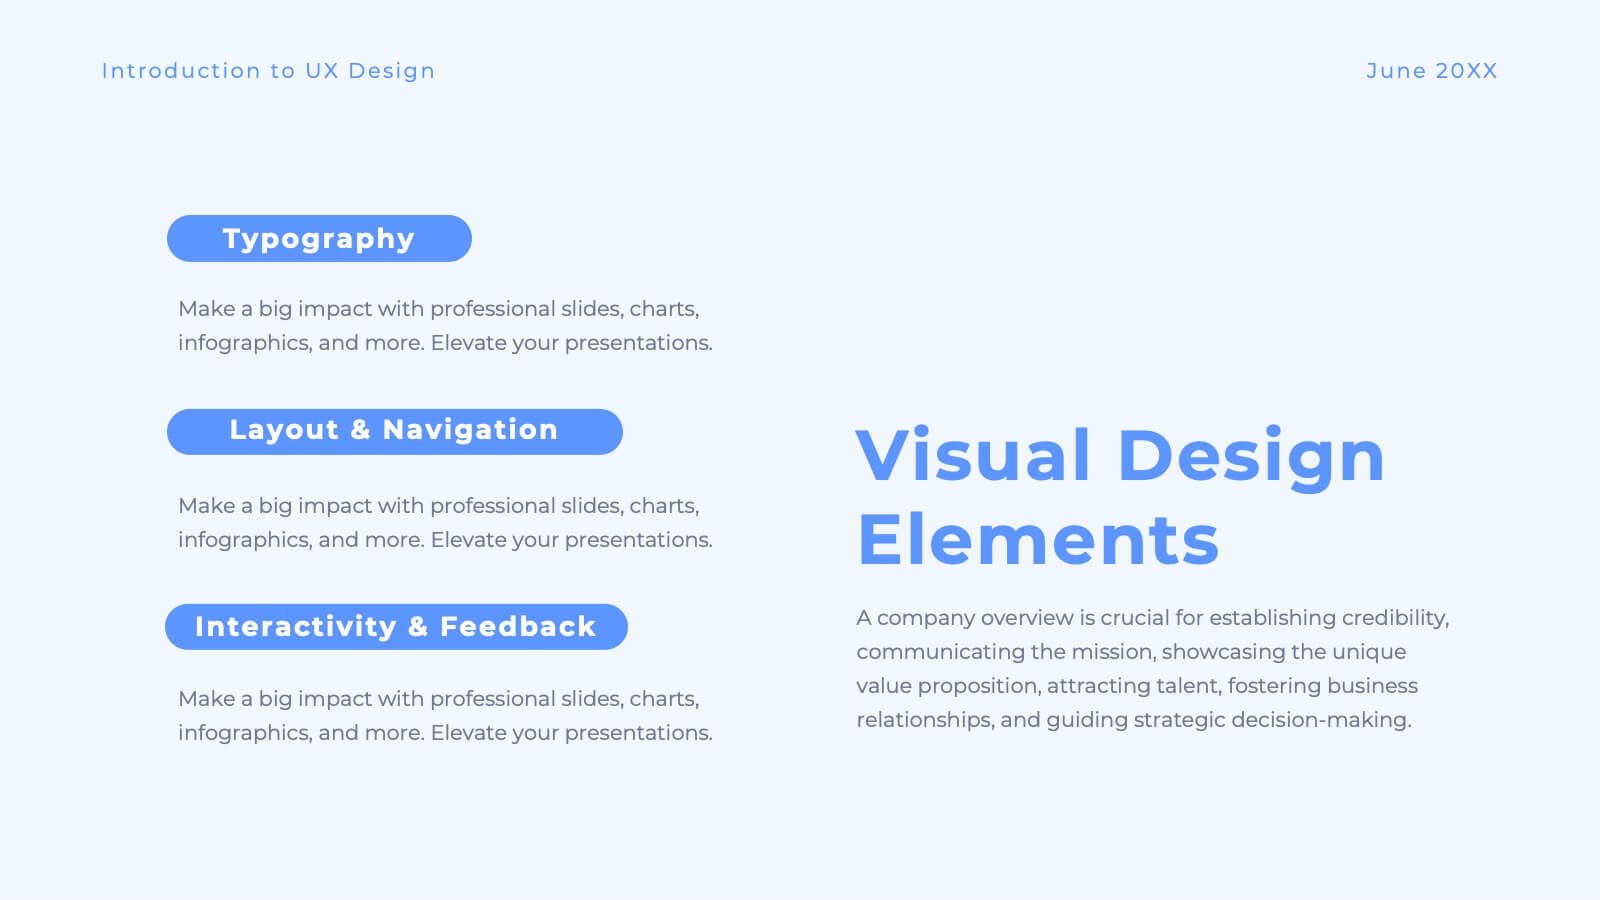
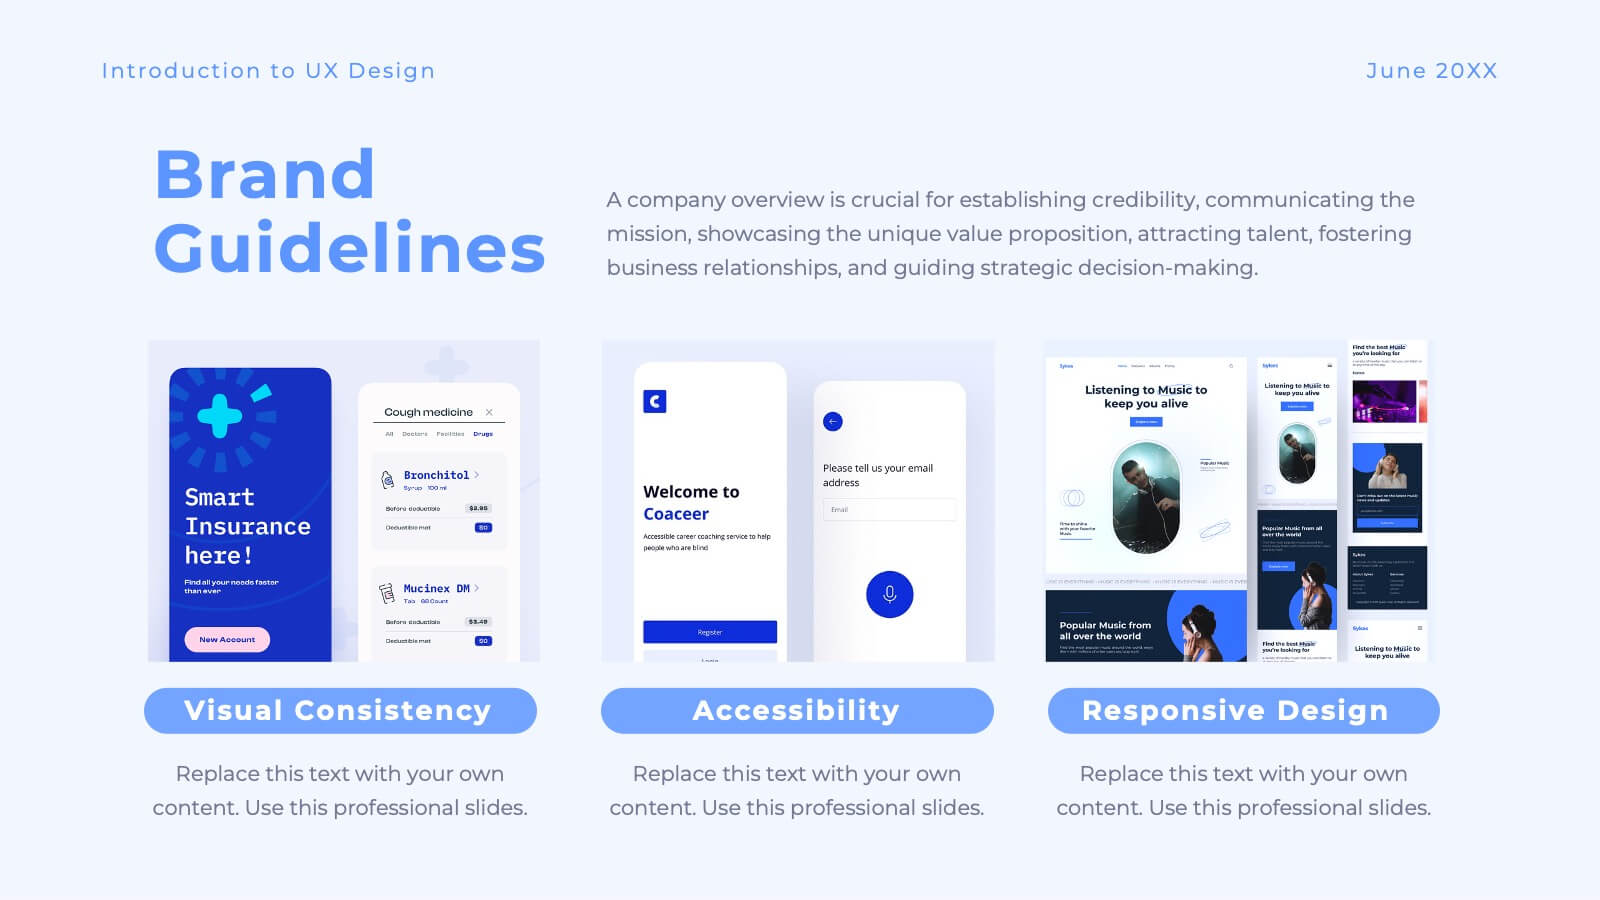
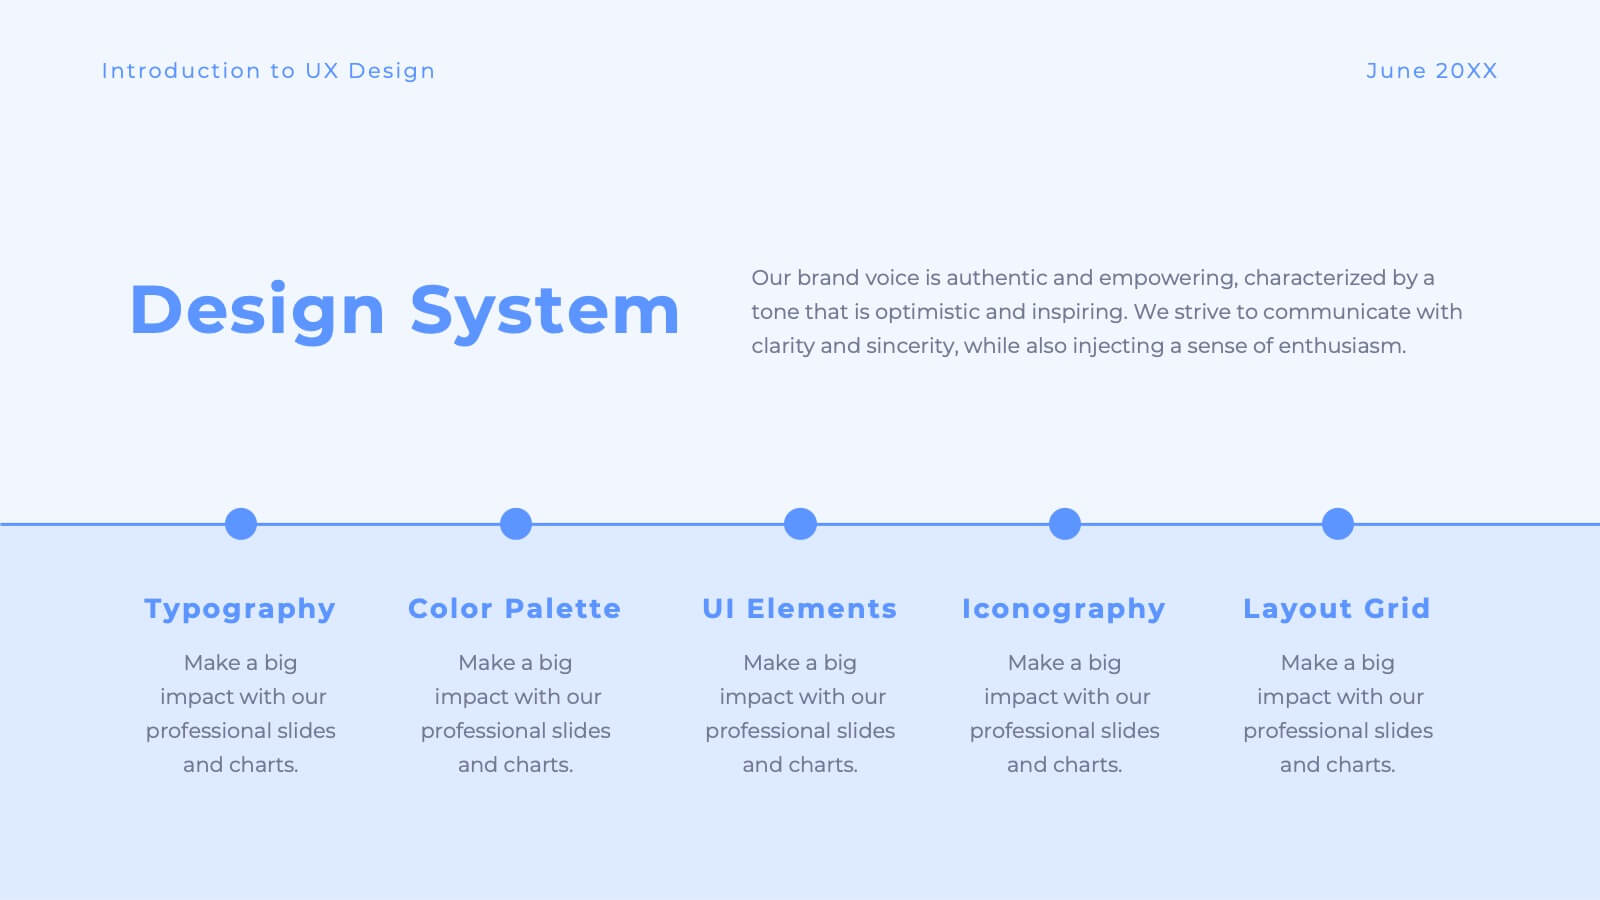
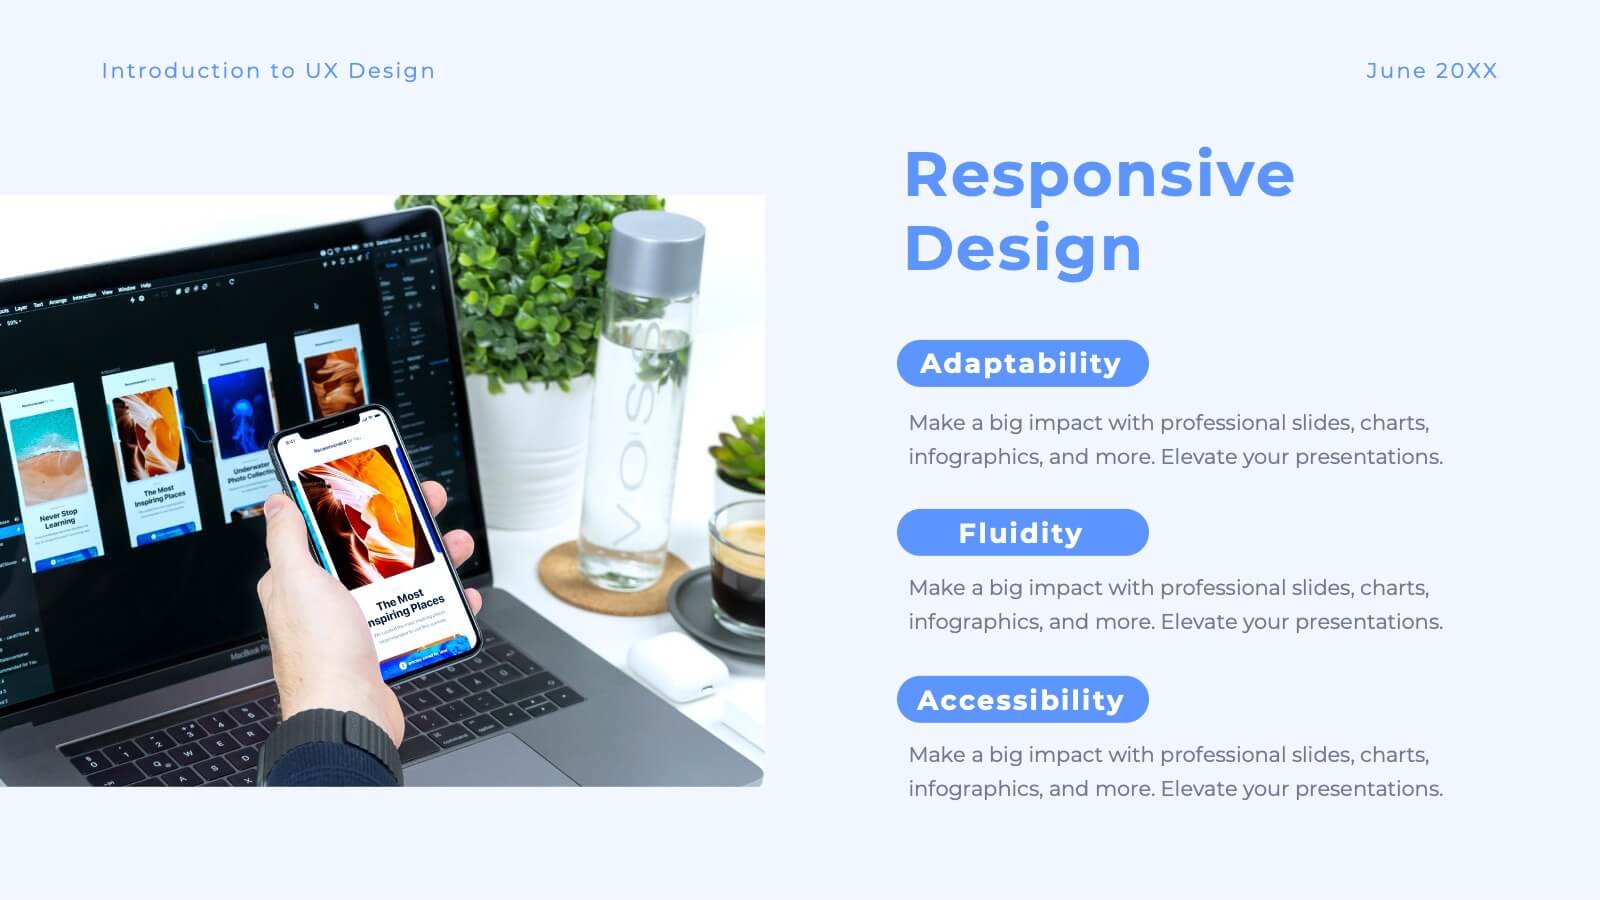
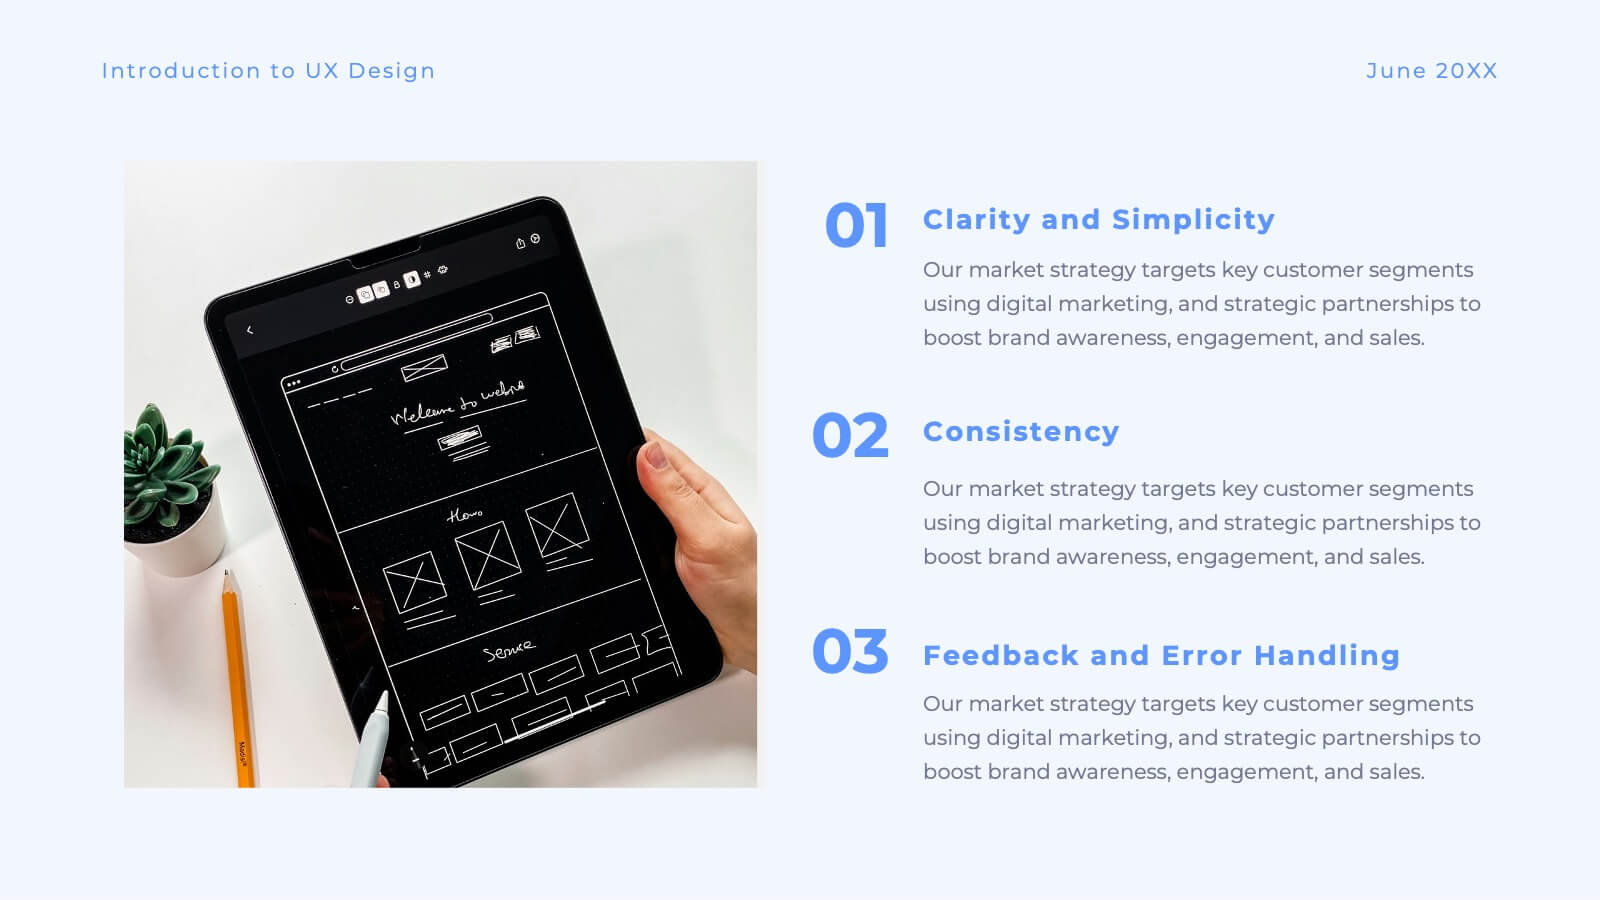
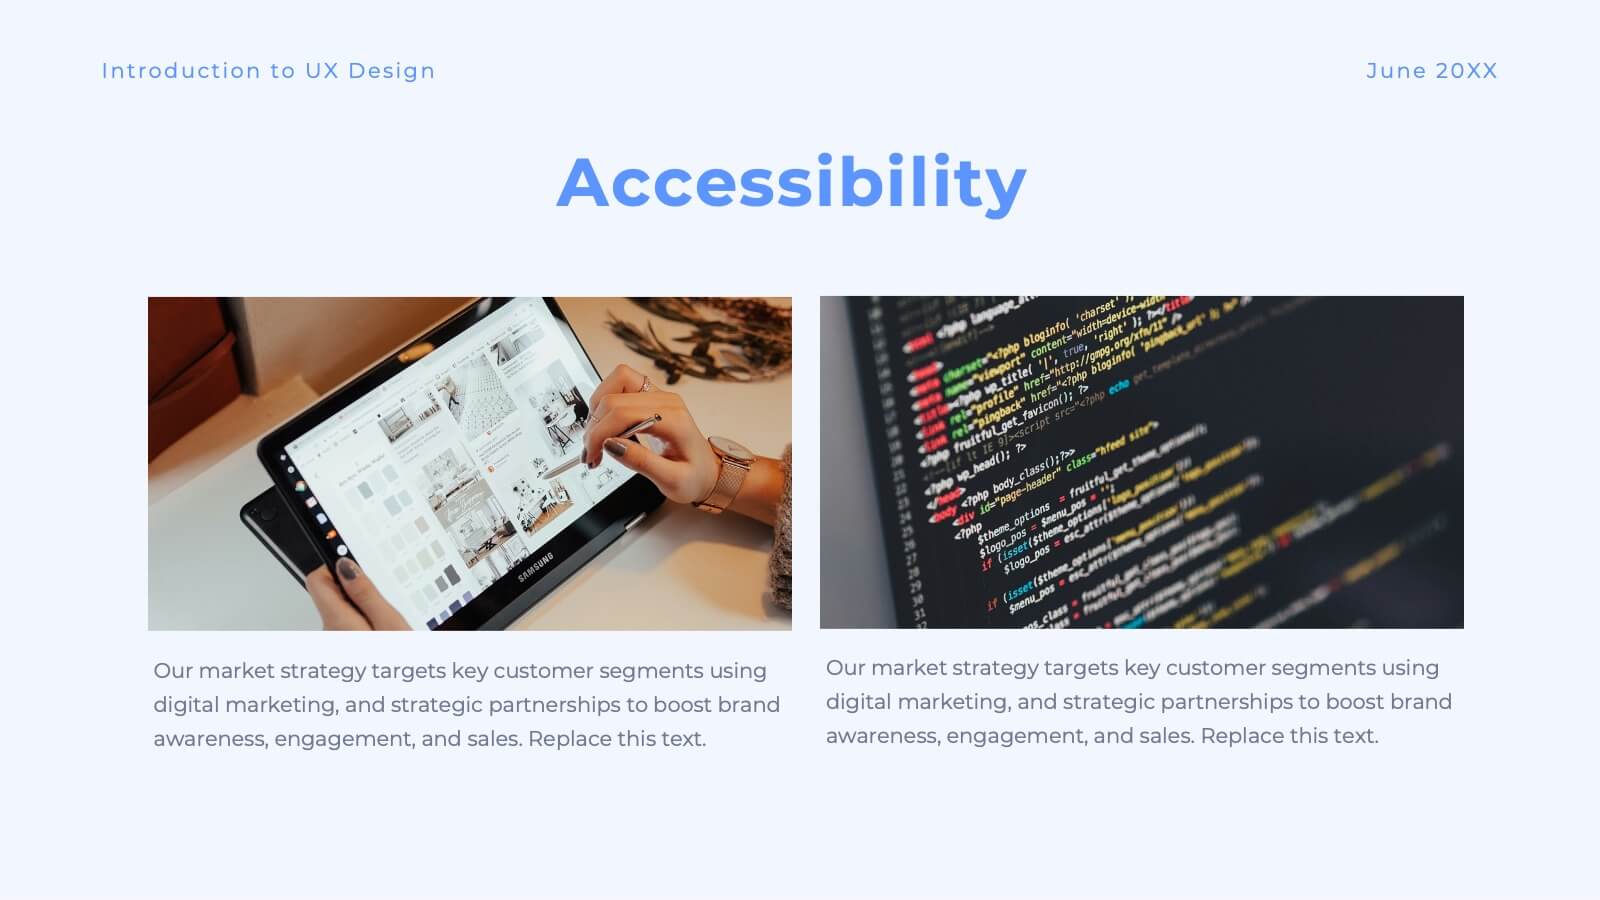
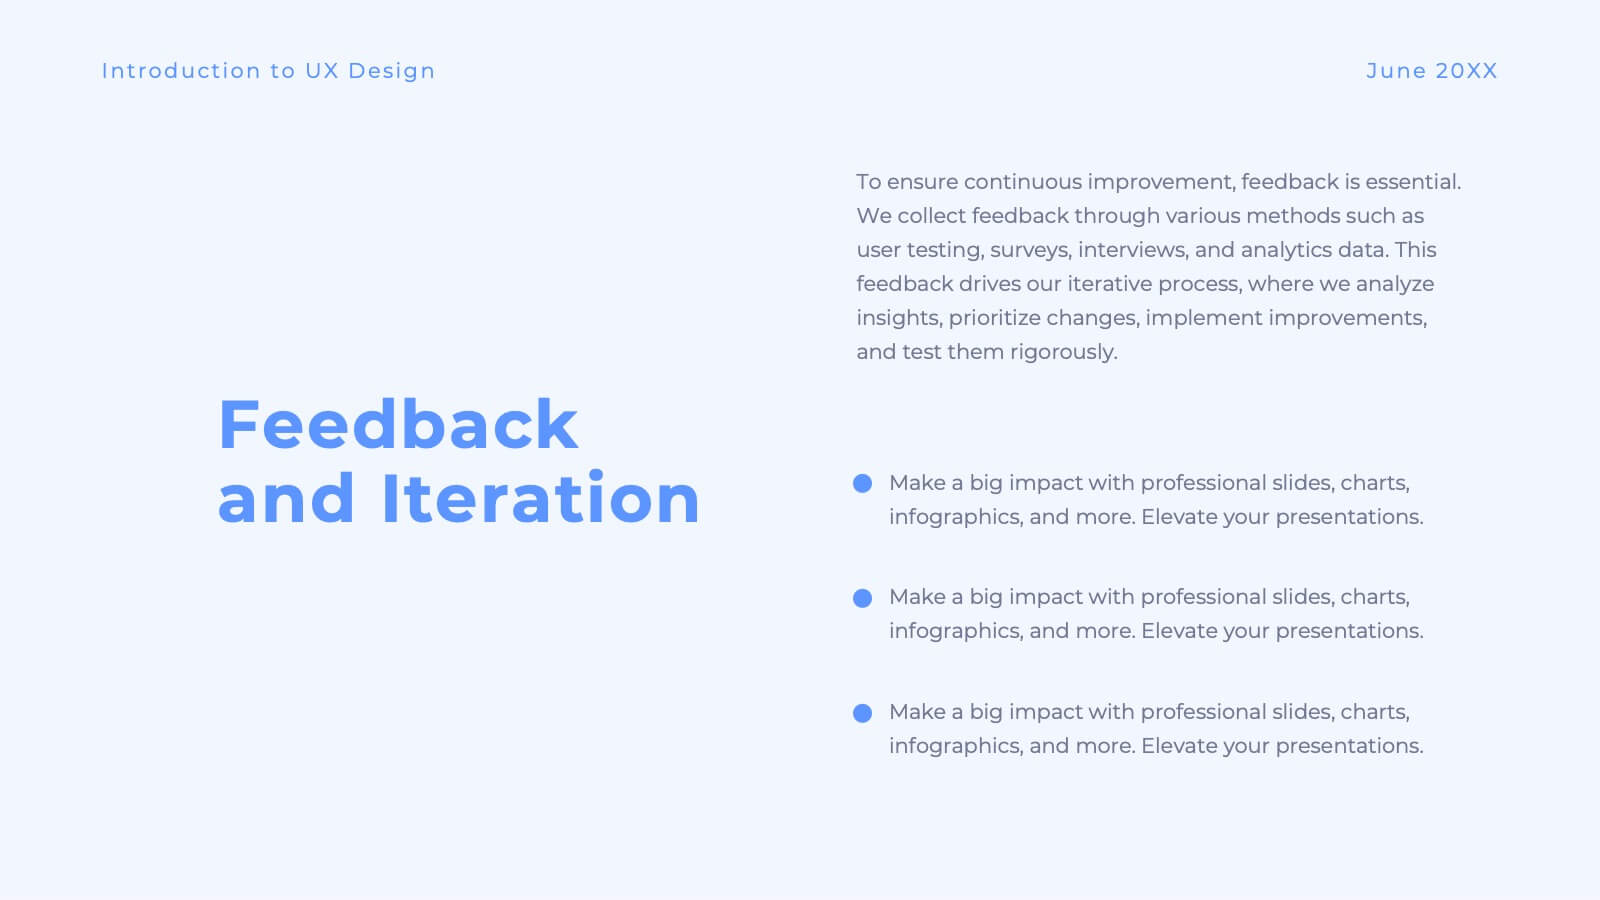
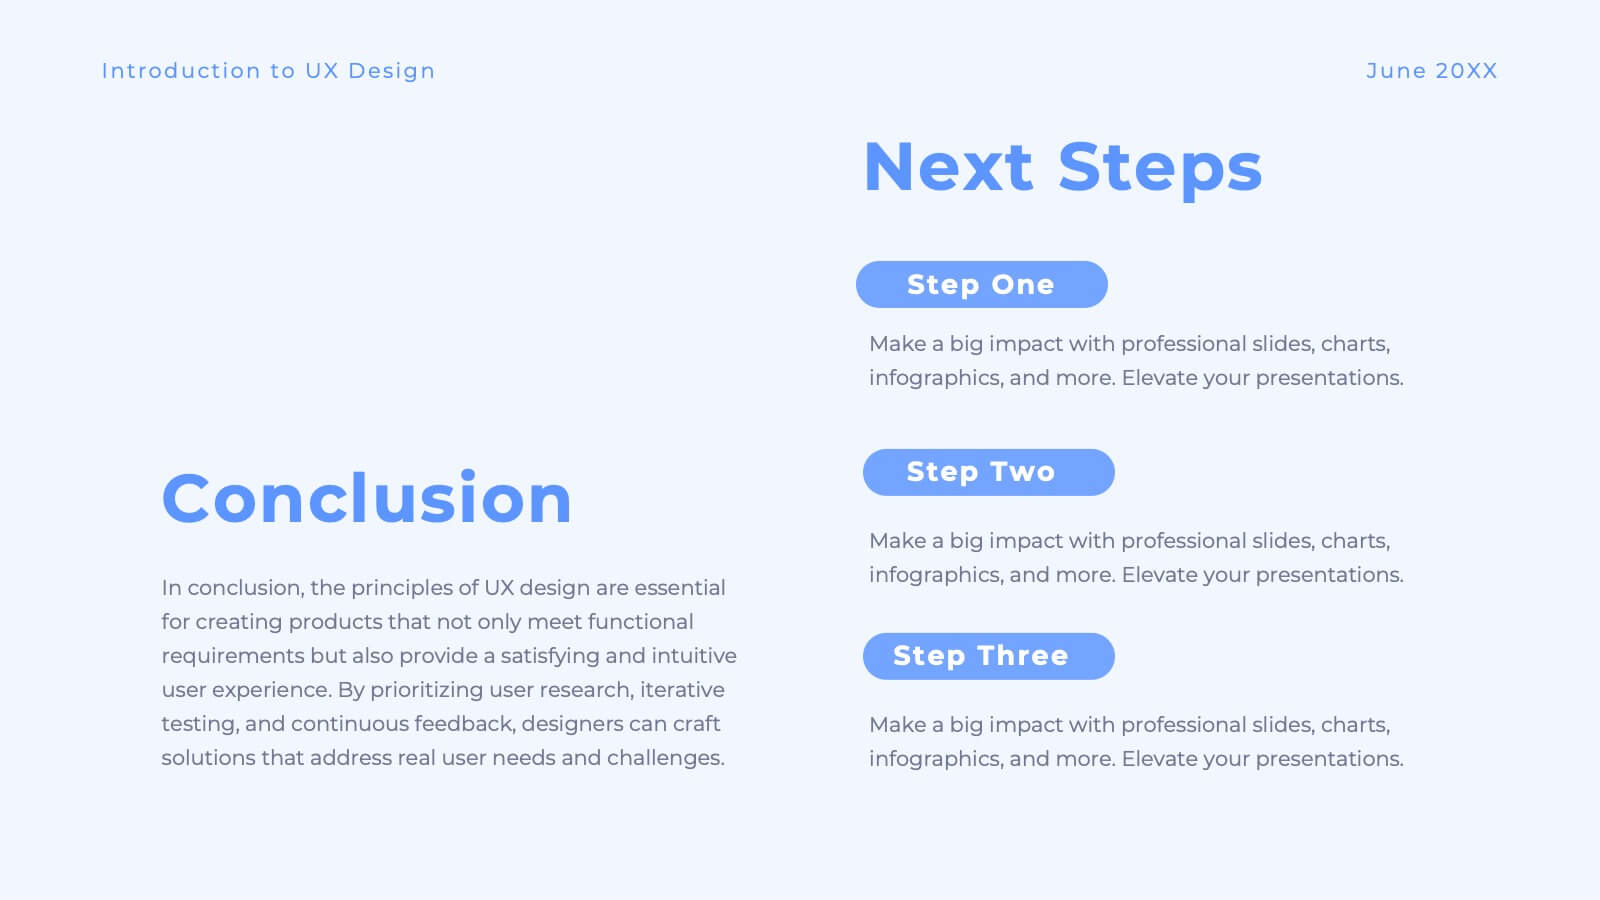
Luster UX Strategy Plan Presentation
Enhance user experience with this comprehensive UX strategy template! Perfect for outlining user research, personas, and design principles. Ideal for UX/UI designers aiming to present their strategies effectively. Compatible with PowerPoint, Keynote, and Google Slides, this template ensures your UX presentations are clear, professional, and impactful. Create exceptional user experiences today!


8 diapositivas
Checklist and Action Item List
Bring order to your tasks with this modern checklist design, ideal for highlighting project milestones, team assignments, or key deliverables. Featuring three editable points with accompanying icons, this layout ensures clarity and professionalism in every update. Fully customizable in PowerPoint, Keynote, and Google Slides.


6 diapositivas
Product Comparison Table Presentation
Compare features, performance, or specifications at a glance with this Product Comparison Table Presentation. Featuring colorful bar charts and side-by-side metrics, this layout is perfect for showcasing multiple options clearly and professionally. Fully customizable in PowerPoint, Keynote, and Google Slides.


6 diapositivas
Project Milestone and Status Update Presentation
Clearly communicate progress at every project phase with the Project Milestone and Status Update presentation slide. This table-style layout visually breaks down percentage completion across five key stages—Initiation, Planning, Execution, Monitoring, and Closing—making it ideal for status meetings, project reviews, or executive reports. Color-coded for easy reference and fully customizable in PowerPoint, Keynote, and Google Slides.