


Características


¿Tienes alguna pregunta?
Recomendar


7 diapositivas
Value Chain Business Infographic
The value chain is a concept used in business management to describe the full range of activities that businesses go through to bring a product or service from conception to delivery to customers. This infographic template is designed to showcase the various activities and processes that add value to your product or service, enlightening your audience about the holistic journey from start to finish. Compatible with Powerpoint, Keynote, and Google Slides. Present a visual representation of a value chain analysis, emphasizing the importance of evaluating each activity's contribution to the overall value.


26 diapositivas
Quantum Computing Presentation
Step into the future of technology with this fascinating presentation on quantum computing. Covering key concepts like quantum bits, superposition, entanglement, and real-world applications, this template helps simplify complex ideas for any audience. Fully customizable and compatible with PowerPoint, Keynote, and Google Slides for a seamless and insightful presentation experience.


6 diapositivas
Lean Six Sigma Framework Slide Presentation
Bring your audience in with a bold, energetic layout that makes each stage feel clear and engaging. This presentation explains the DMAIC framework in a streamlined way, helping users outline process improvement steps with confidence and clarity. Fully customizable and compatible with PowerPoint, Keynote, and Google Slides.


4 diapositivas
Strategic Triangle Model Slide
Visualize your core pillars with this Strategic Triangle Model Slide Presentation. Featuring a clean triangular layout with three editable segments, this template is perfect for showcasing frameworks such as mission-vision-values, policy-strategy-impact, or key business objectives. Each point of the triangle is paired with an icon and customizable text, making complex concepts easy to digest. Ideal for strategy planning, leadership discussions, or consulting proposals. Fully editable in PowerPoint, Google Slides, and Keynote.


20 diapositivas
Fluxion Product Launch Pitch Deck Presentation
Launch your next big idea with this sleek and impactful pitch deck! Featuring sections like market opportunities, business model, revenue streams, and team introductions, it ensures a persuasive narrative for investors. Perfect for startup launches or product pitches, this deck works seamlessly with PowerPoint, Keynote, and Google Slides.


5 diapositivas
Organizational Tree Model
Present team structures or company hierarchies with ease using this Organizational Tree Model slide. With five clearly defined roles branching from a central trunk, it’s perfect for visualizing leadership flow, reporting lines, or role responsibilities. Fully editable in PowerPoint, Keynote, and Google Slides.


5 diapositivas
User-Centered Design with Empathy Map Presentation
Improve User Insights with the Empathy Map for User-Centered Design! This User-Centered Design with Empathy Map template provides a structured approach to understanding user behaviors, motivations, and needs. Designed with clear quadrant sections, this template helps teams map out key insights for UX research, customer journey mapping, and product development. Ideal for designers, marketers, and strategists, this fully editable slide deck works seamlessly with PowerPoint, Keynote, and Google Slides for a hassle-free customization experience.


5 diapositivas
European Countries Editable Map Presentation
Bring your data to life with a detailed and modern map layout that showcases insights across Europe. Perfect for visualizing country comparisons, regional statistics, or business expansion plans, this clean design ensures clarity and impact. Fully compatible with PowerPoint, Keynote, and Google Slides for easy editing and presentation.


6 diapositivas
Project Summary and Final Thoughts Presentation
Wrap up your presentation with clarity using the Project Summary and Final Thoughts Presentation. This clean, structured layout helps you highlight key milestones, insights, and takeaways across six points—perfect for recapping project goals and outcomes. Fully customizable and compatible with PowerPoint, Keynote, and Google Slides.


4 diapositivas
Creative Title Slide Templates Presentation
Make a bold first impression with the Creative Title Slide Templates Presentation. Featuring a sleek, split-layout design with glowing blue abstract waves, this template combines modern aesthetics with functional clarity. Circular icons on the side offer quick visual cues for business categories or departments. Ideal for keynote introductions or professional project kickoffs. Compatible with PowerPoint, Keynote, and Google Slides.


4 diapositivas
Ishikawa Diagram for Process Review Presentation
Visualize cause-and-effect relationships with the Ishikawa Diagram for Process Review Presentation. Also known as a fishbone diagram, this template is perfect for identifying potential root causes during quality control or team brainstorming sessions. Easily editable in Canva, PowerPoint, and Google Slides to match your workflow and style.


4 diapositivas
Operating Expenses and Cost Allocation Presentation
Clearly outline key financial movements with the Operating Expenses and Cost Allocation Presentation. This slide uses a step-arrow layout to show the relationship between spending and allocation, making it ideal for budgeting updates, operational analysis, or finance planning. Fully editable in PowerPoint, Keynote, Google Slides, and Canva for seamless customization.


22 diapositivas
Tranquil Project Status Report Presentation
This dynamic project report template delivers key insights with a bold, modern design. From performance metrics to market trends and client feedback, it's crafted for comprehensive yet visually appealing updates. Perfect for team presentations, this template ensures clarity and engagement. Compatible with PowerPoint, Keynote, and Google Slides, it’s ideal for project leaders!


7 diapositivas
Africa Map Infographic Presentation Template
The African continent is home to a great deal of linguistic and cultural diversity. Africa has approximately one-third of the world's languages. There are at least seventy-five African languages with more than one million speakers. The diversity of Africa's languages is evidenced by their populations. This template features fully editable vector shapes of countries, national flags and lines to highlight routes across this diverse continent. Use this Africa map template to illustrate the countries of Africa and their borders. You can easily add information, such as other icons in the blank spaces.


22 diapositivas
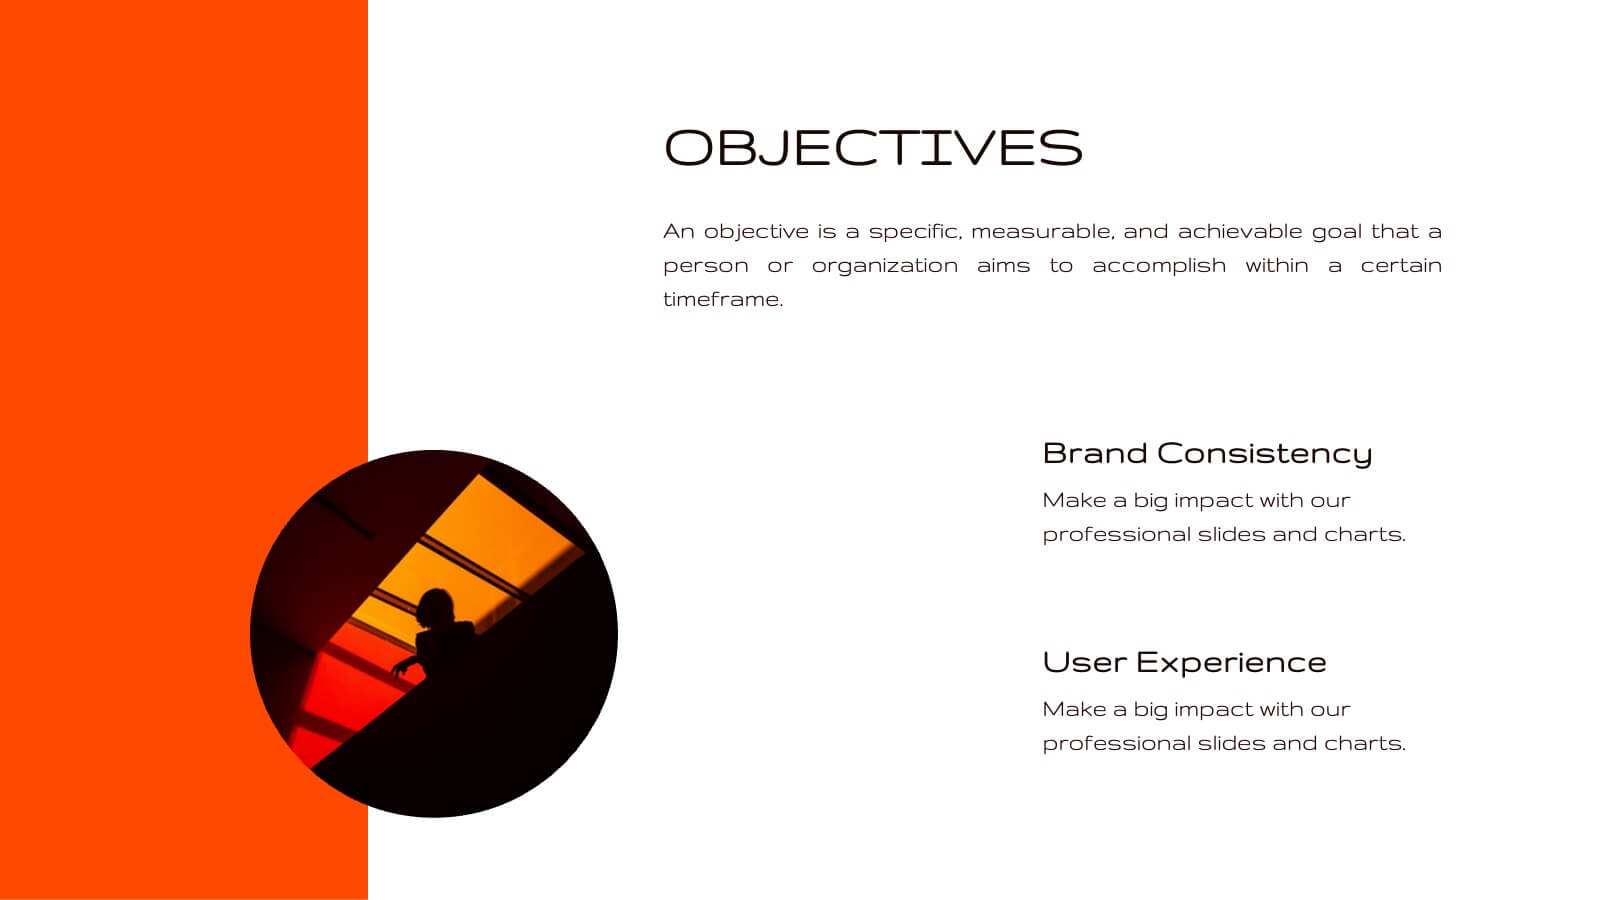
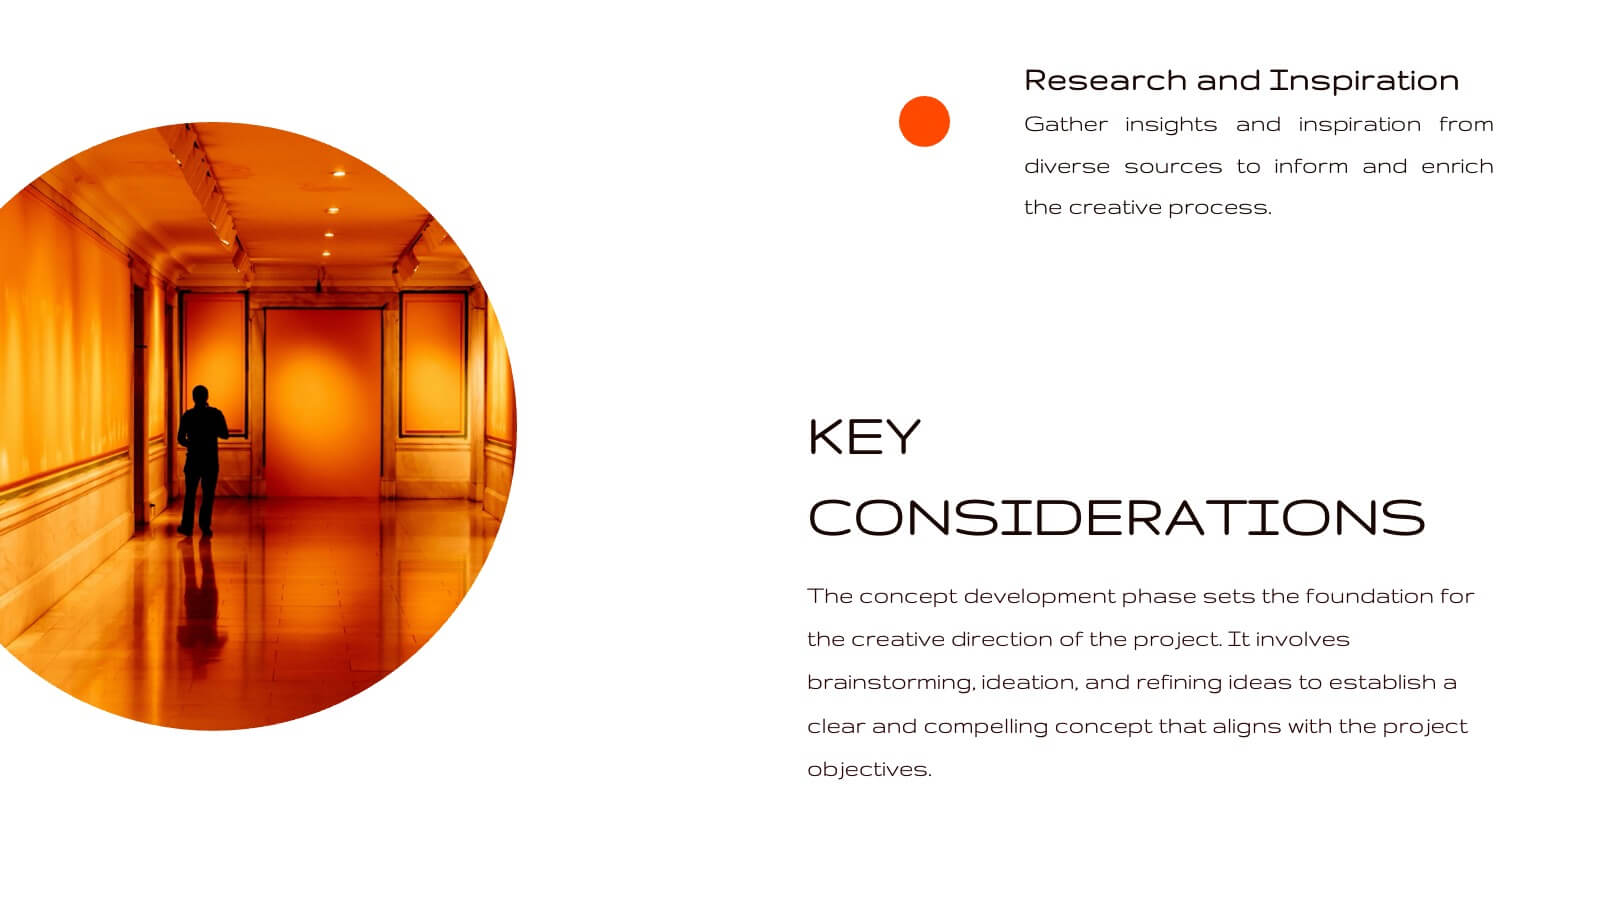
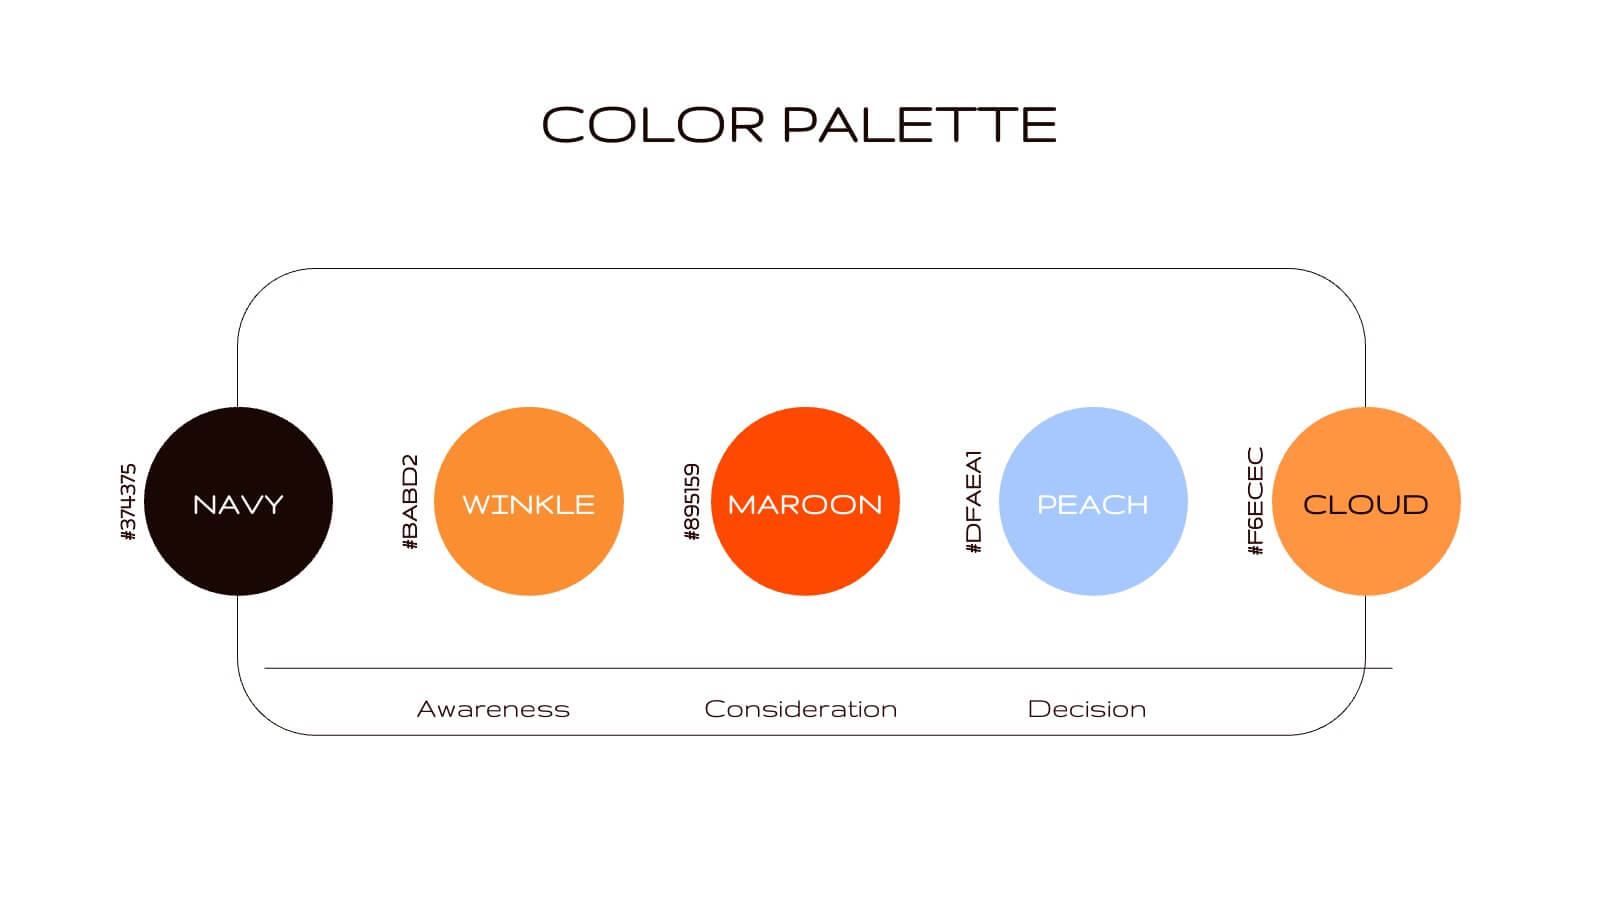
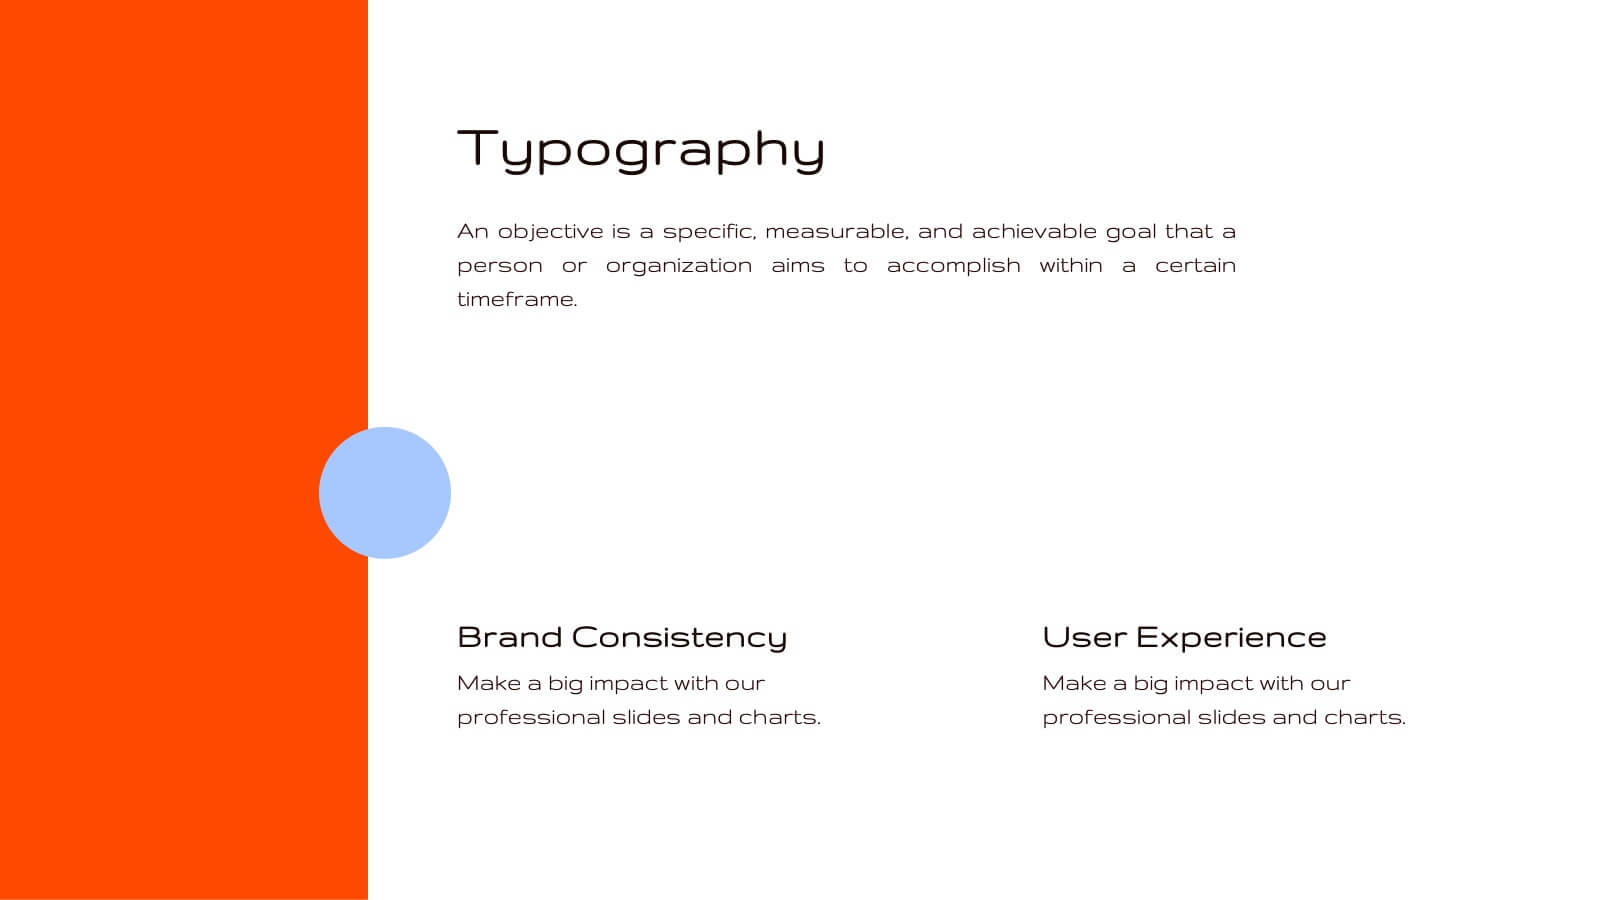
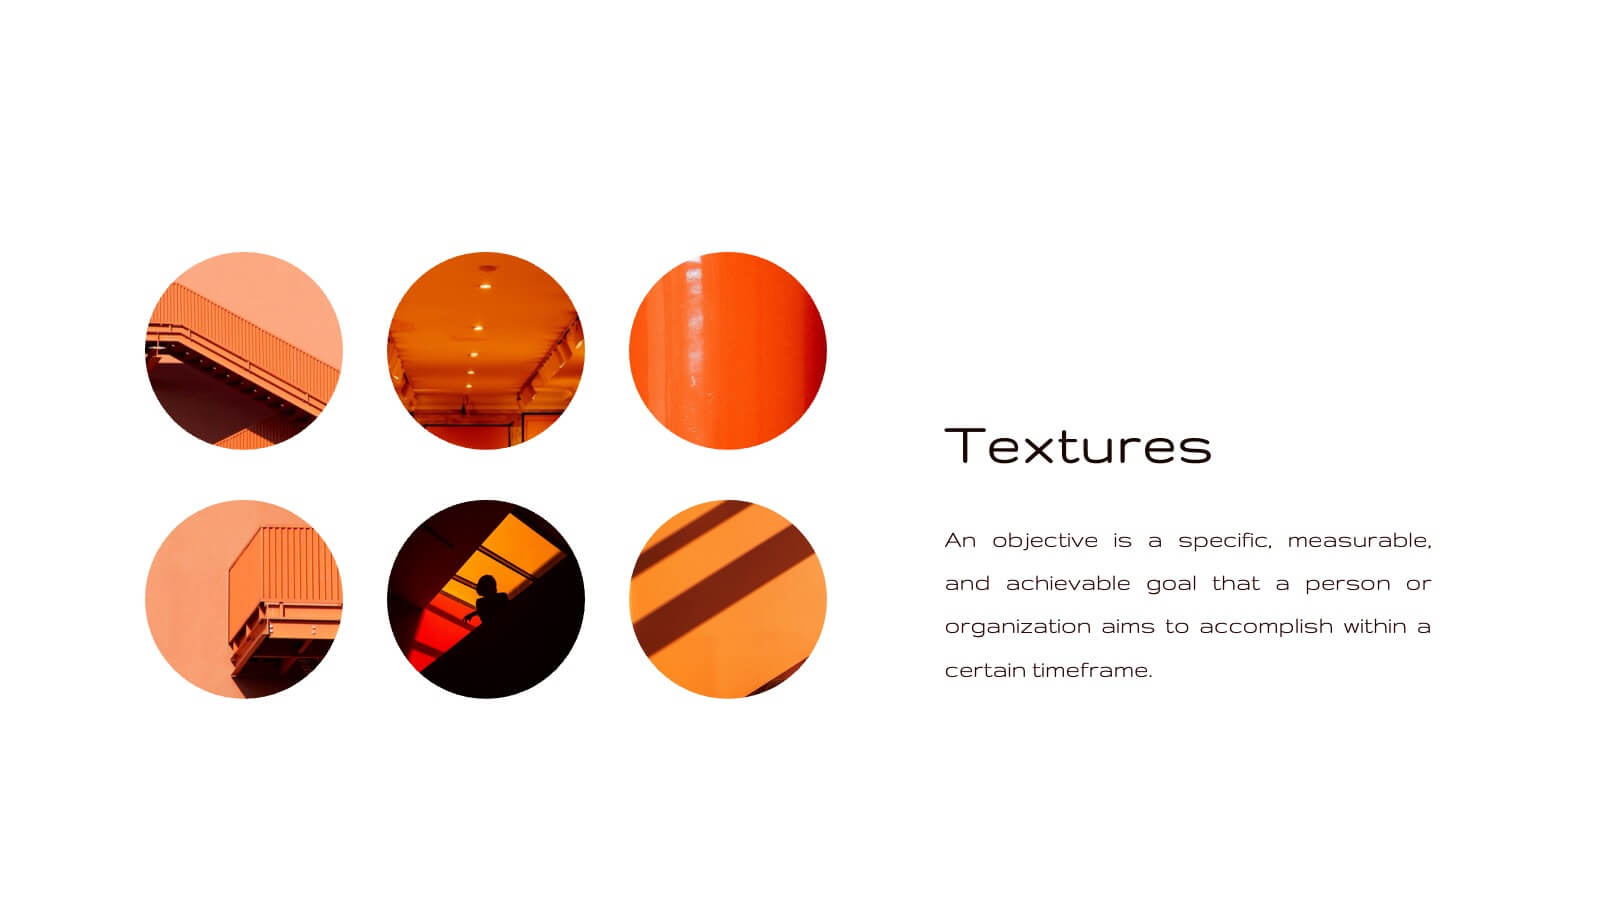
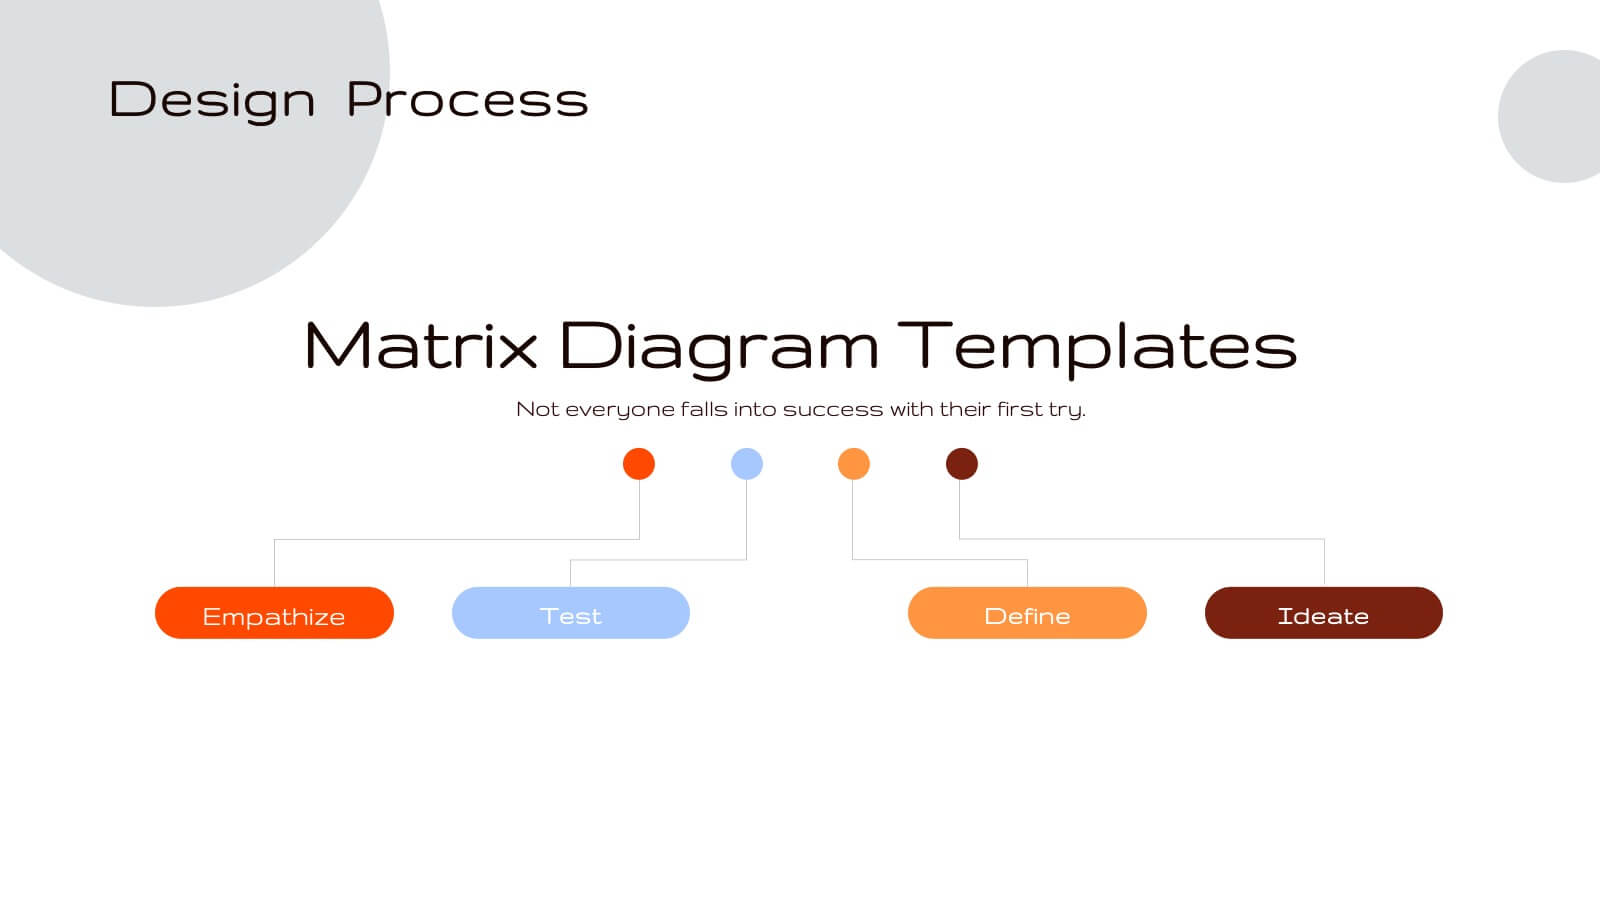
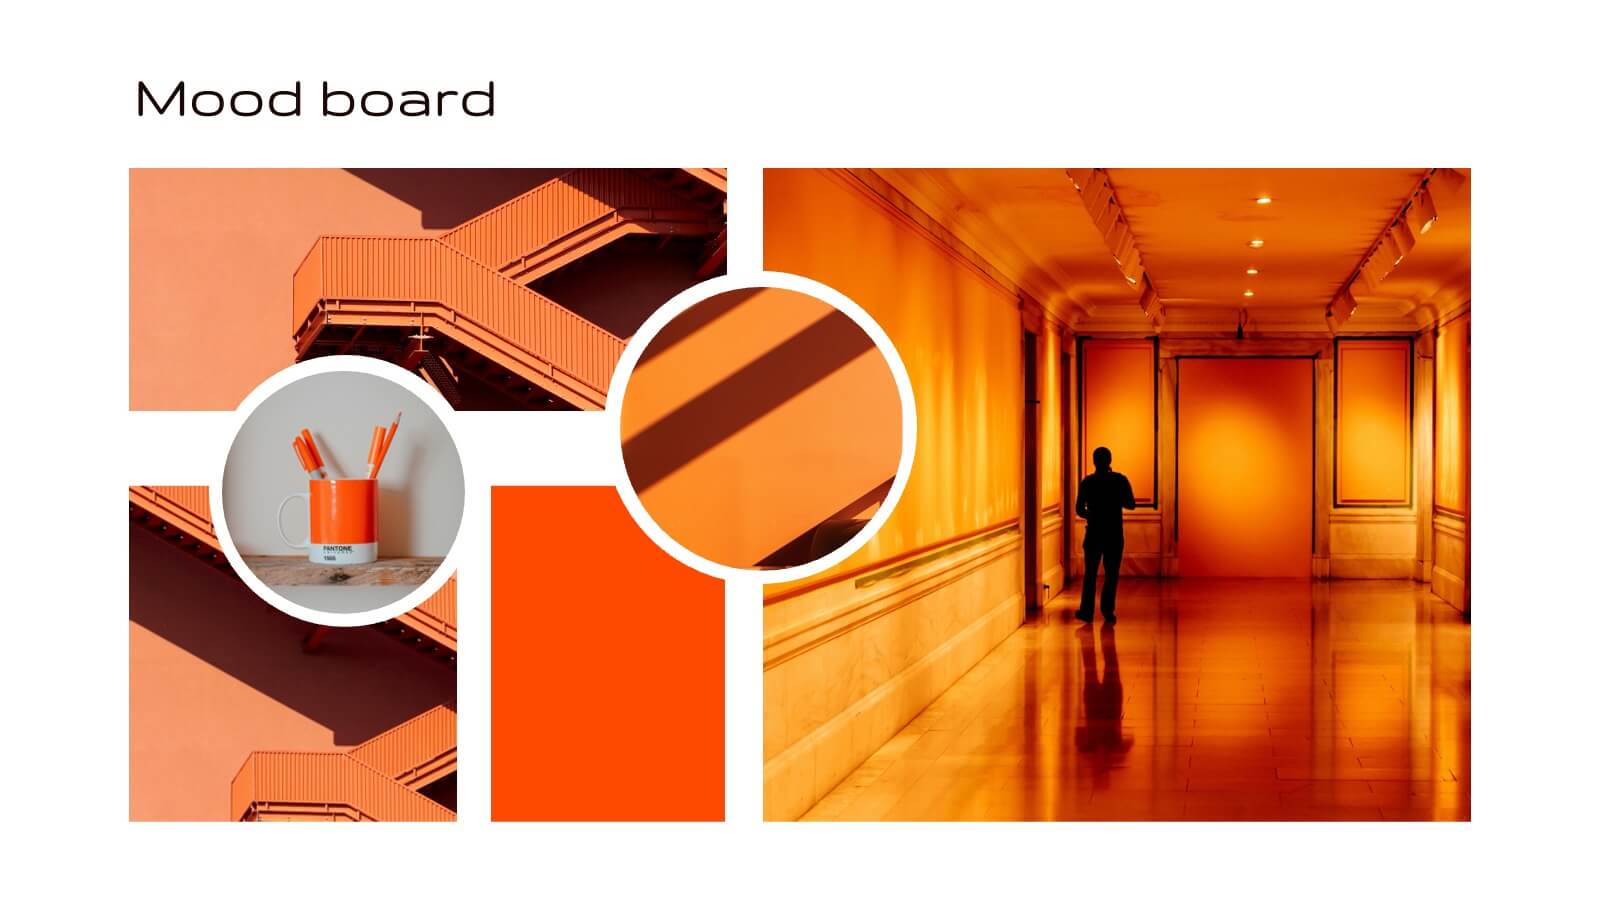
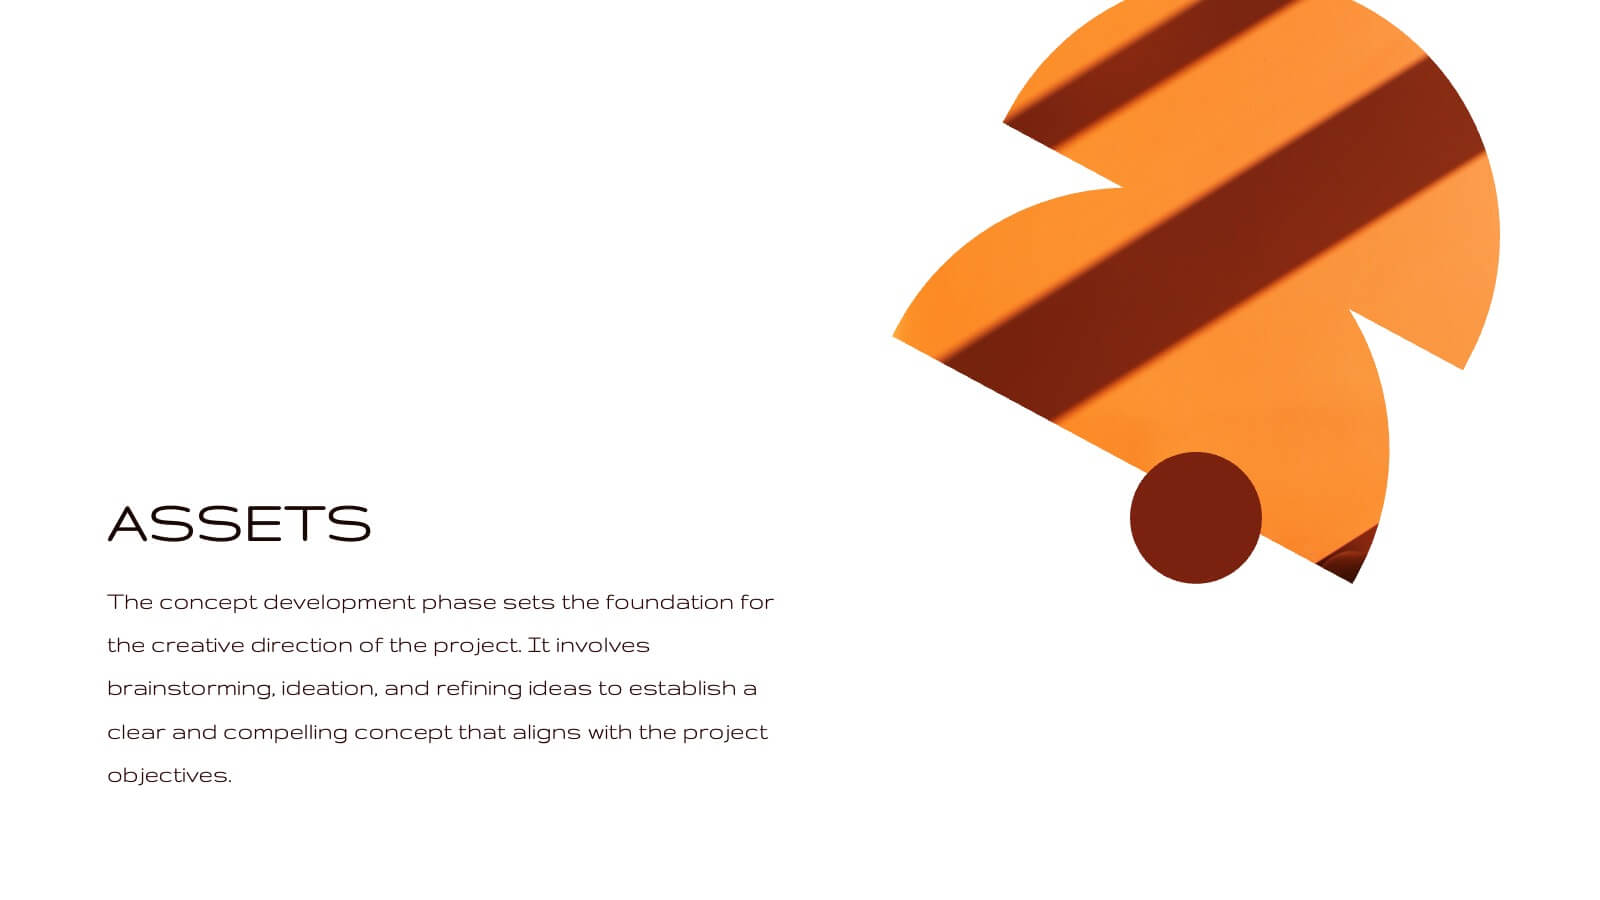
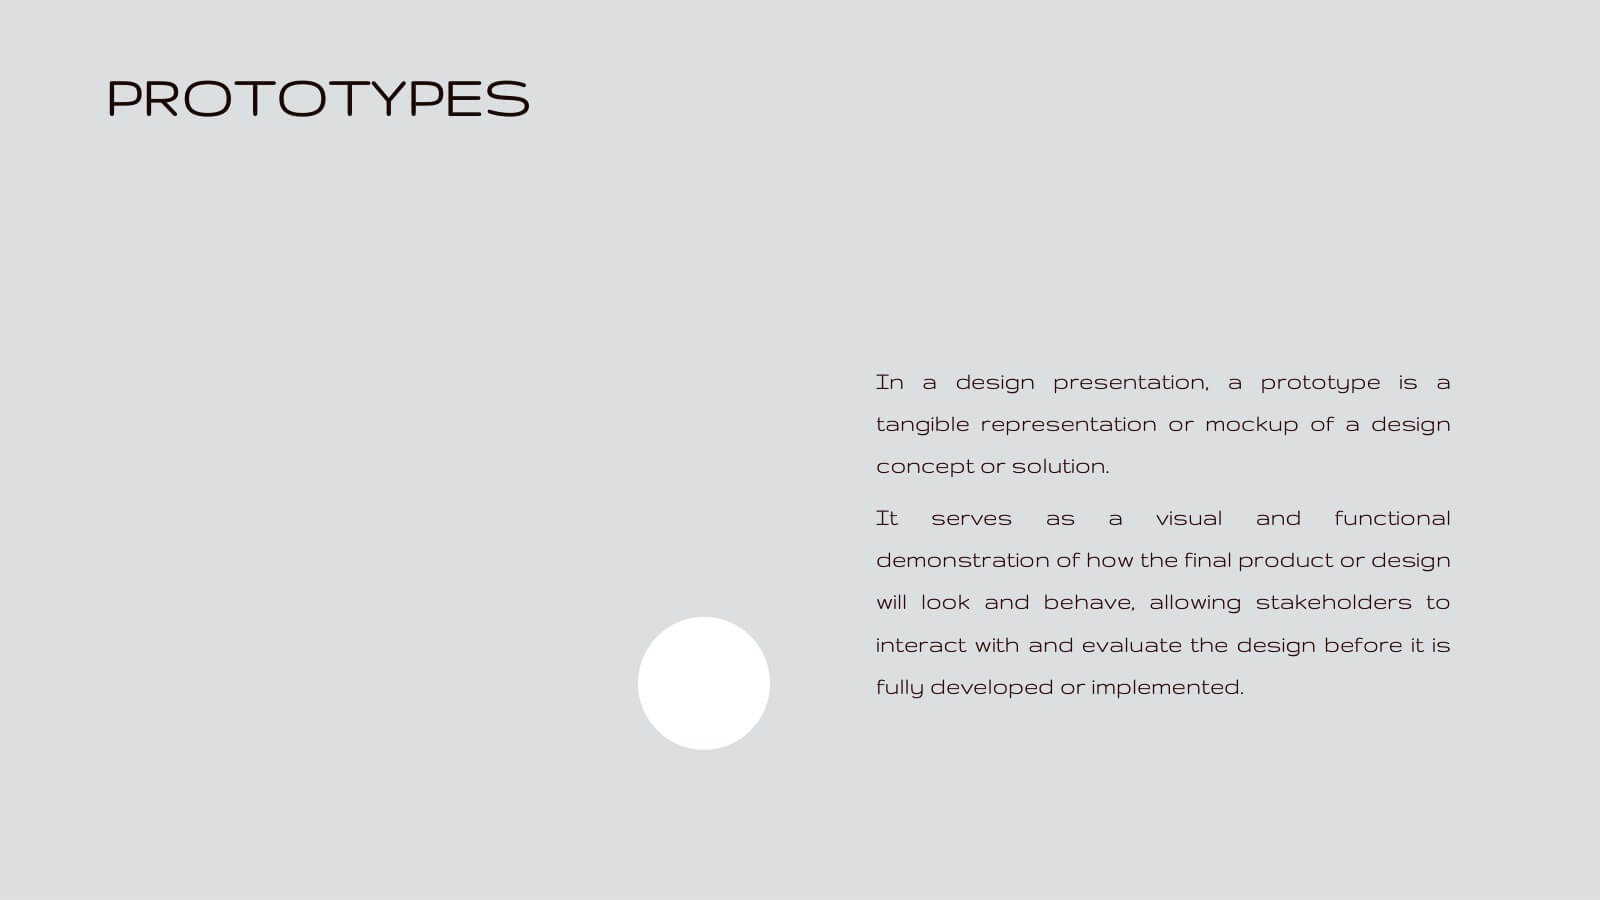
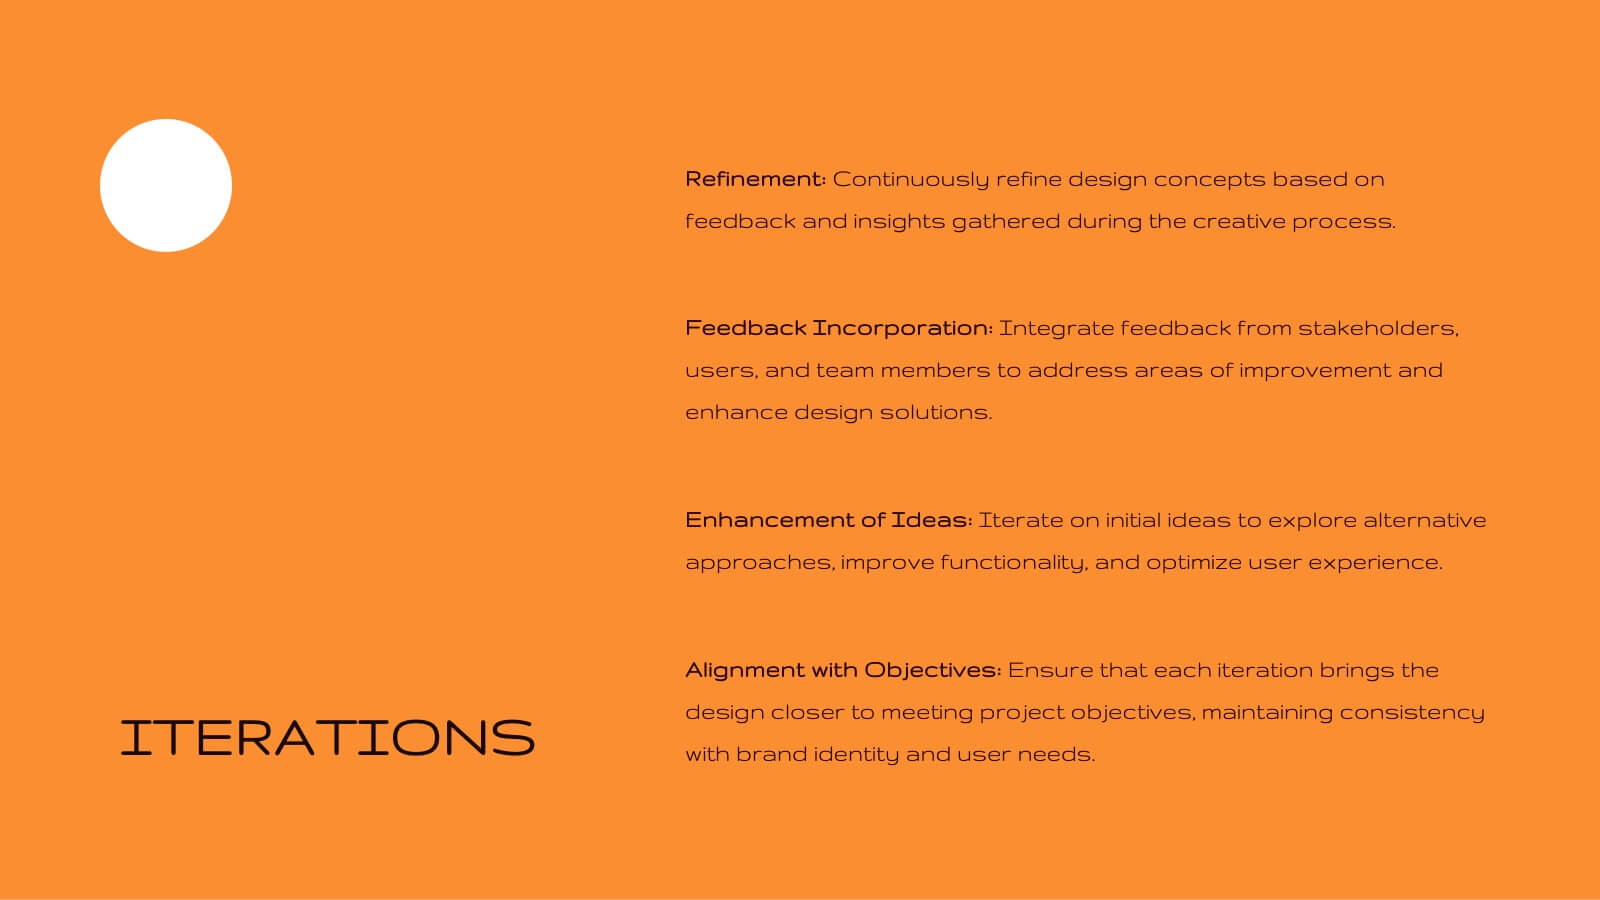
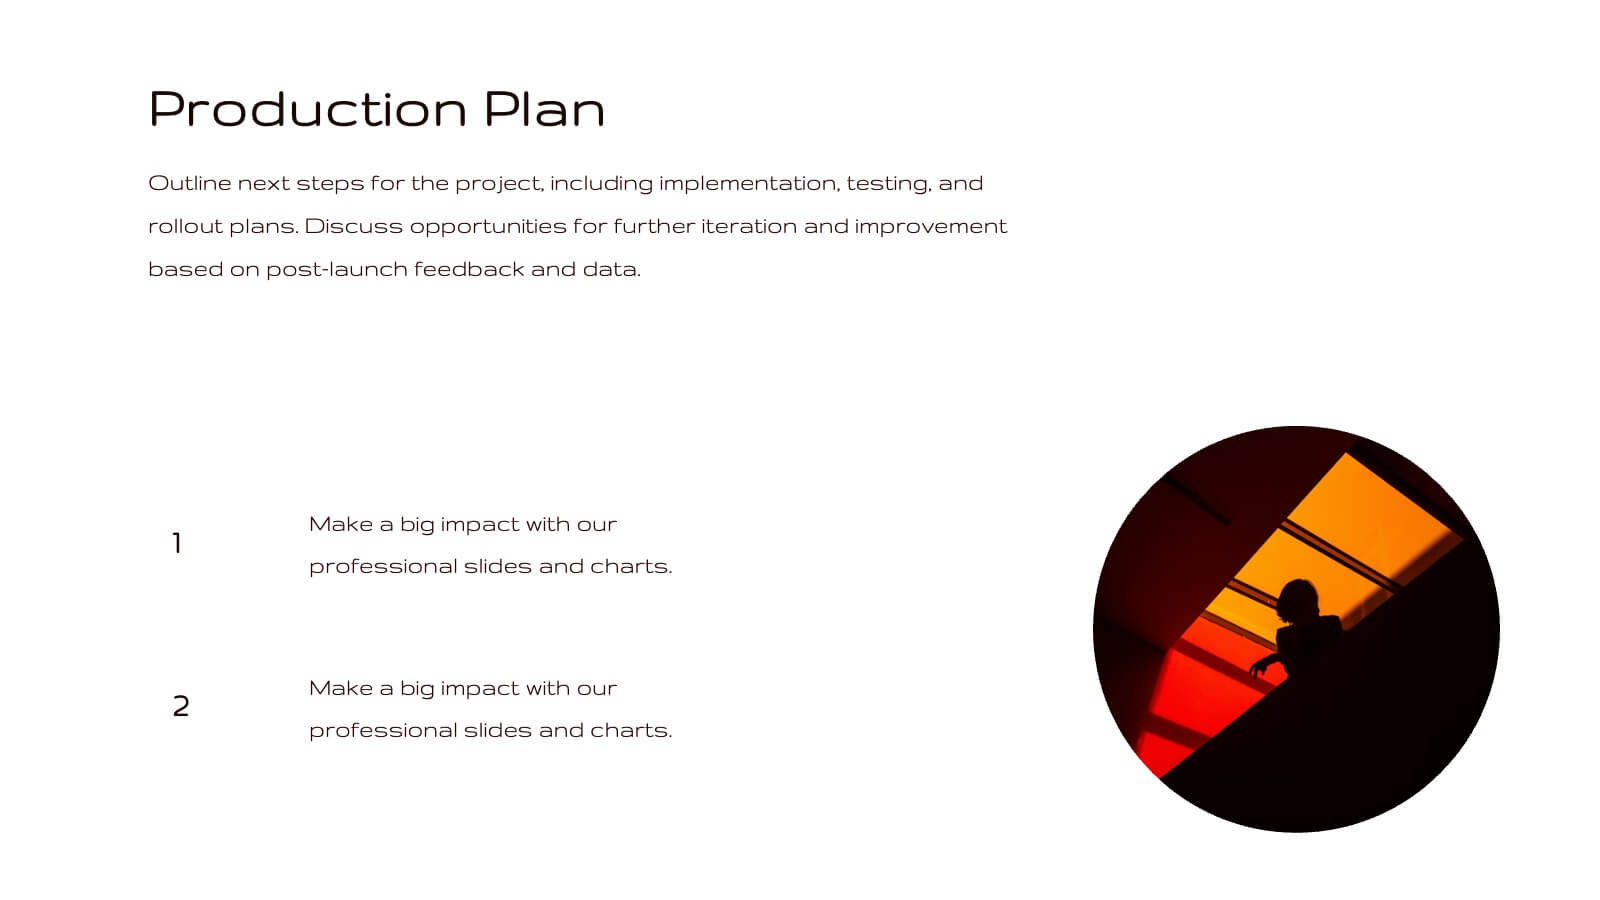
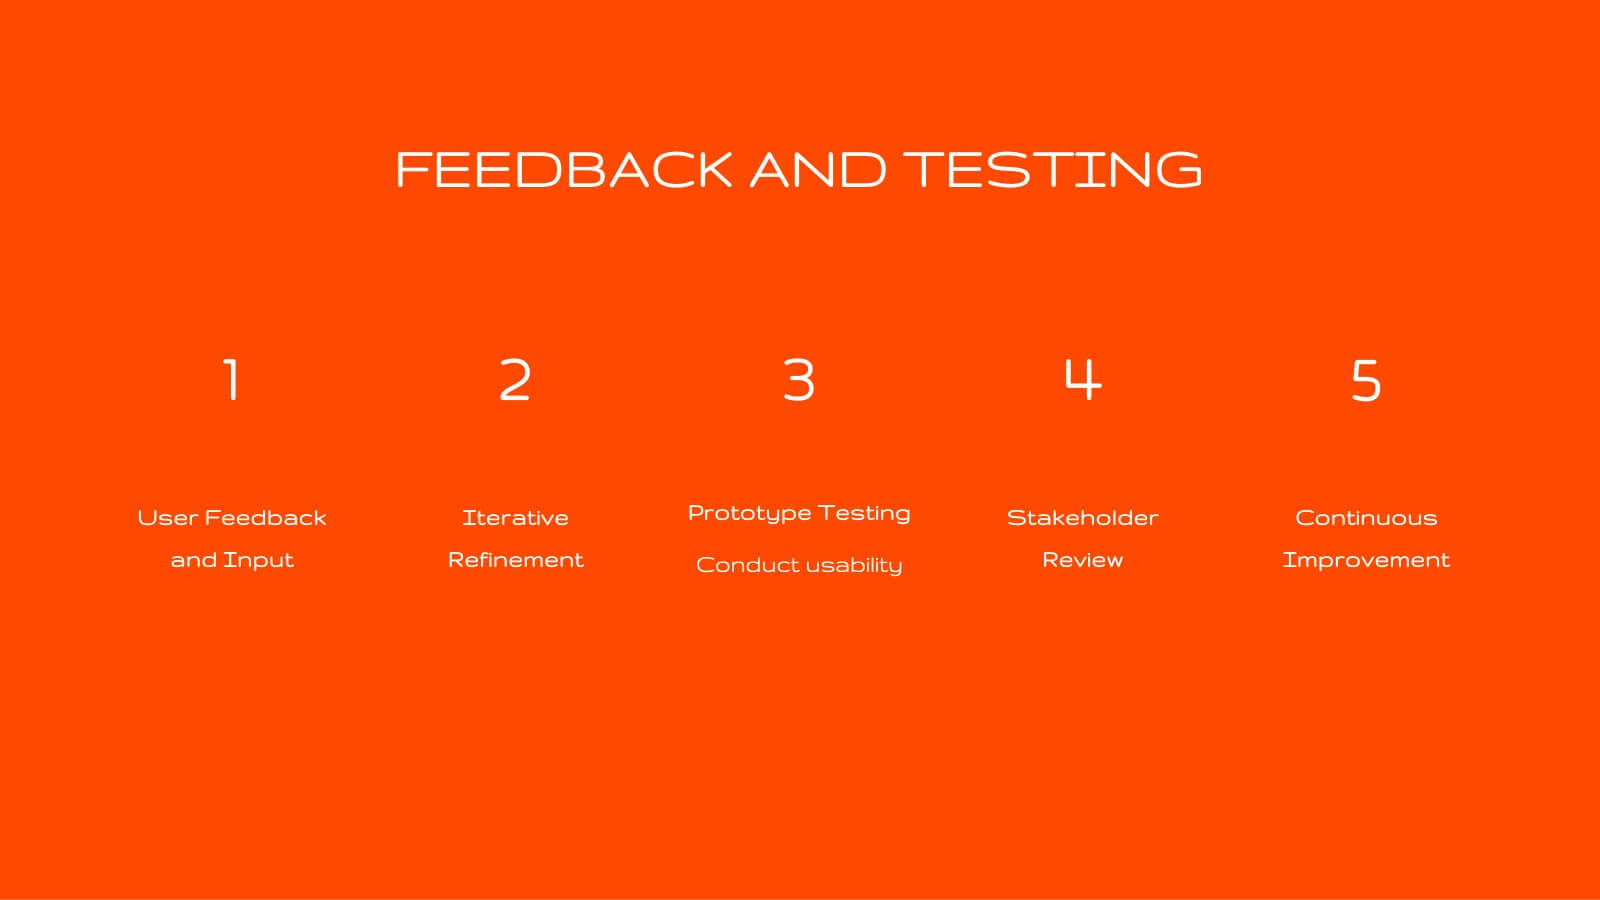
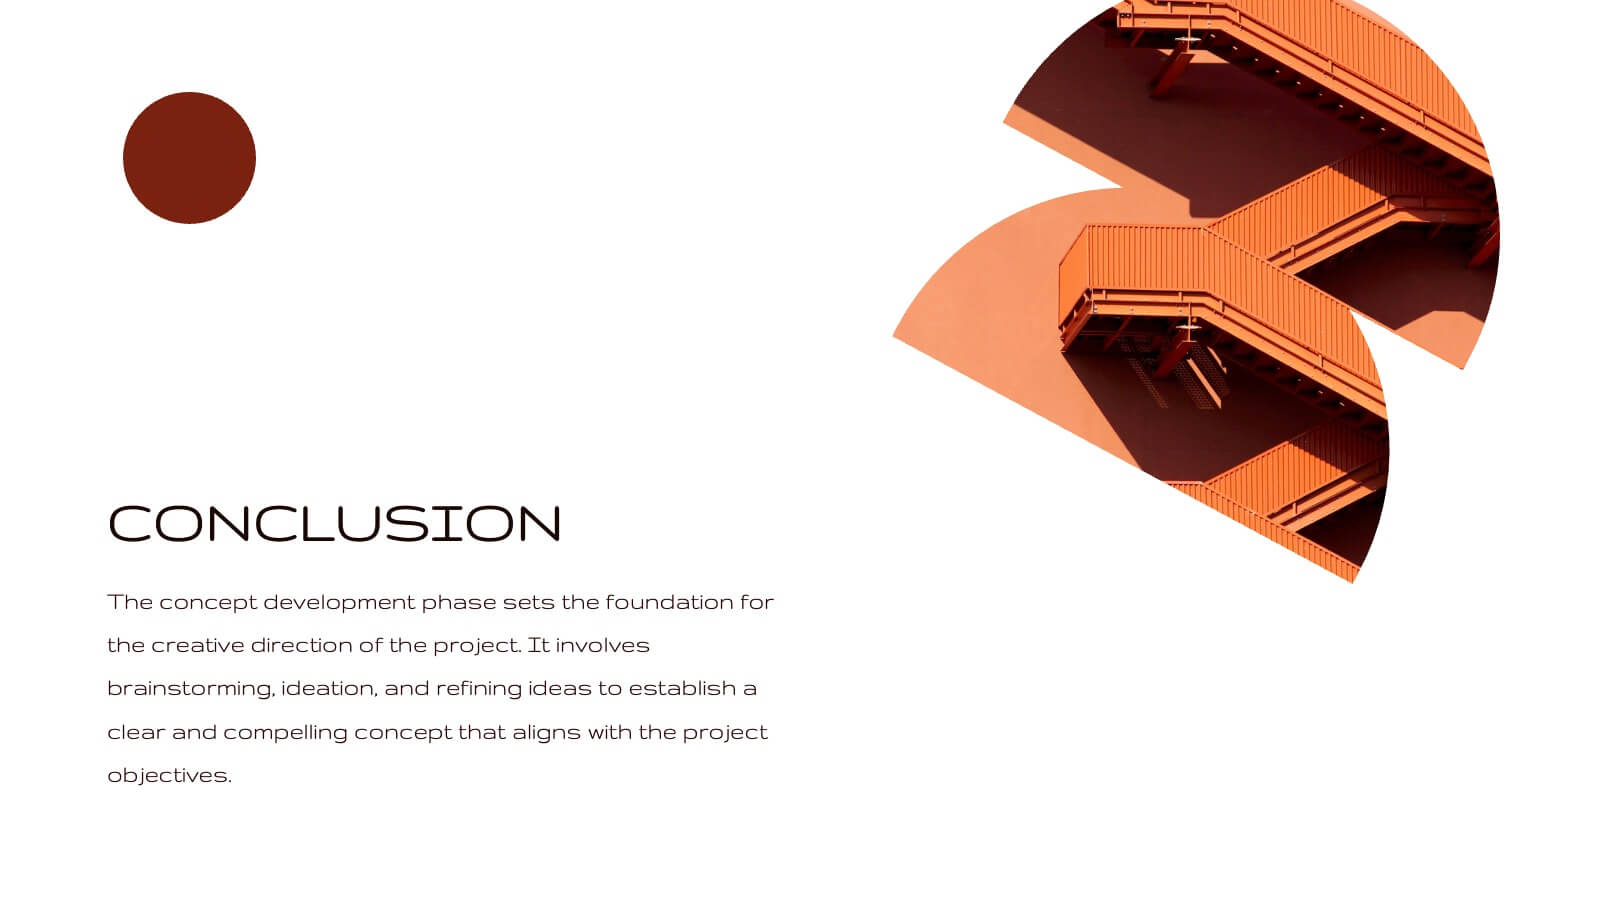
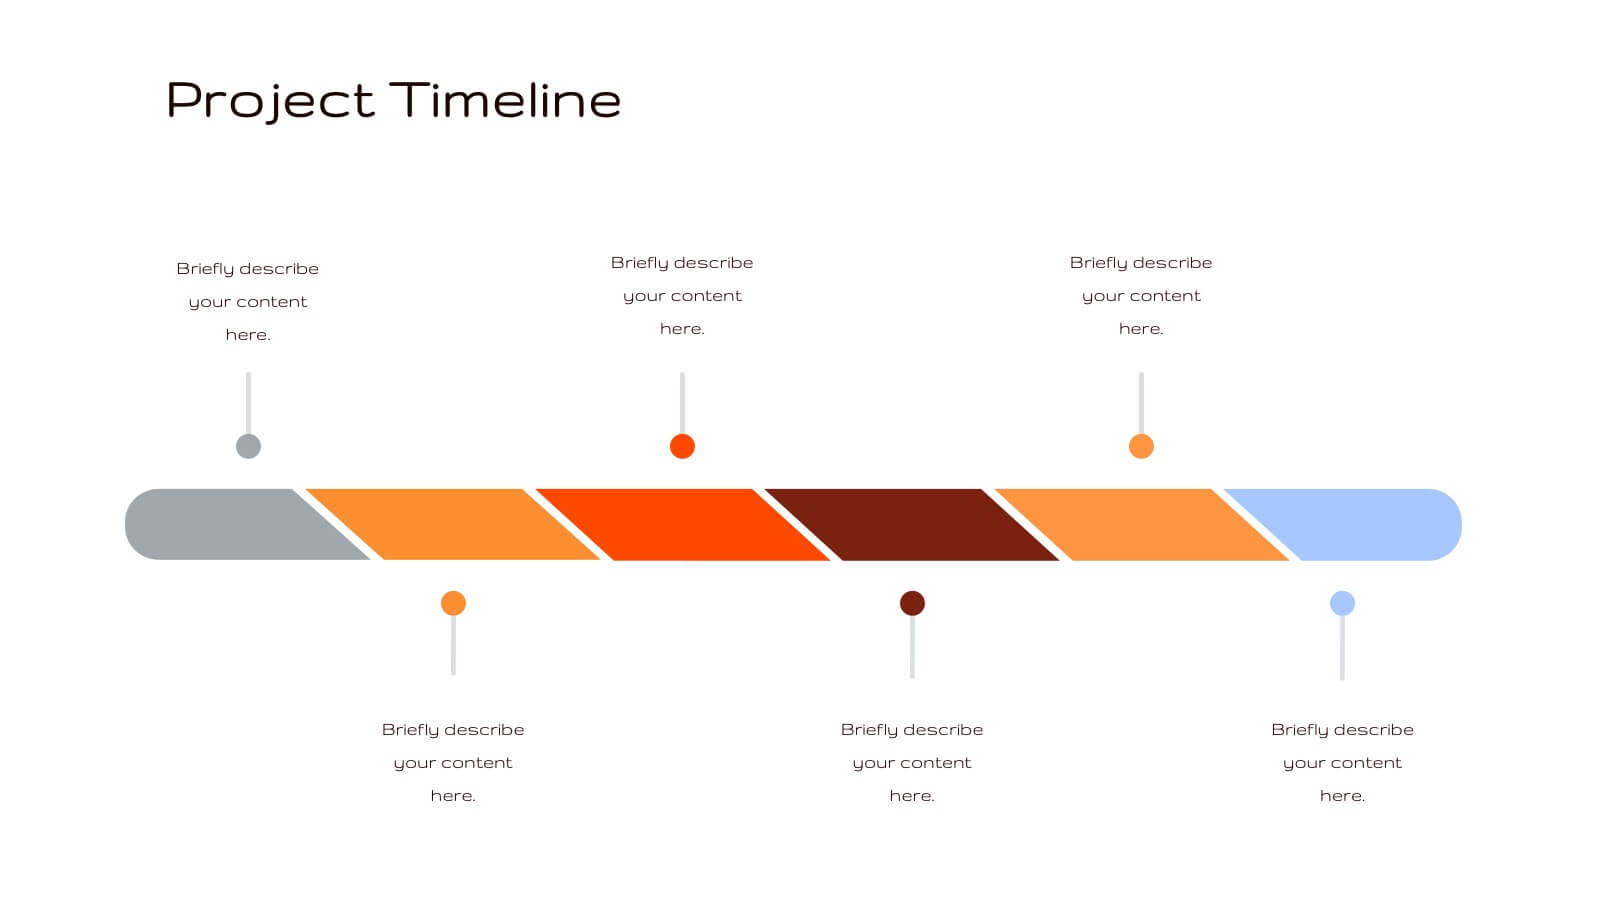
Radiance Creative Design Report Presentation
Bring your design ideas to life with this vibrant, engaging presentation template. Ideal for showcasing creative processes, concept development, and project timelines, it features a striking color palette and clean layout. This template is designed to captivate your audience and clearly communicate your design vision. Compatible with PowerPoint, Keynote, and Google Slides, it’s perfect for any platform.


4 diapositivas
Food Business Concept Pitch Presentation
Bring your culinary vision to life with the Food Business Concept Pitch Presentation. This unique avocado-shaped layout helps you outline up to four key ideas—from menu innovation to service strategy. Perfect for chefs, restaurateurs, or food startups. Fully editable in PowerPoint, Canva, and Google Slides for easy customization.


12 diapositivas
Customer Satisfaction Smile Rating Presentation
Measure customer happiness with this engaging customer satisfaction smile rating template! Featuring a visual scale from dissatisfaction to delight, this design helps businesses track feedback and identify improvement areas. Ideal for reports, surveys, and performance reviews. Fully customizable and compatible with PowerPoint, Keynote, and Google Slides.