


Características


¿Tienes alguna pregunta?
Recomendar


26 diapositivas
Entrepreneurship 101 Professional Presentation
This template offers a modern, professional framework for presentations about Entrepreneurship 101. It combines a clean, contemporary design with a palette of cool blues and muted reds, setting a tone that's both creative and serious—just right for the innovative spirit of entrepreneurship. Within its slides, you'll find all the tools needed to outline the essentials of starting a new business, from identifying opportunities to understanding market trends. Perfect for aspiring entrepreneurs, business school classes, or startup workshops, the template includes varied slide types: team introductions, big ideas, comparative analyses, and growth charts. The slides also feature infographics for brainstorming sessions, process flows for business operations, and timeline representations for strategic planning. Designed for adaptability, the template works seamlessly with PowerPoint, Keynote, and Google Slides, ensuring your entrepreneurial vision can be shared with clarity and impact.


34 diapositivas
Bootstrapping Pitch Deck
Introducing our Bootstrapping Pitch Deck presentation! This template is designed to help you create a compelling pitch deck for your startup or business. With its minimal and modern design, this template will help you communicate your approach and showcase your business to potential investors, partners, or stakeholders. The slides are designed with a minimalist layout that allows for easy comprehension and emphasizes the key points of your pitch. The visuals, such as charts, graphs, and icons, are strategically used to convey information in a visually engaging manner and support your key messages. This template is fully customizable.


5 diapositivas
Eco-Friendly Business Practices
Highlight sustainable strategies with this clean, eco-focused slide. Featuring a green triangle recycling loop with sprouting leaves, it's ideal for presenting environmental initiatives, green policies, or sustainability goals. Customize each section with your data to show actionable steps or impact metrics. Fully editable in PowerPoint, Keynote, and Google Slides.


7 diapositivas
Company Mission Infographic
The templates presented are tailored to elucidate the company's mission, blending aesthetic appeal with functional design to communicate core values and strategic objectives effectively. These slides are ideal for businesses looking to articulate their mission clearly and compellingly, ensuring alignment across all levels of the organization. Each slide in the collection is designed with precision, incorporating elements that highlight key aspects of the company’s ethos without overwhelming the viewer. The use of clean lines, minimalistic design, and coordinated color palettes emphasizes clarity and professionalism, making each slide both engaging and informative. These templates serve multiple purposes; they are perfect for enhancing corporate presentations, annual meetings, and strategic workshops. They help in broadcasting the foundational goals and the mission to new hires, potential investors, and external stakeholders. By presenting the mission in a visually cohesive and structured manner, these slides foster a unified understanding of what the company stands for. Customizable features allow these templates to be adapted to match specific branding requirements, making them a versatile tool in the corporate communication arsenal. They are not just slides but strategic tools that reinforce the company’s identity and commitment to its goals, serving as a cornerstone for building corporate identity and culture.


23 diapositivas
Artarix Business Development Proposal Presentation
Streamline your growth strategy with this modern and professional presentation template. Covering key elements such as collaboration opportunities, performance metrics, process improvement, and resource allocation, it provides a structured approach to business expansion. Fully customizable and compatible with PowerPoint, Keynote, and Google Slides for seamless editing.


4 diapositivas
Project Proposal Executive Summary Presentation
Optimize your project presentations with the 'Project Proposal Executive Summary' template. Crafted to clearly showcase your project’s most crucial elements, this template uses visuals and concise text to highlight objectives and deliverables effectively. Ideal for professionals preparing proposals in PowerPoint, Keynote, or Google Slides.


5 diapositivas
Healthcare Lifestyle Infographic
Maintaining a healthy lifestyle can prevent or manage many health problems and improve one's quality of life. These vertical infographics are an effective way to convey information about health and wellness to a wide audience. This infographic can be used to showcase statistics, health tips, and other information related to healthy living. It is a visually stunning and informative way to present important health and wellness information. This template includes special sections for showcasing key statistics and facts related to health and wellness, as well as tips for maintaining a healthy lifestyle.


8 diapositivas
Team Performance and Sports Analysis Presentation
Highlight team rankings and sports metrics with the Team Performance and Sports Analysis template. Featuring a dynamic race track-inspired layout with numbered positions, icons, and vivid color coding, it’s ideal for comparing performance. Fully customizable in Canva, PowerPoint, and Google Slides to match your sport, brand colors, and presentation goals.


4 diapositivas
Career Onboarding 30 60 90 Day Presentation
Start strong with a clean, uplifting layout that makes each milestone in the onboarding journey feel clear, motivating, and easy to follow. This presentation helps you outline expectations, track early progress, and communicate development goals with confidence and clarity. Fully editable and compatible with PowerPoint, Keynote, and Google Slides.


4 diapositivas
Fixed and Variable Cost Balance Presentation
Visualize cost distribution using a balanced scale metaphor. This presentation helps compare fixed and variable costs with editable sections for data input. Ideal for financial planning, budgeting, or cost control analysis. Fully customizable in PowerPoint, Keynote, and Google Slides to match any brand or business presentation style.


6 diapositivas
Geographic Asia Overview Template Presentation
Discover insights across Asia with a clean, professional layout that brings your regional data to life. Perfect for showcasing demographics, market distribution, or geographic highlights, this visual map design ensures clarity and impact in every slide. Fully compatible with PowerPoint, Keynote, and Google Slides for effortless editing and presentation.


7 diapositivas
Technology Consulting Infographic
Technology consulting, also known as IT consulting or tech consulting, involves providing expert advice and guidance to organizations regarding their technology strategy, utilization, and optimization. This infographic template provides a compelling way to illustrate complex concepts, strategies, and data related to technology consulting. Fully customizable and compatible with Powerpoint, Keynote, and Google Slides. The sleek, modern design reflects the cutting-edge nature of technology and consulting services. This infographic is your go-to tool for creating presentations that showcase your technology consulting expertise.


4 diapositivas
Effective Team Communication
Break down communication impact with this data-driven walkie-talkie infographic. Perfect for showing percentage-based contributions, roles, or workflow efficiency across teams. Fully customizable in PowerPoint, Keynote, and Google Slides.


10 diapositivas
Digital Device Showcase Presentation
Bring your content to life with a bold, modern slide that spotlights digital devices in a clean, eye-catching layout. This presentation helps you introduce product features, showcase app designs, or highlight tech concepts with clarity and style. Fully editable and easy to use, it works seamlessly in PowerPoint, Keynote, and Google Slides.


20 diapositivas
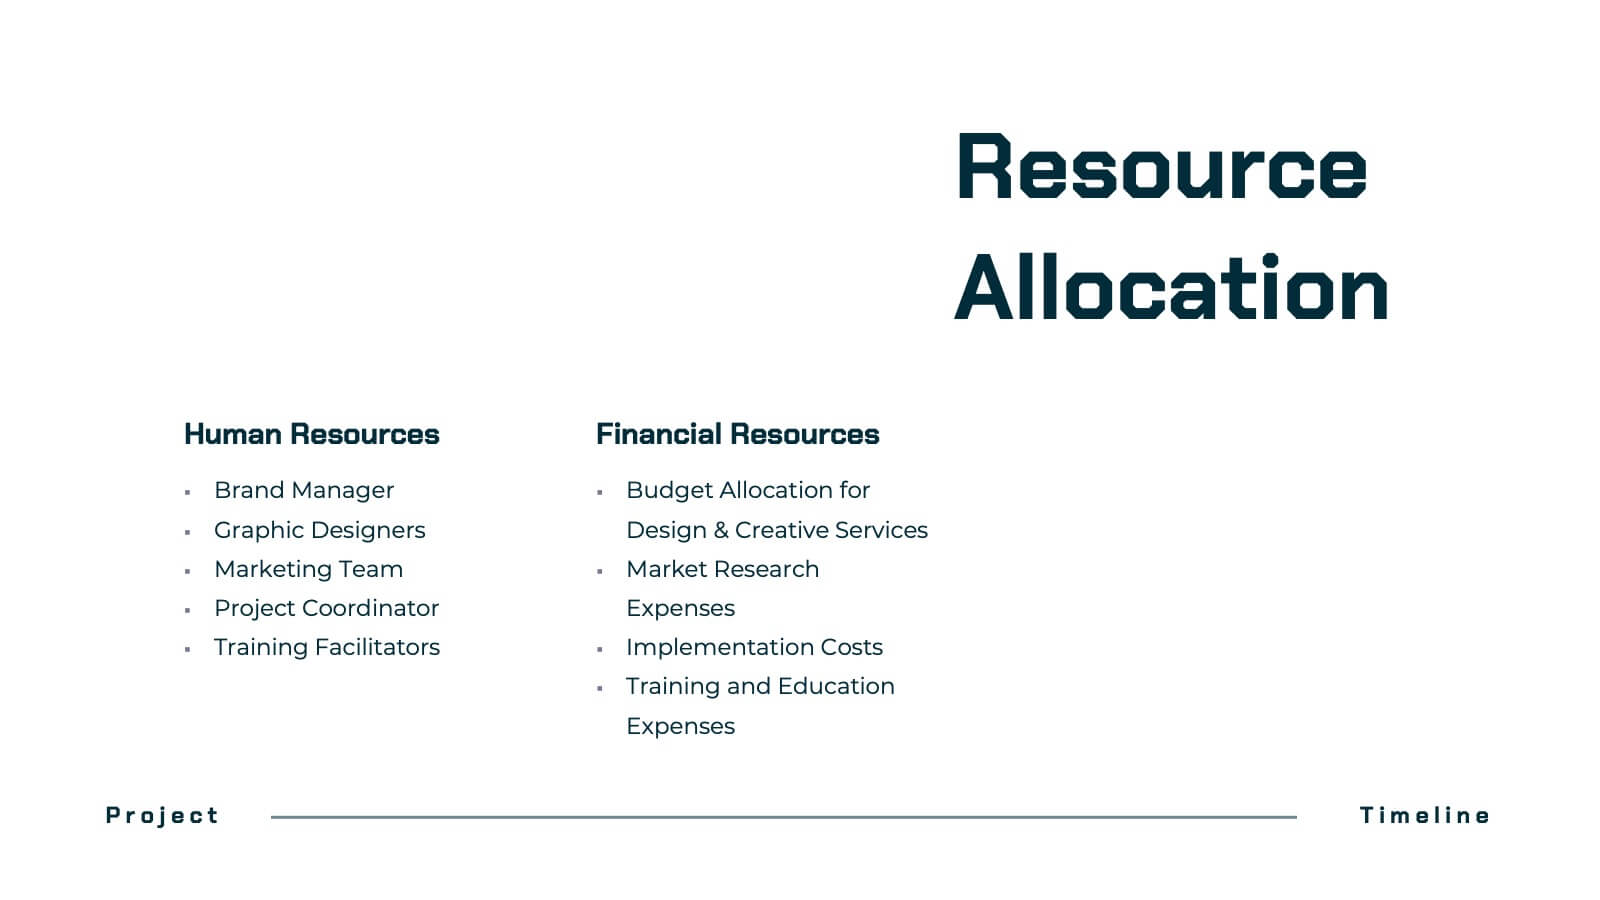
Dynastream Project Timeline Presentation
Stay on track with this detailed and well-organized project plan presentation designed for success! Covering essential areas like scope, objectives, timeline, budget breakdown, and risk management, it ensures every aspect of your project is clear and actionable. Perfect for team meetings or stakeholder updates, this template is fully compatible with PowerPoint, Keynote, and Google Slides.


10 diapositivas
Stakeholder Analysis Matrix Presentation
Spark interest from the very first slide with a clean, engaging layout designed to simplify complex relationships. This presentation helps you outline stakeholder influence, priorities, and engagement levels in a clear, structured way that supports better project decisions. Fully compatible with PowerPoint, Keynote, and Google Slides.


5 diapositivas
Strategic HR Planning with Skills Gap Analysis Presentation
Supercharge your strategic HR planning with our 'Skills Gap Analysis' presentation template. This tool is designed to help you visualize and address the skills gaps within your organization efficiently. Engage your team with clear, data-driven insights that foster targeted development plans. Compatible with PowerPoint, Keynote, and Google Slides, it's the perfect addition to your HR toolkit.