


Características


¿Tienes alguna pregunta?
Recomendar


5 diapositivas
Topic Organization with Bubble Mapping Presentation
Easily structure complex information with the Topic Organization with Bubble Mapping Presentation. This visually engaging layout uses a central idea with grouped supporting elements, making it perfect for brainstorming, mind mapping, or topic clustering. Fully editable in PowerPoint, Keynote, or Google Slides—ideal for educators, strategists, and project teams.


6 diapositivas
State-by-State Business Distribution Map Presentation
Visualize regional performance with this State-by-State Business Distribution Map template. Ideal for showcasing business coverage, sales territories, or demographic trends across the U.S. Each state is color-coded for clarity, with editable text and icons. Fully compatible with PowerPoint, Keynote, and Google Slides—perfect for executives, marketers, or analysts.


5 diapositivas
Business Success Case Study Presentation
Showcase impactful results with the Business Success Case Study Presentation template. This structured layout highlights key milestones, challenges, and solutions in a visually engaging format, making it perfect for demonstrating business achievements and growth strategies. Fully editable and compatible with PowerPoint, Keynote, and Google Slides, it’s ideal for case studies, reports, and business reviews.


5 diapositivas
Enterprise Risk Management Framework Presentation
Visualize your organization’s risk strategy with the Enterprise Risk Management Framework Presentation. This slide outlines four core steps—Set Objective, Identify Risks, Assess Risks, and Risk Response—using a clear, directional design. Perfect for risk assessments, board updates, or audit reviews. Fully editable in PowerPoint, Google Slides, and Canva.


5 diapositivas
Overcoming Strategic Business Challenges Presentation
Break down complex obstacles with this step-by-step "Overcoming Strategic Business Challenges" presentation. Featuring a stair-like 3D visual with figures symbolizing progress and setbacks, each slide is divided into four clear milestones. Ideal for showcasing pain points, strategic pivots, or recovery plans. Customize each step with your insights in PowerPoint, Keynote, or Google Slides.


8 diapositivas
Lean Business Model Canvas Framework Presentation
Visualize your entire business strategy on a single slide with this Lean Business Model Canvas. Ideal for startups or strategic planning, each editable block represents a key area: value propositions, customer segments, revenue, and more. Streamlined and clear, it's perfect for team alignment or investor-ready business model pitches.
22 diapositivas
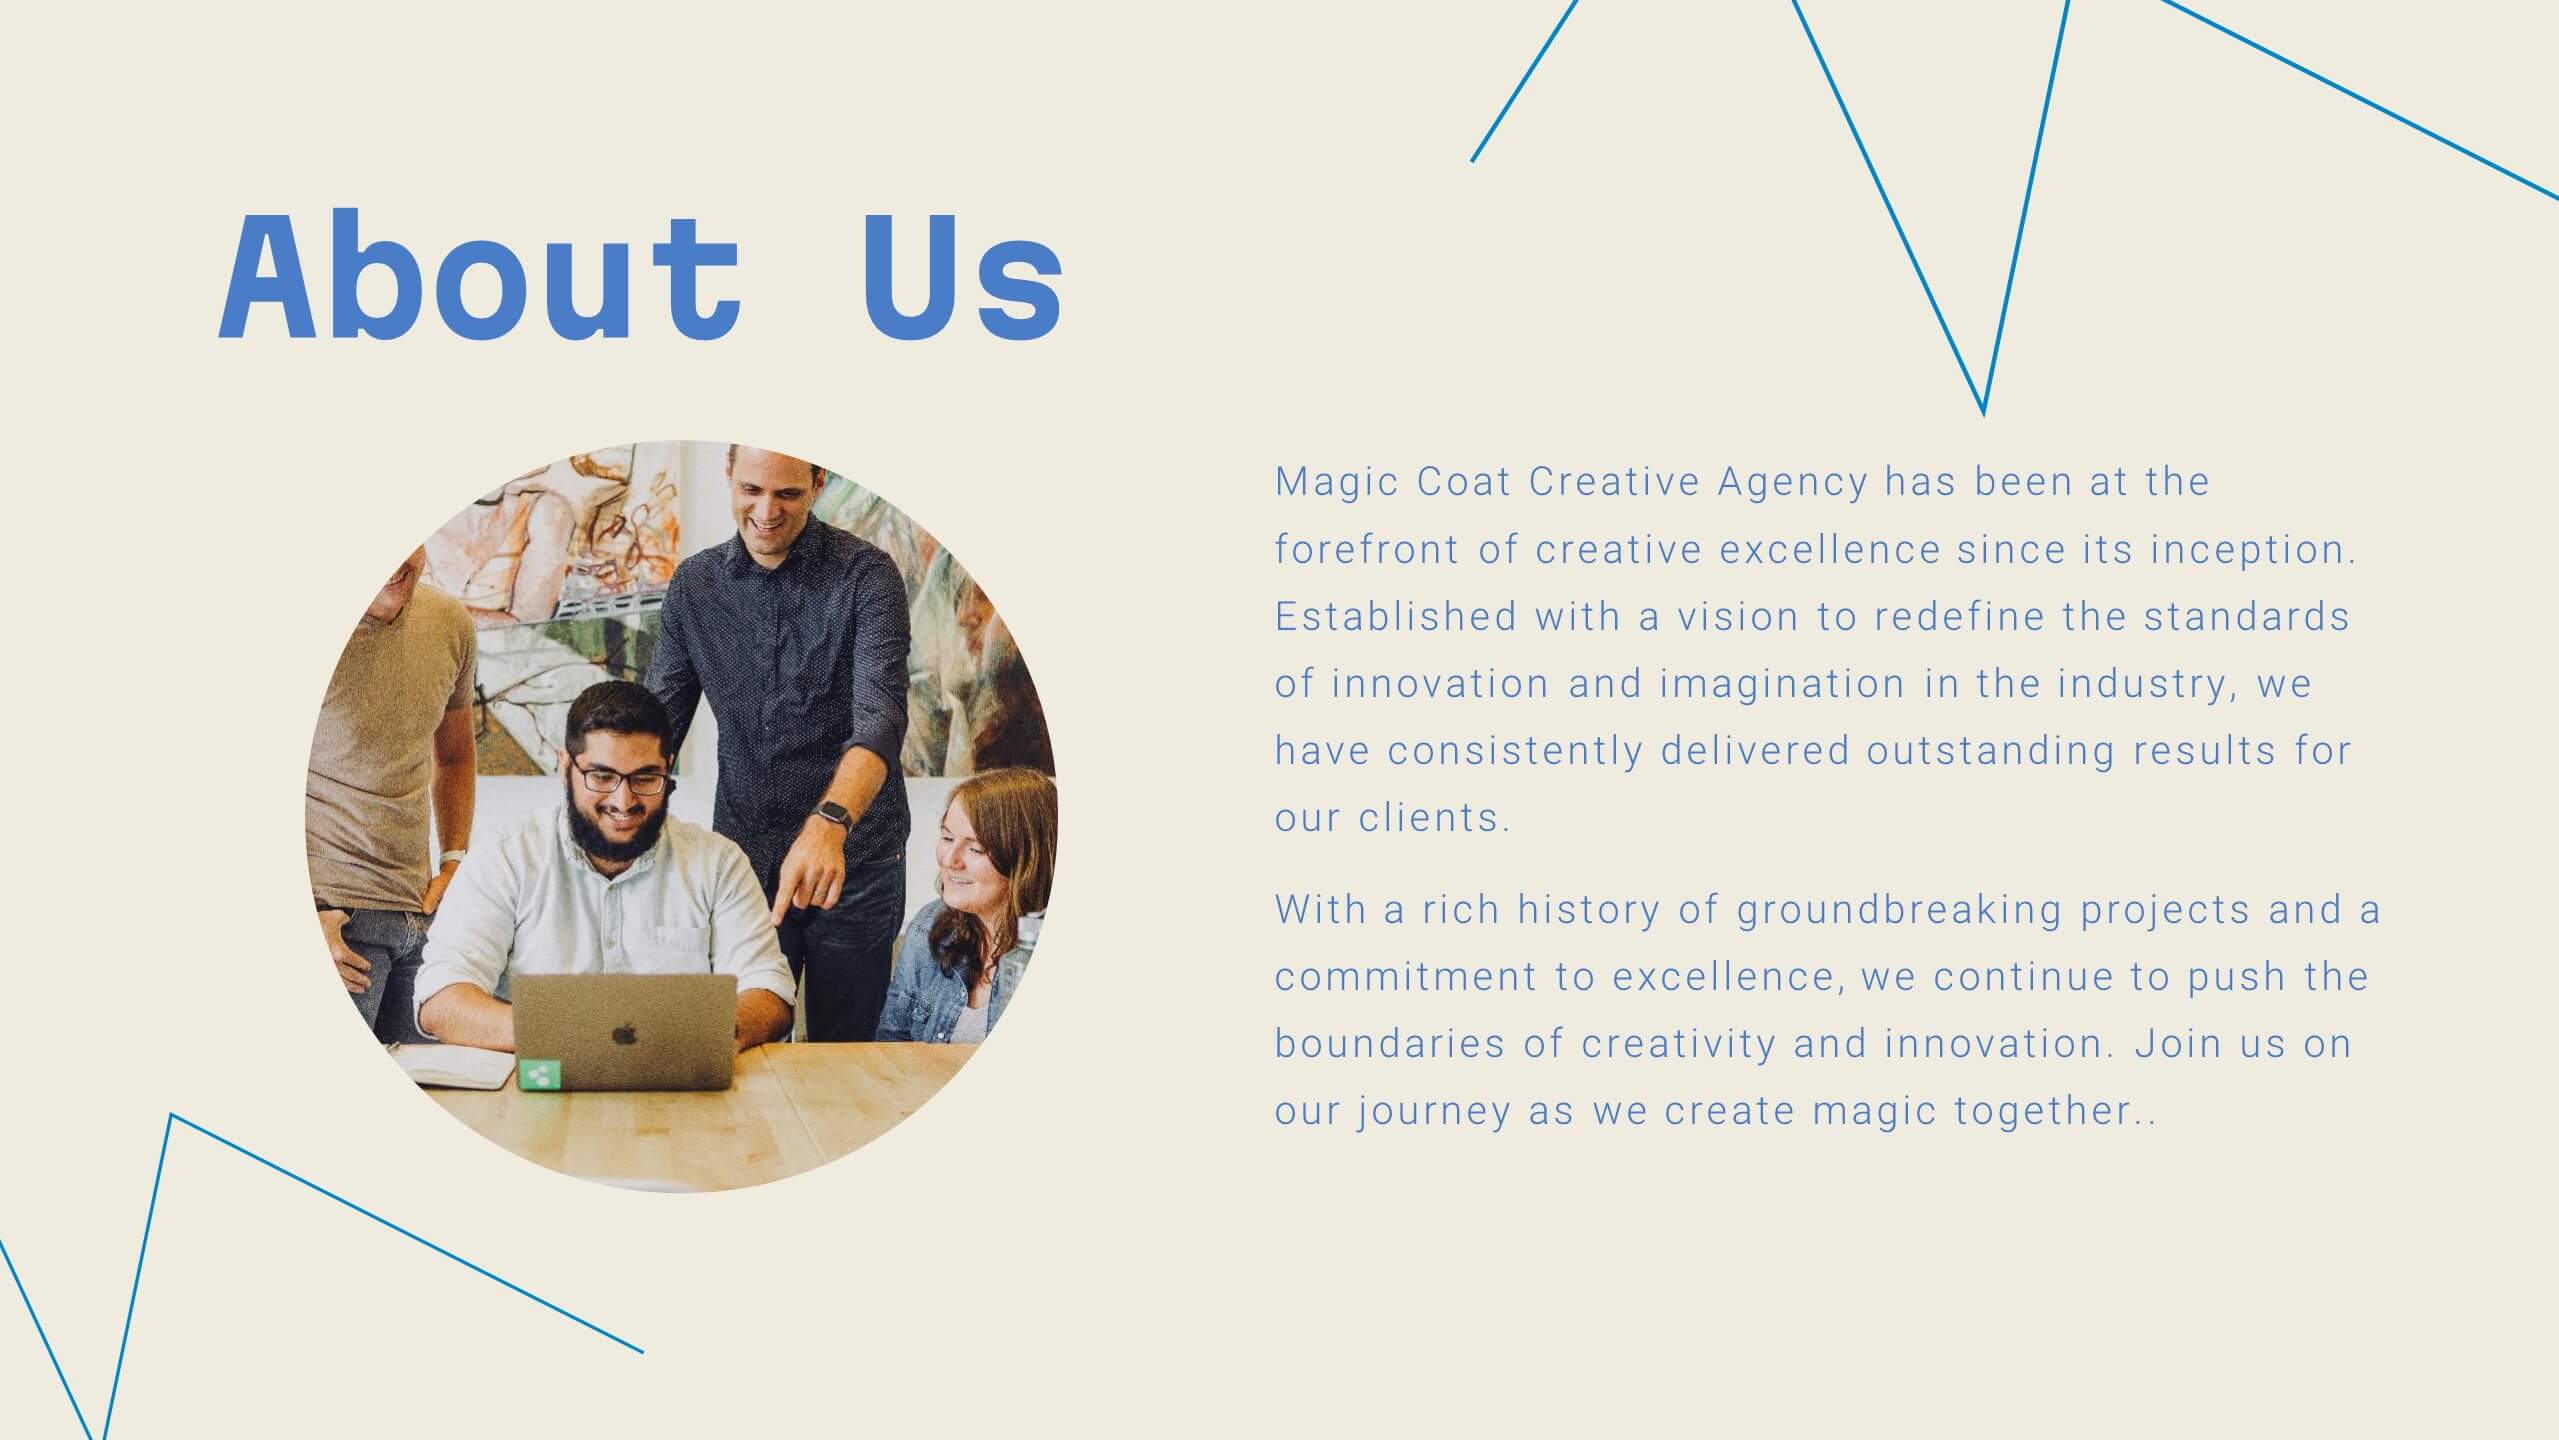
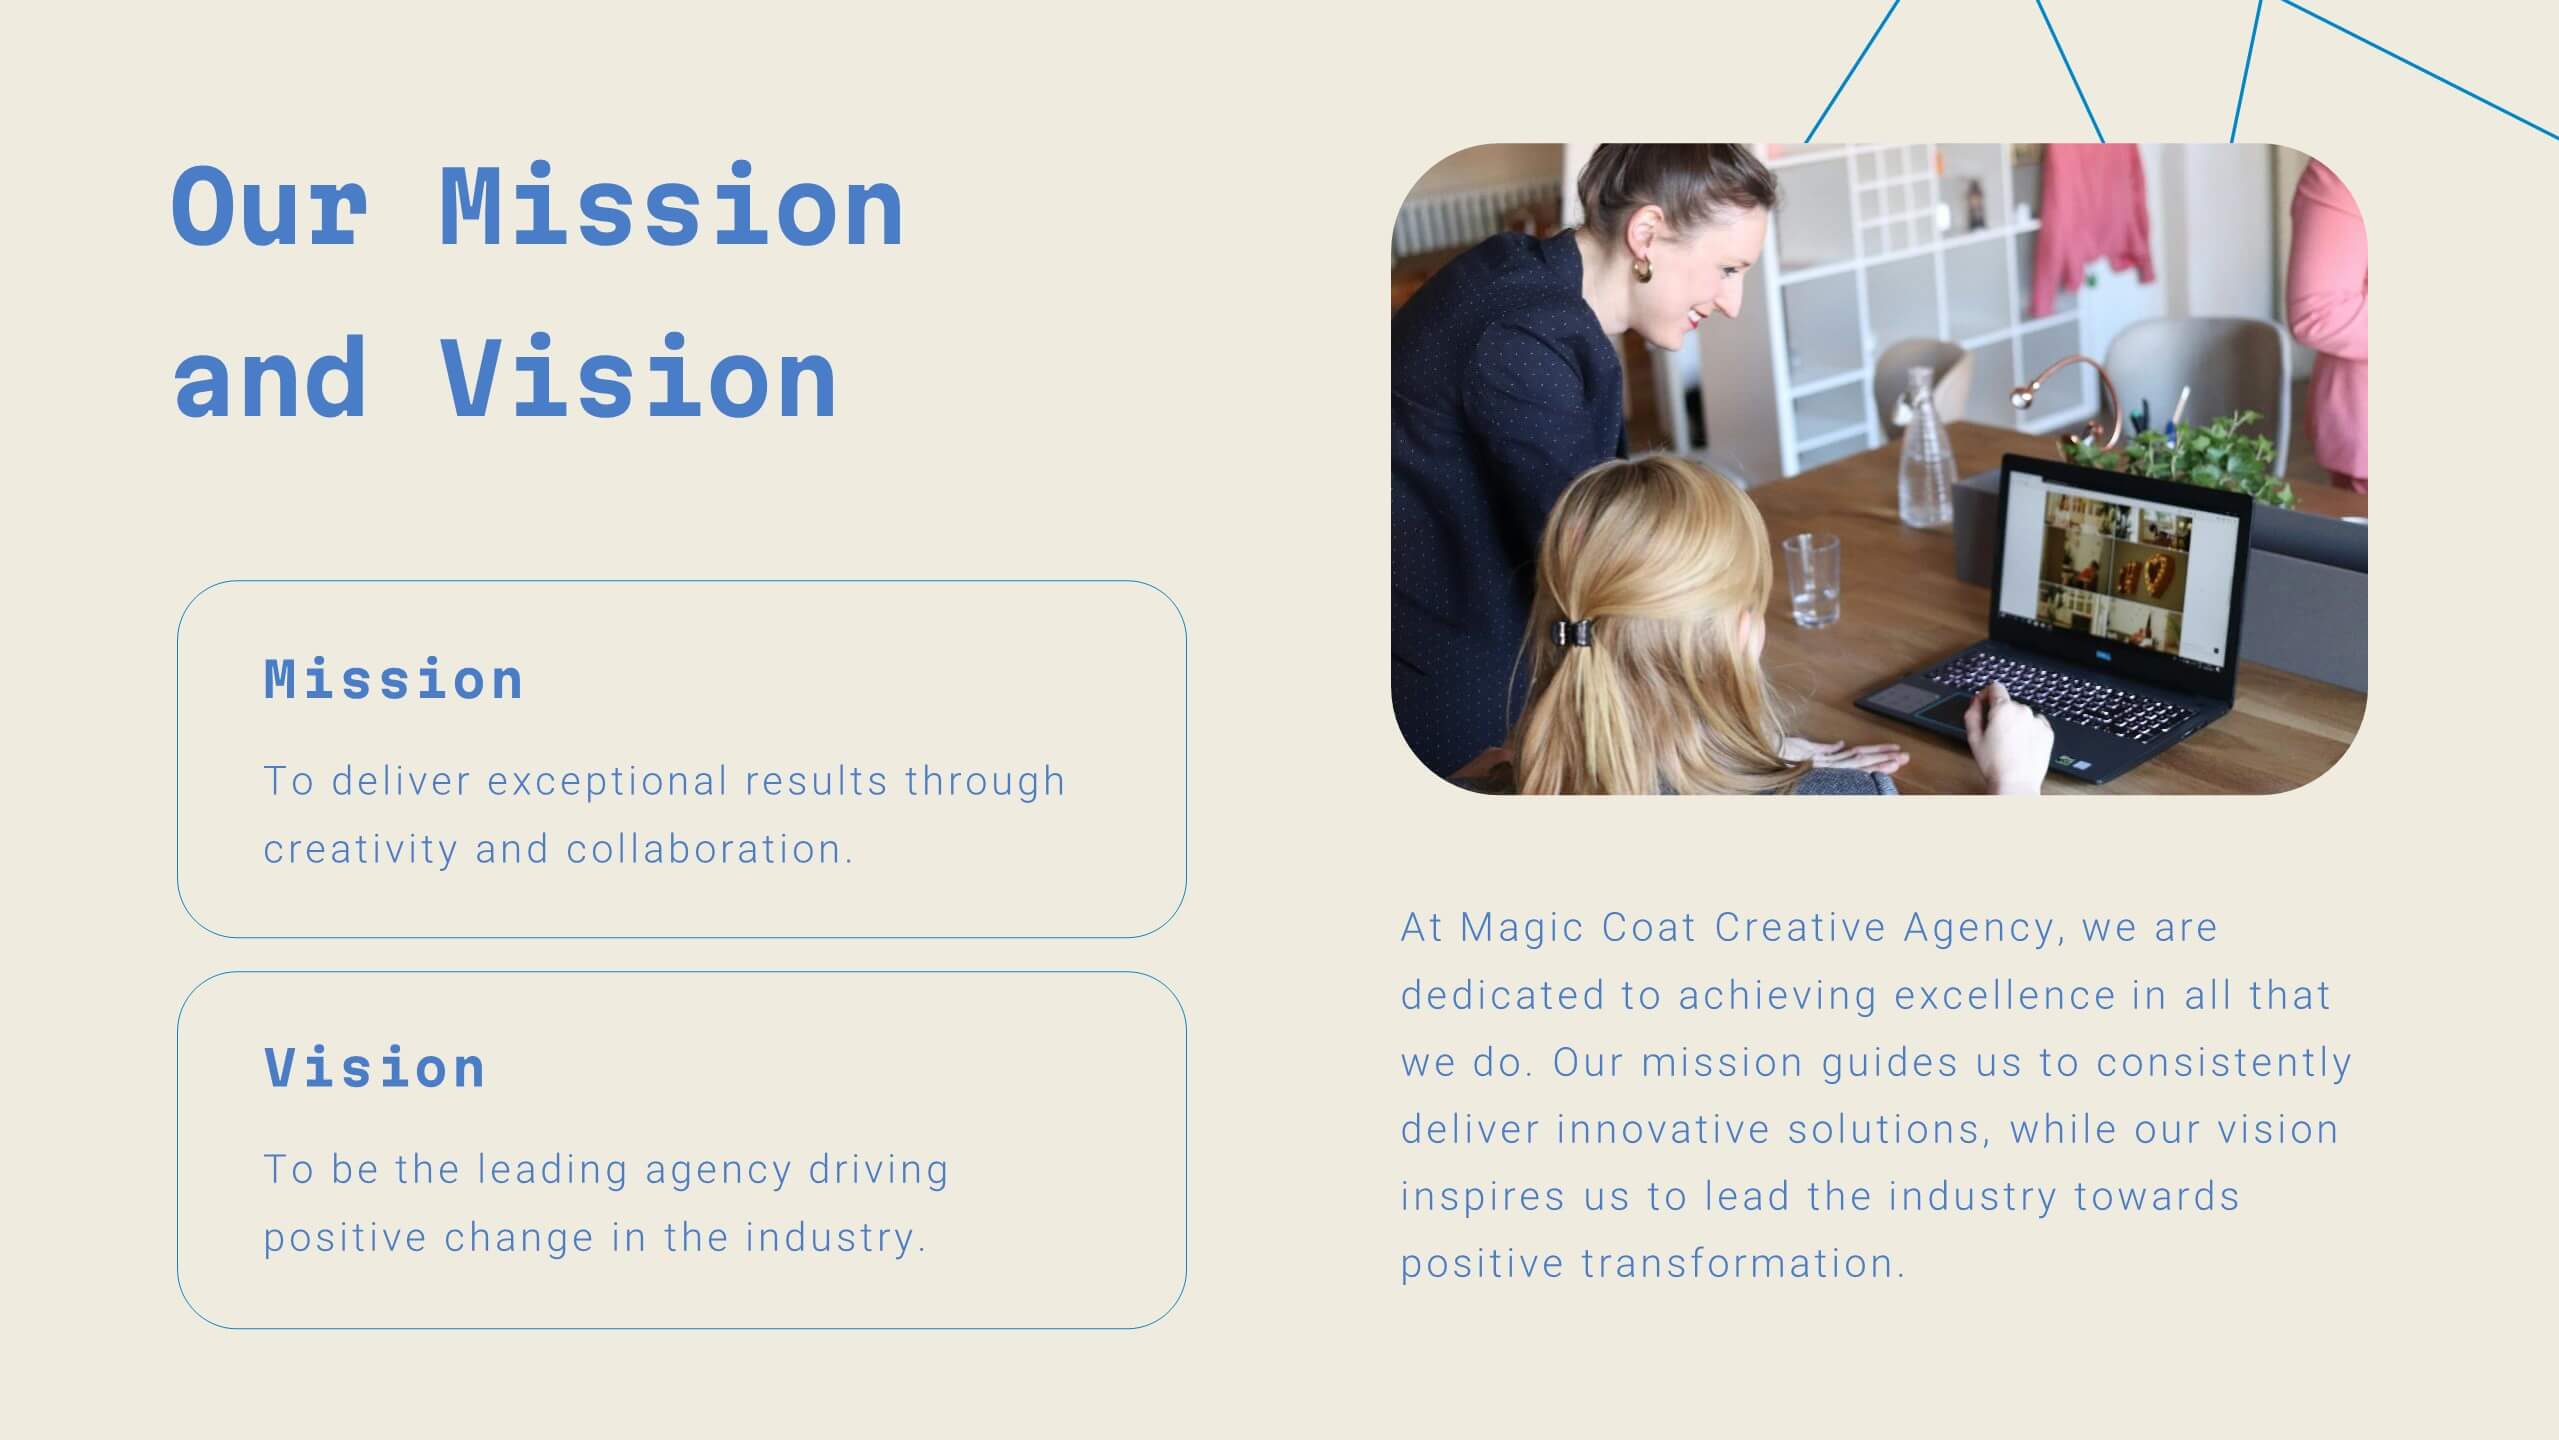
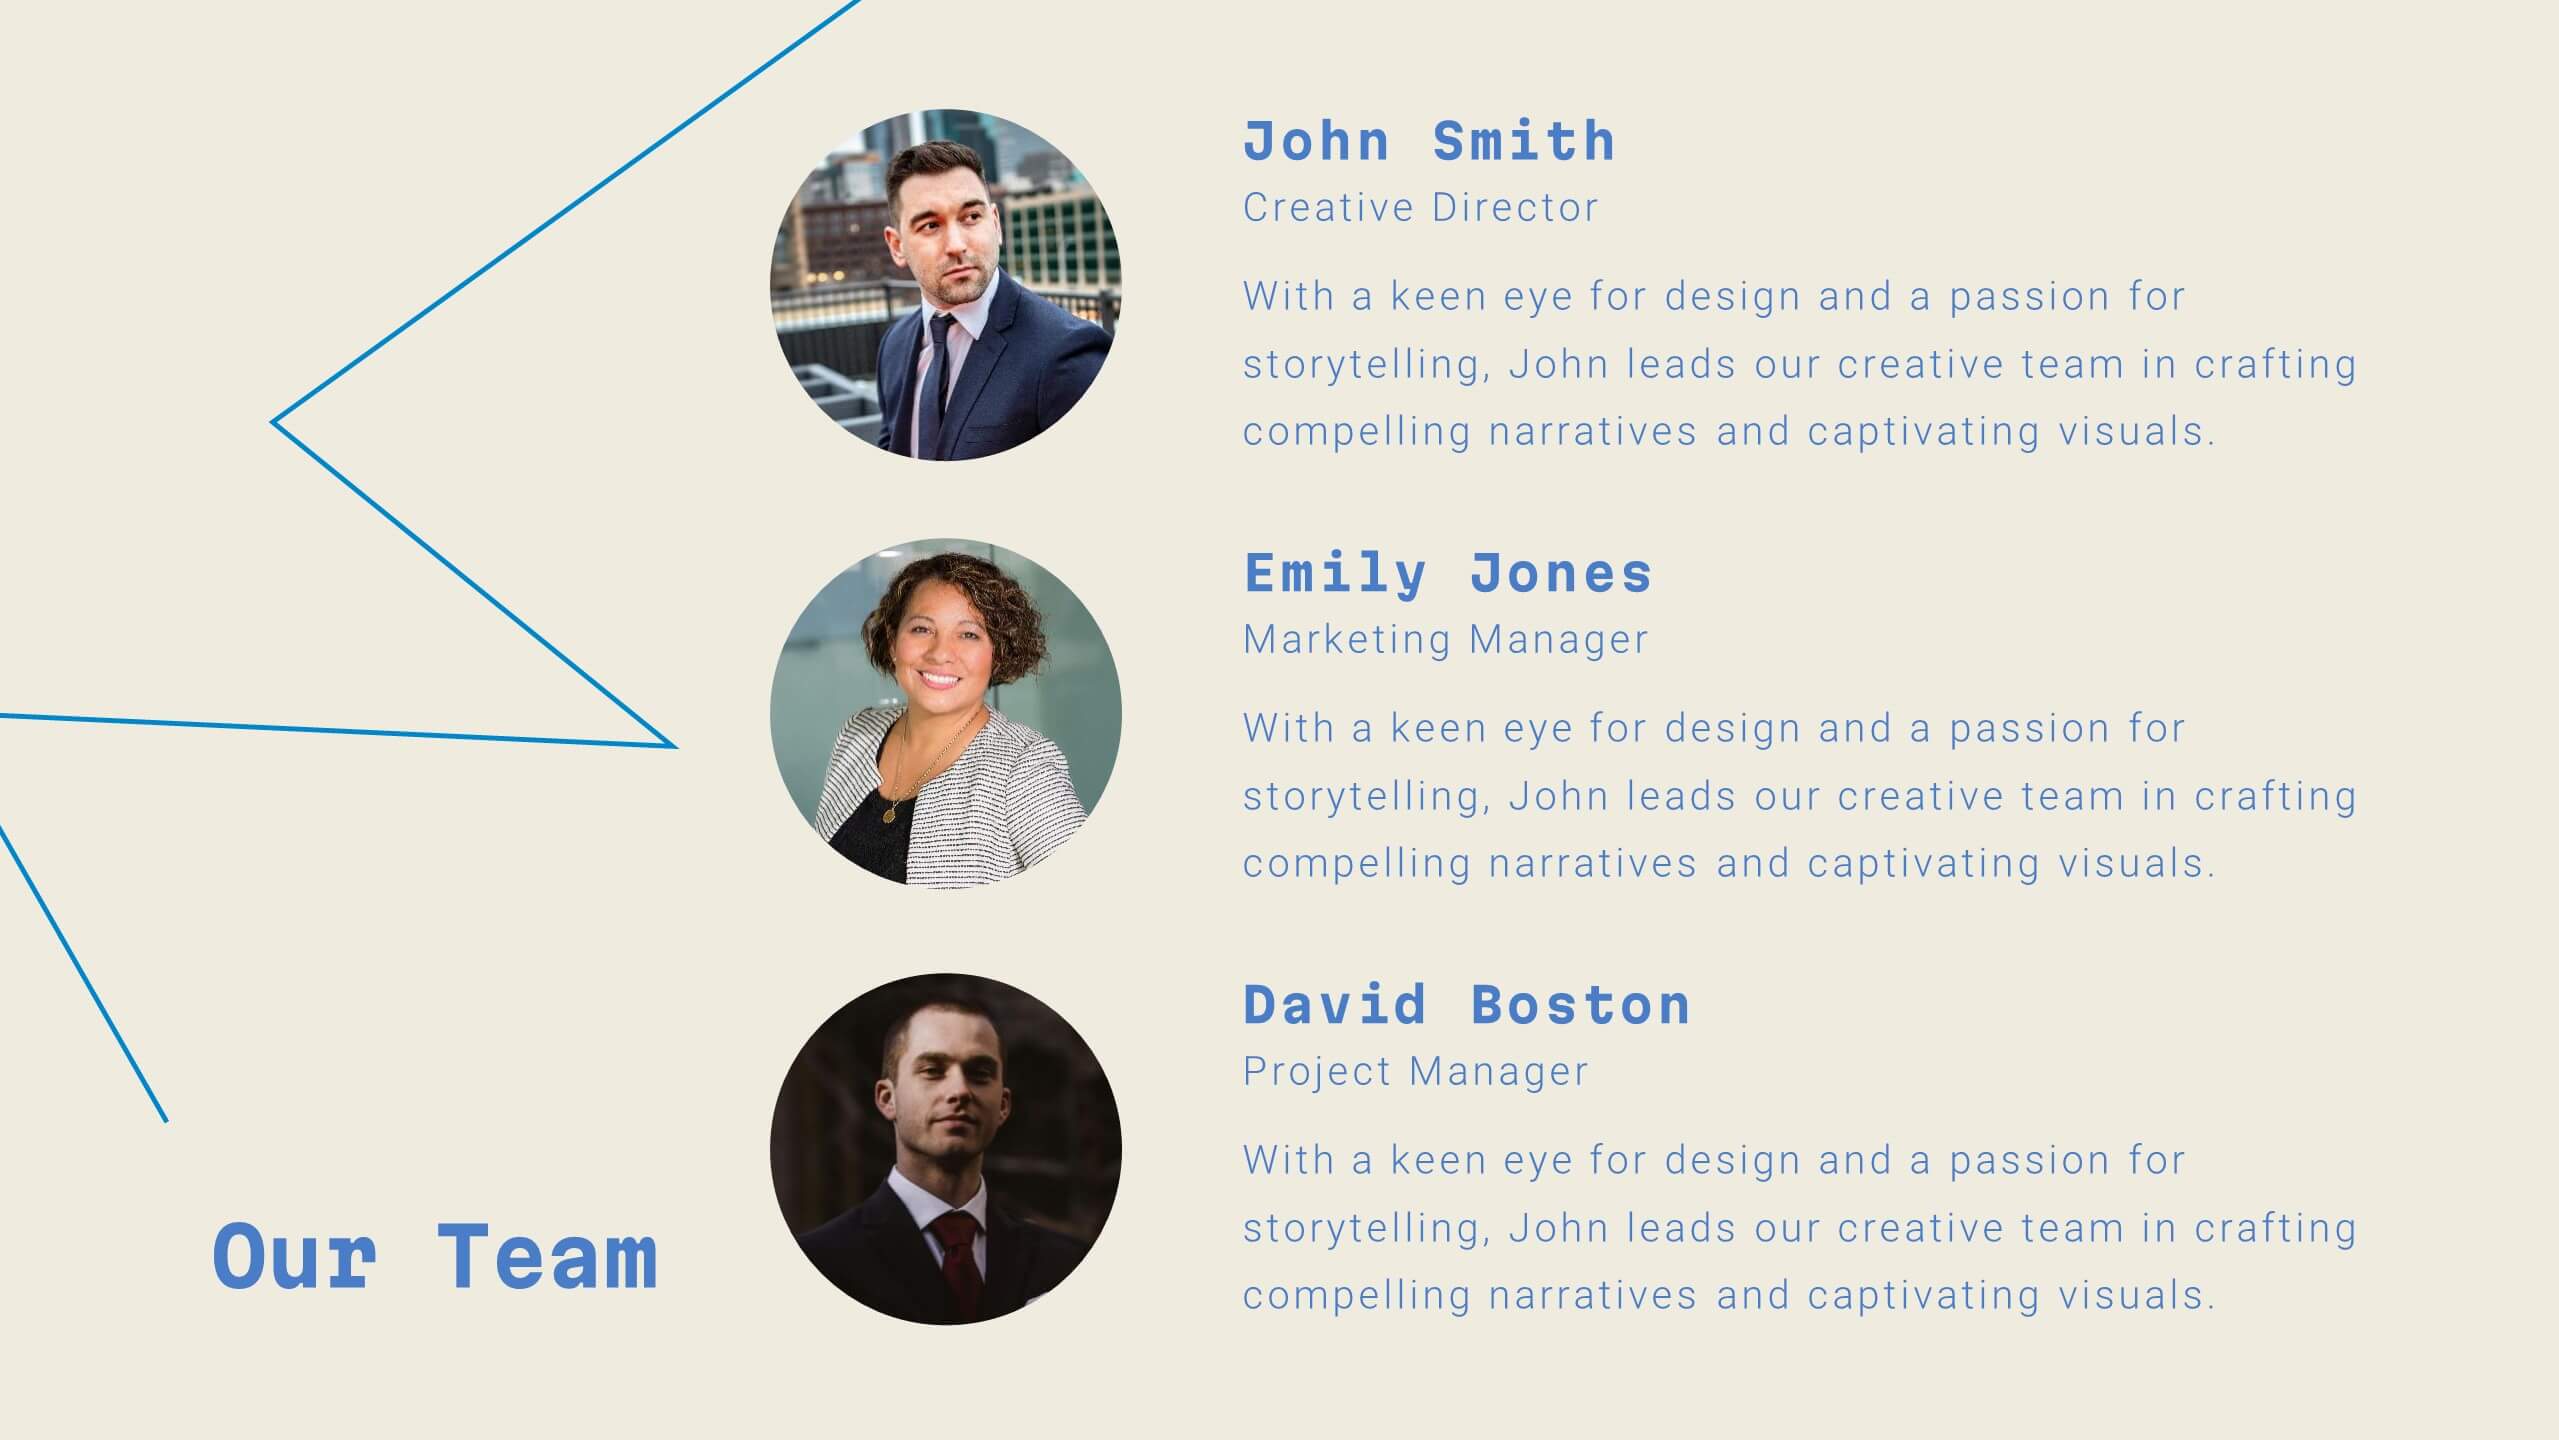
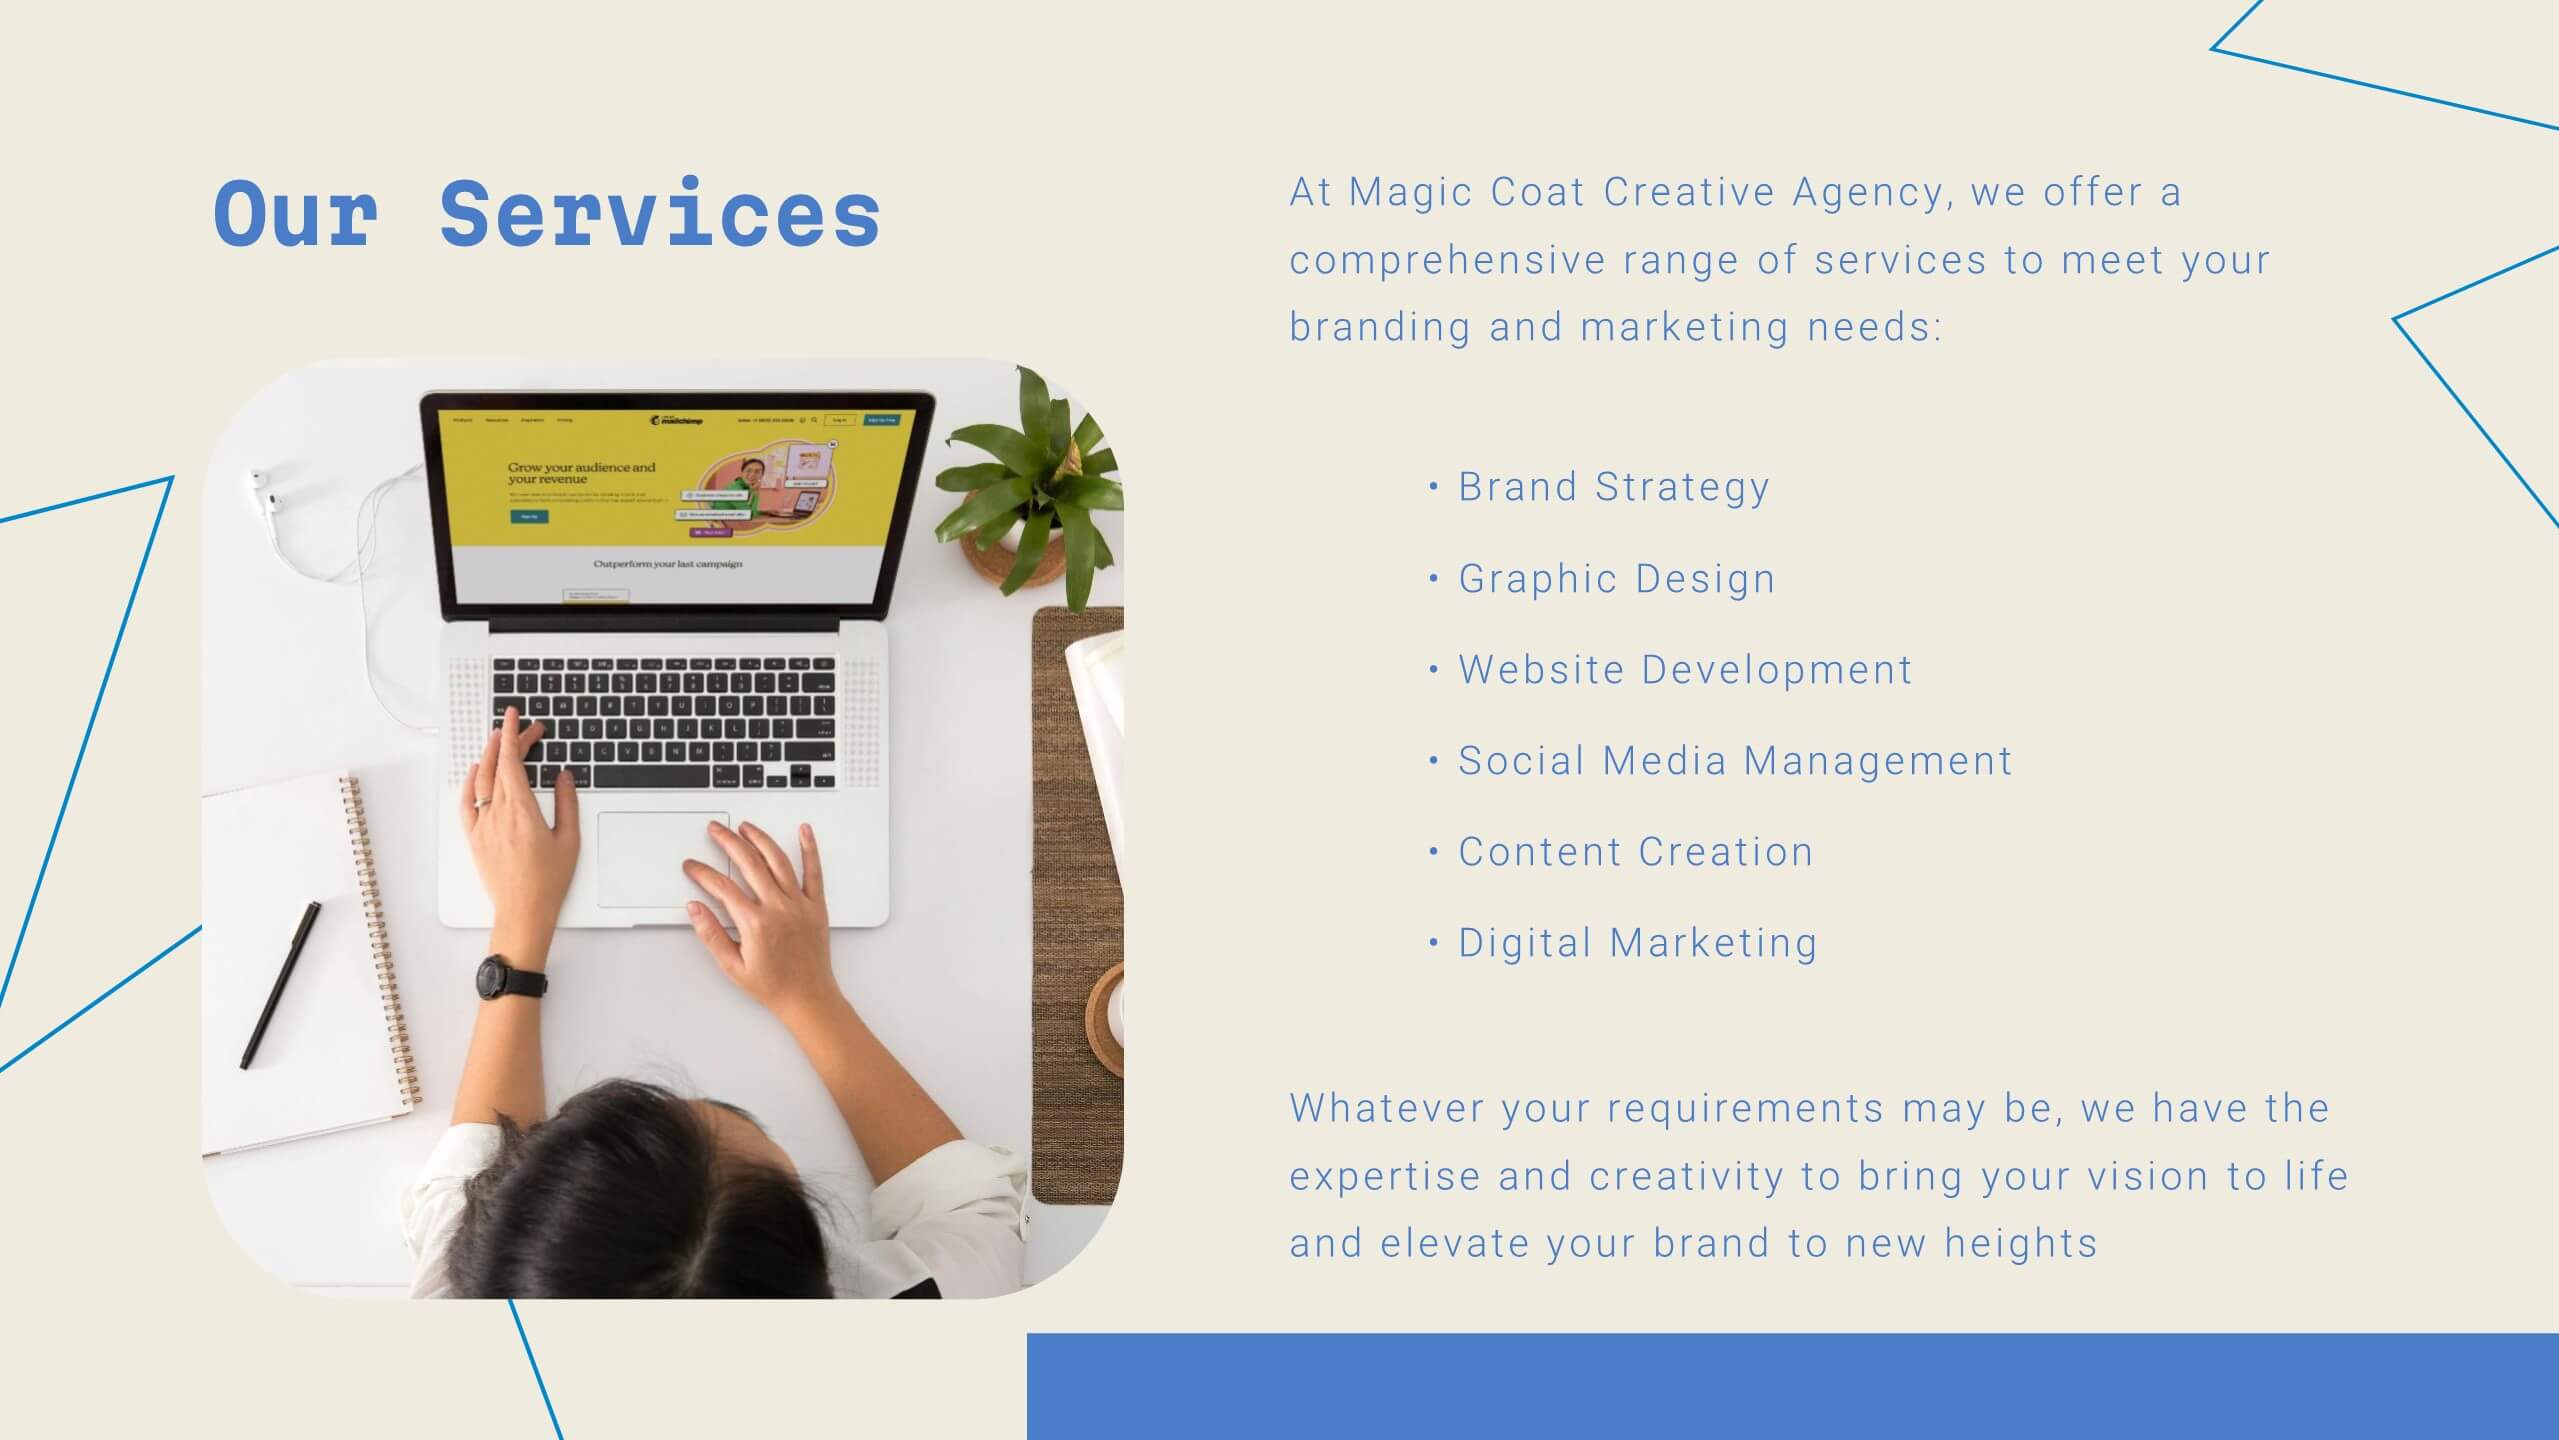
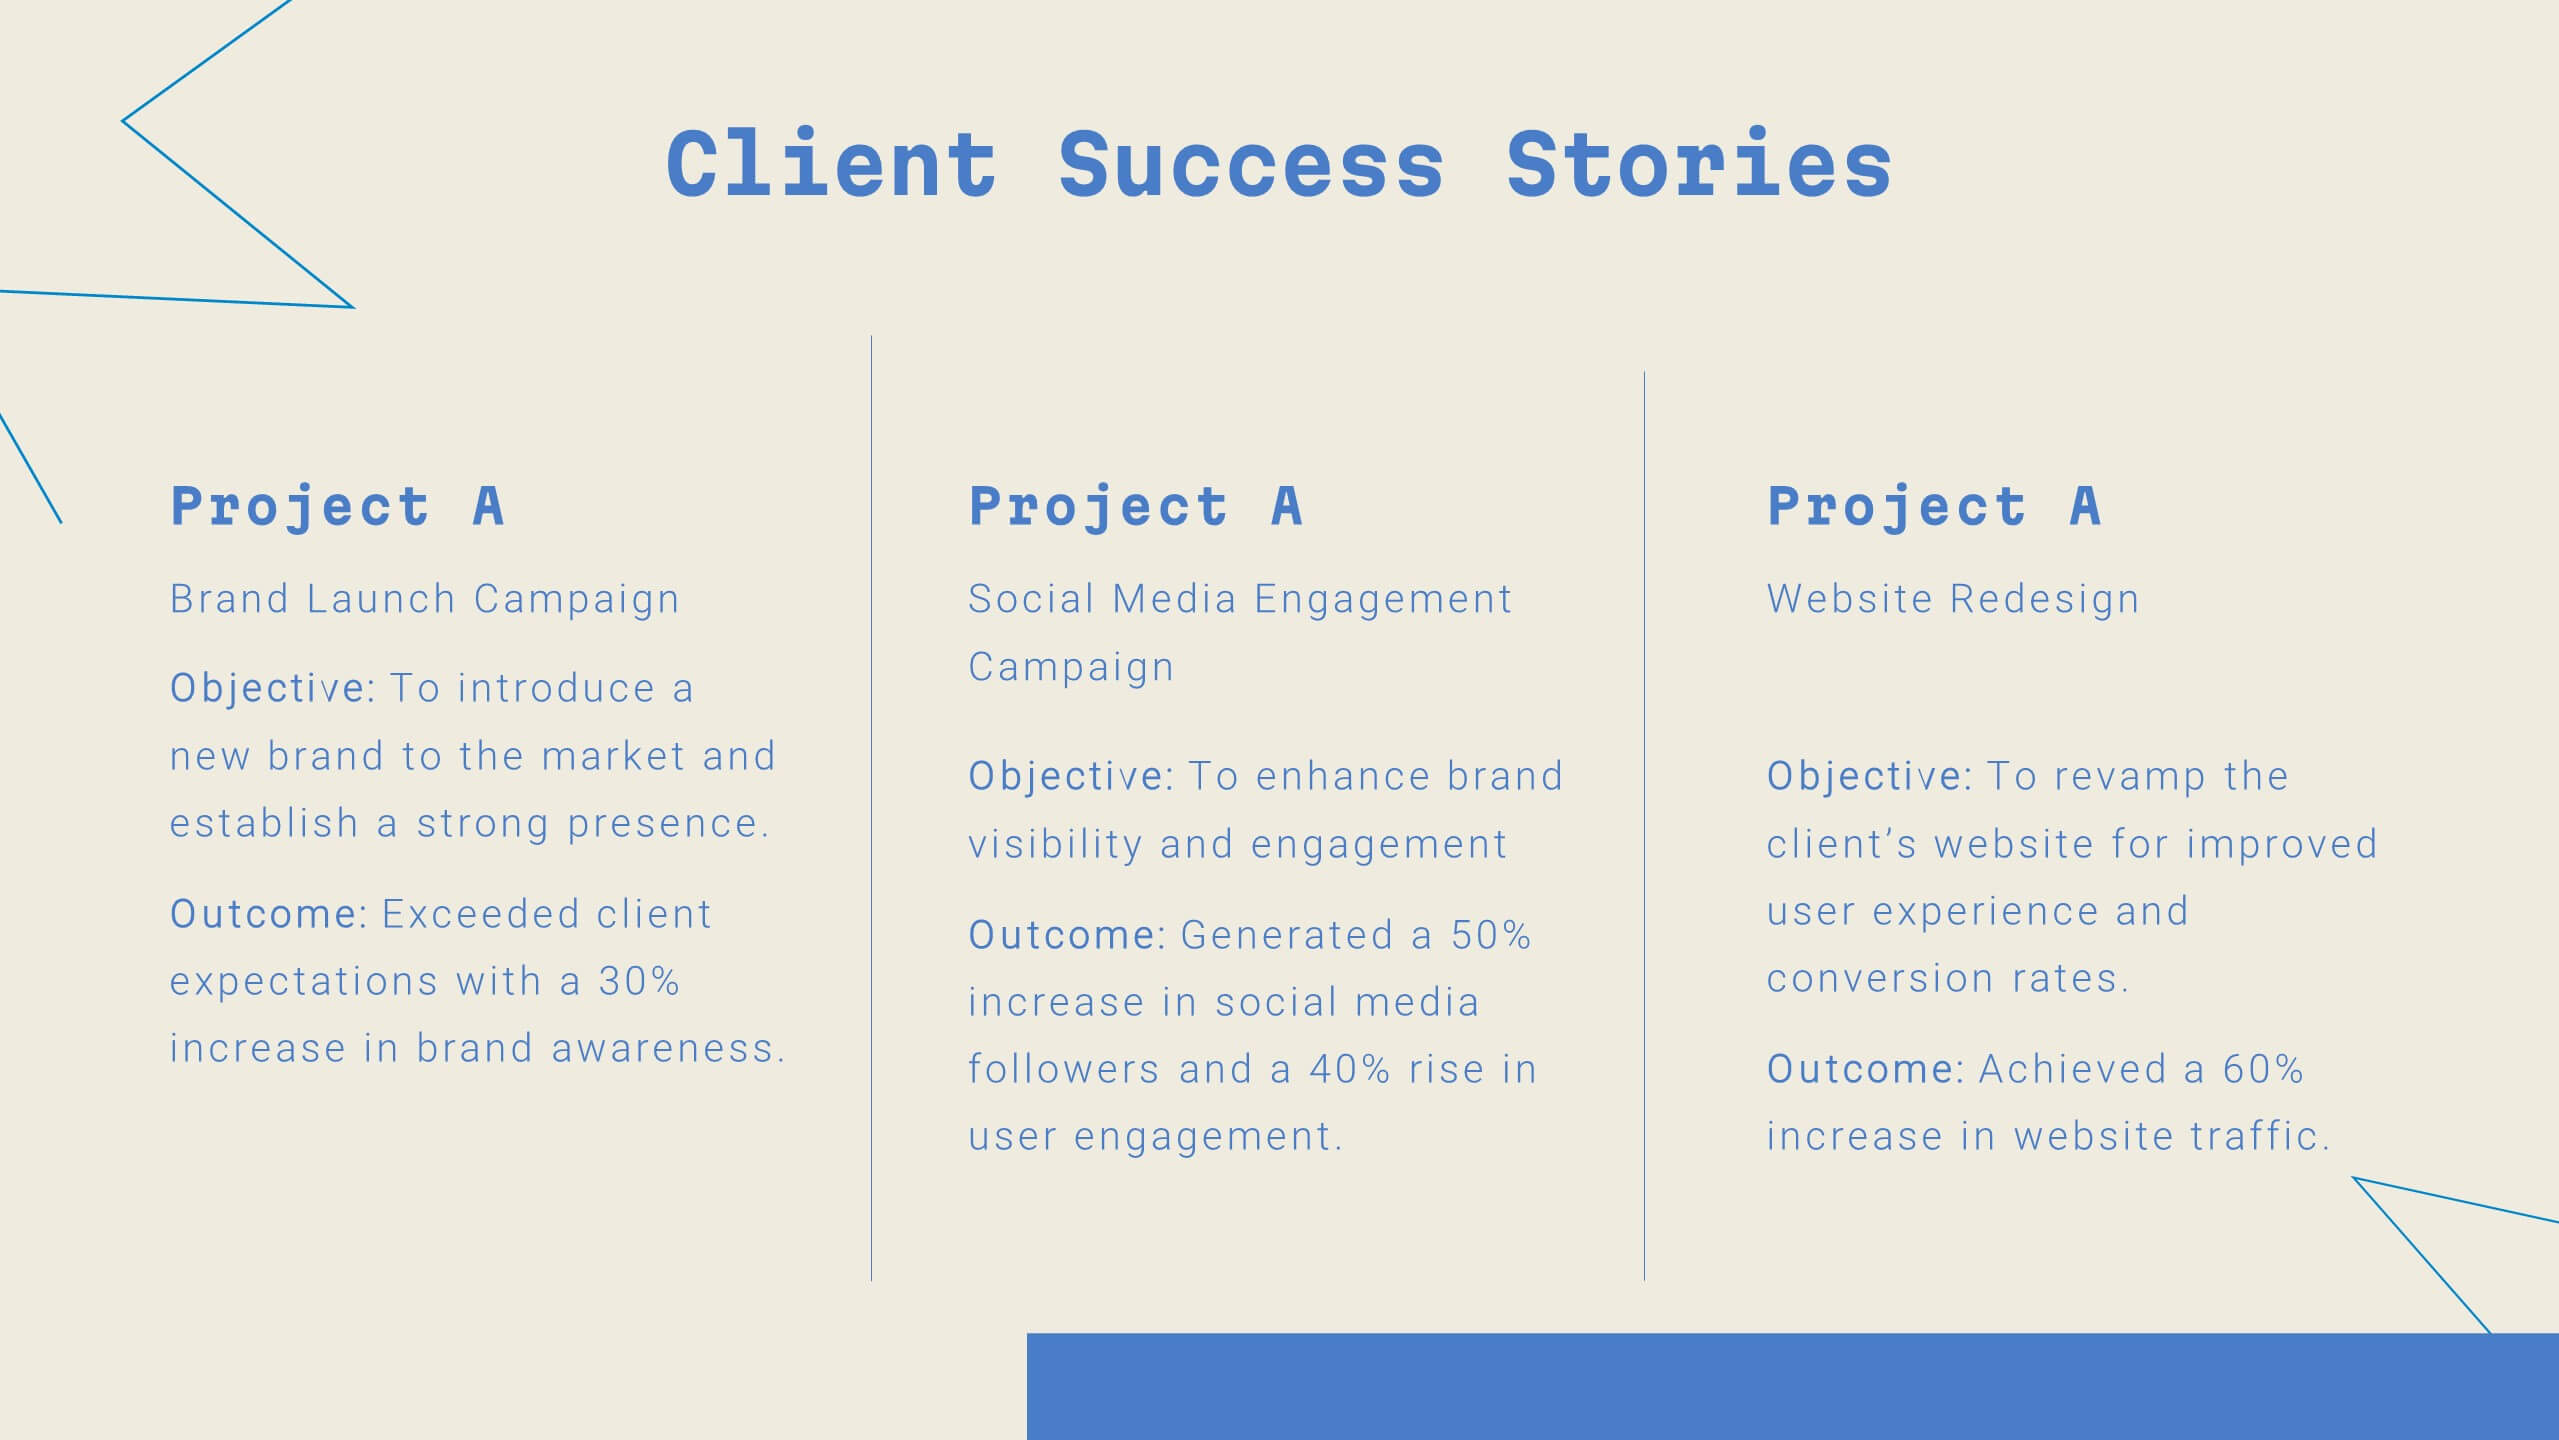
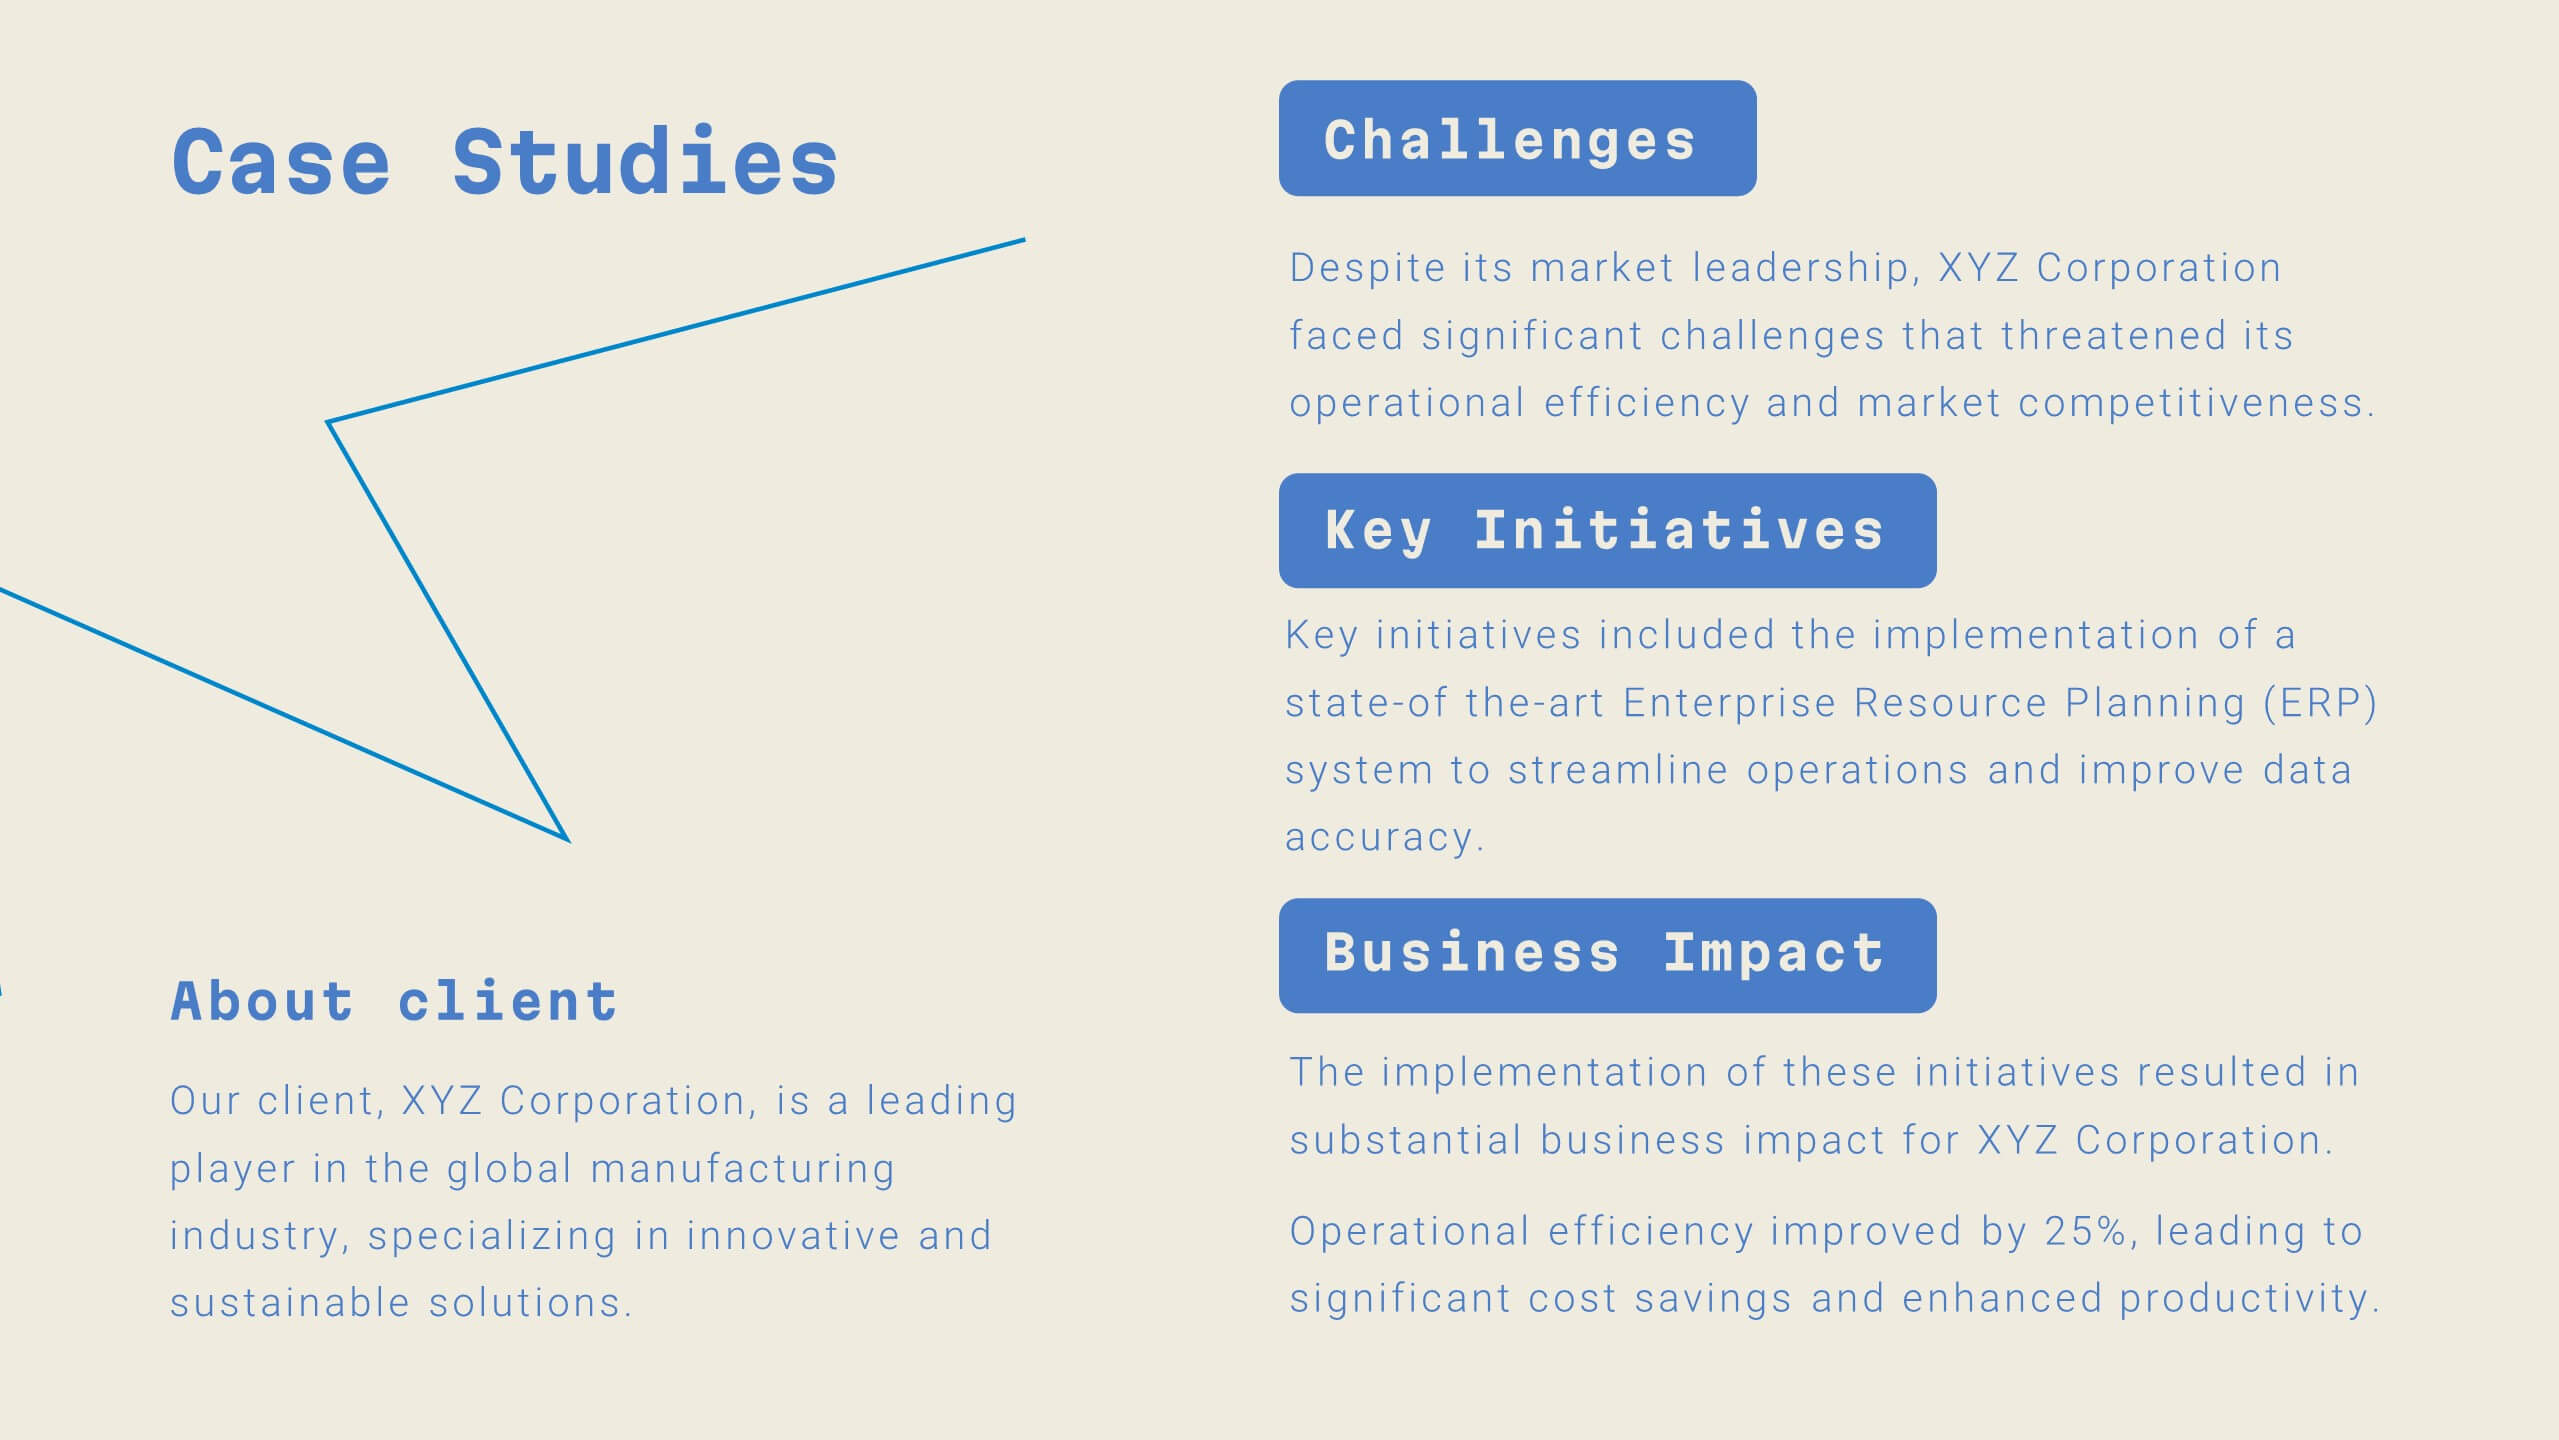
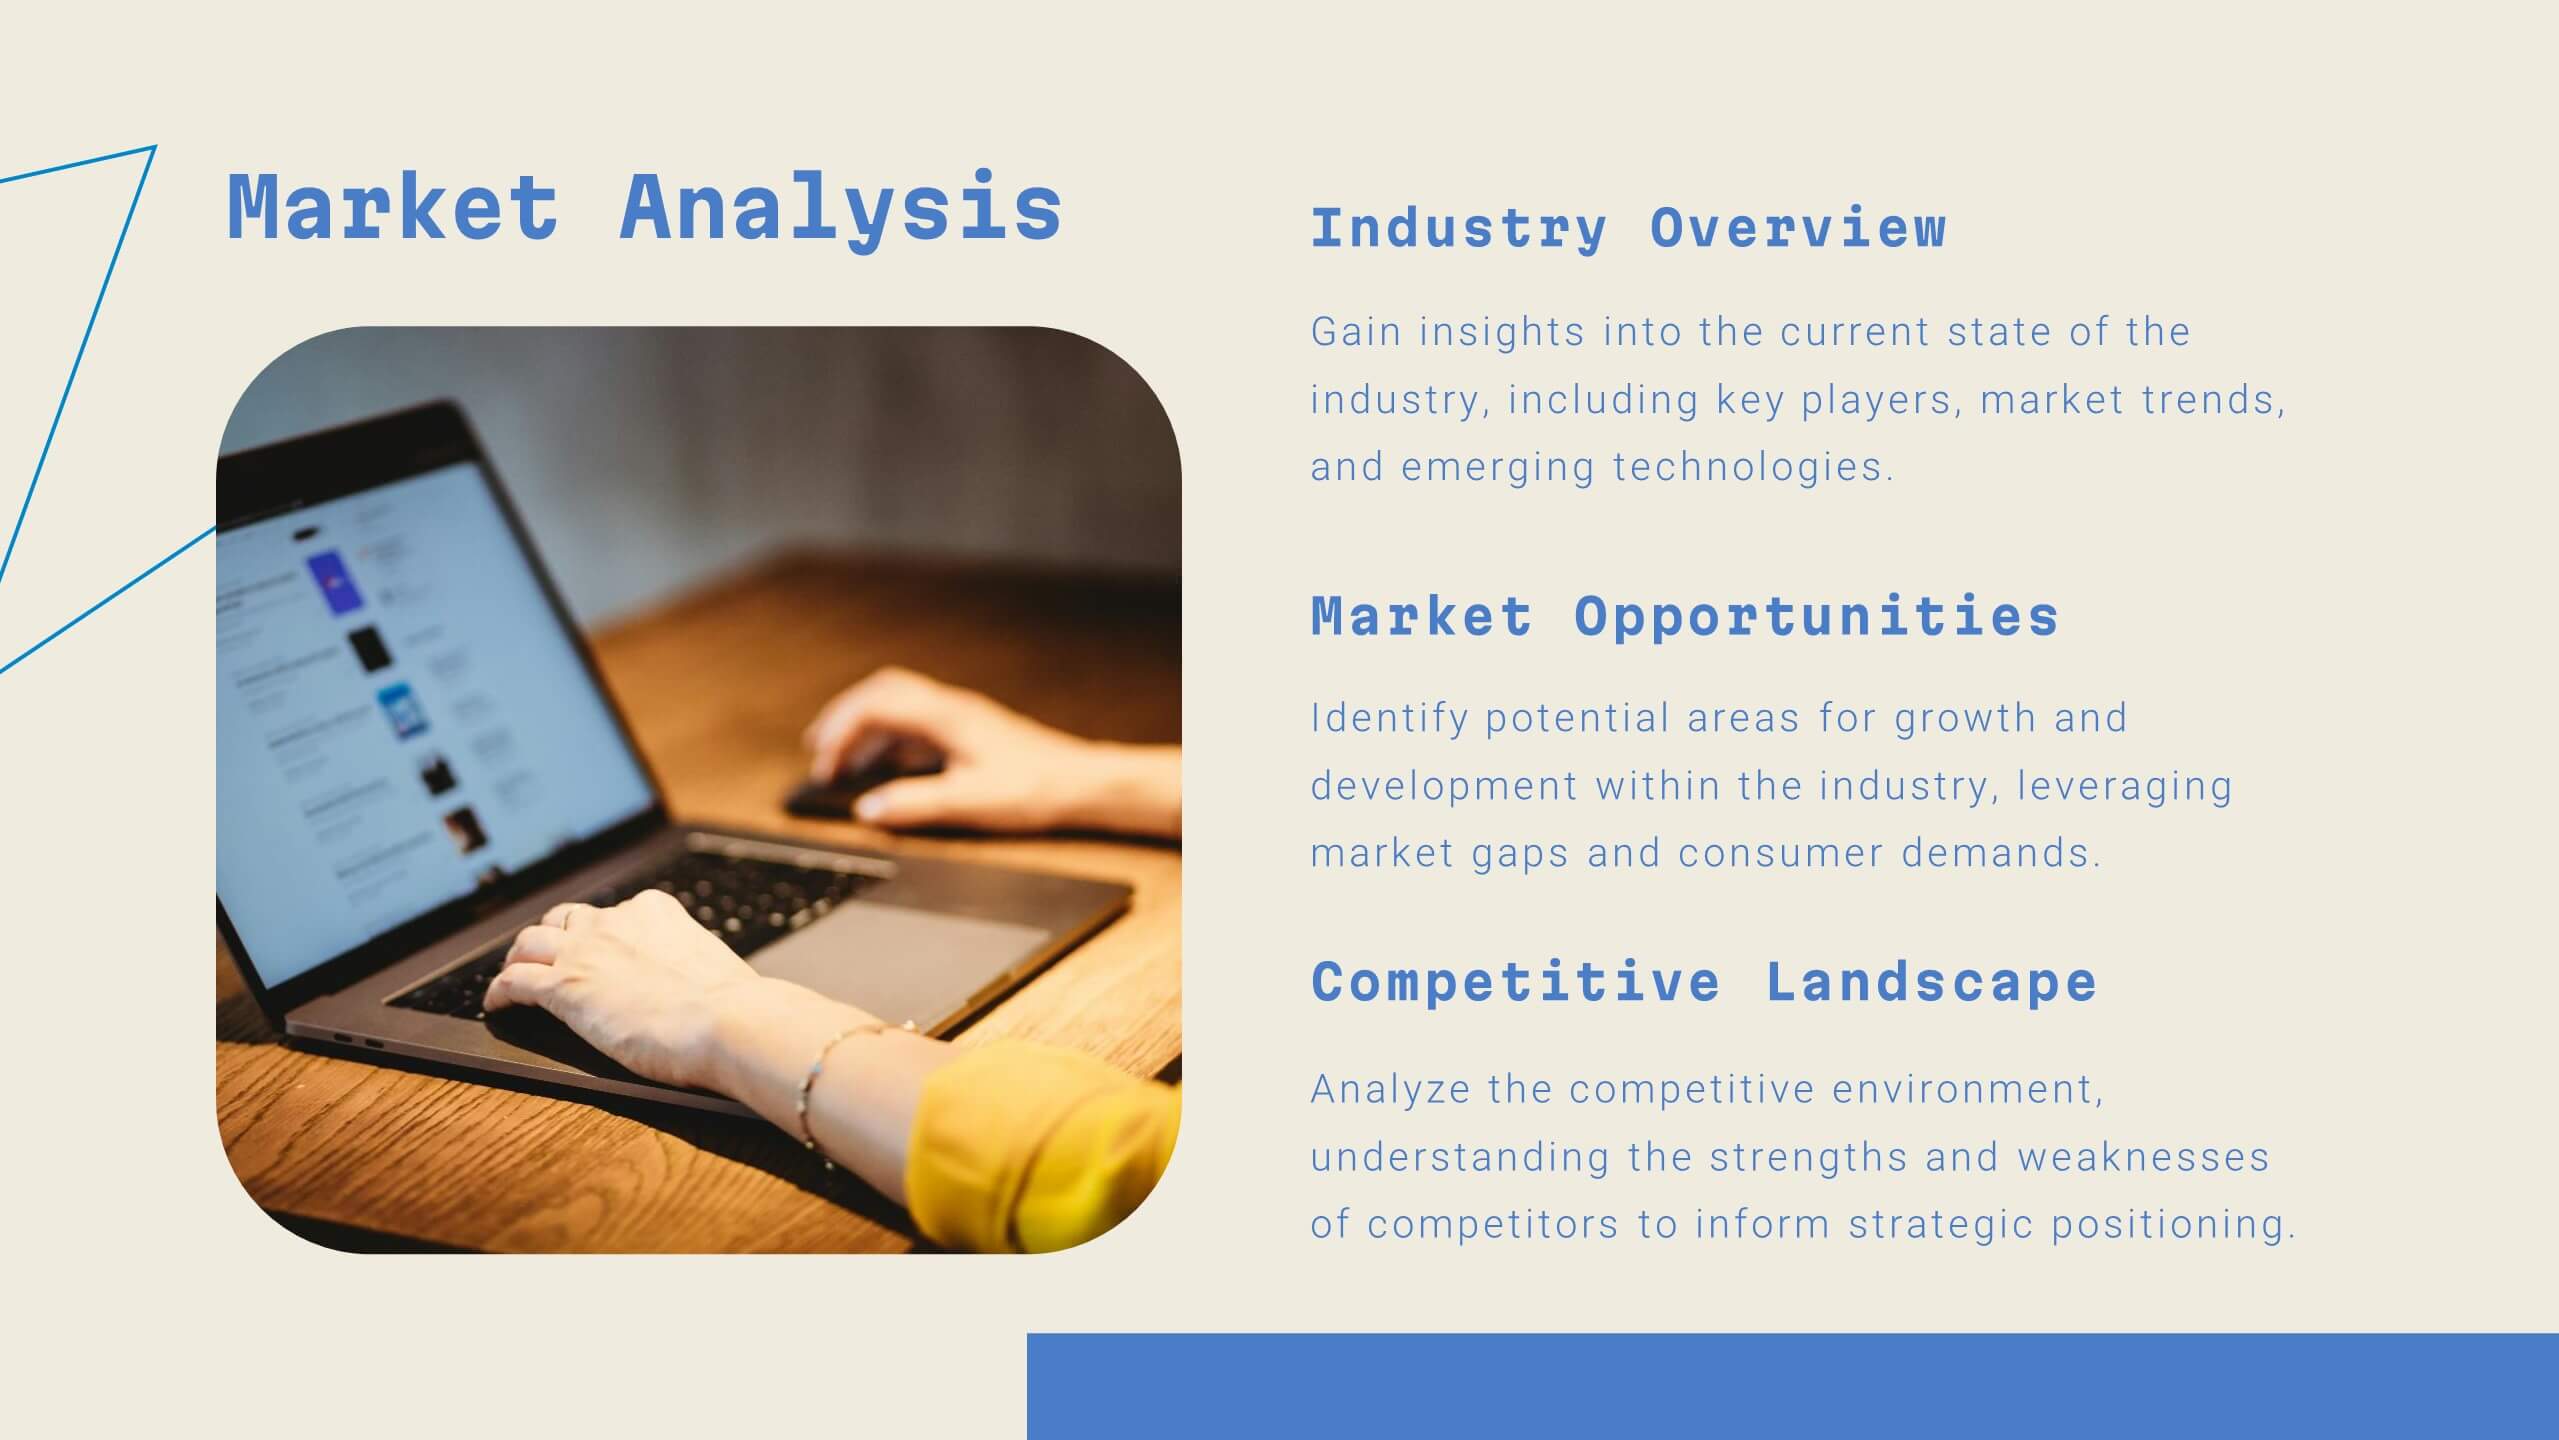
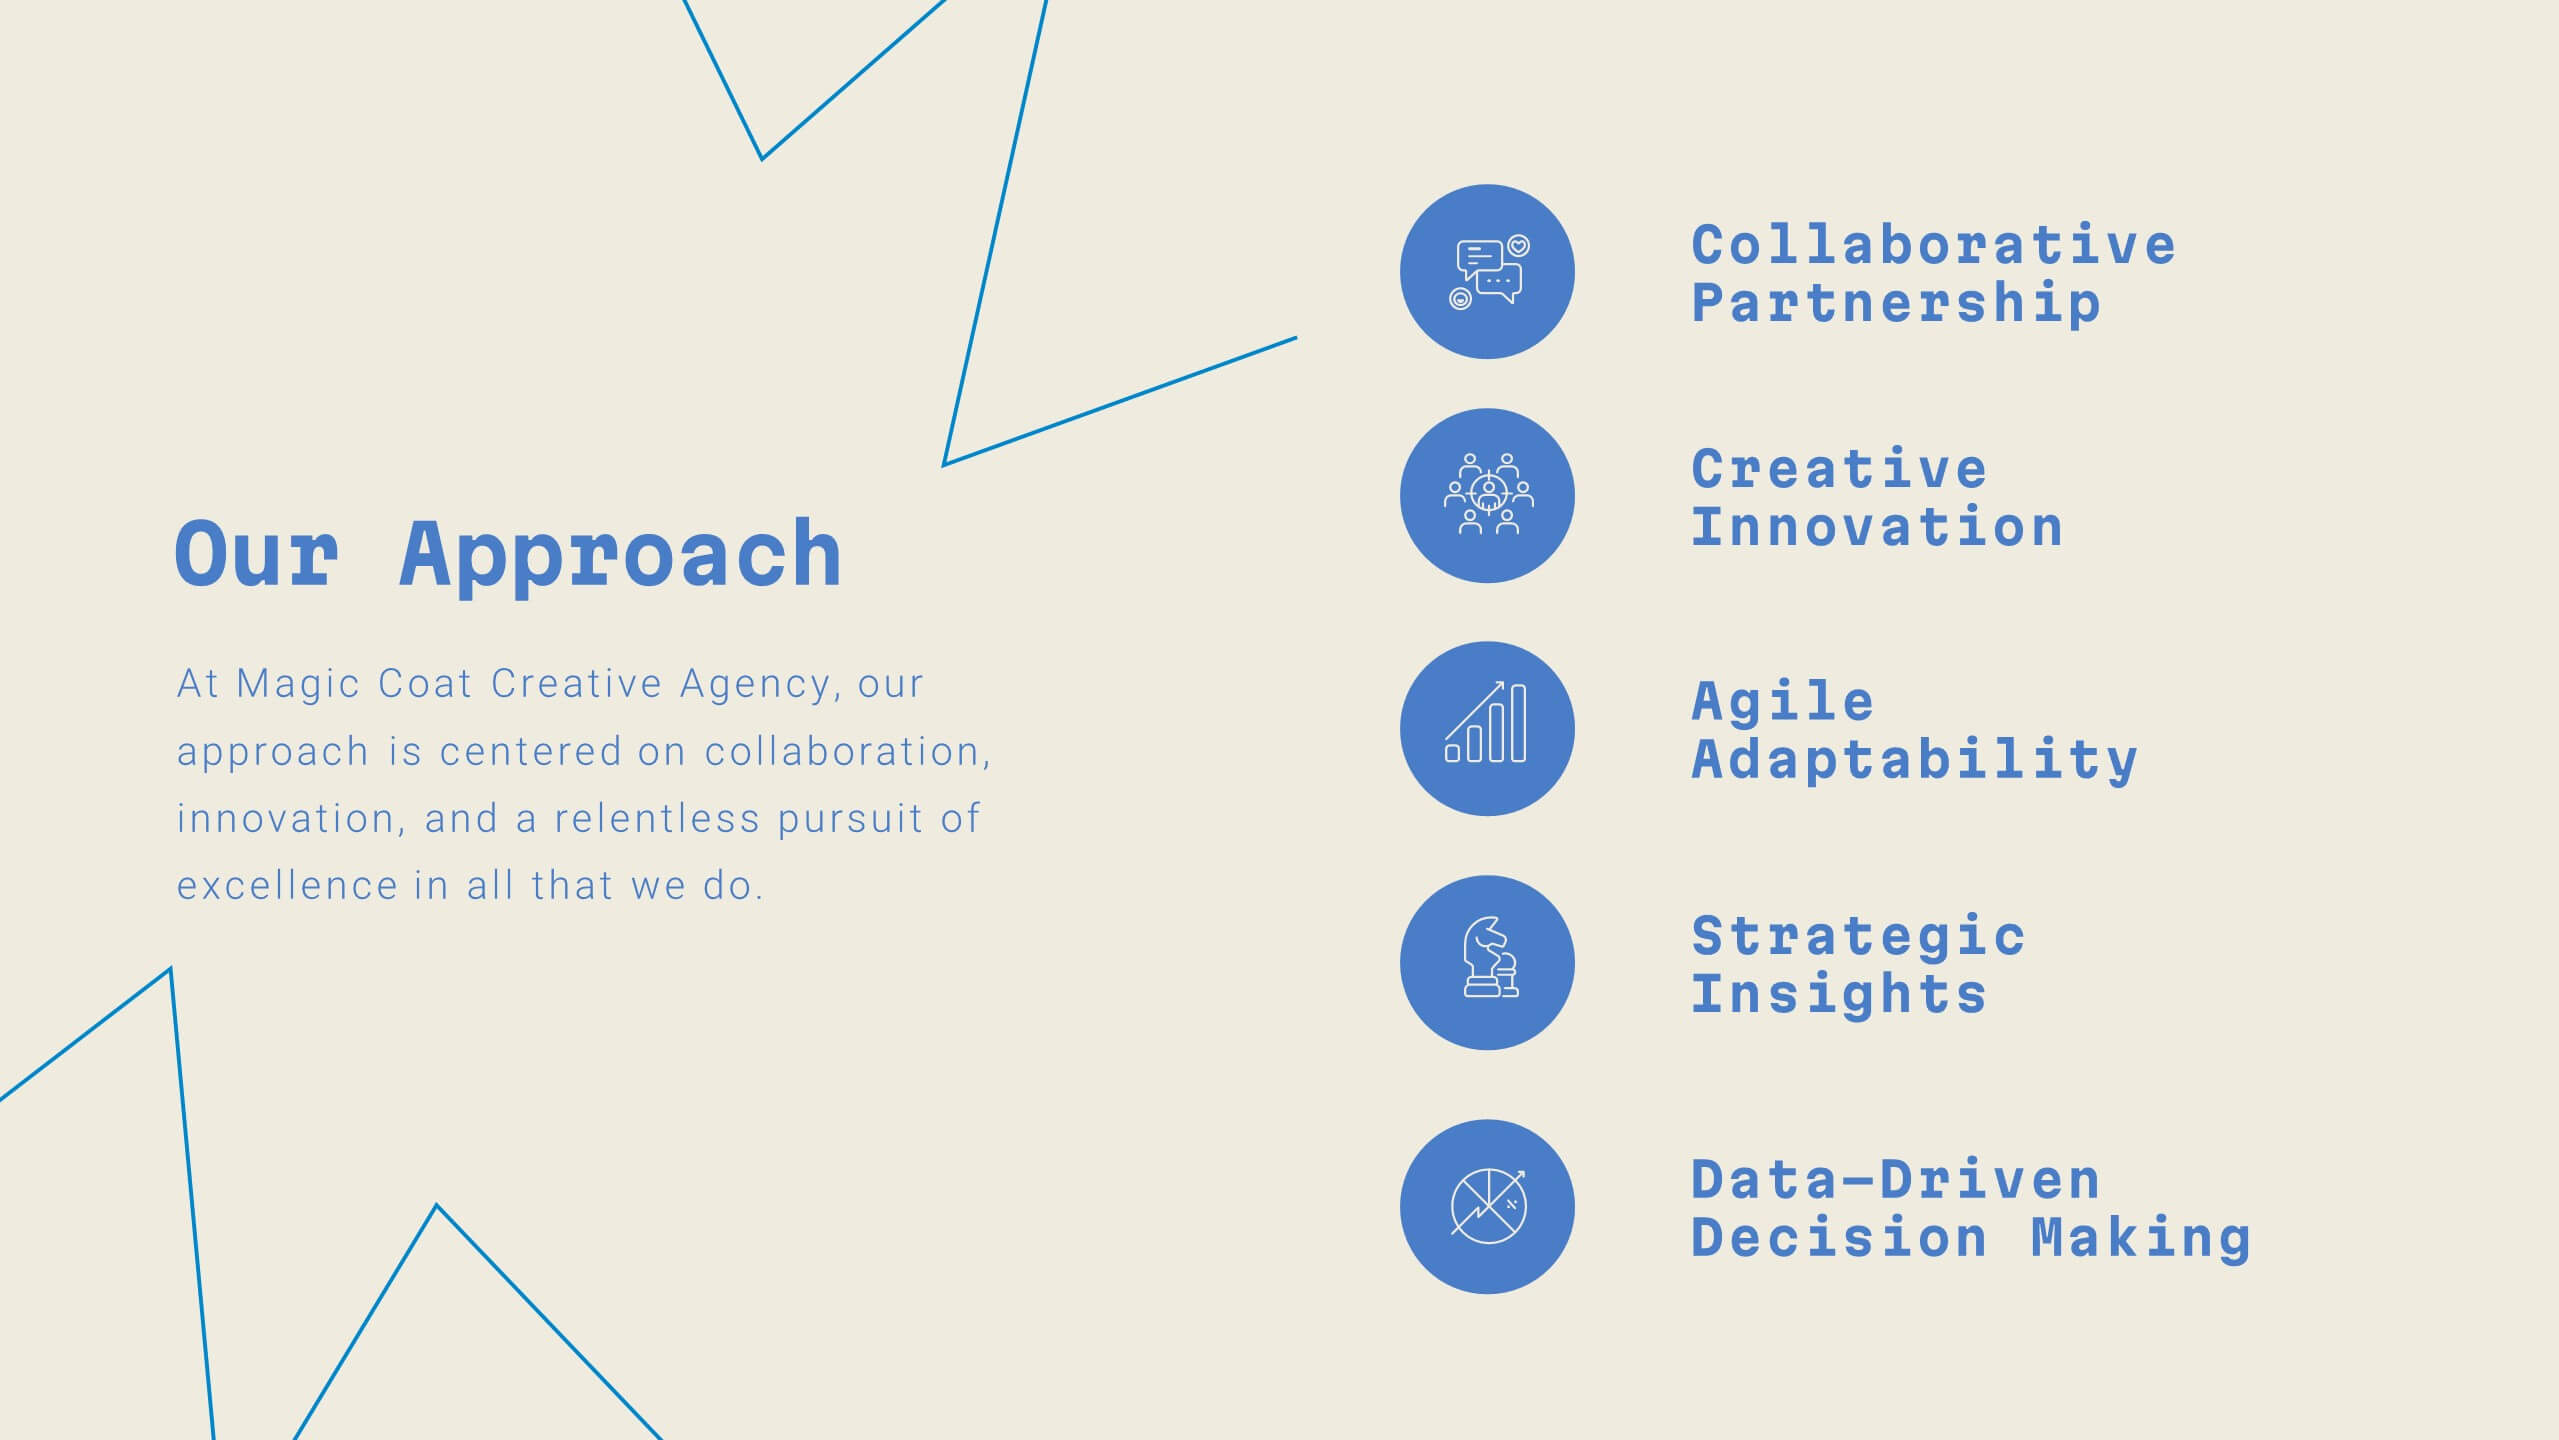
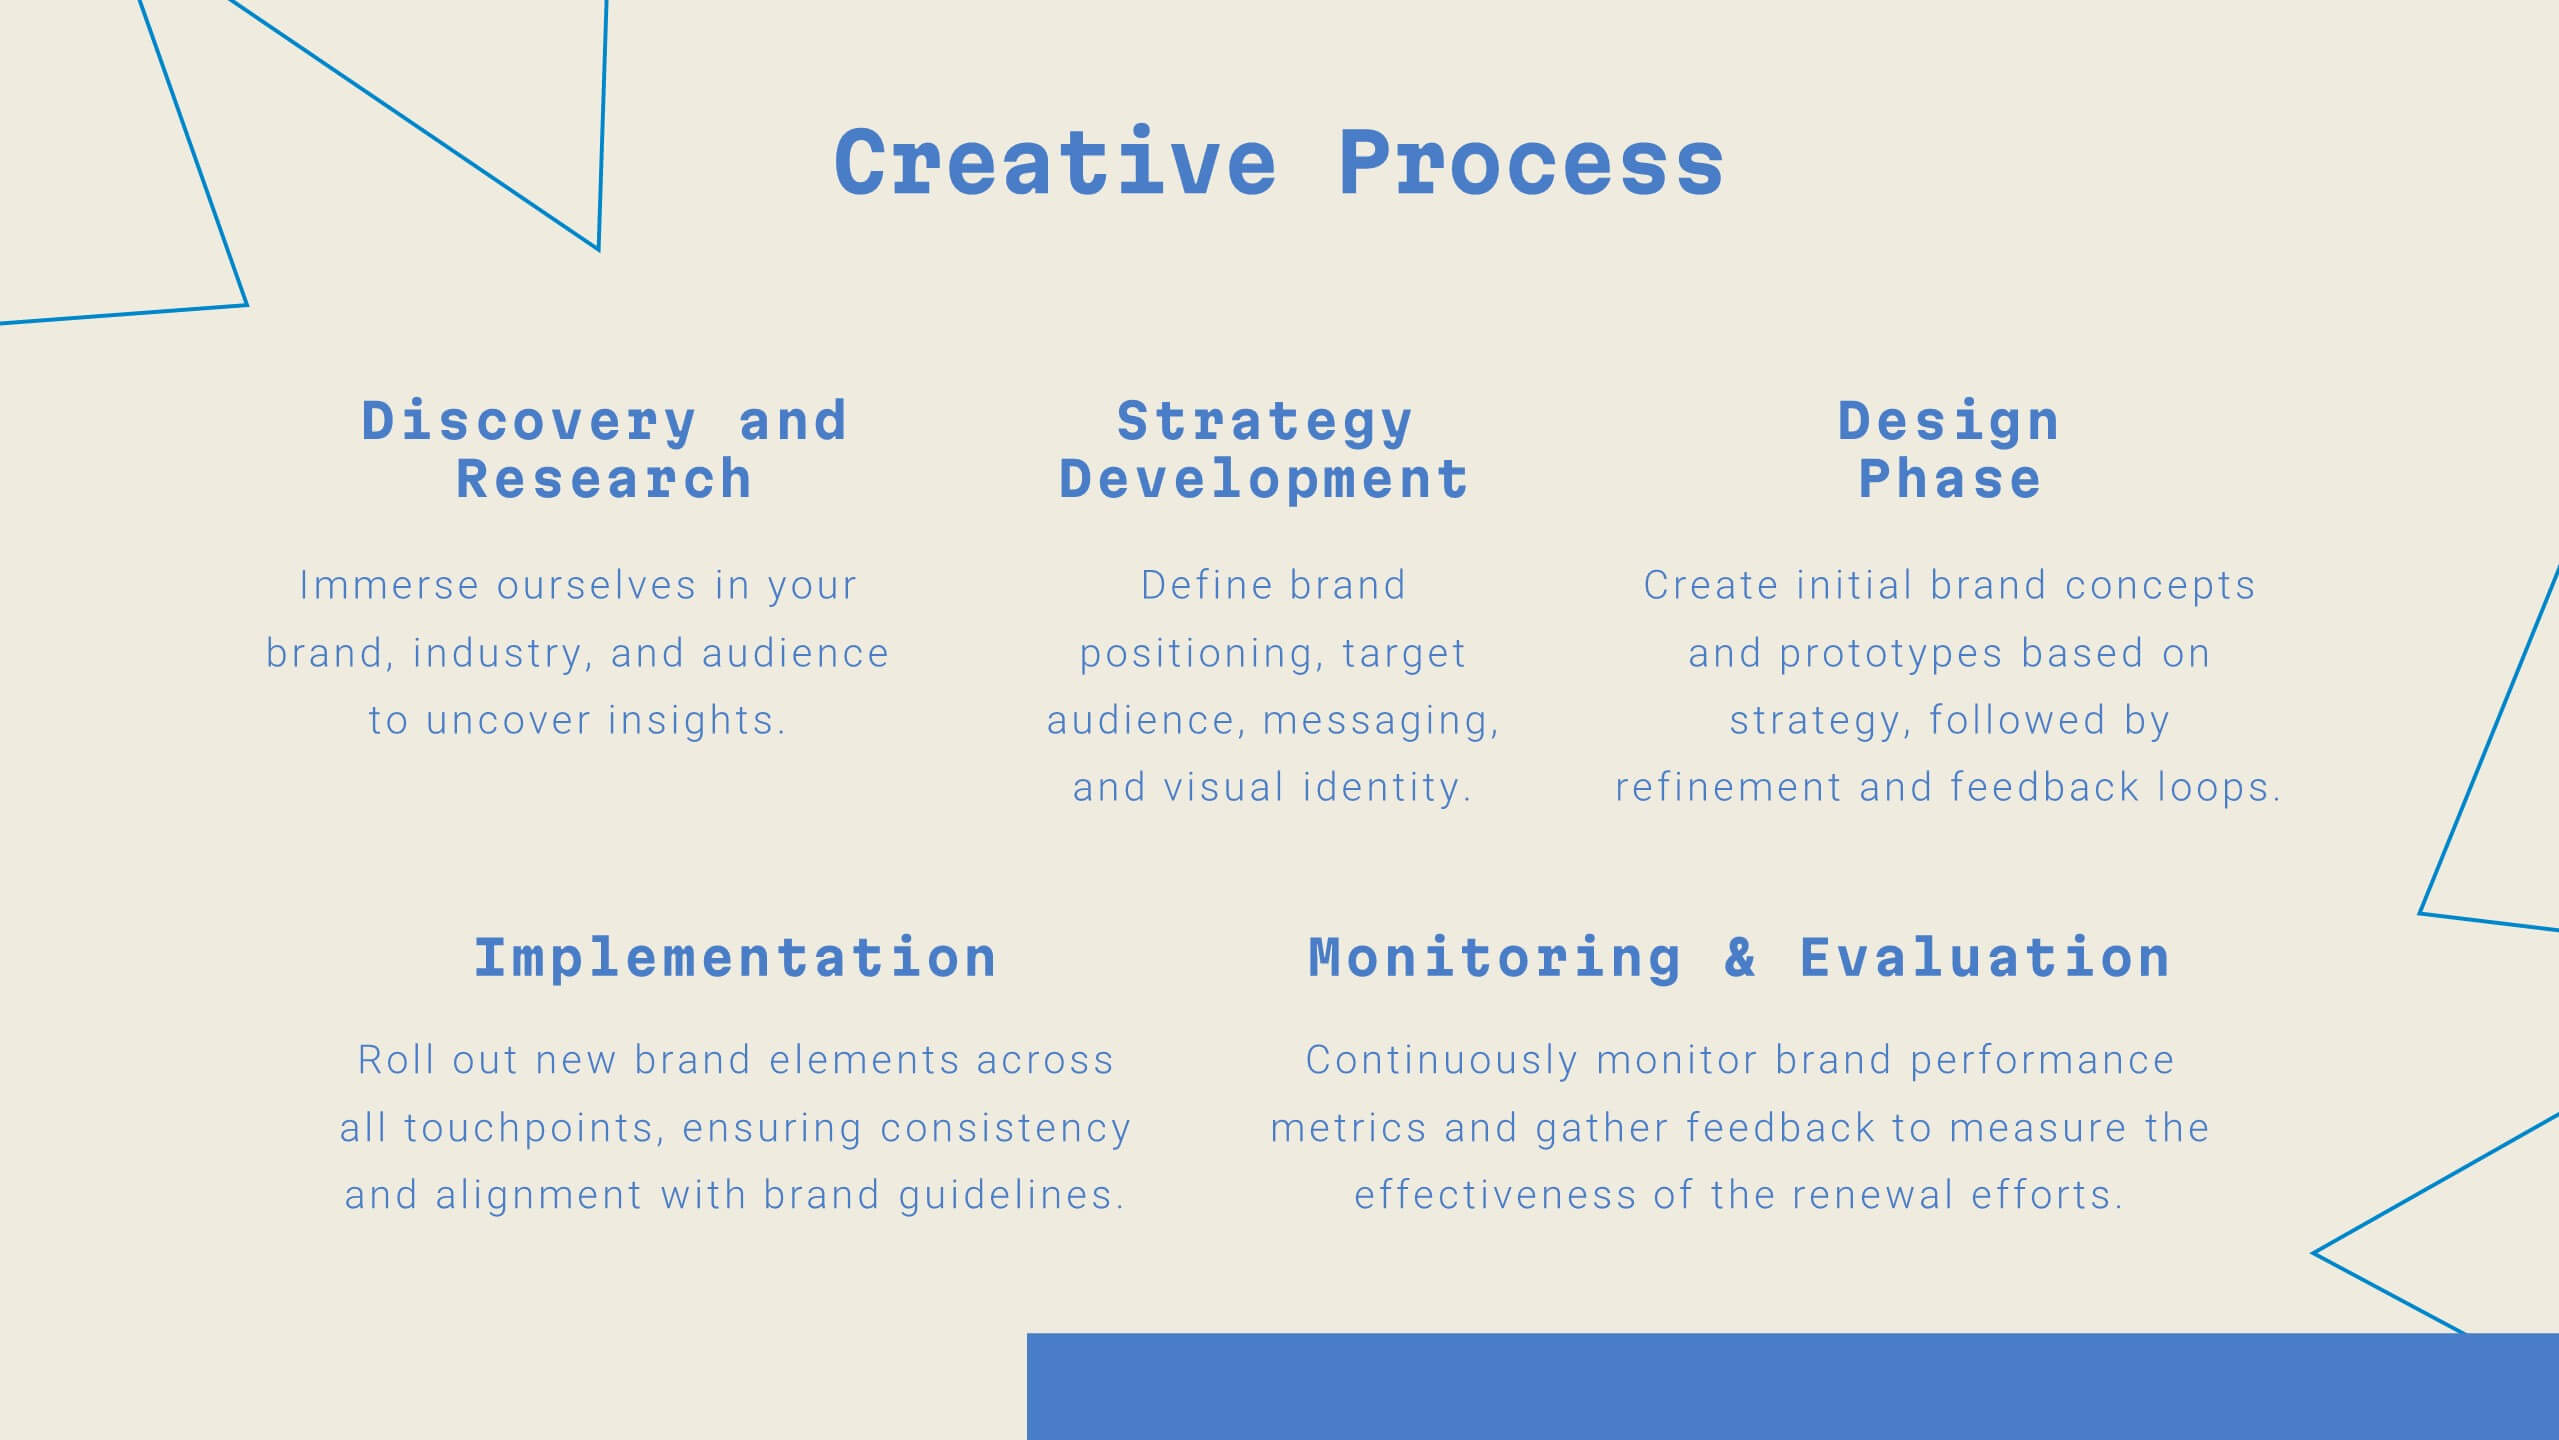
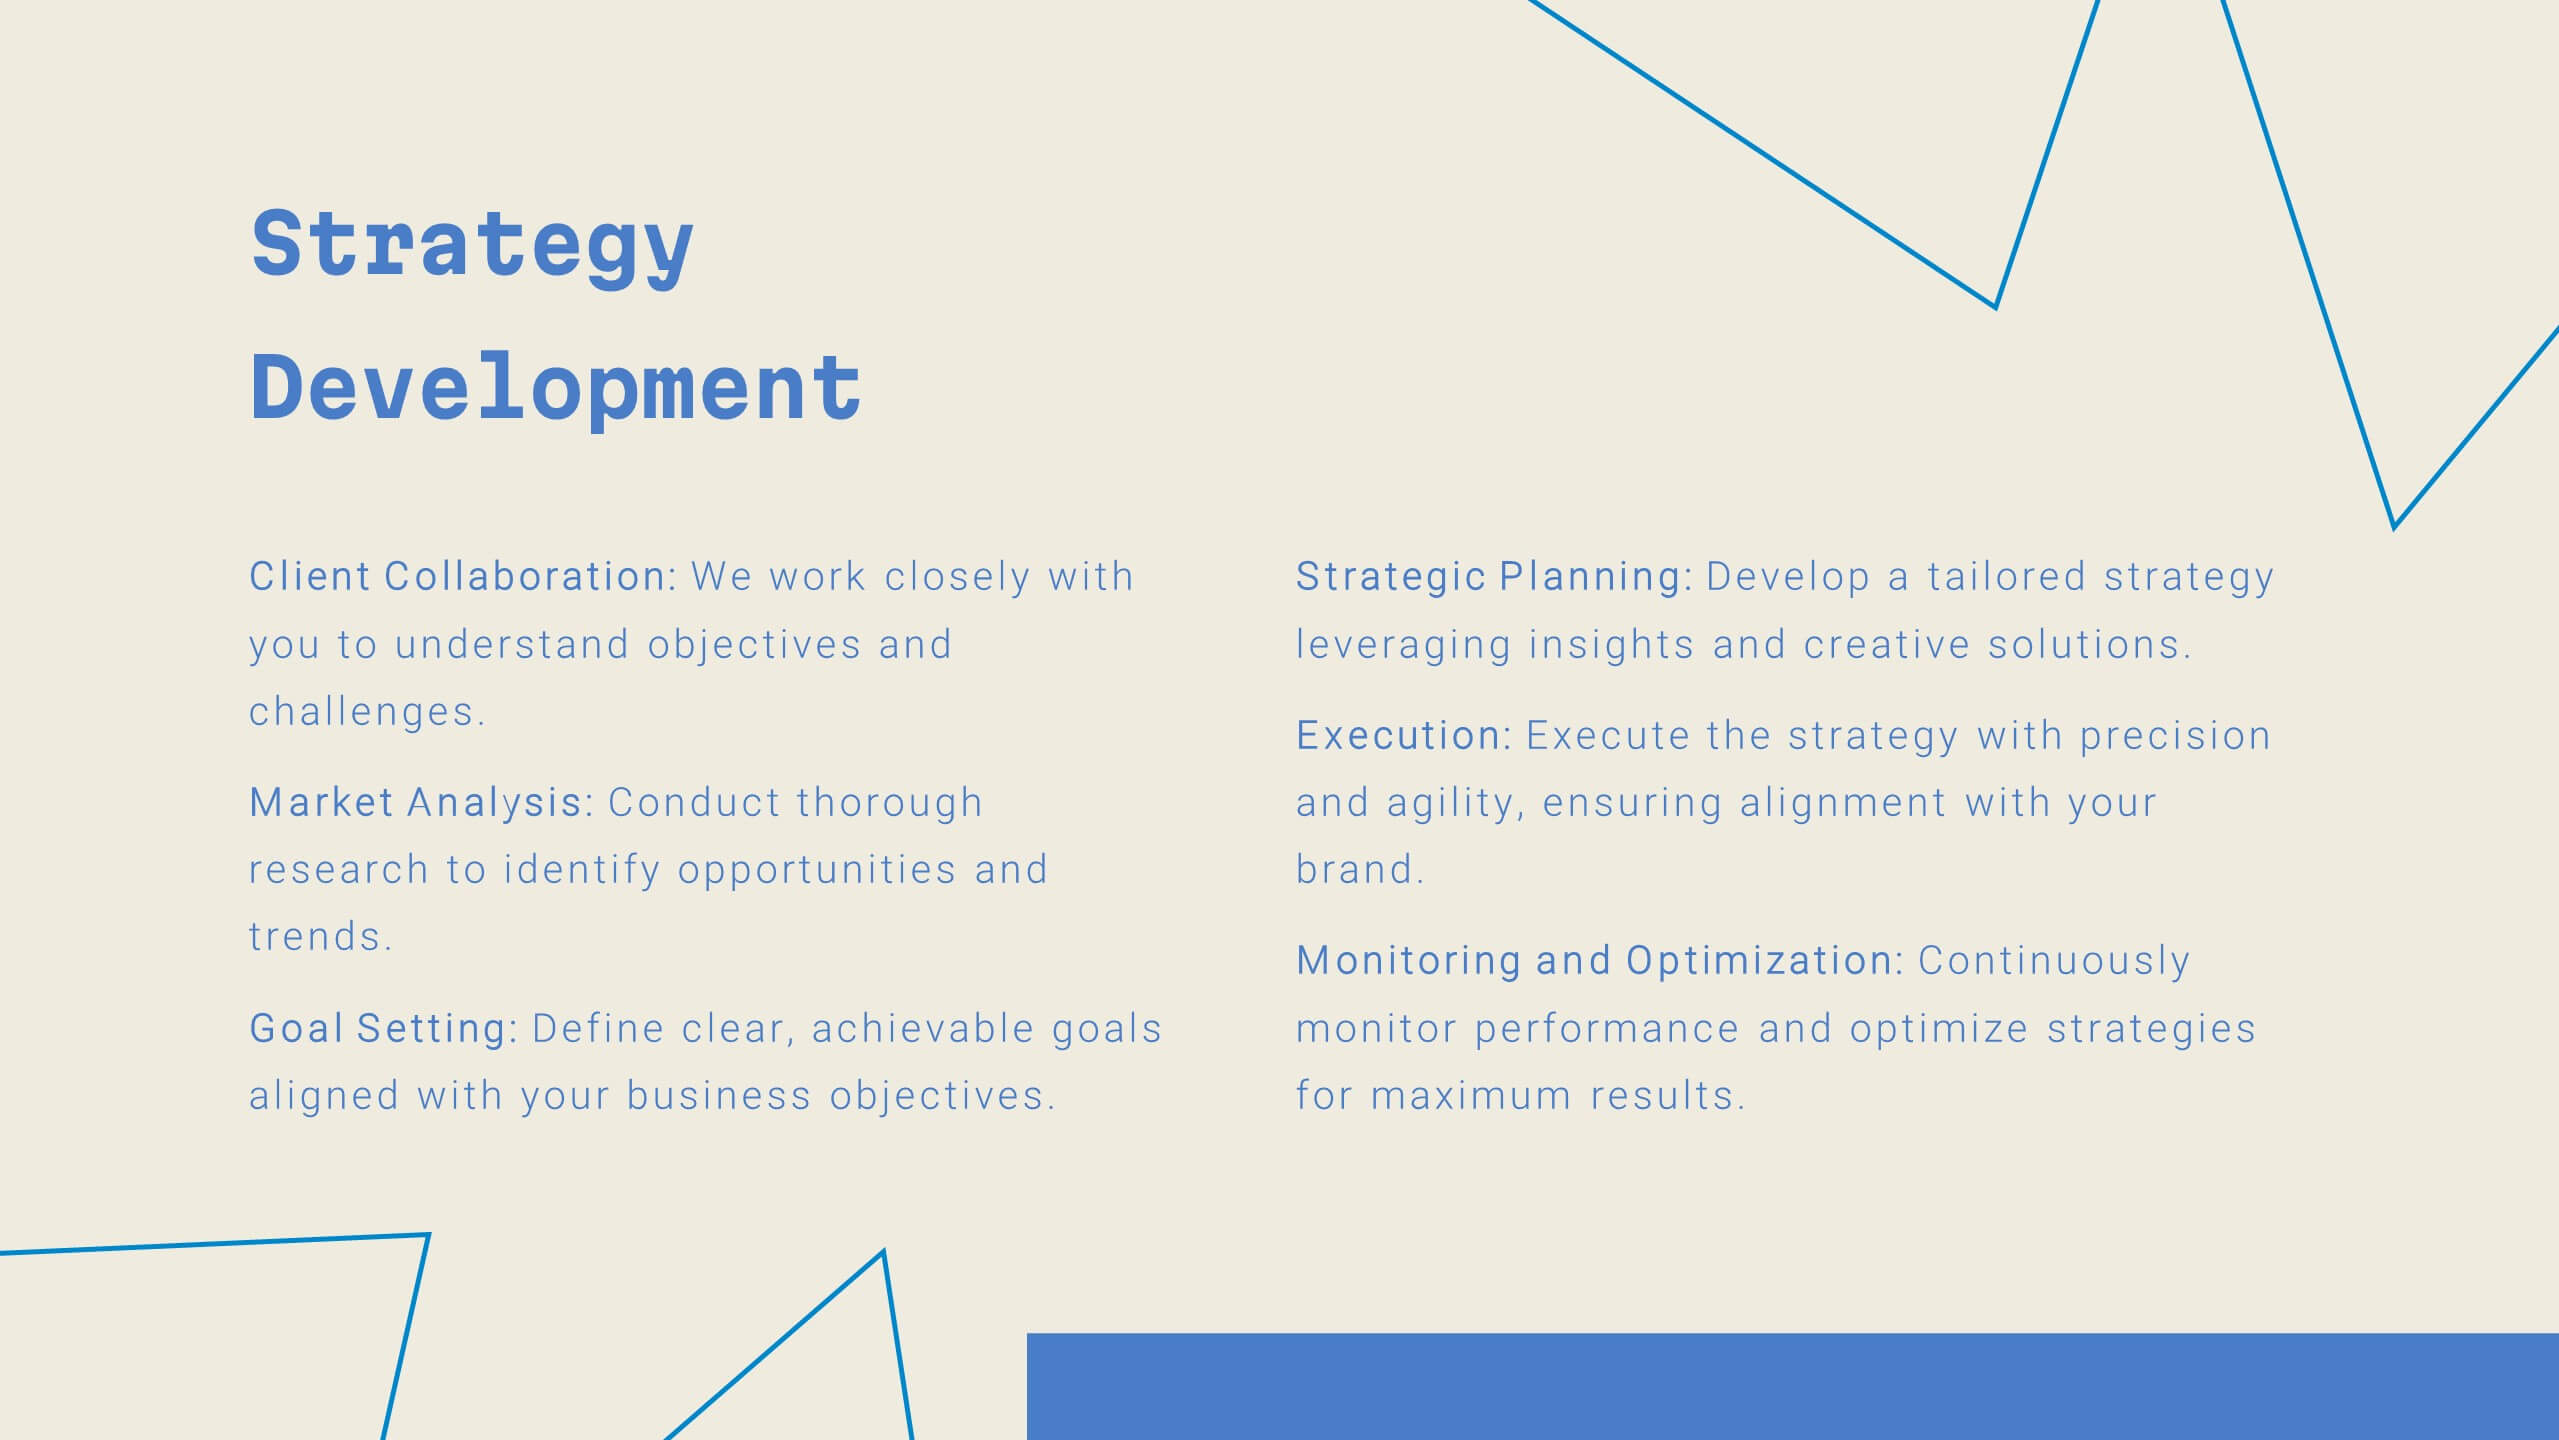
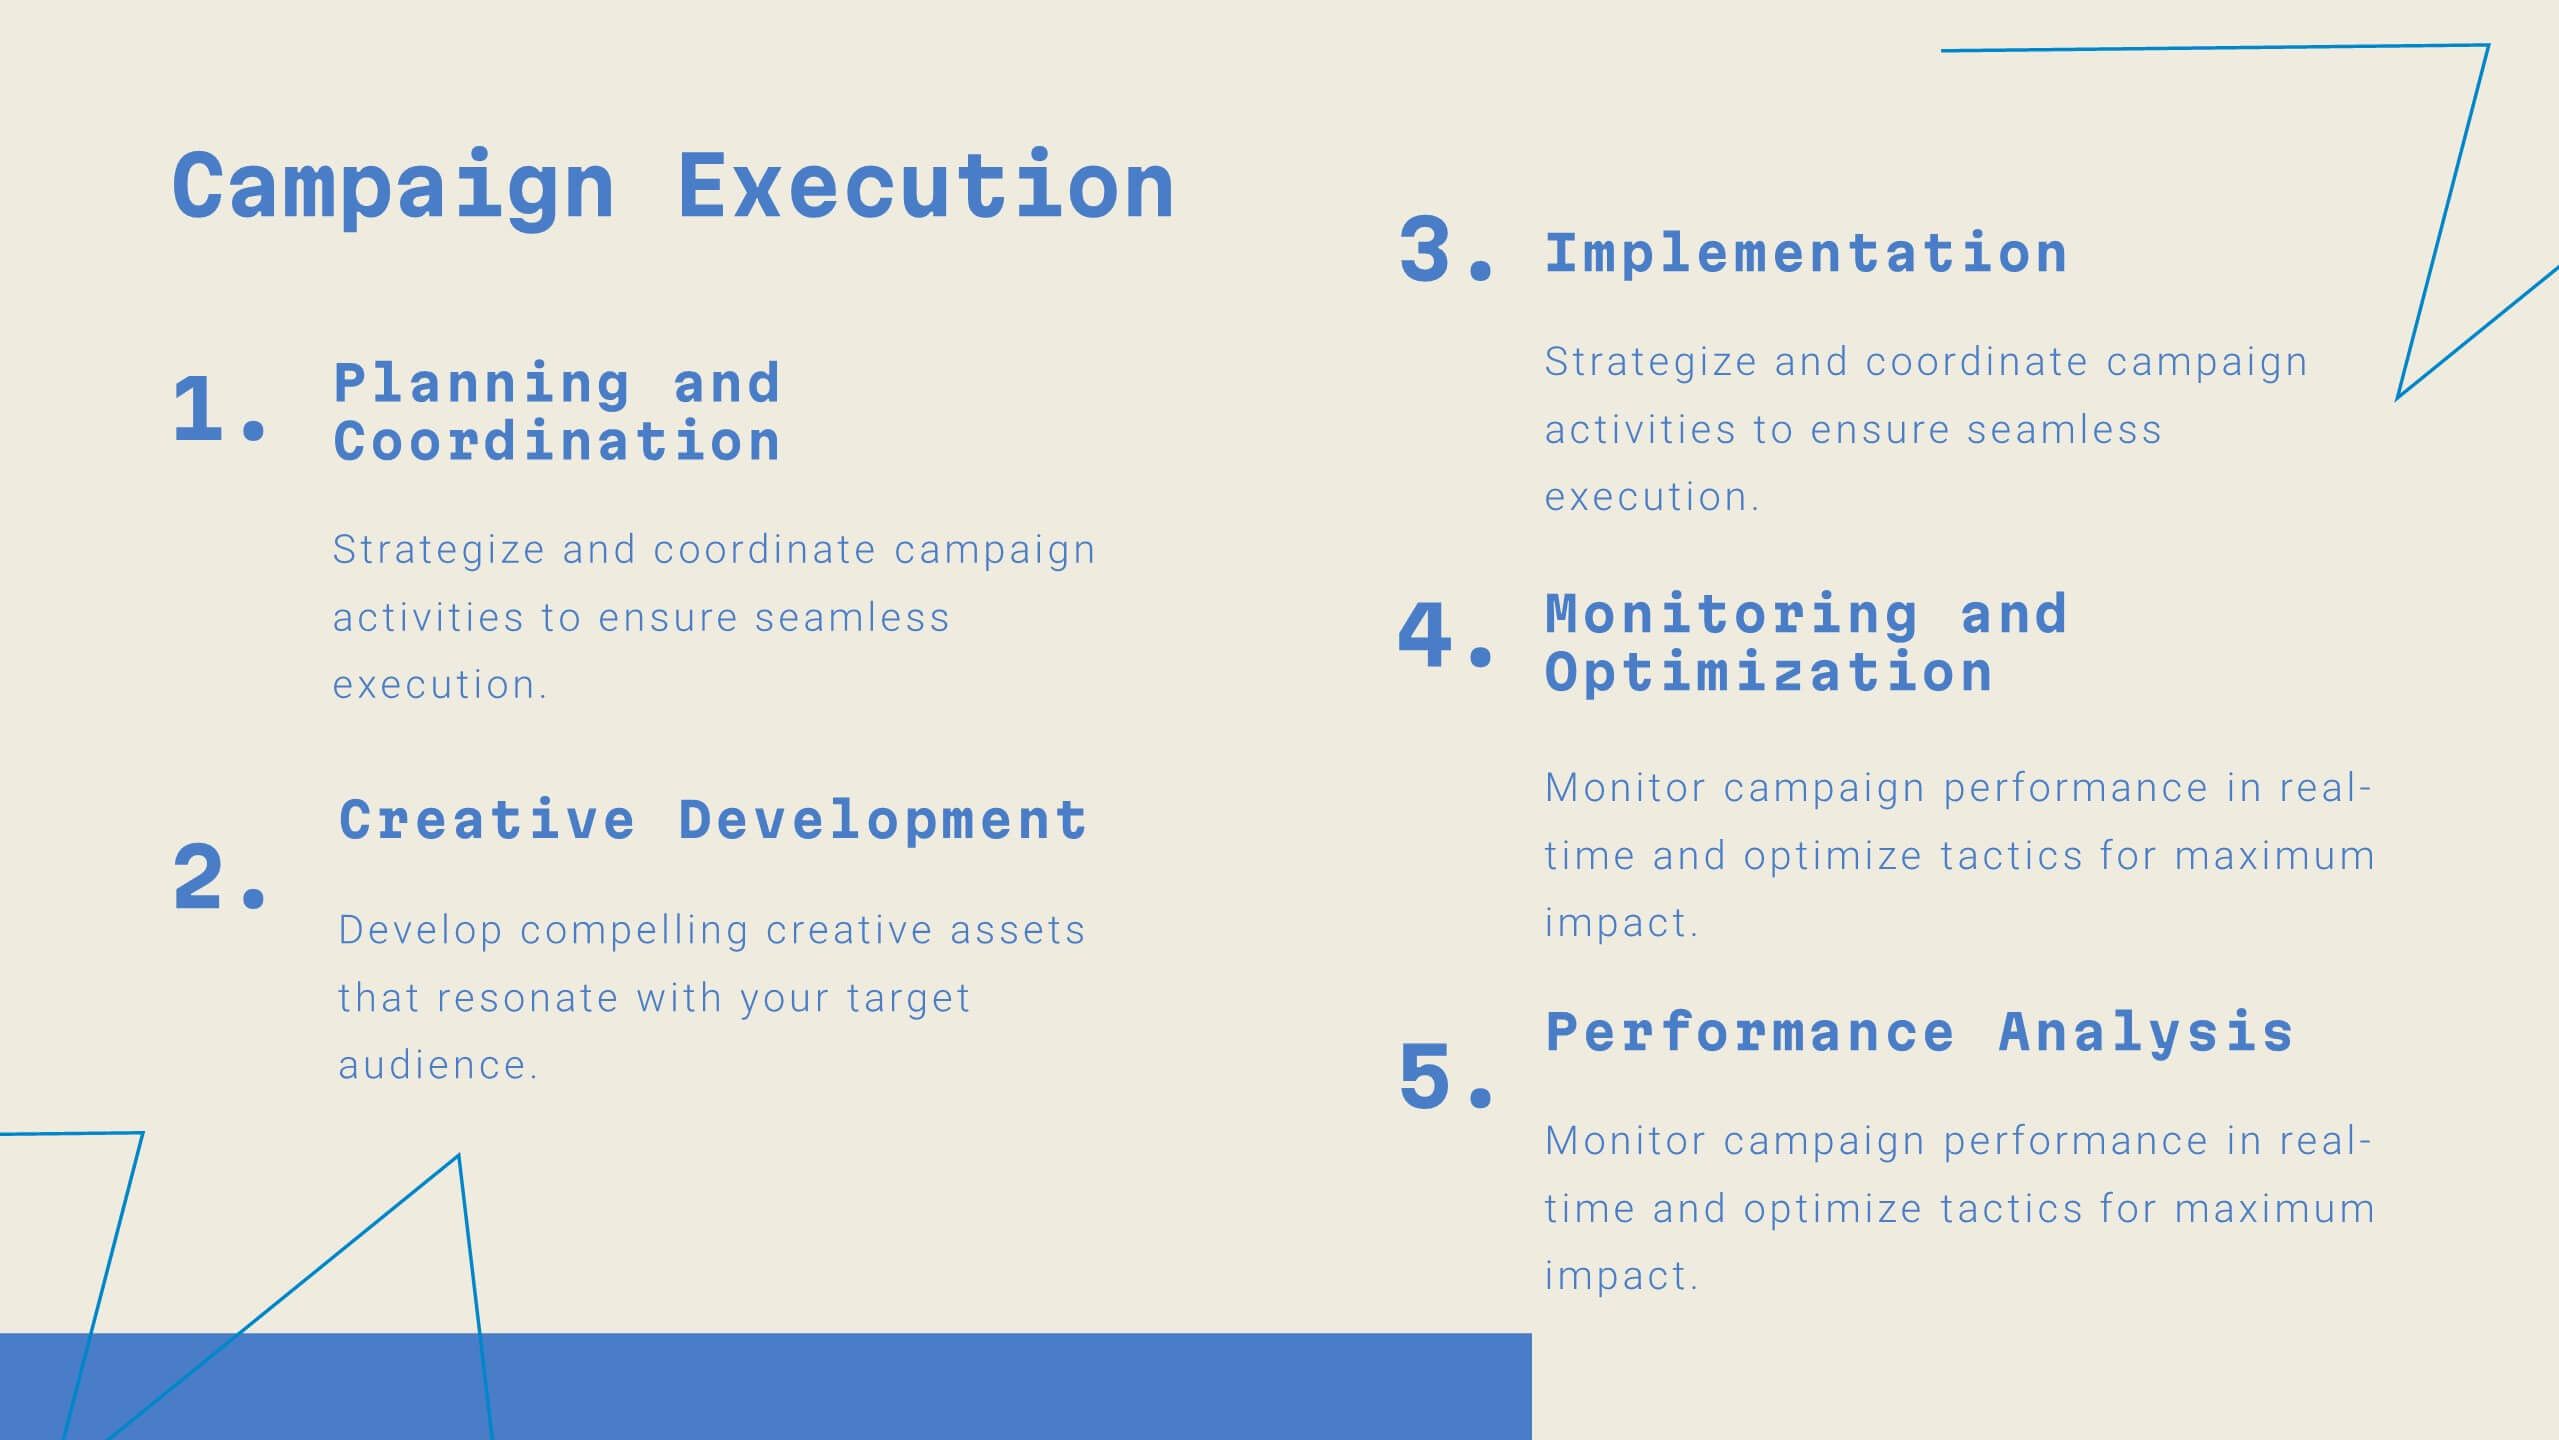
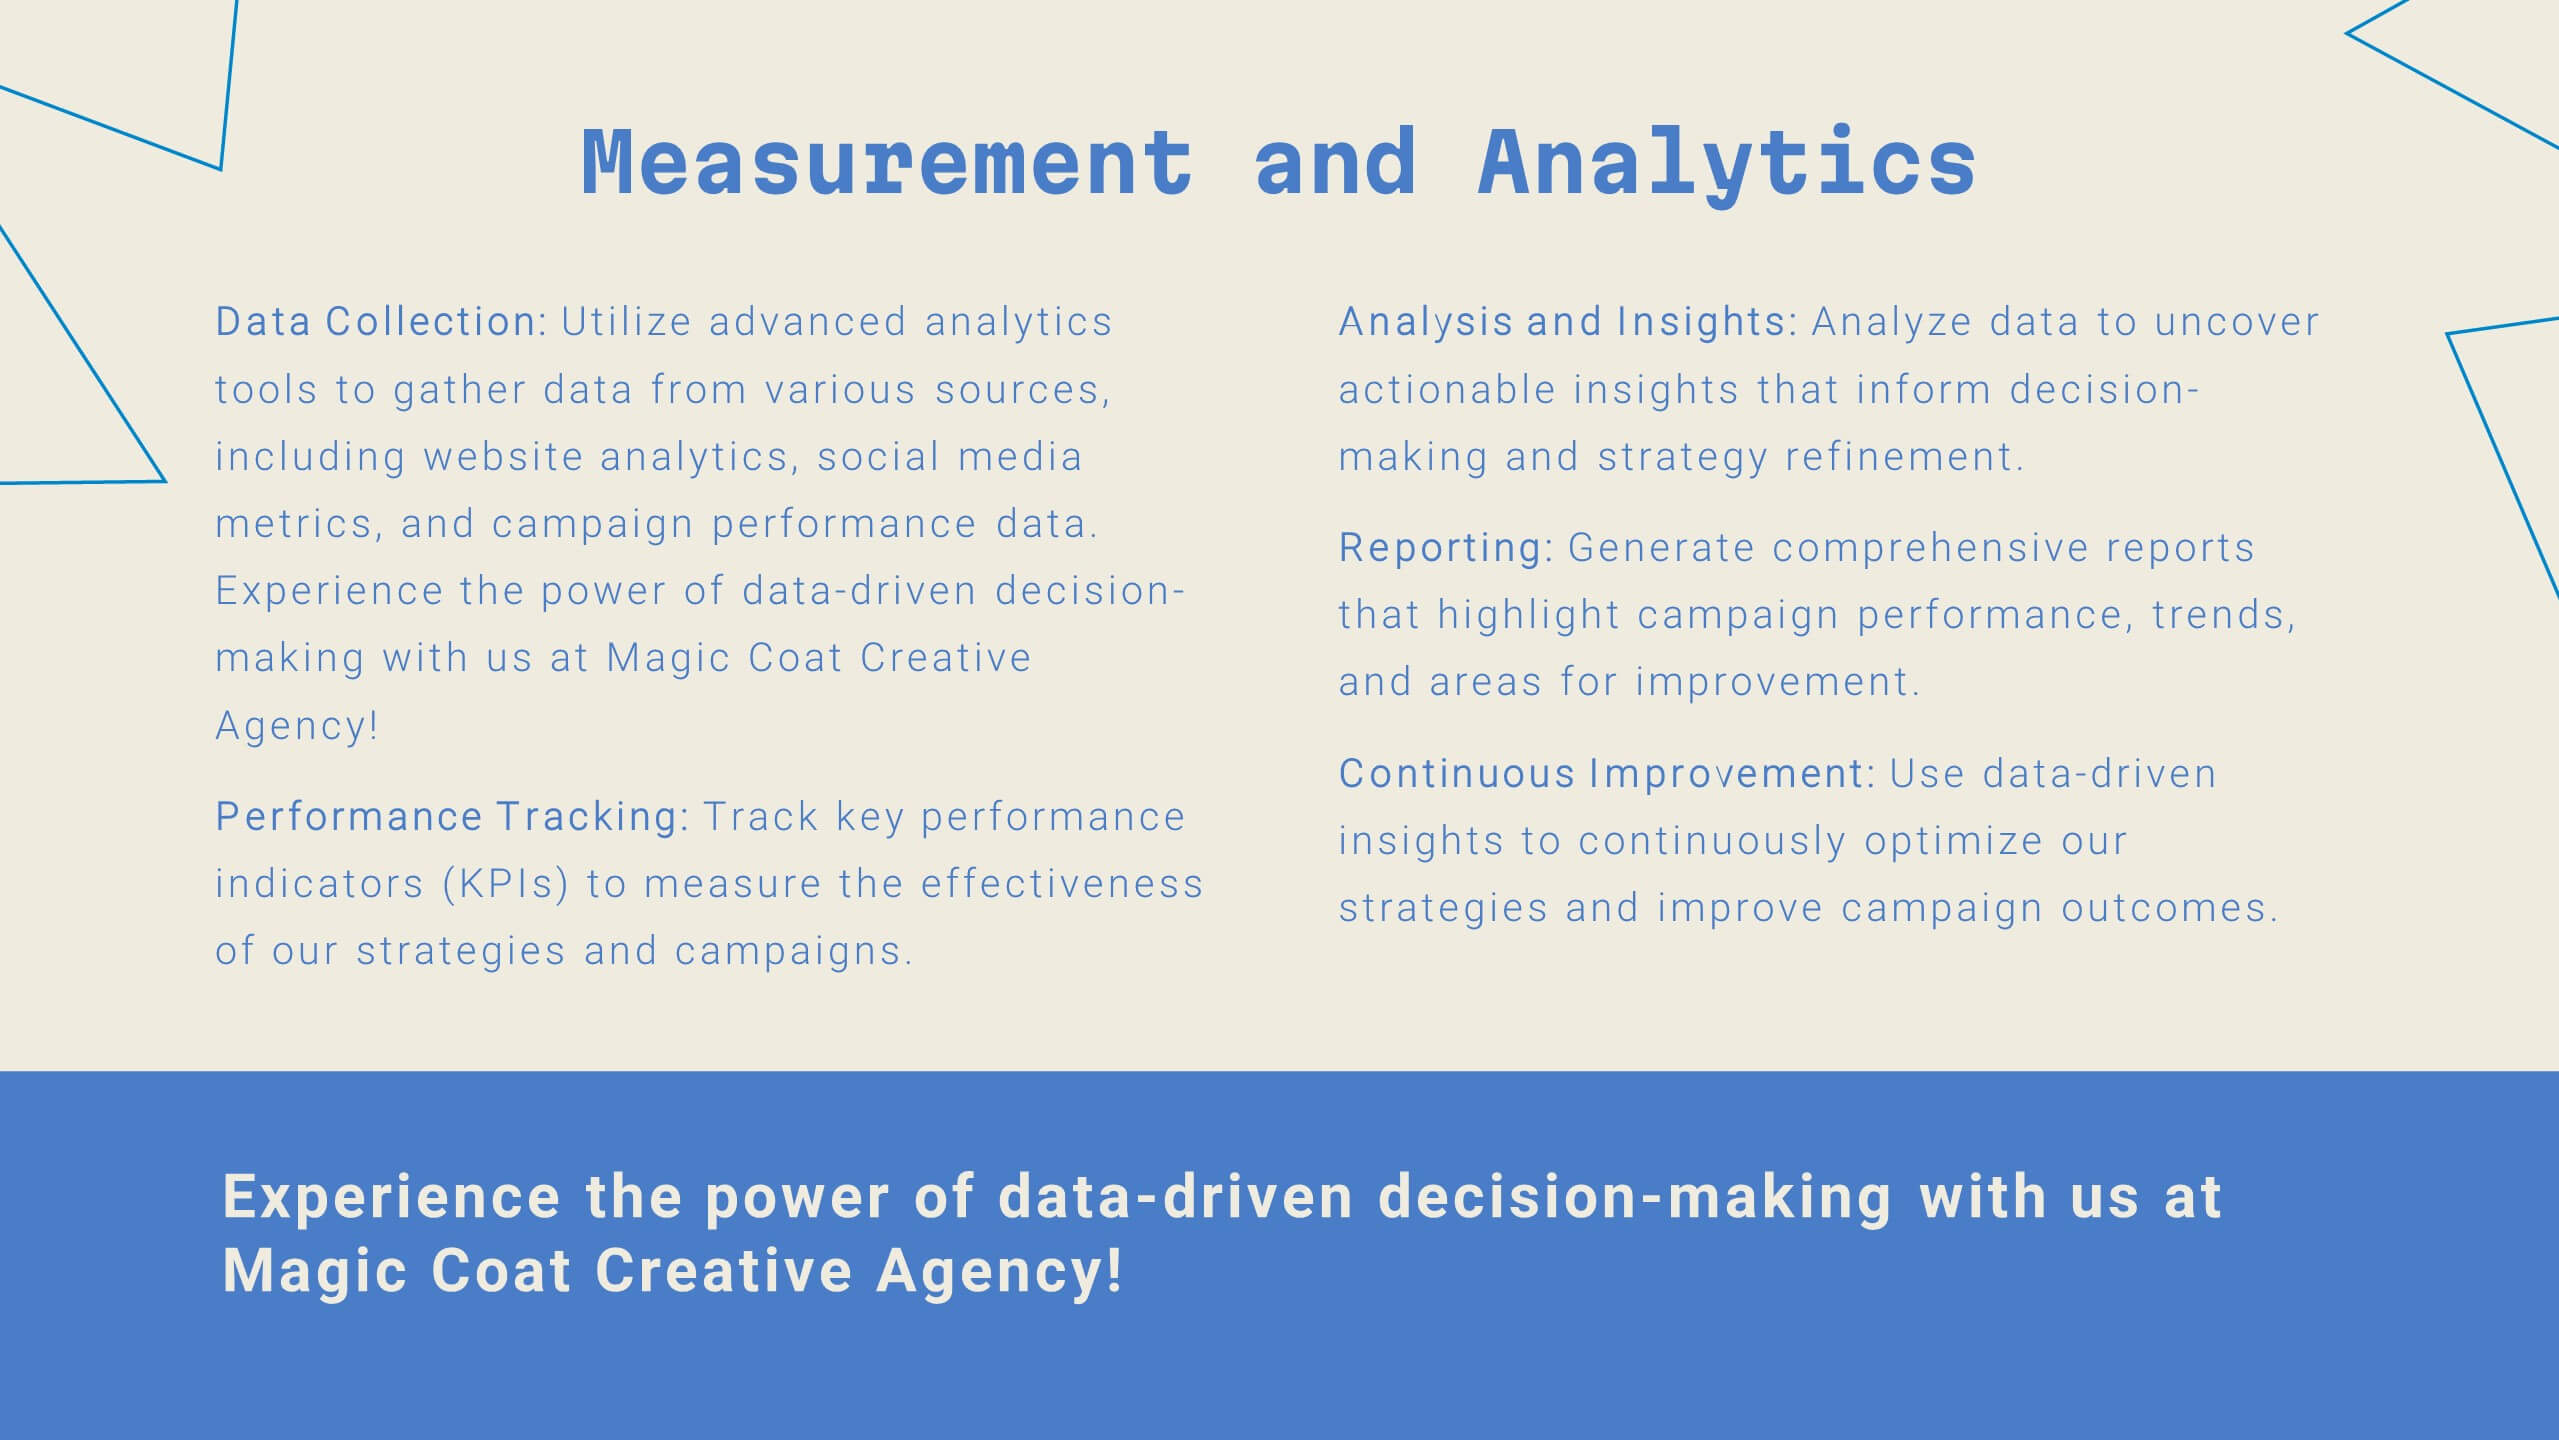
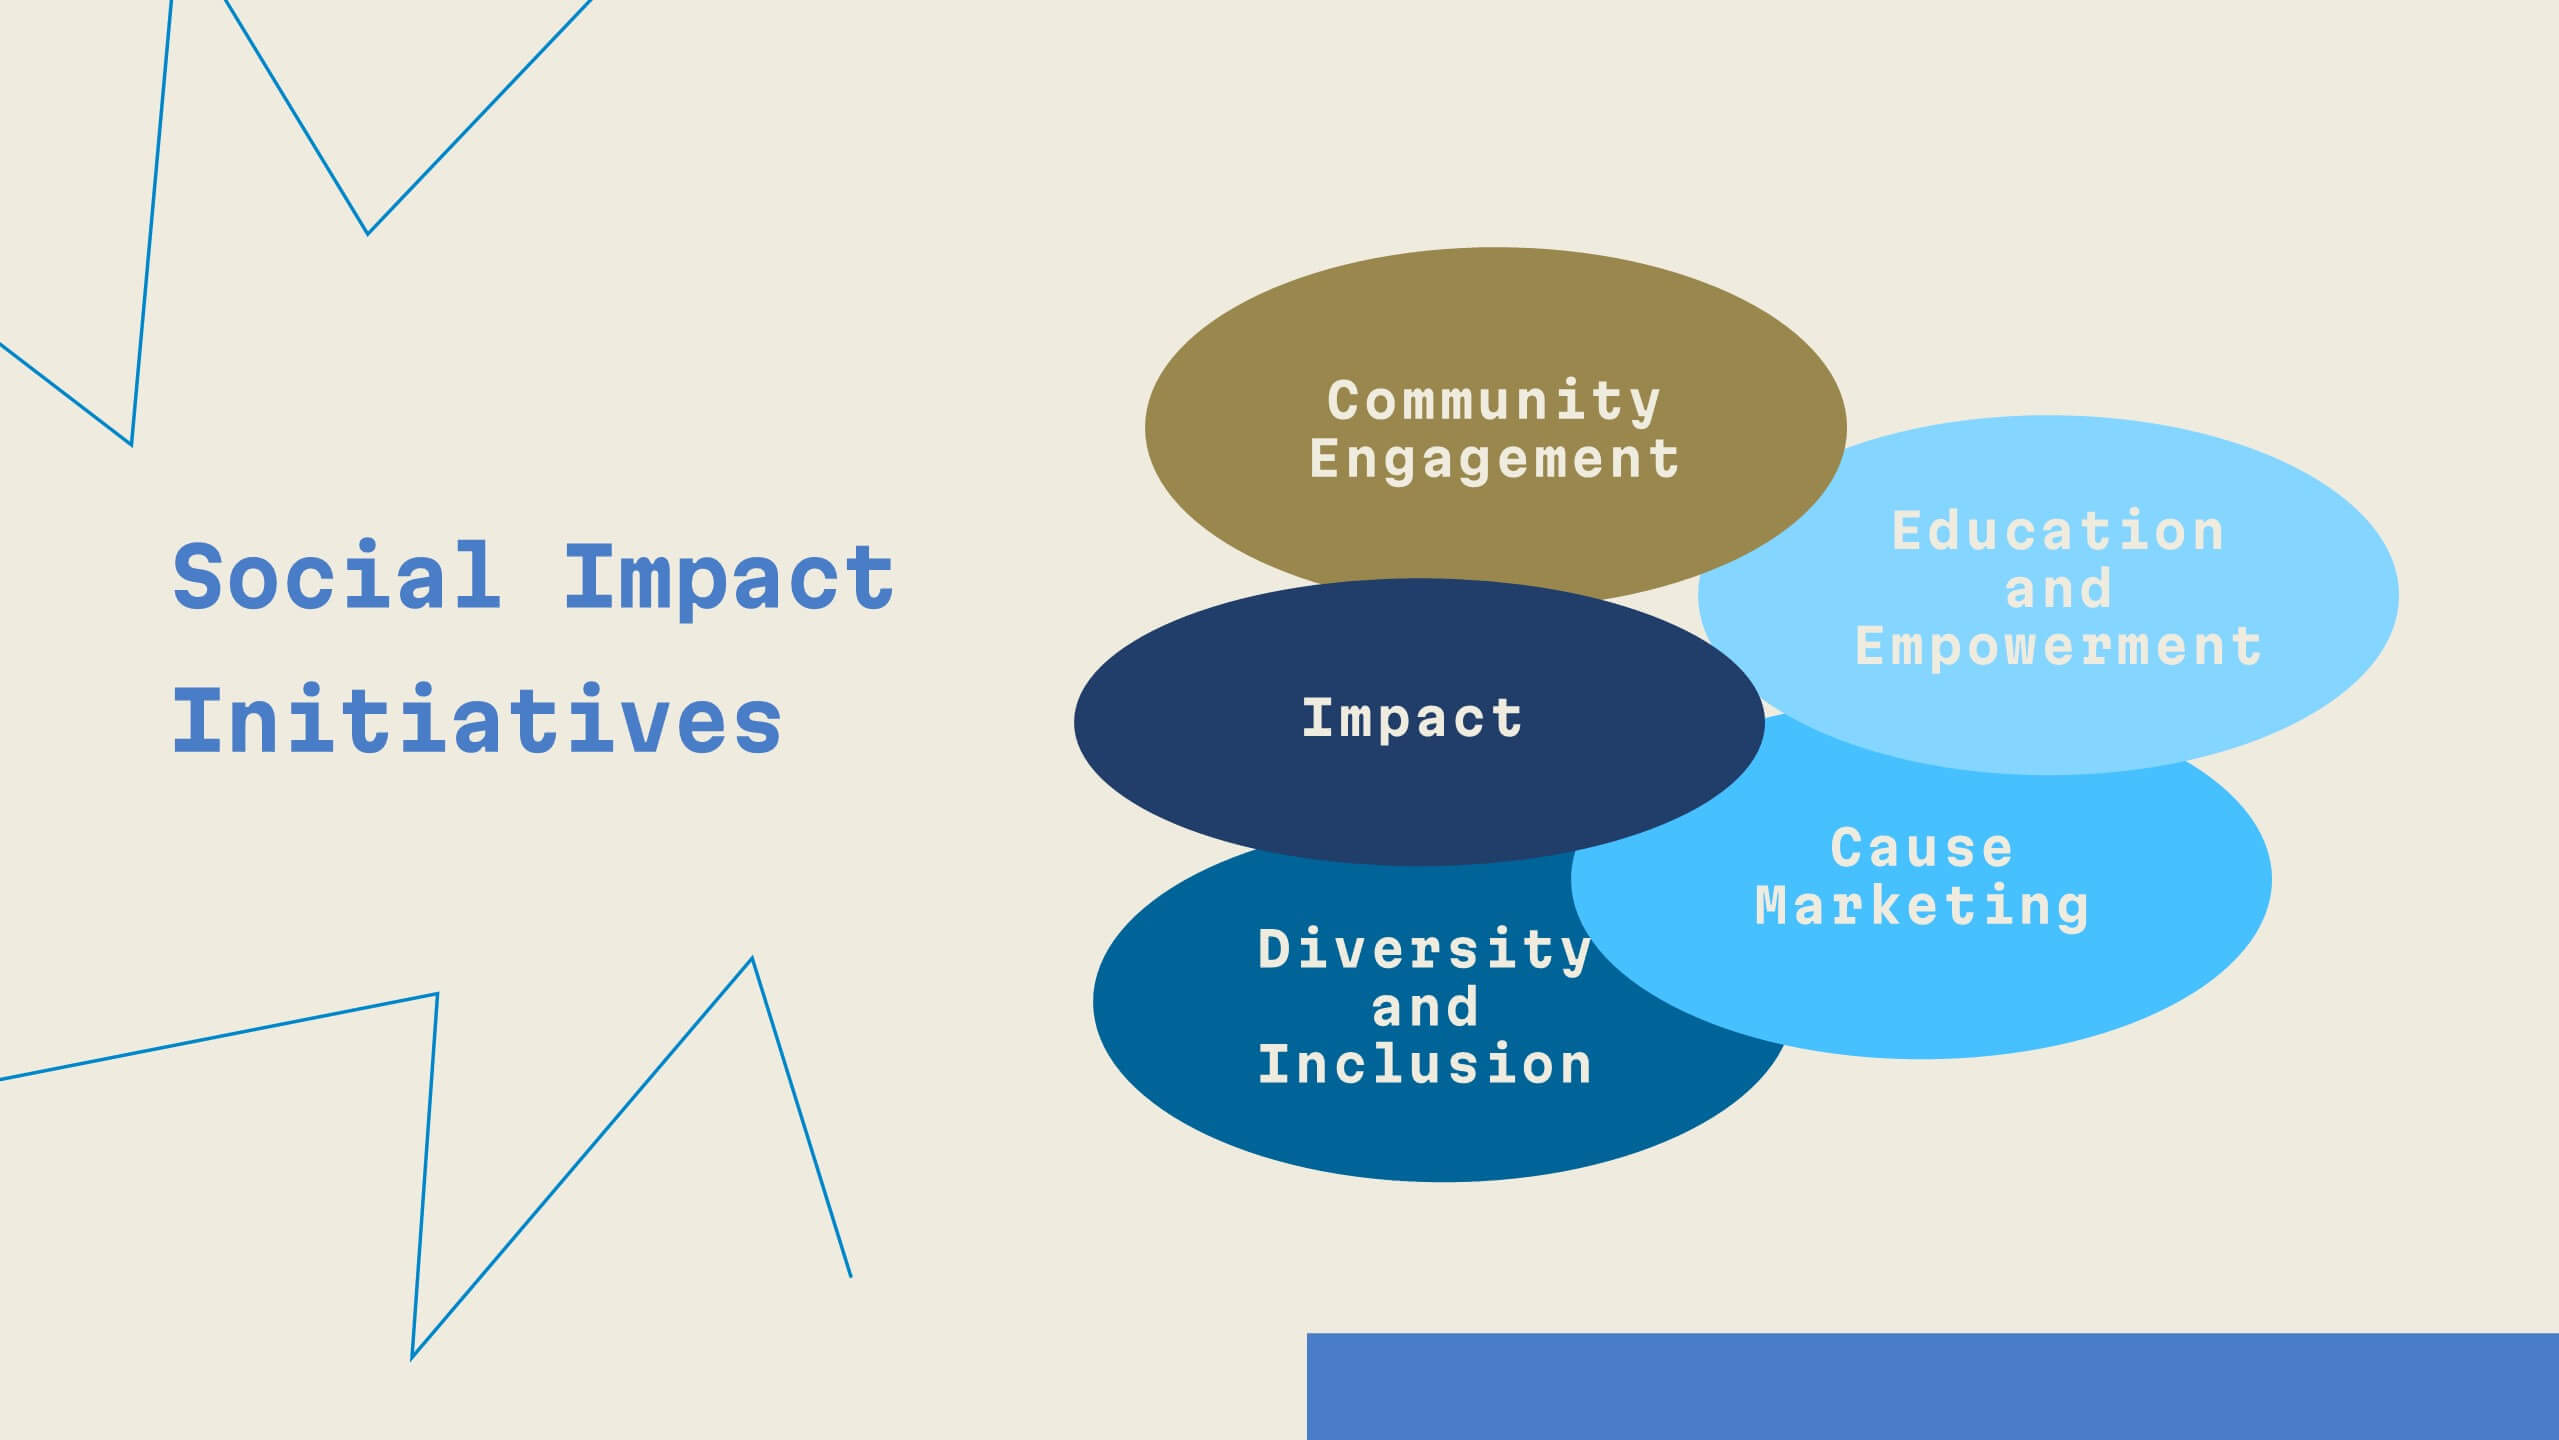
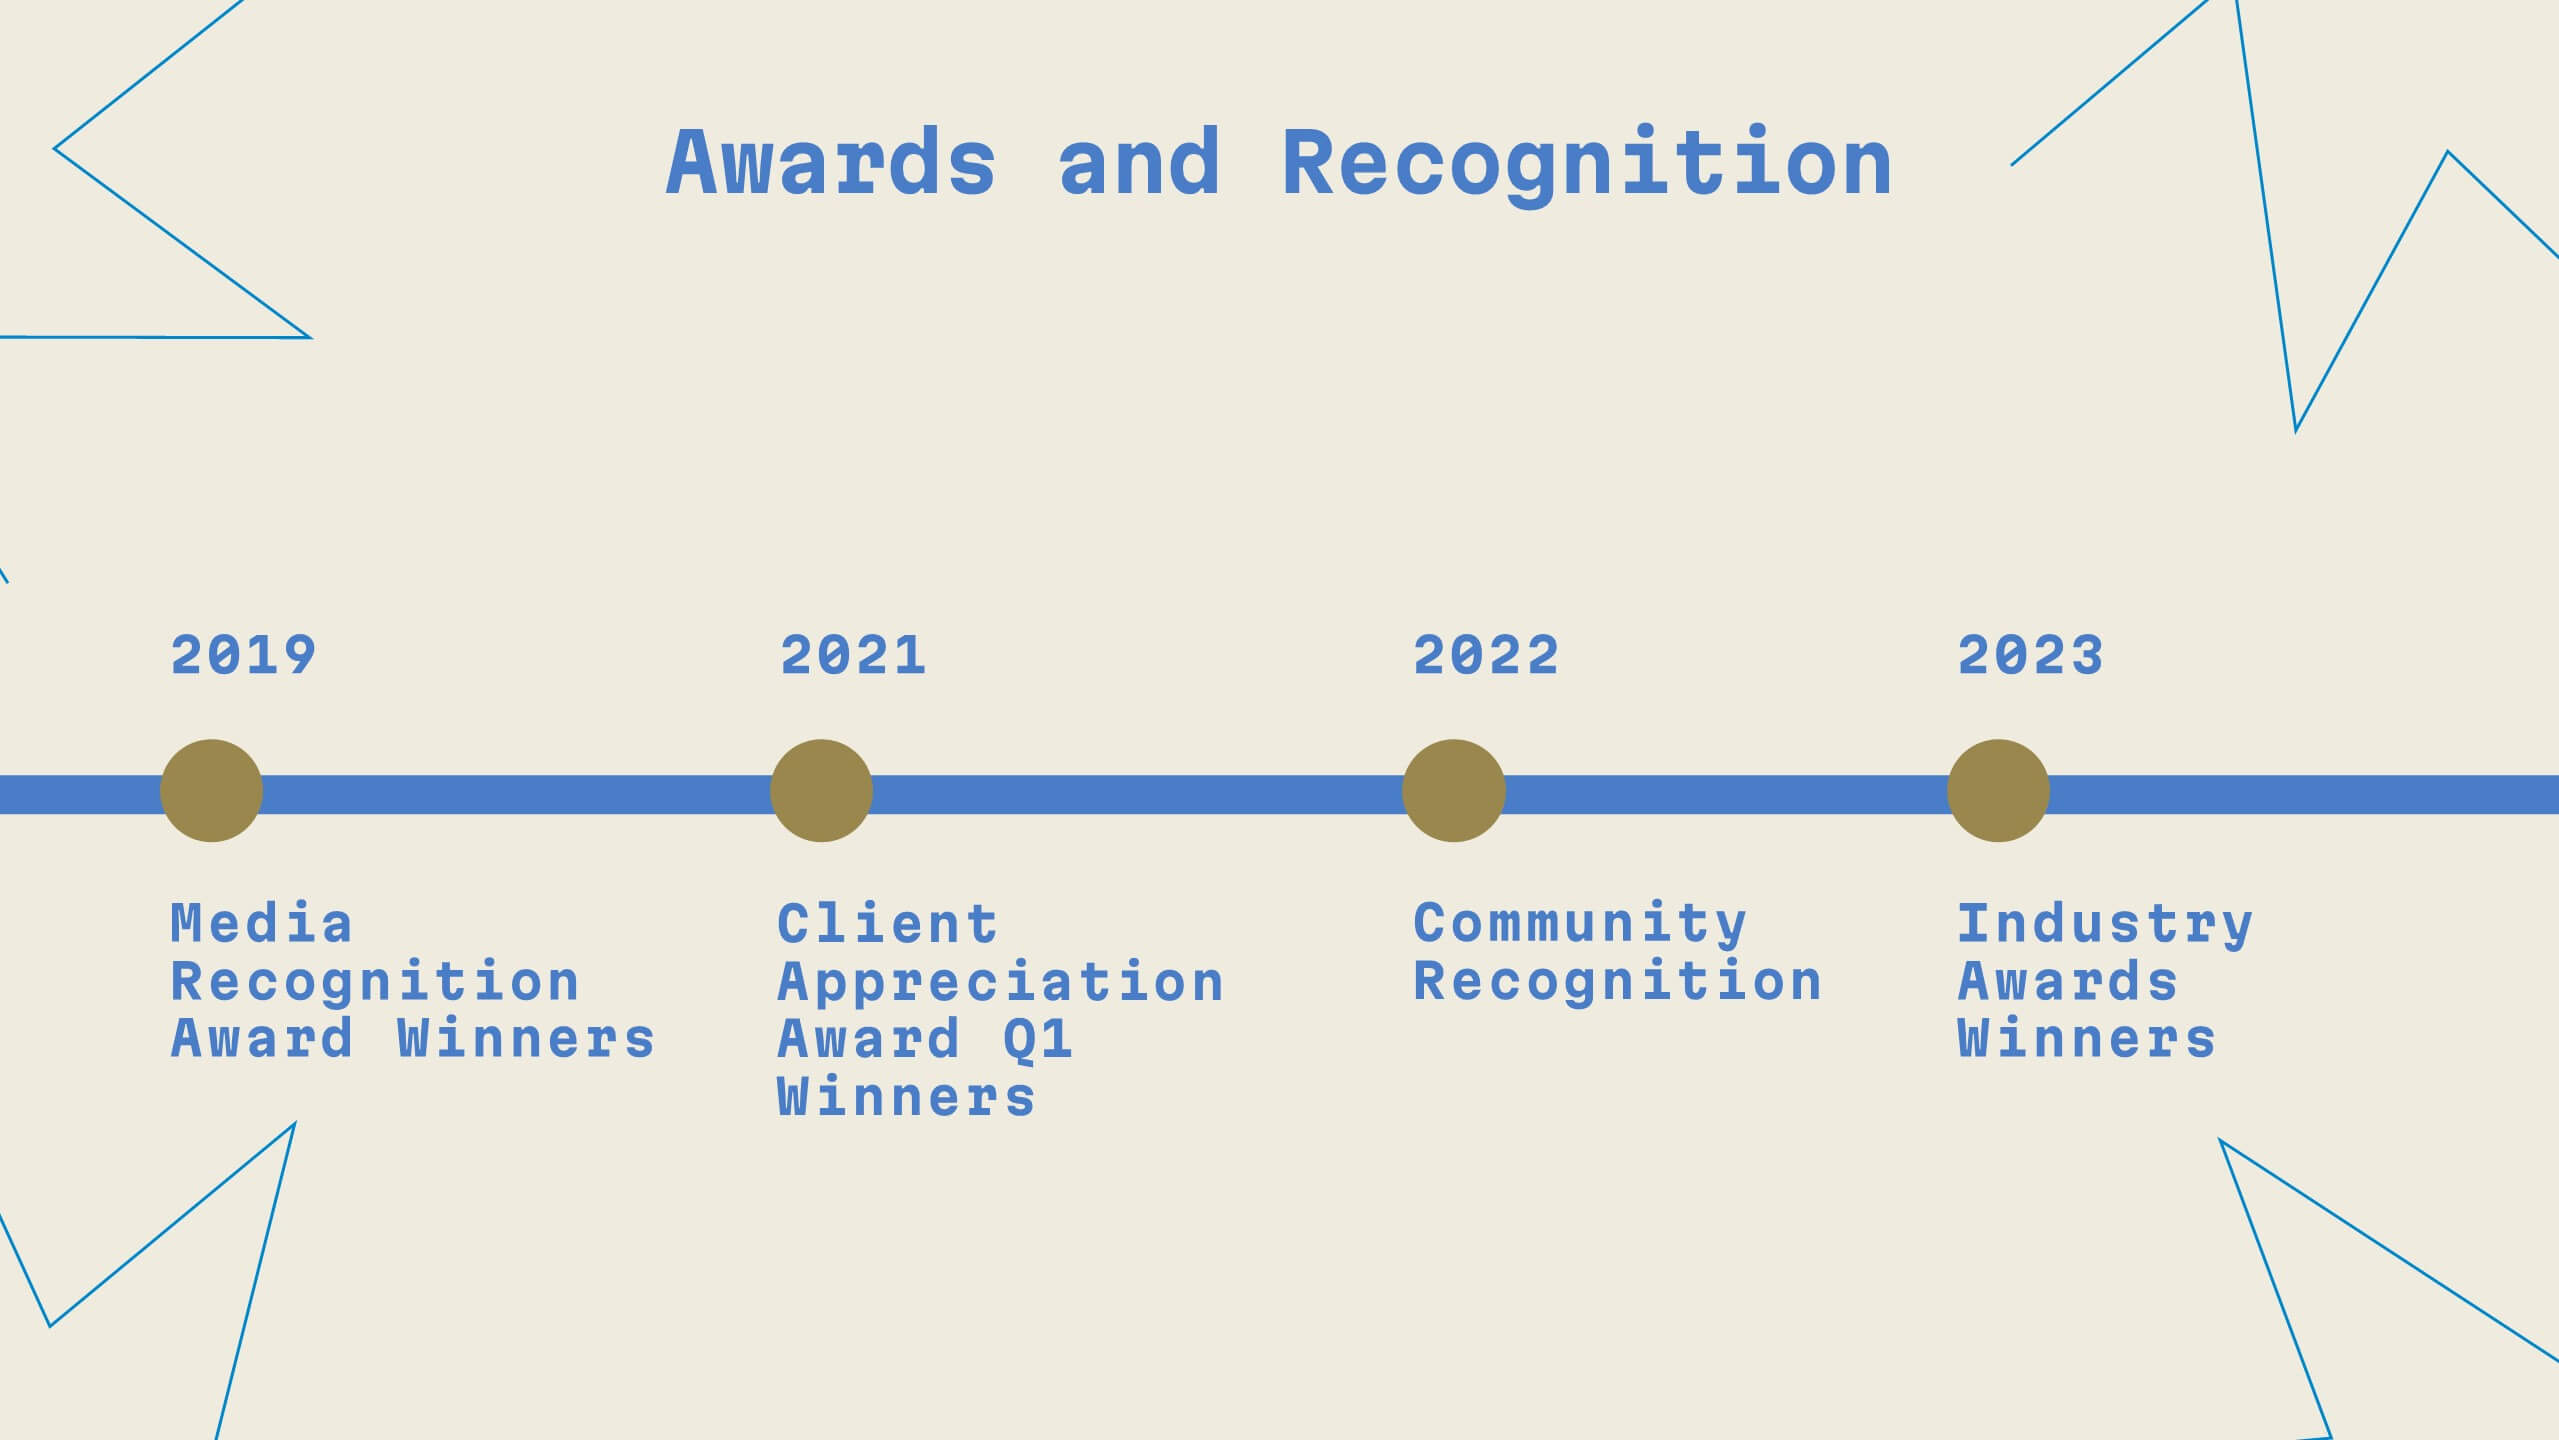
Unity Digital Agency Strategy Plan Presentation
Step into the future of digital marketing with this sleek template! From case studies to strategy development, it offers a comprehensive guide for creating impactful presentations. Highlight client success stories, industry trends, and creative processes with ease. Perfect for showcasing your agency's expertise. Compatible with PowerPoint, Keynote, and Google Slides.


12 diapositivas
Corporate Growth Strategy Steps Presentation
Showcase your expansion roadmap with this Corporate Growth Strategy Steps Presentation. Designed as a five-step vertical ladder, this layout is perfect for illustrating progressive stages like market entry, development, scaling, innovation, and leadership. Each level includes editable icons and text placeholders for clarity and customization. Fully compatible with PowerPoint, Keynote, and Google Slides.


2 diapositivas
Mobile and Laptop Mockup Devices Presentation
Showcase your designs with the Mobile and Laptop Mockup Devices presentation template. Featuring clean and modern device frames, this slide helps you present responsive web designs, app interfaces, or digital content seamlessly. Ideal for designers, marketers, and tech presentations. Fully editable and compatible with PowerPoint, Keynote, and Google Slides.


7 diapositivas
Cryptocurrency Prices Infographic
Cryptocurrency prices refer to the current or historical values of various cryptocurrencies in terms of a specific fiat currency or other cryptocurrencies. This infographic template is a visual journey into the ever-fluctuating world of digital currencies. This template serves as your gateway to understanding the trends and values of cryptocurrencies, empowering you to make informed decisions in this exciting financial realm. Compatible with Powerpoint, Keynote, and Google Slides. Use this infographic to easily present major cryptocurrencies as celestial bodies, emphasizing the vastness and potential of the crypto universe.


2 diapositivas
Engaging Opening Introduction Presentation
Make a lasting first impression with this Engaging Opening Introduction Slide. Designed for professional presentations, networking events, and business pitches, this slide offers a modern, structured layout with a dynamic image section and clear text area. Fully customizable in PowerPoint, Keynote, and Google Slides, you can easily adjust colors, fonts, and content to match your brand.


8 diapositivas
Customer Targeting and Persona Creation Presentation
Hook your audience with a clean, modern layout that zooms in on what really matters—your ideal customer. This customer persona template helps visualize traits, behaviors, and key targets for effective marketing. Perfect for campaign planning, branding, or audience research. Fully compatible with PowerPoint, Keynote, and Google Slides.


20 diapositivas
Solstice Startup Funding Proposal Presentation
This sleek startup funding proposal deck showcases your company’s objectives, services, sales process, and pricing strategy. Perfect for pitching investors or stakeholders, its modern design ensures a professional presentation. Compatible with PowerPoint, Keynote, and Google Slides, it's ideal for making a strong impression with minimal effort.


20 diapositivas
Aether Marketing Research Report Presentation
The Marketing Research Report Presentation Template offers a sleek design with 20 fully customizable slides, ideal for presenting in-depth marketing insights. This template features sections for industry analysis, consumer behavior, emerging technologies, and marketing trends like SEO, social media, and influencer strategies. It also highlights e-commerce trends, personalization, sustainability, and storytelling techniques. The modern black-and-gold gradient aesthetic adds sophistication, making it perfect for professional reports. Compatible with PowerPoint, Keynote, and Google Slides, this template ensures a polished and engaging presentation experience.


22 diapositivas
Athena Creative Design Report Presentation
Showcase your creative projects with this vibrant design report template! Highlight objectives, concept development, prototypes, and design iterations with sleek visuals. Perfect for designers and creative teams. Compatible with PowerPoint, Keynote, and Google Slides.


26 diapositivas
Natlea Presentation Template
Need help presenting your next travel destination? This template is a unique and sophisticated way to present your travel destination. The Natlea travel template is a fun, surprisingly sophisticated and easy to use template that allows you to list all the details of your trip. With bold colors, charts, budget slides and venn diagrams this template has it all. It's simple yet fun design makes it stand out and at the same time keep your audience engaged. This is the perfect choice for marketers, tourism professionals or anyone who needs to make a great looking presentation on their next trip.


22 diapositivas
Runestone Scientific Research Presentation
The Scientific Research Presentation Template offers 22 clean and professional slides to present your research findings effectively. Cover key areas like objectives, methodology, data analysis, key findings, and future directions. Perfect for academic or professional settings, it's fully customizable and compatible with PowerPoint, Keynote, and Google Slides.