


Características


¿Tienes alguna pregunta?
Recomendar


8 diapositivas
AI Trends and Future Technology Presentation
Step into the future with this sleek, modern template designed to visualize cutting-edge concepts in artificial intelligence. Featuring futuristic robot graphics and a clean circular flow layout, this design is perfect for showcasing tech trends, automation strategies, or AI-driven innovations. Each section is color-coded and icon-supported for easy customization. Ideal for tech startups, AI researchers, and innovation consultants. Fully editable in PowerPoint, Keynote, and Google Slides.


5 diapositivas
Core to Outer Ring Concentric Planning Presentation
Present your strategy from the inside out with the Core to Outer Ring Concentric Planning Presentation. This layered, radial design guides viewers through a central concept outward into supporting elements—ideal for planning, process modeling, or decision frameworks. Fully customizable in PowerPoint, Keynote, and Google Slides.


20 diapositivas
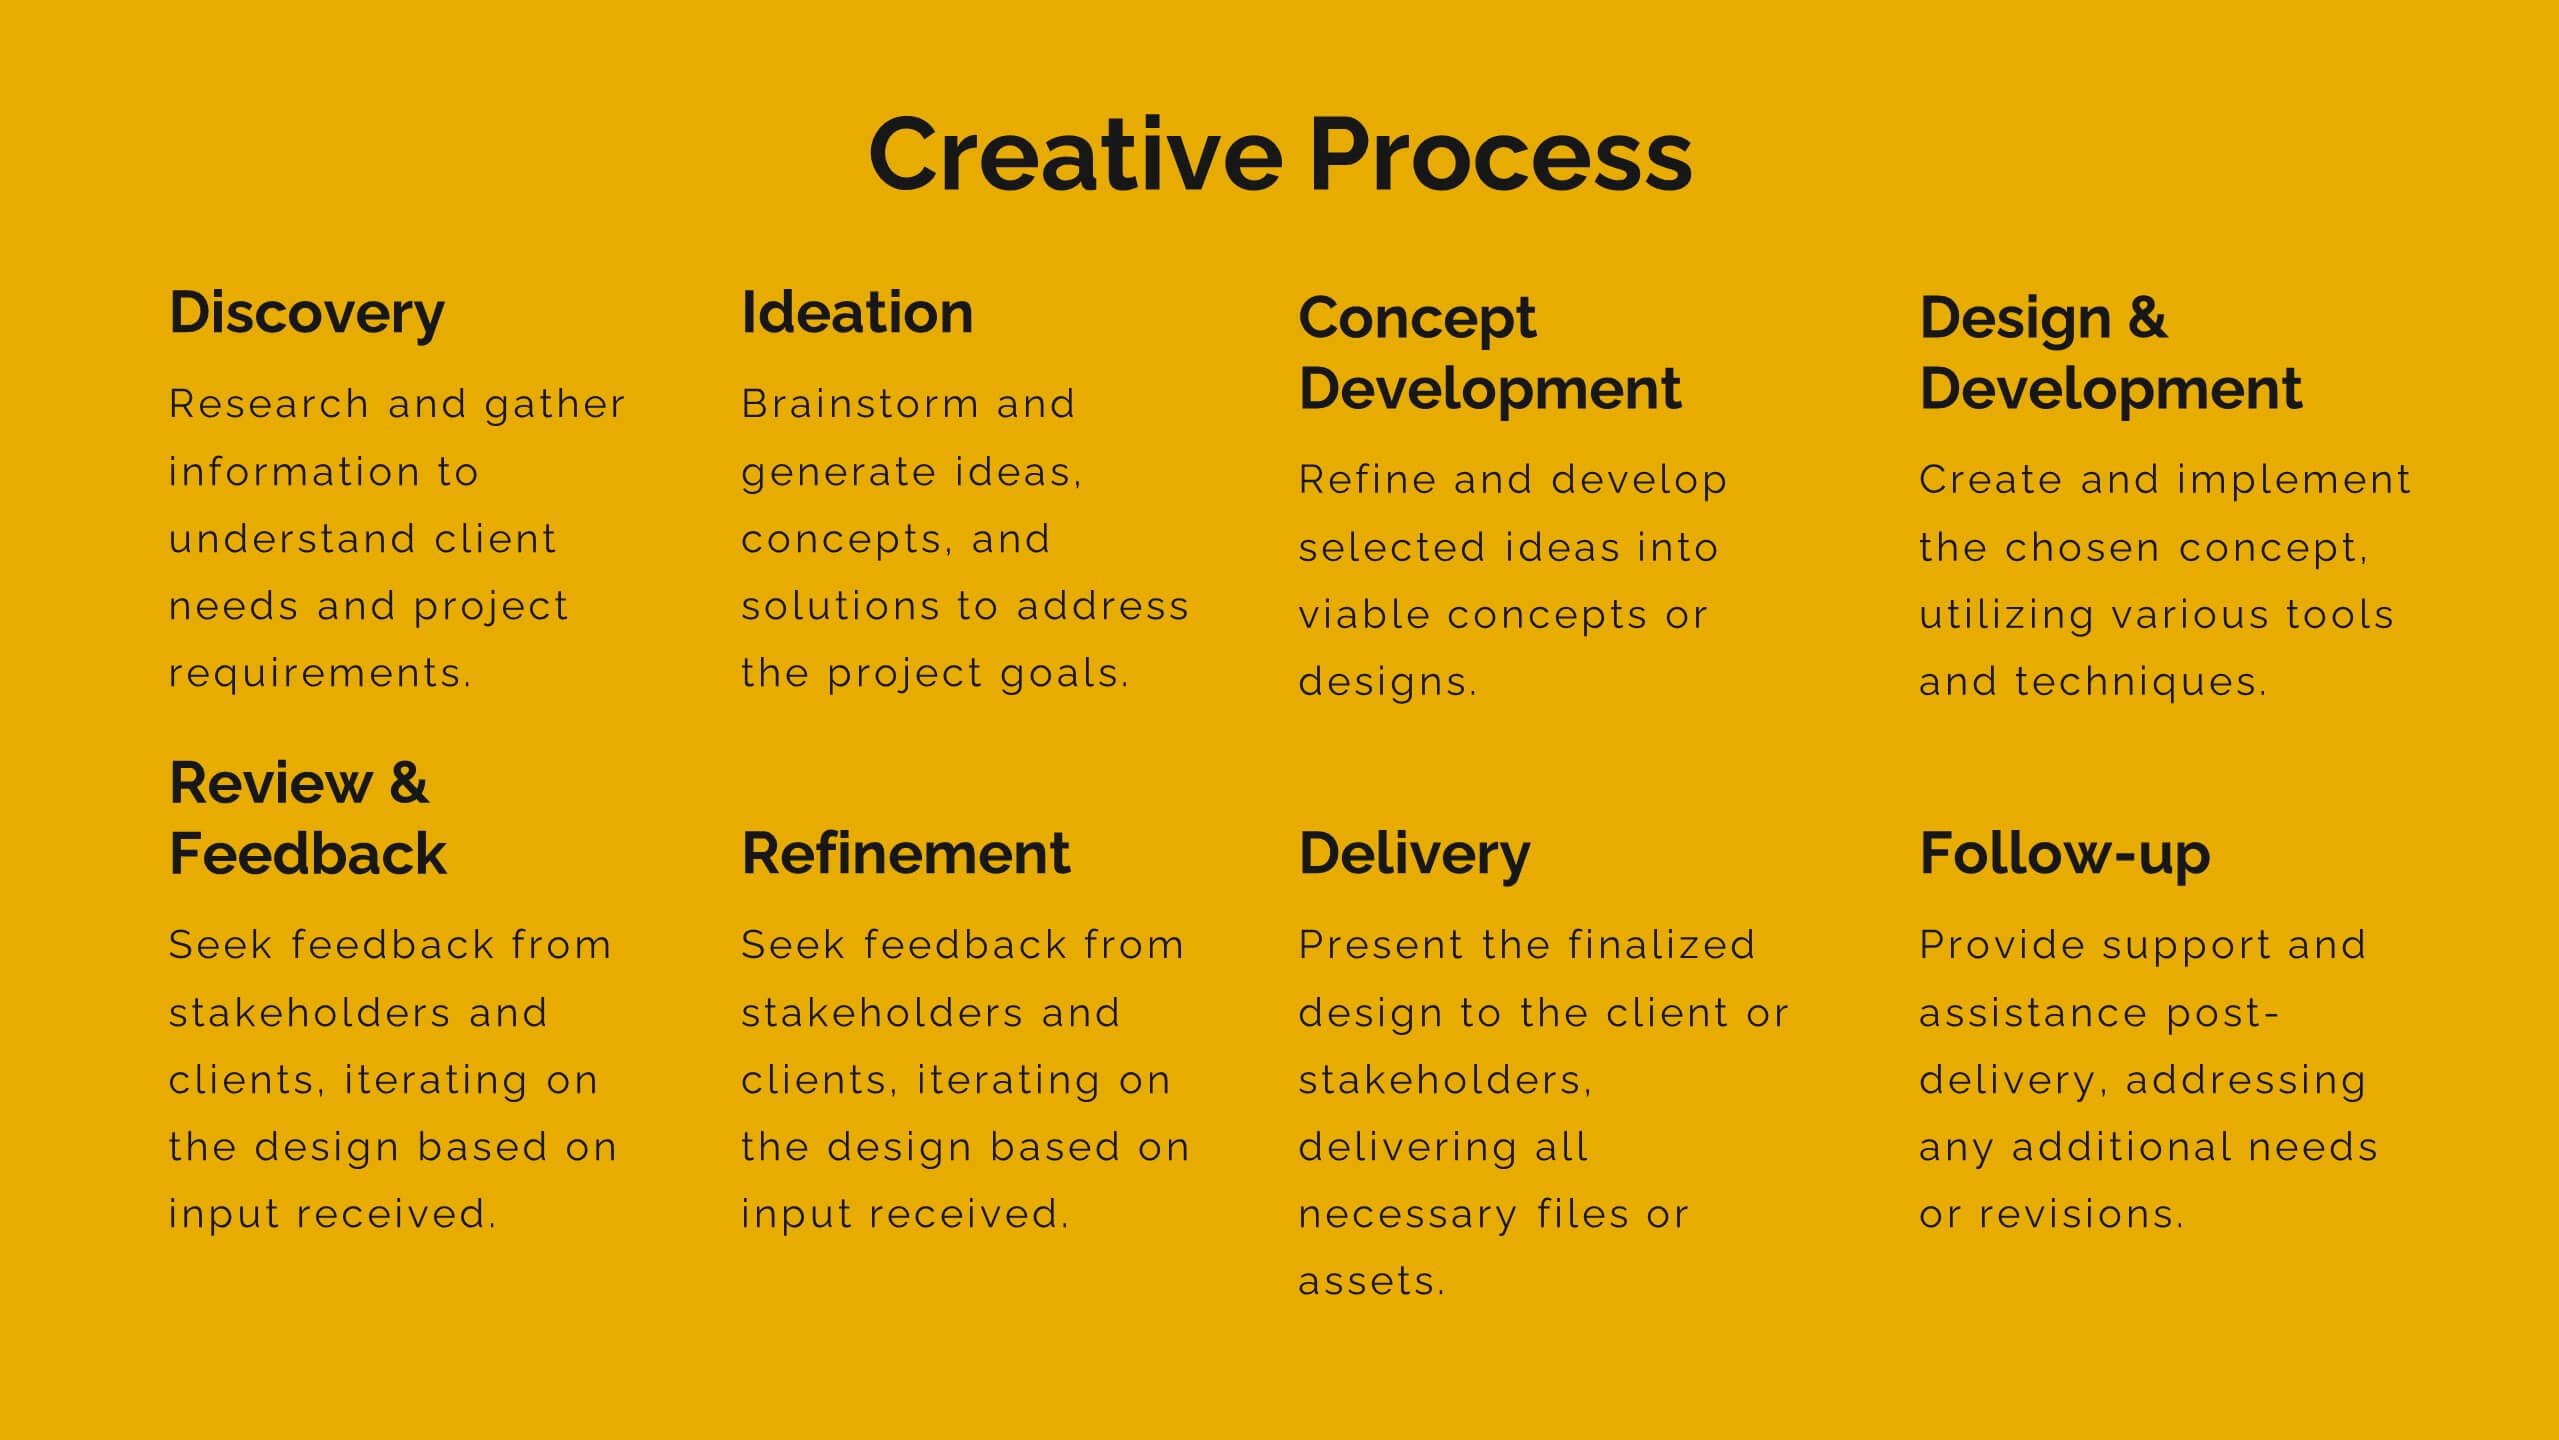
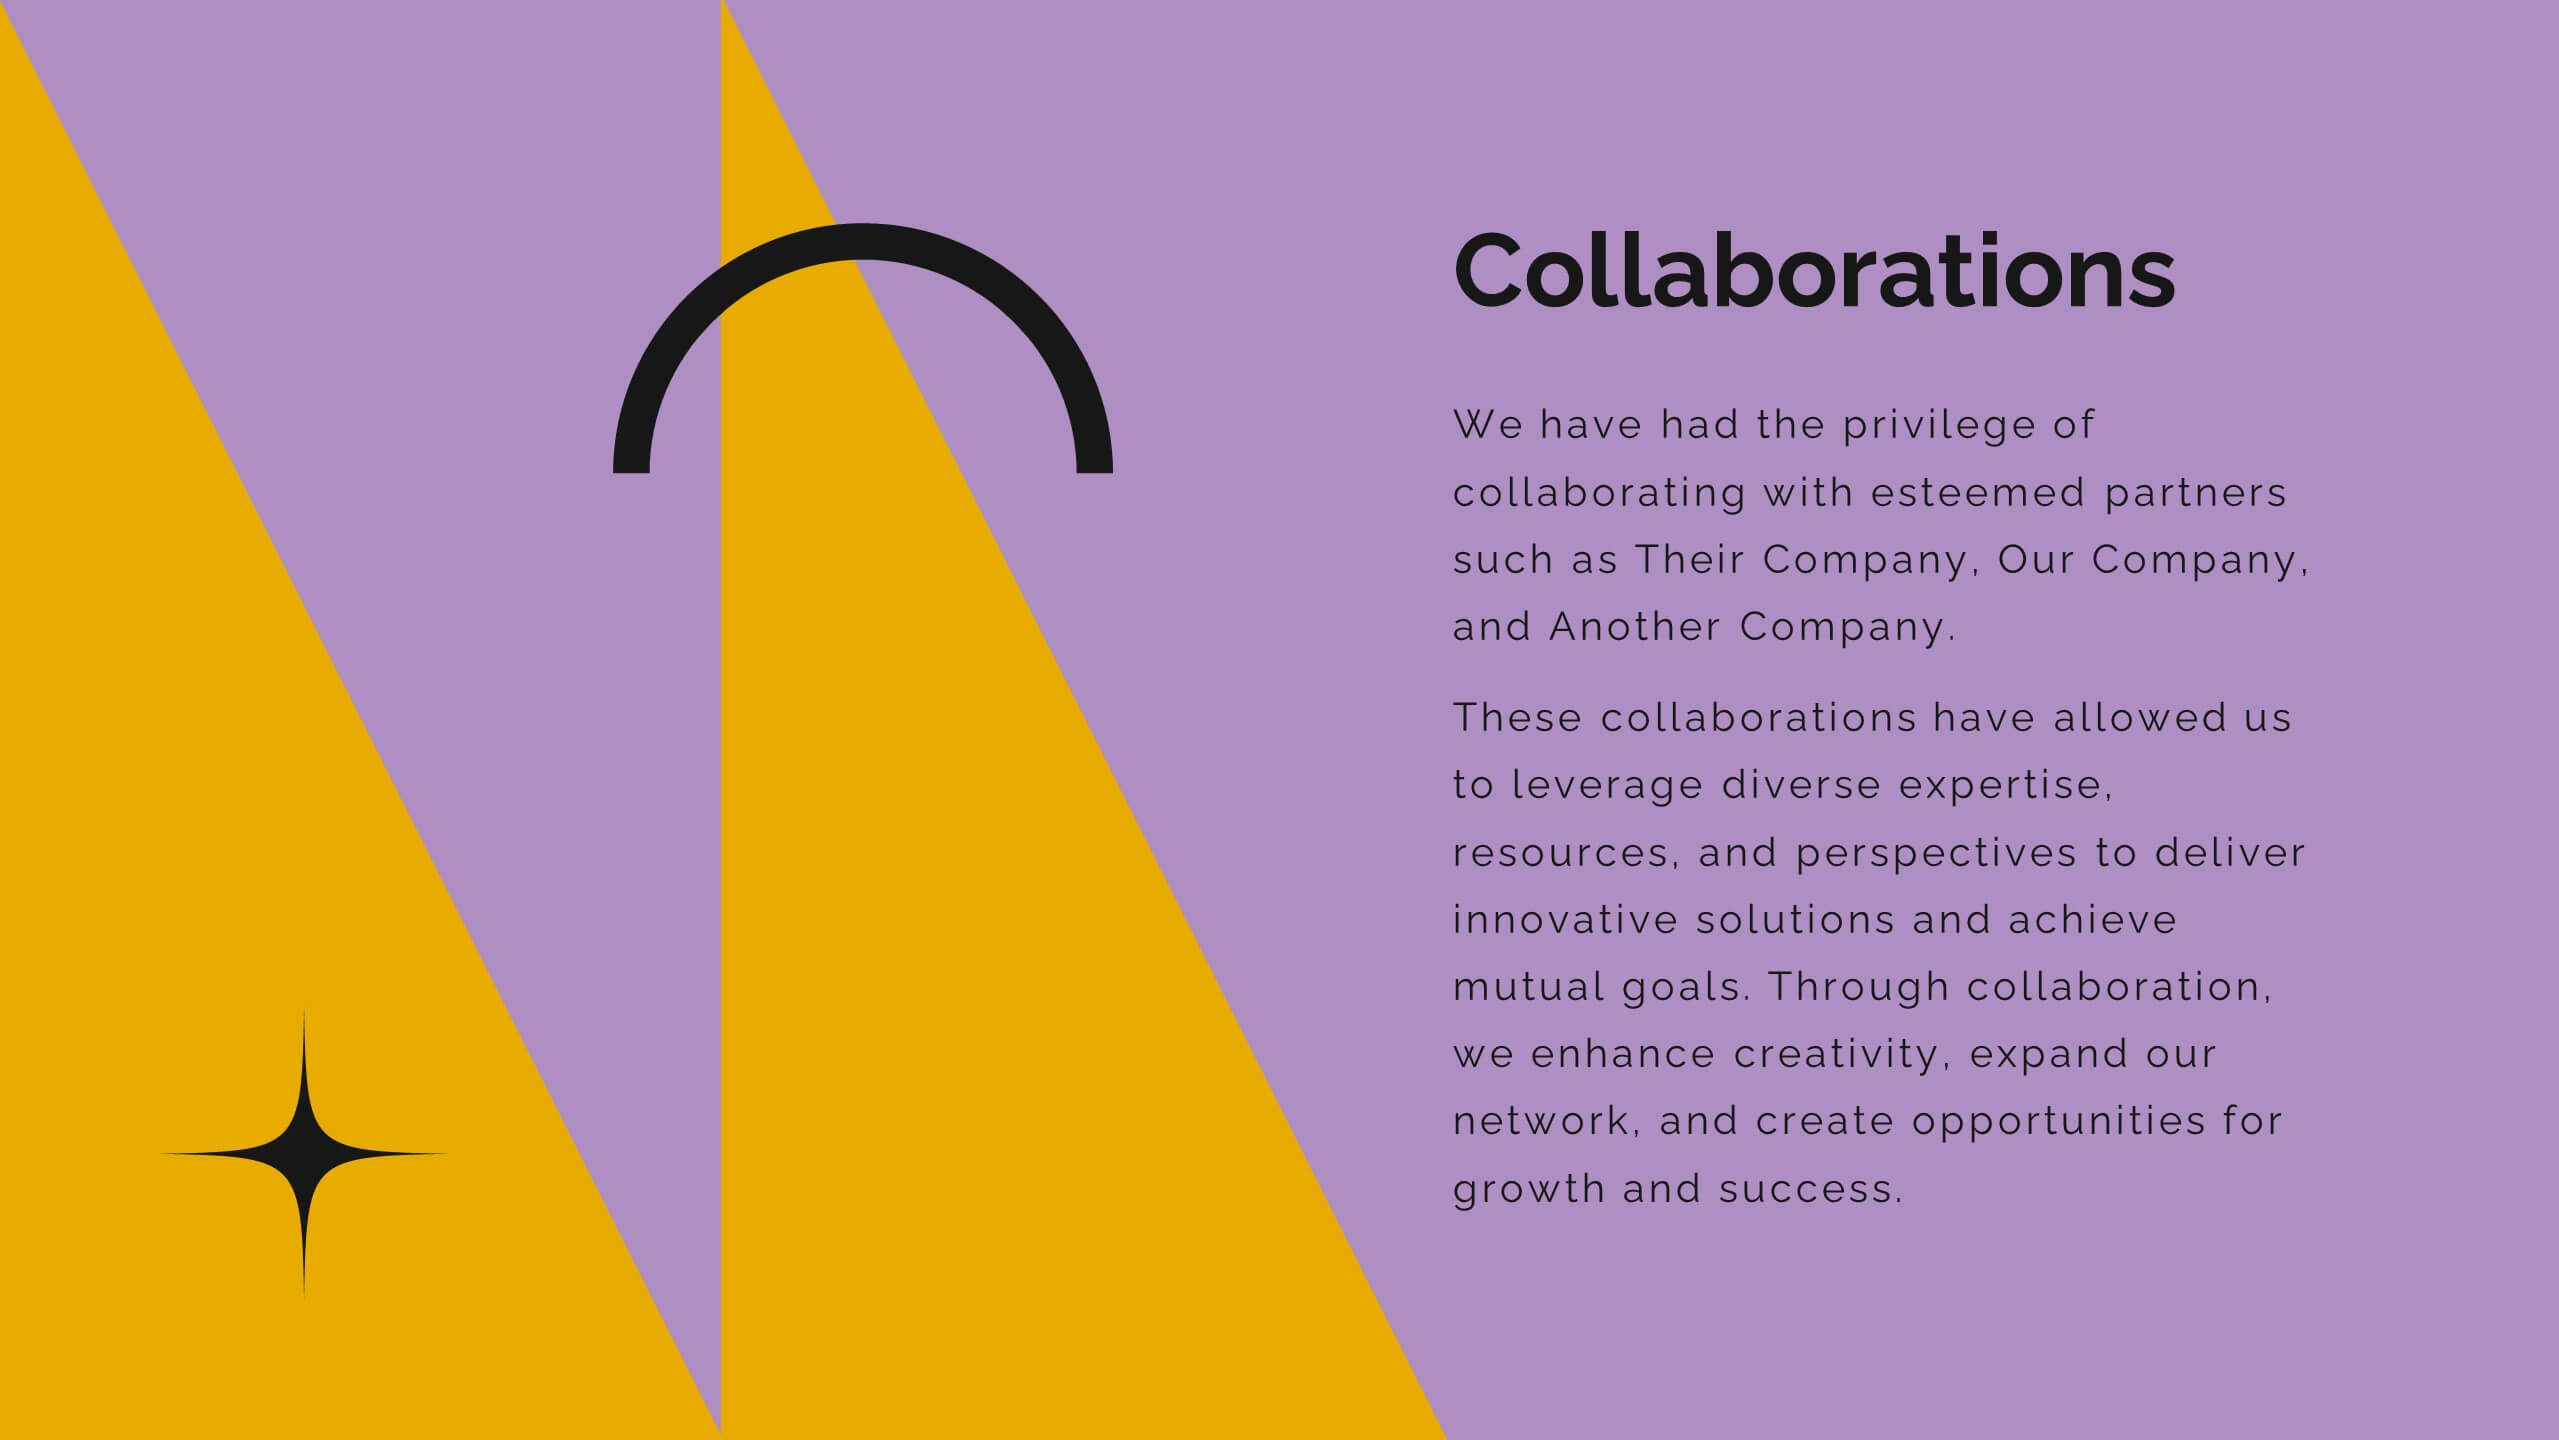
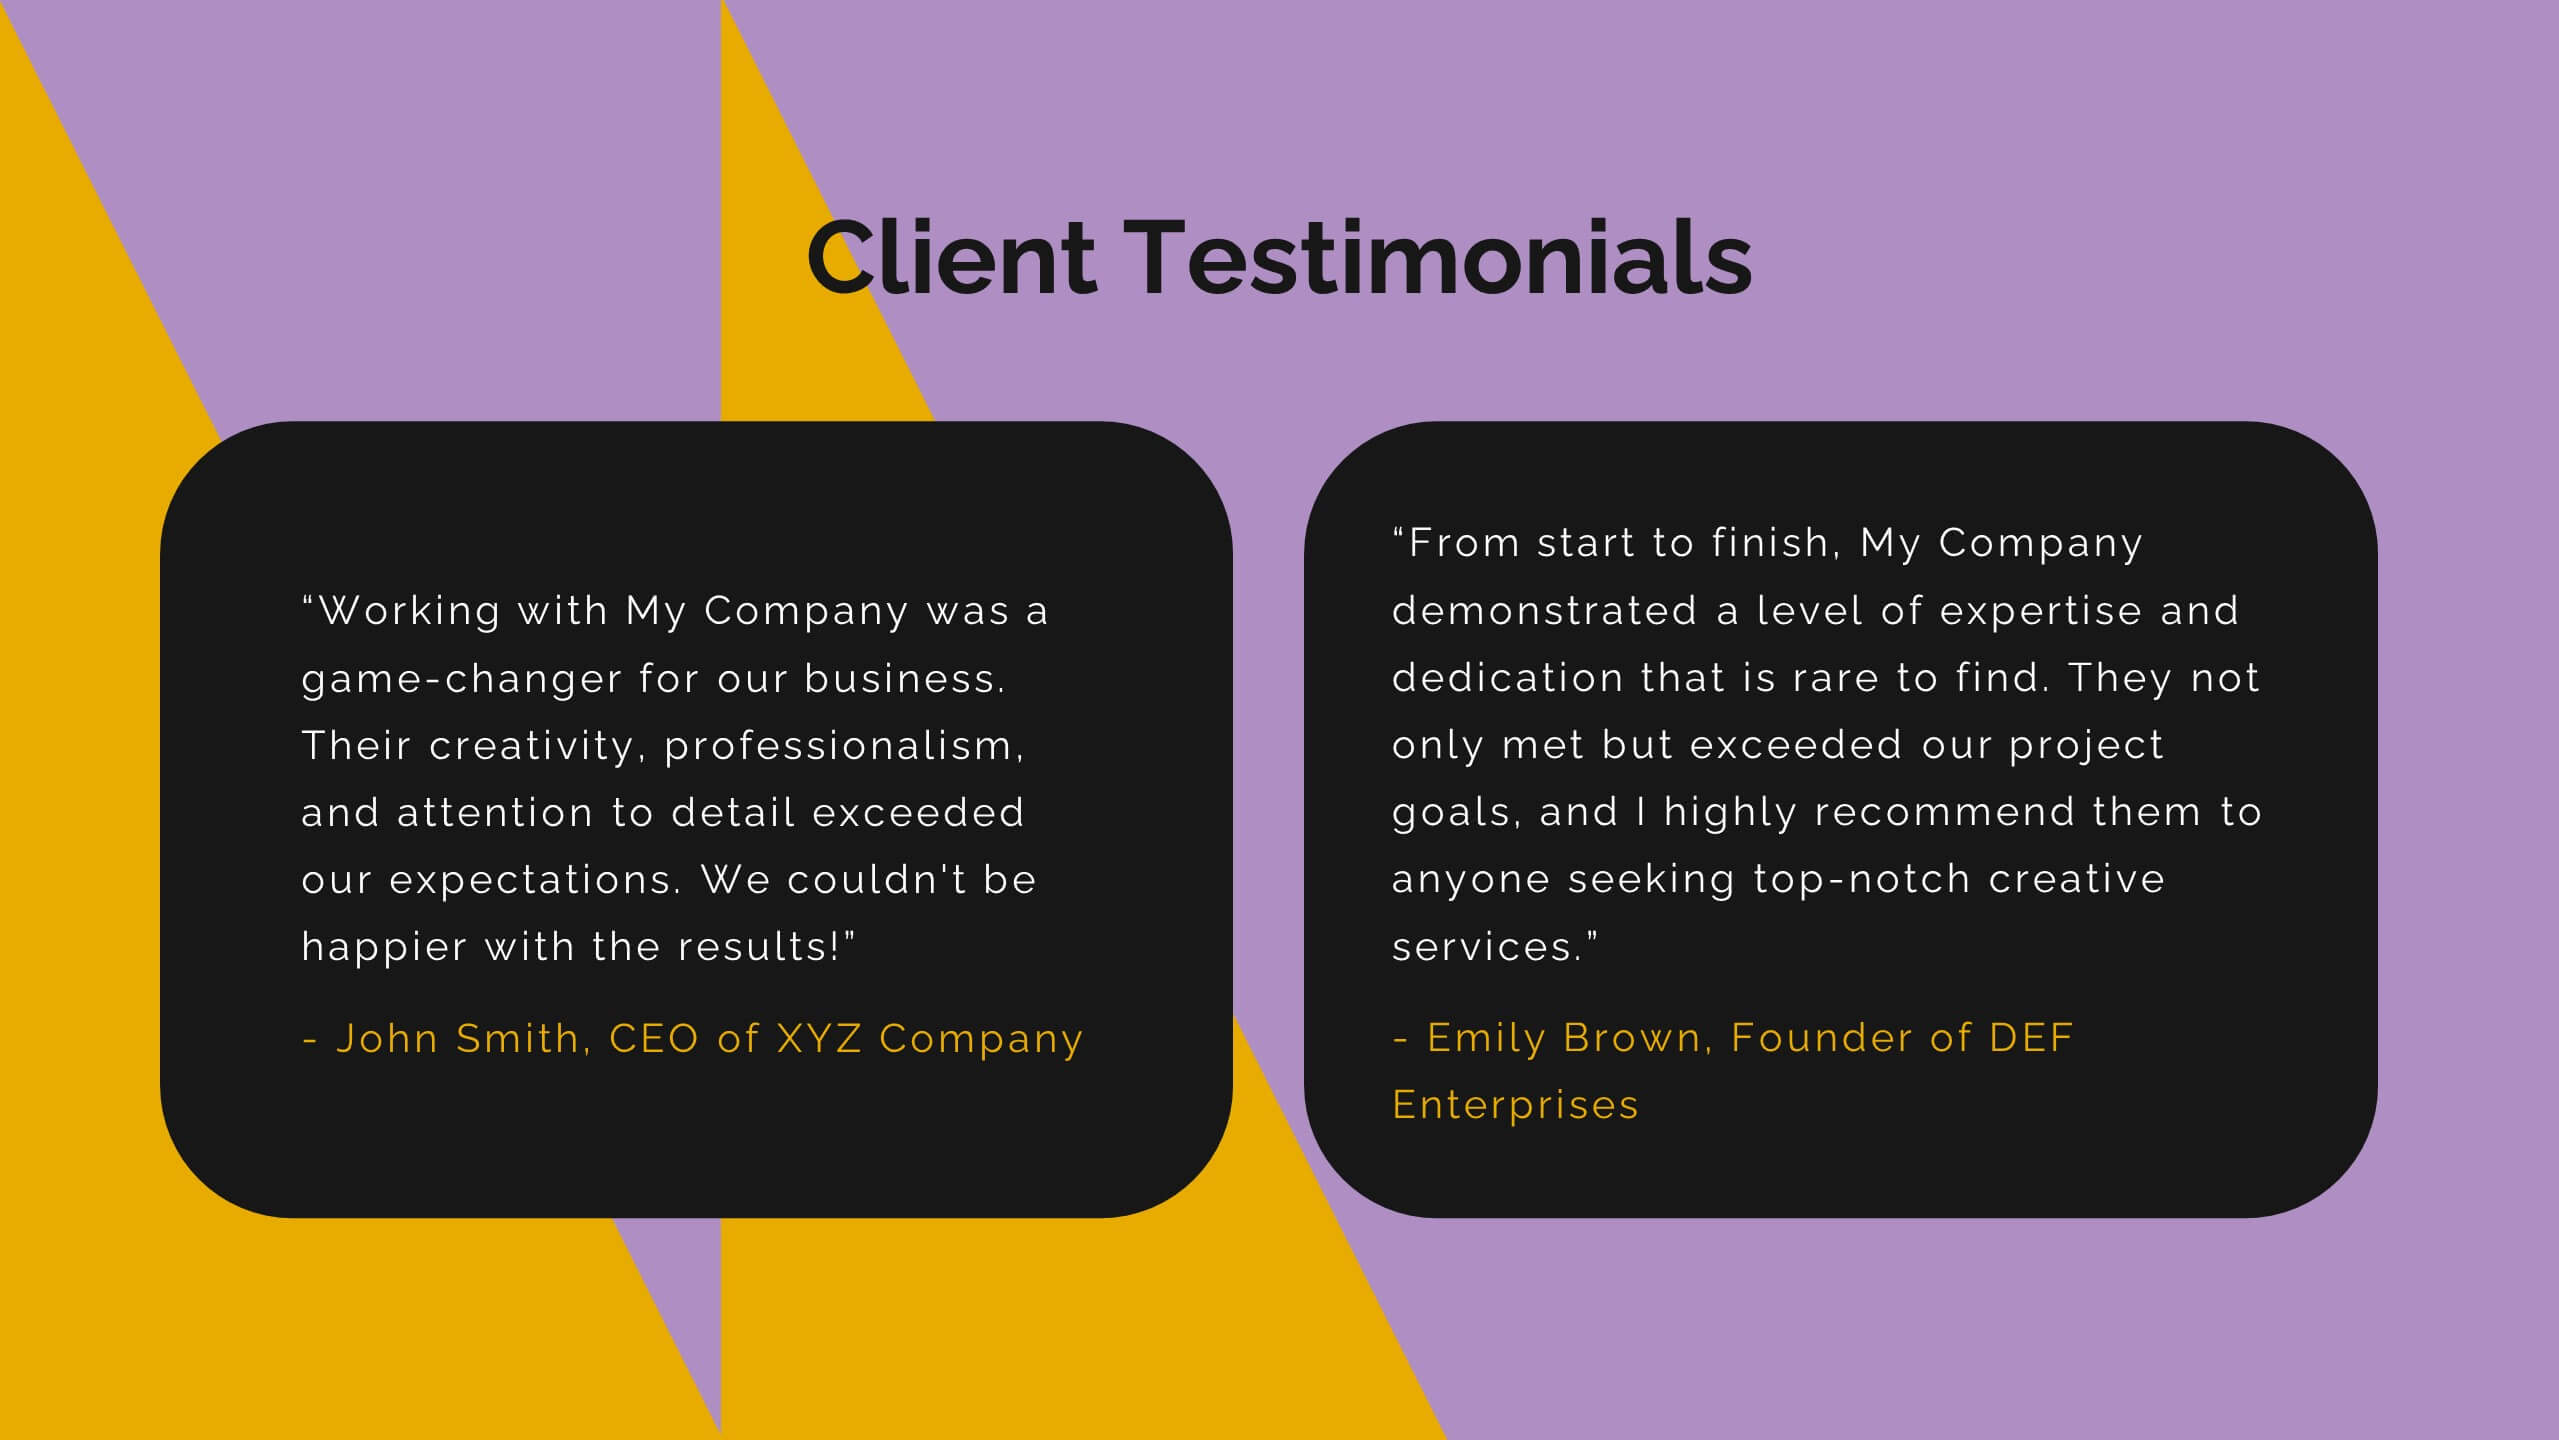
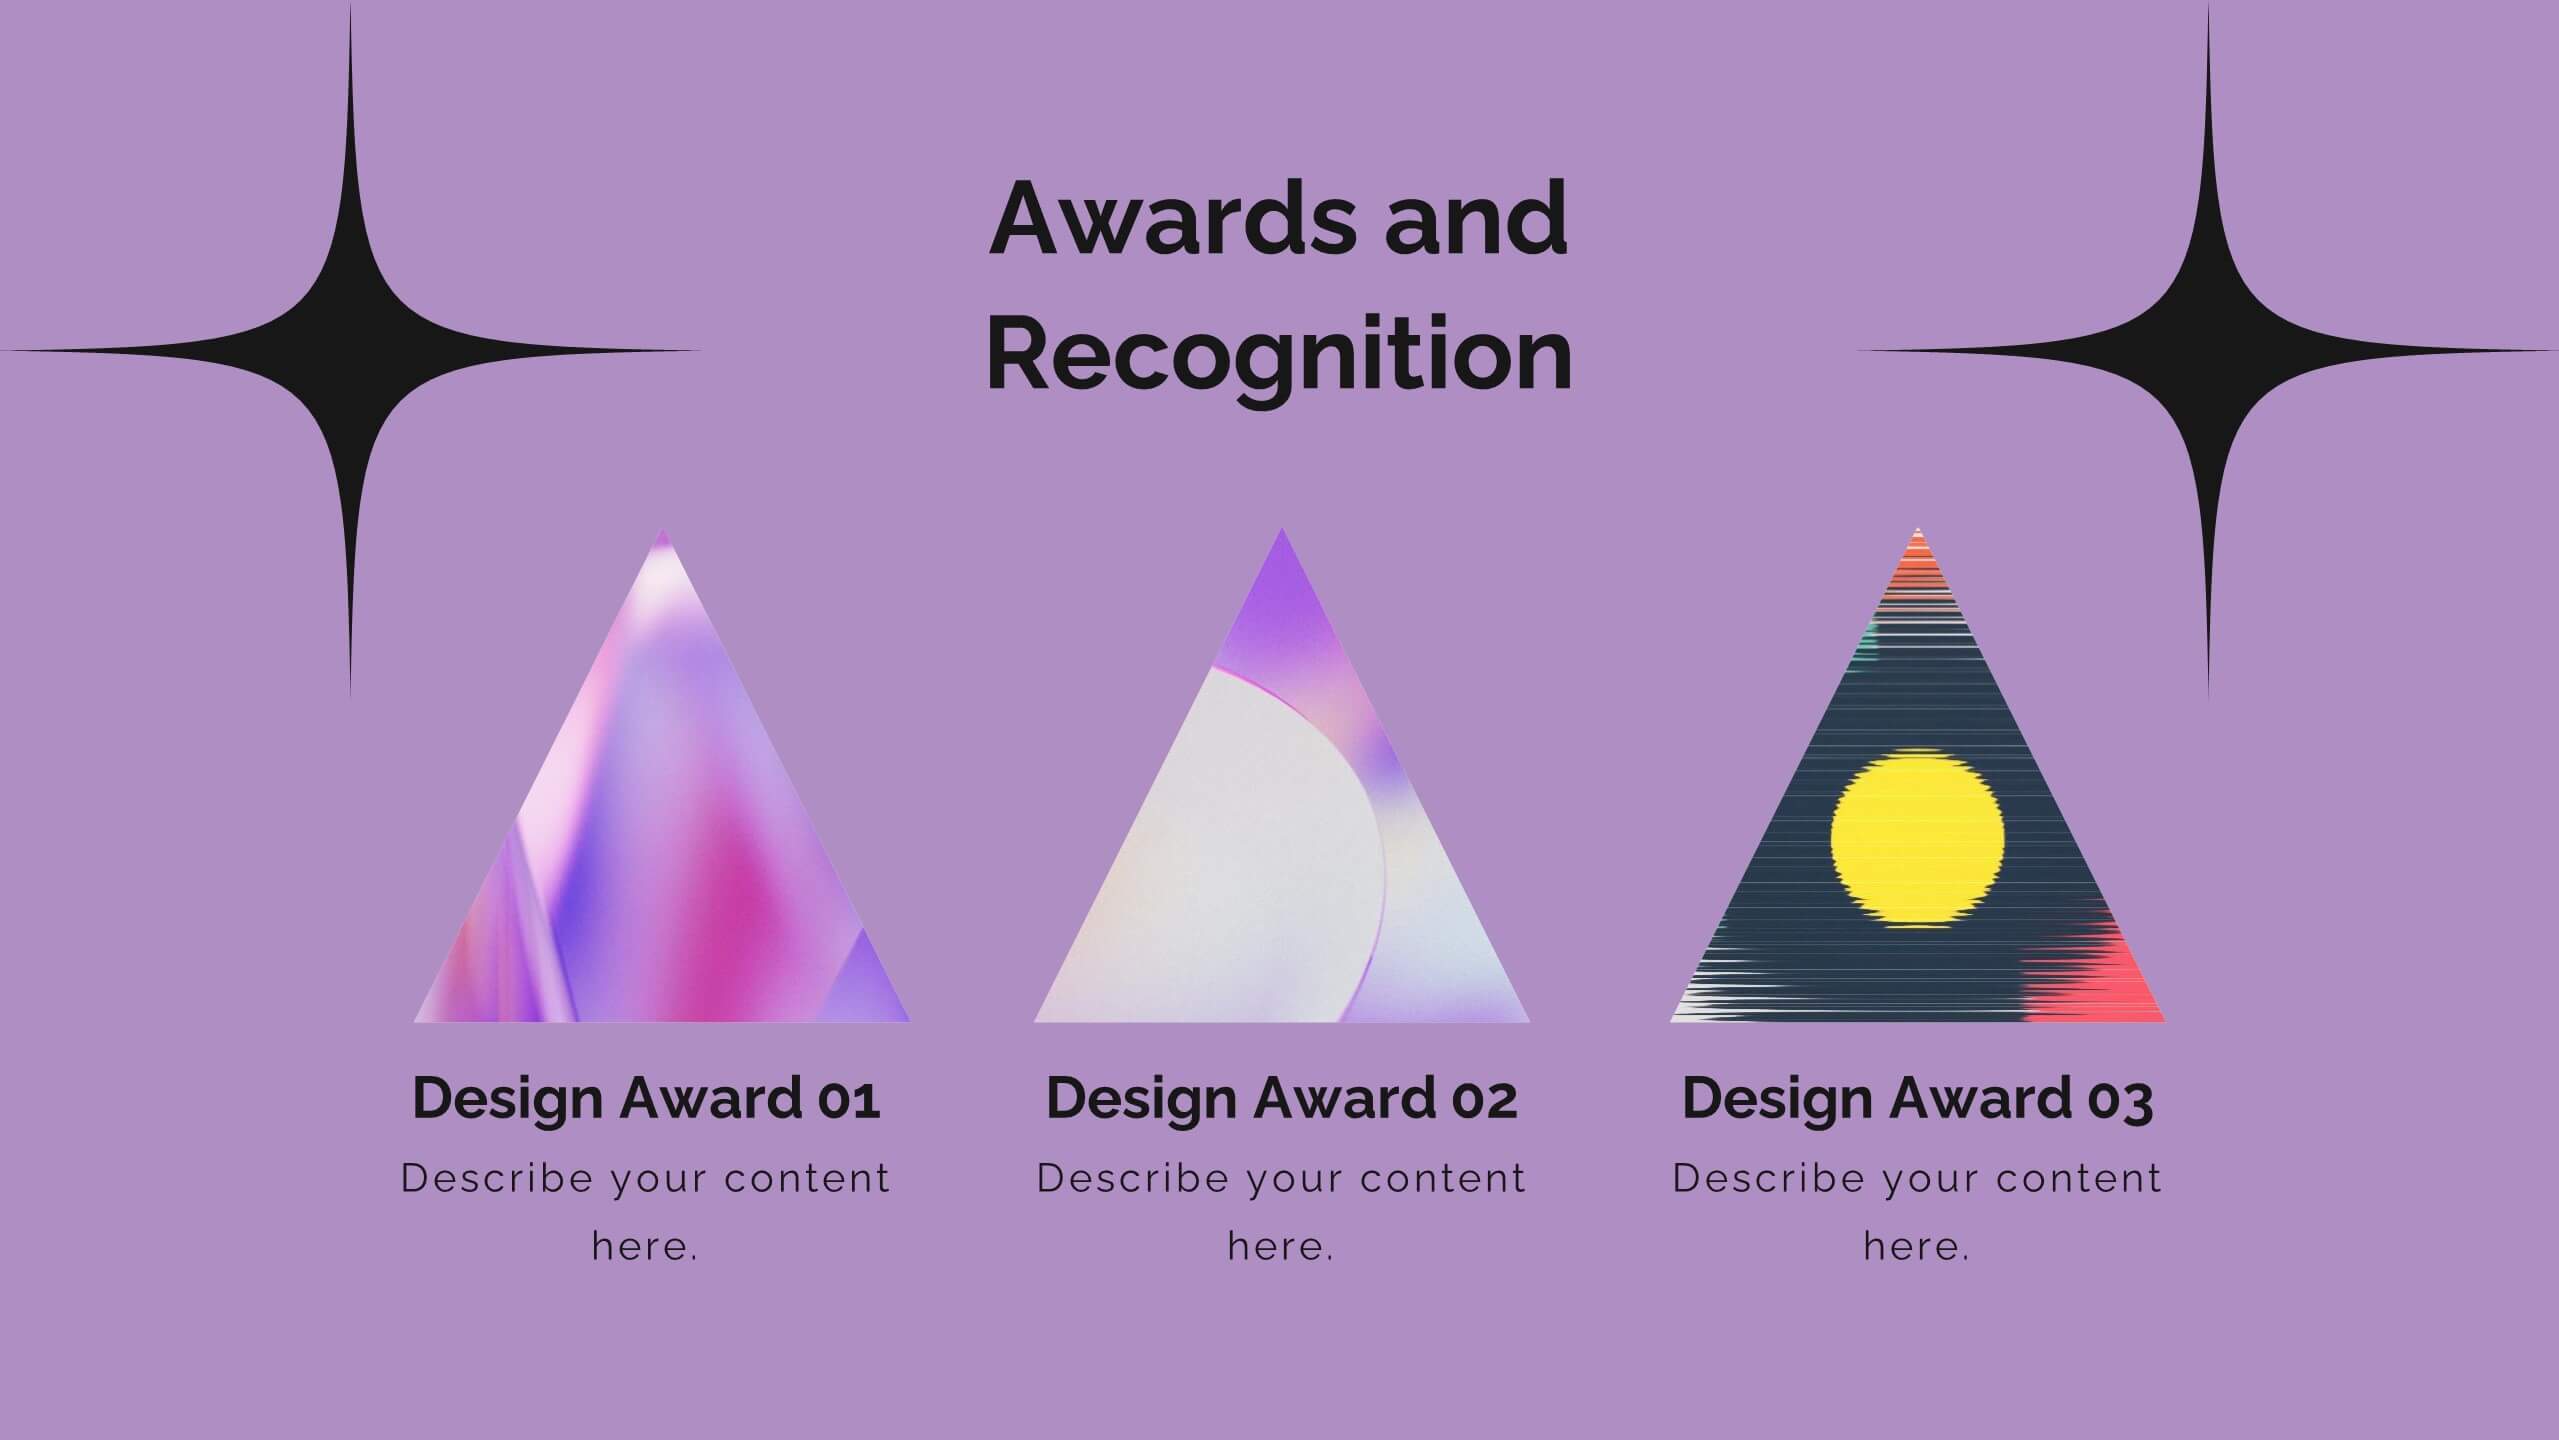
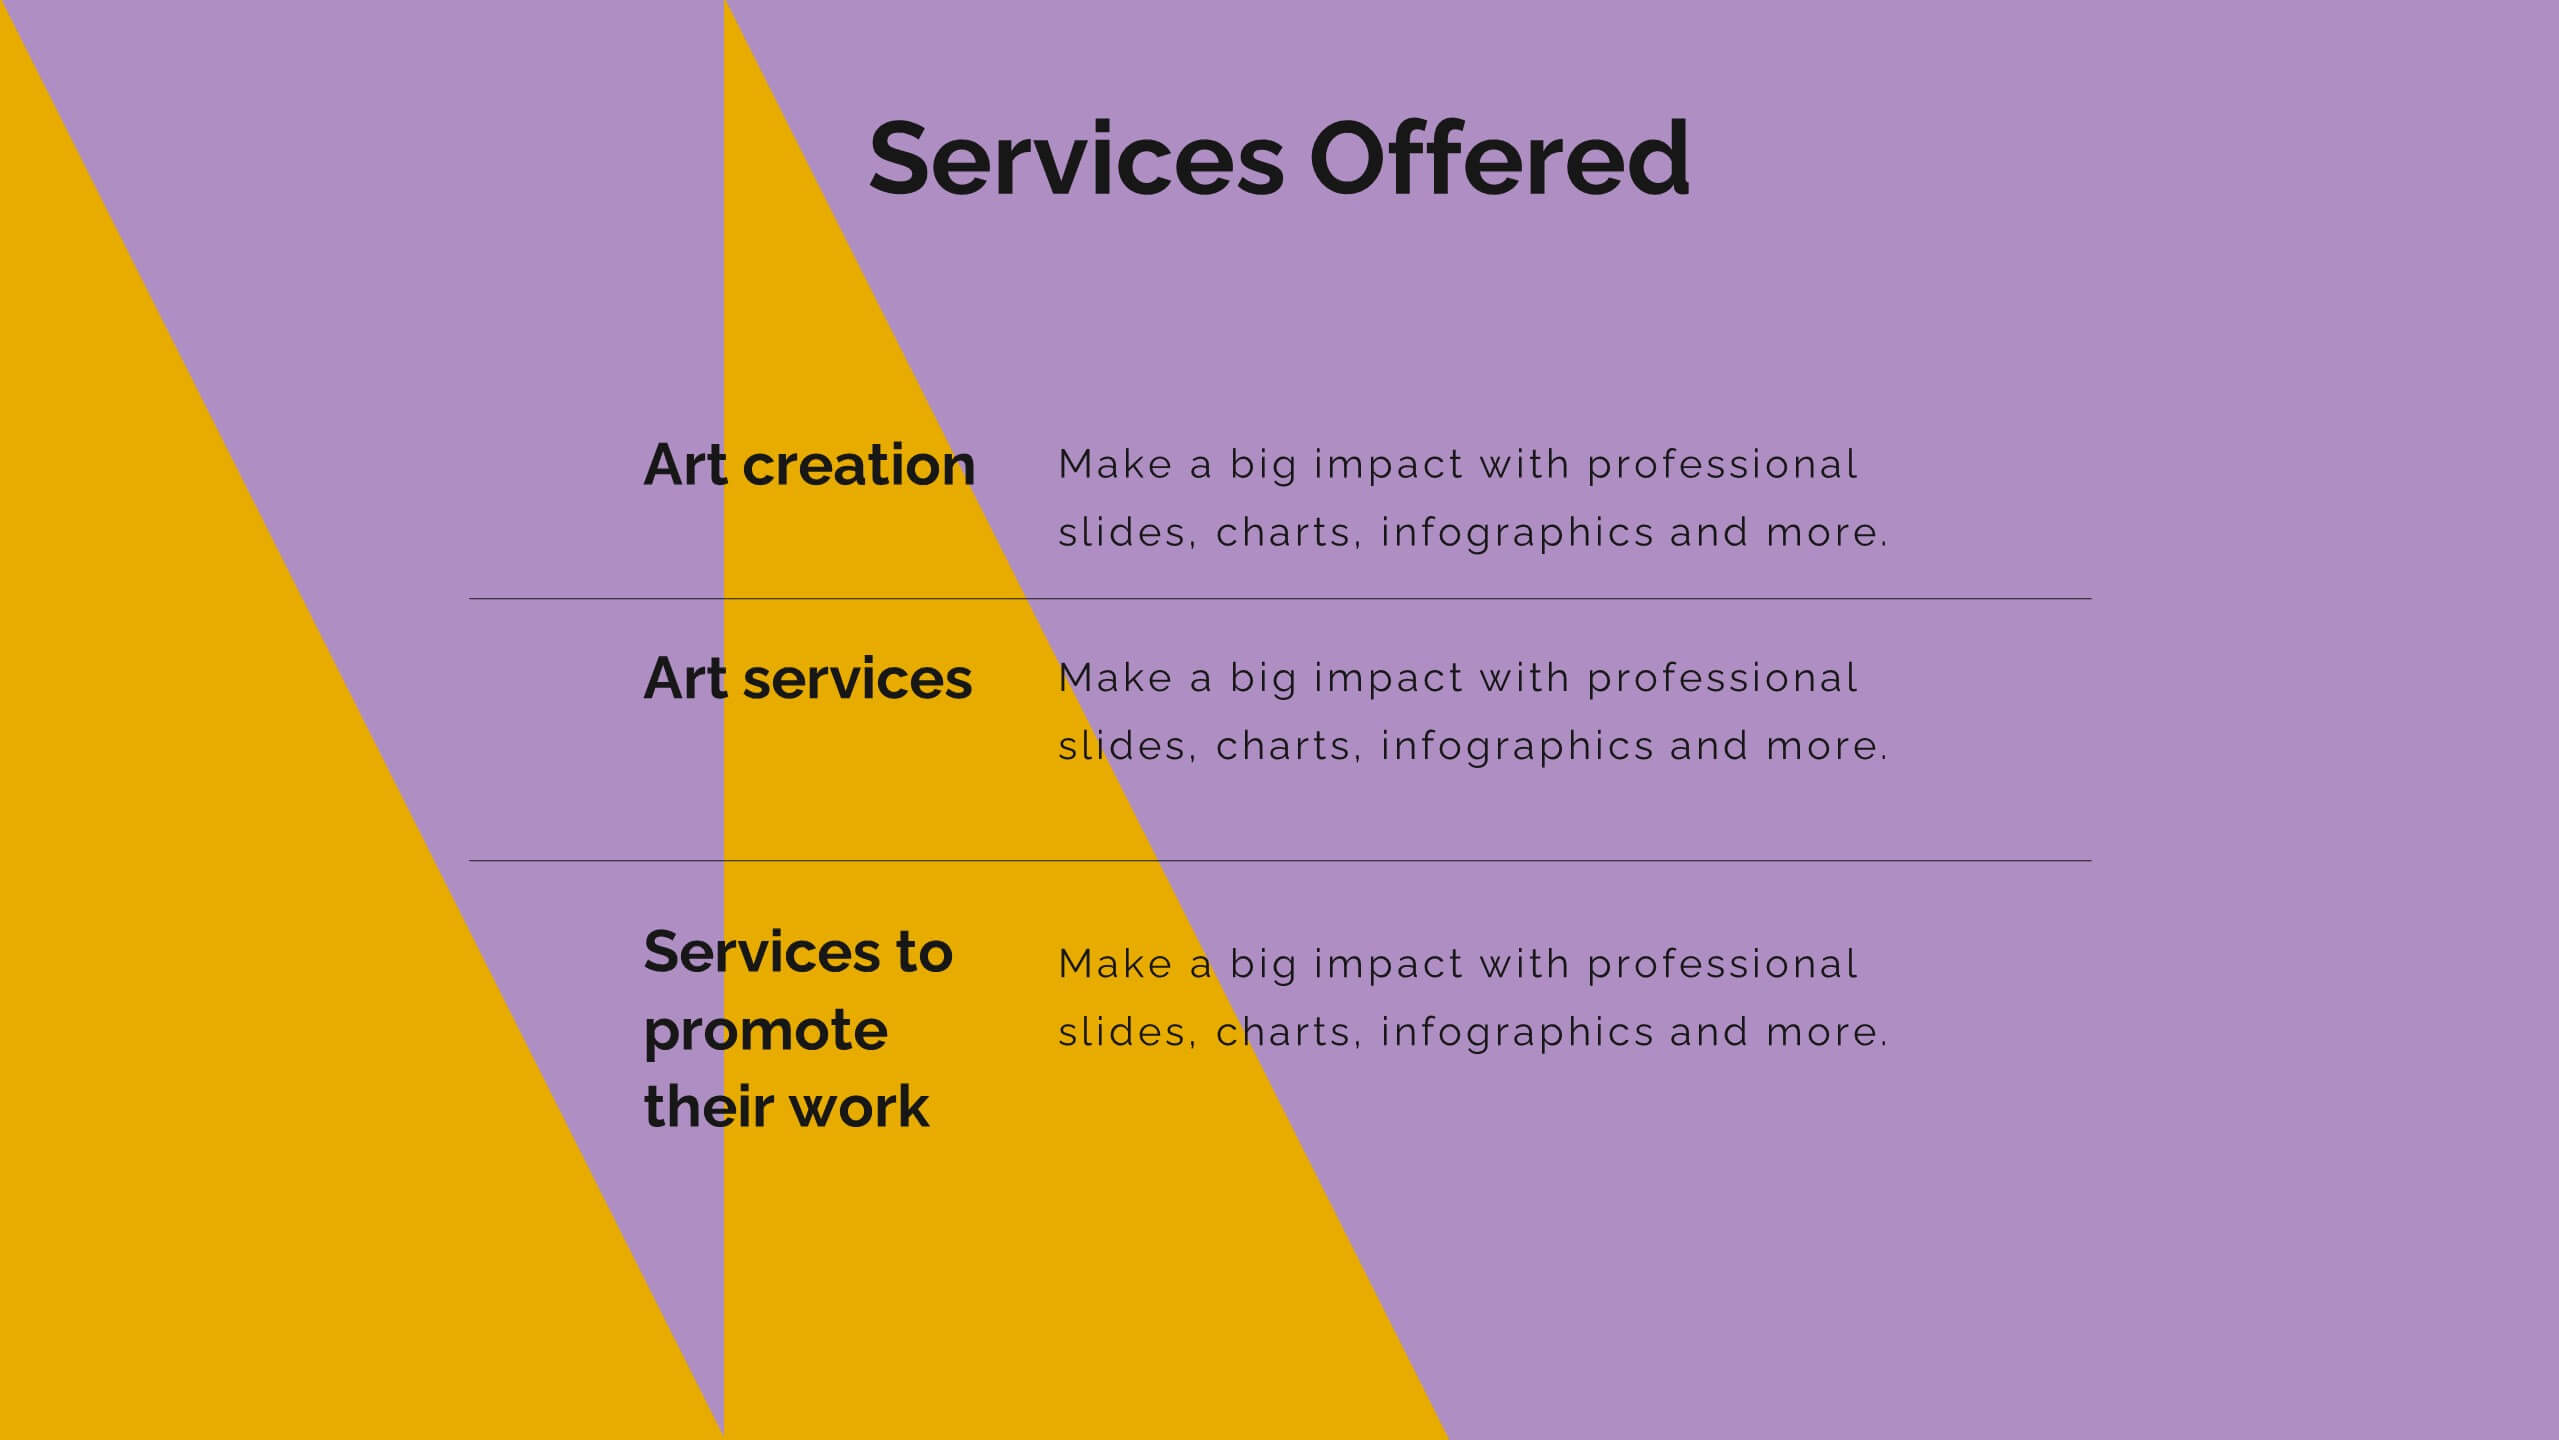
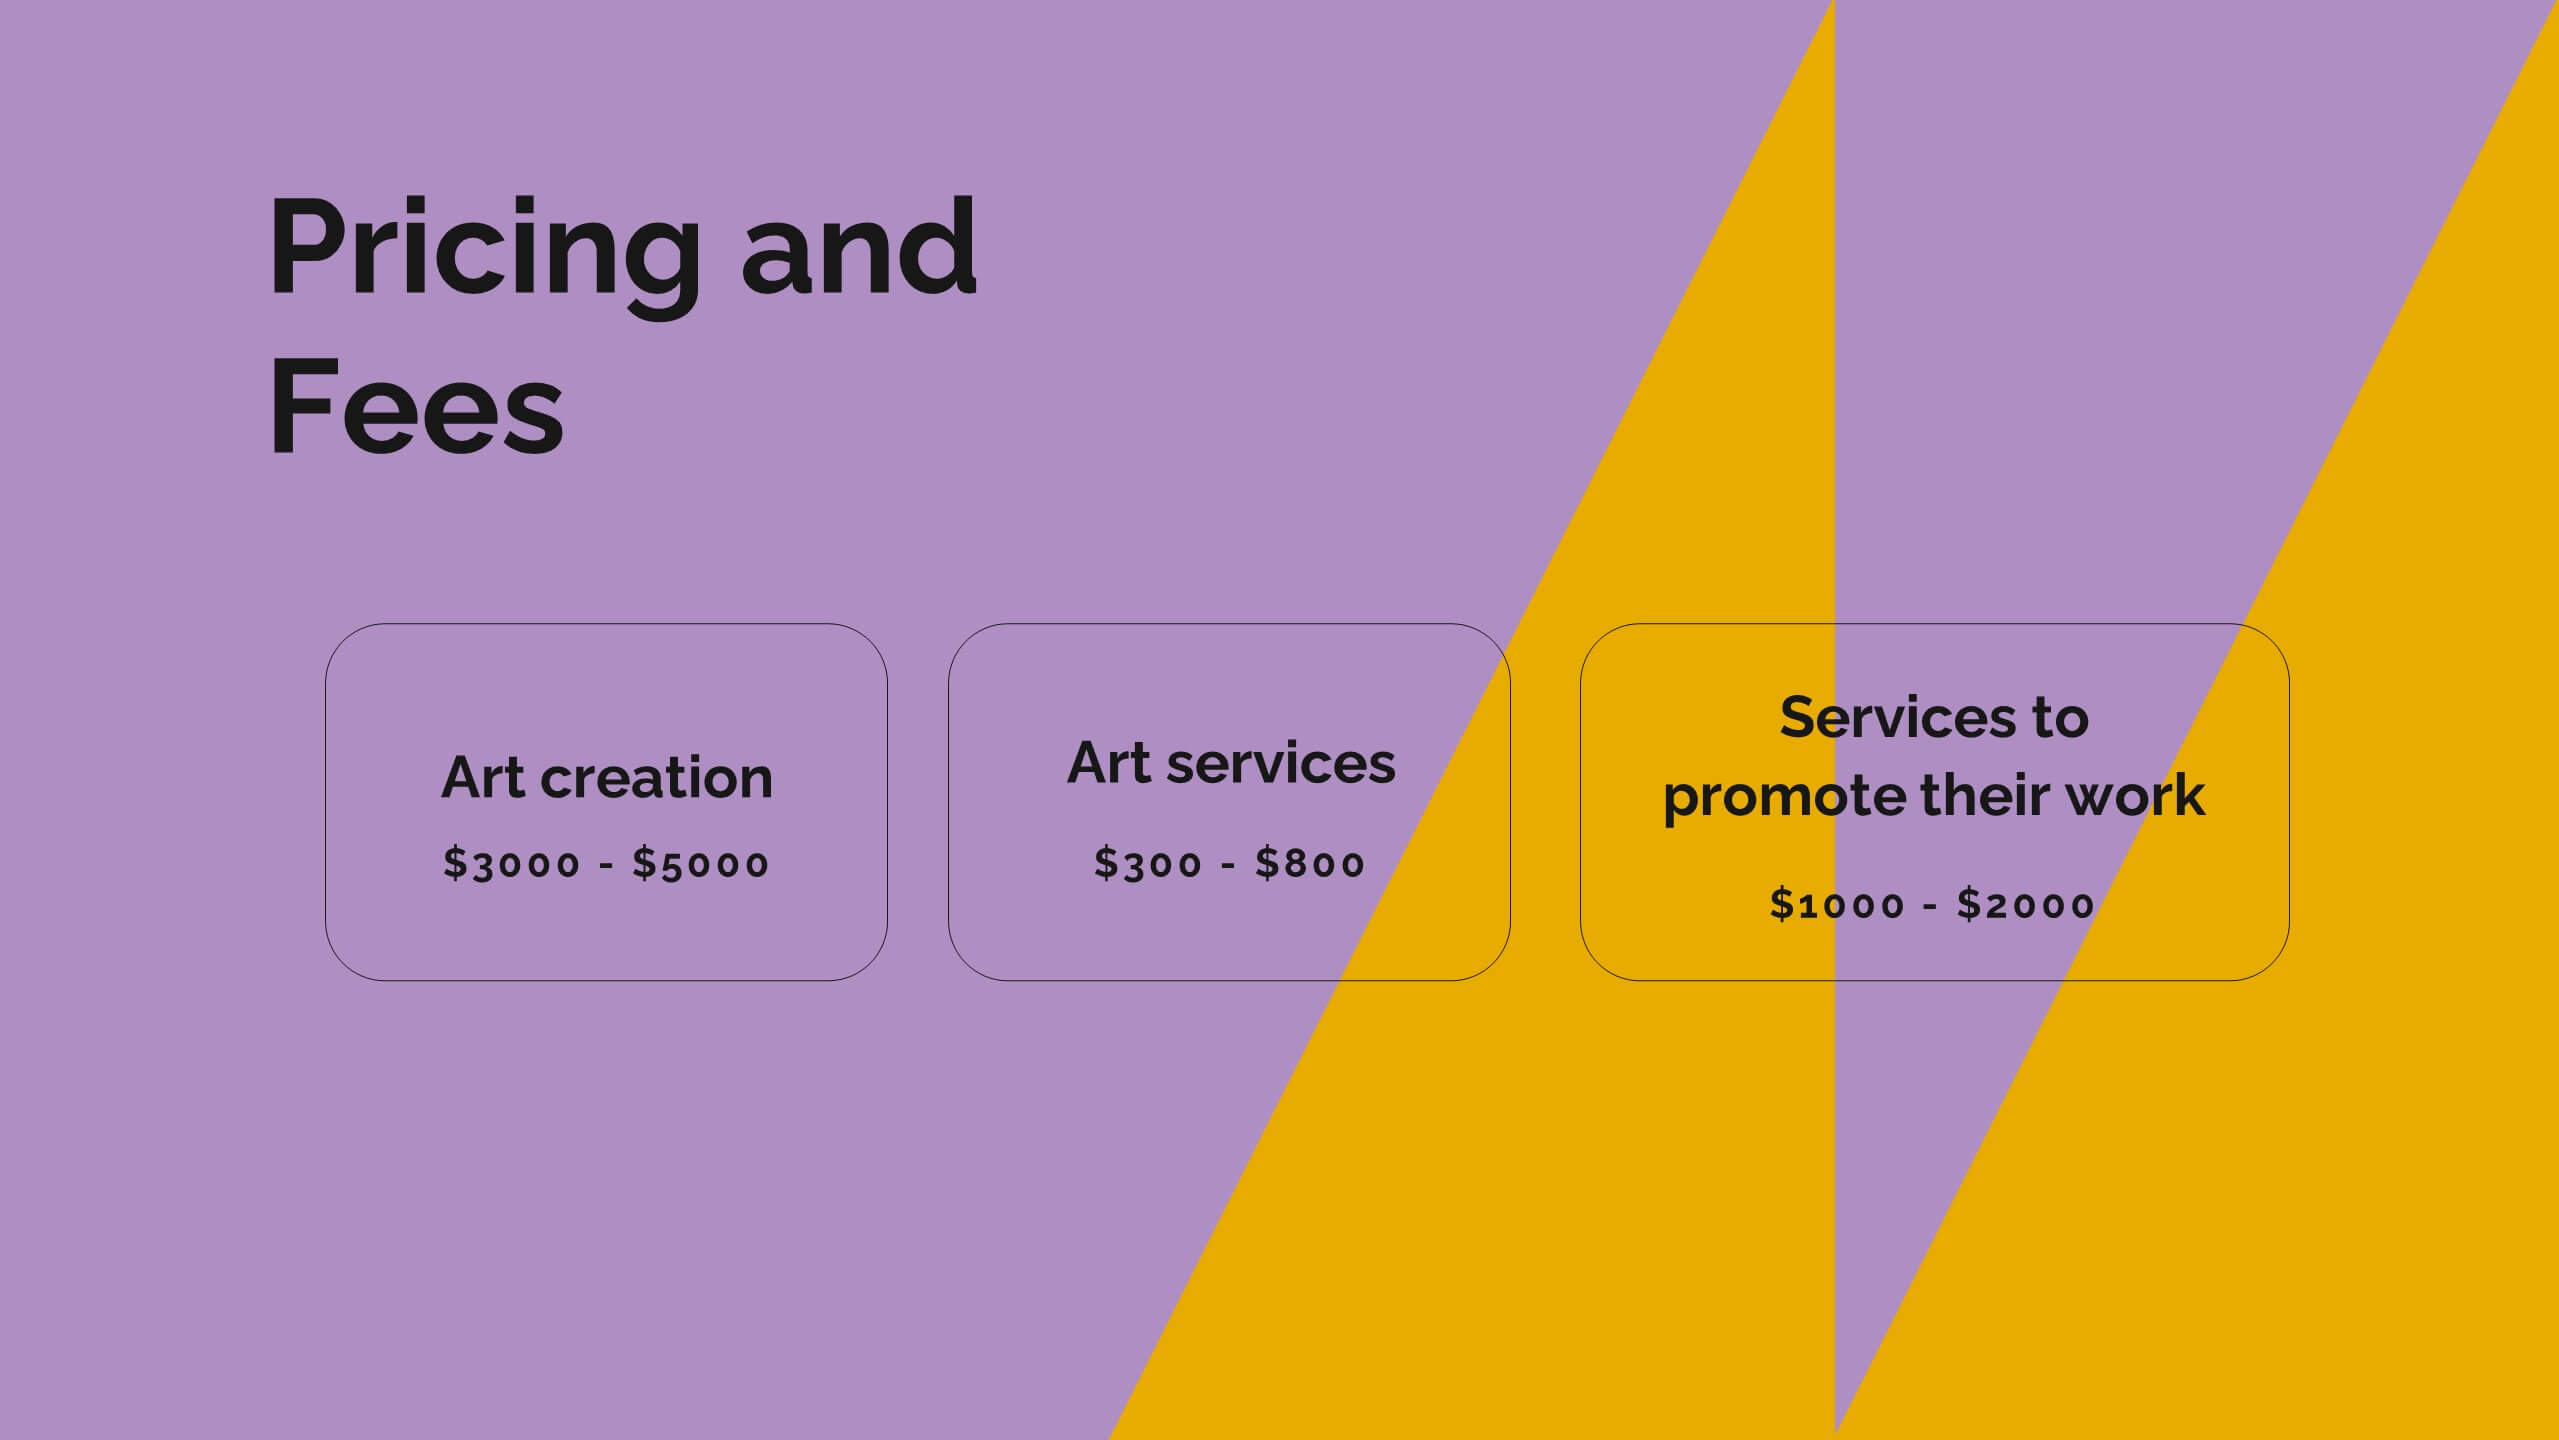
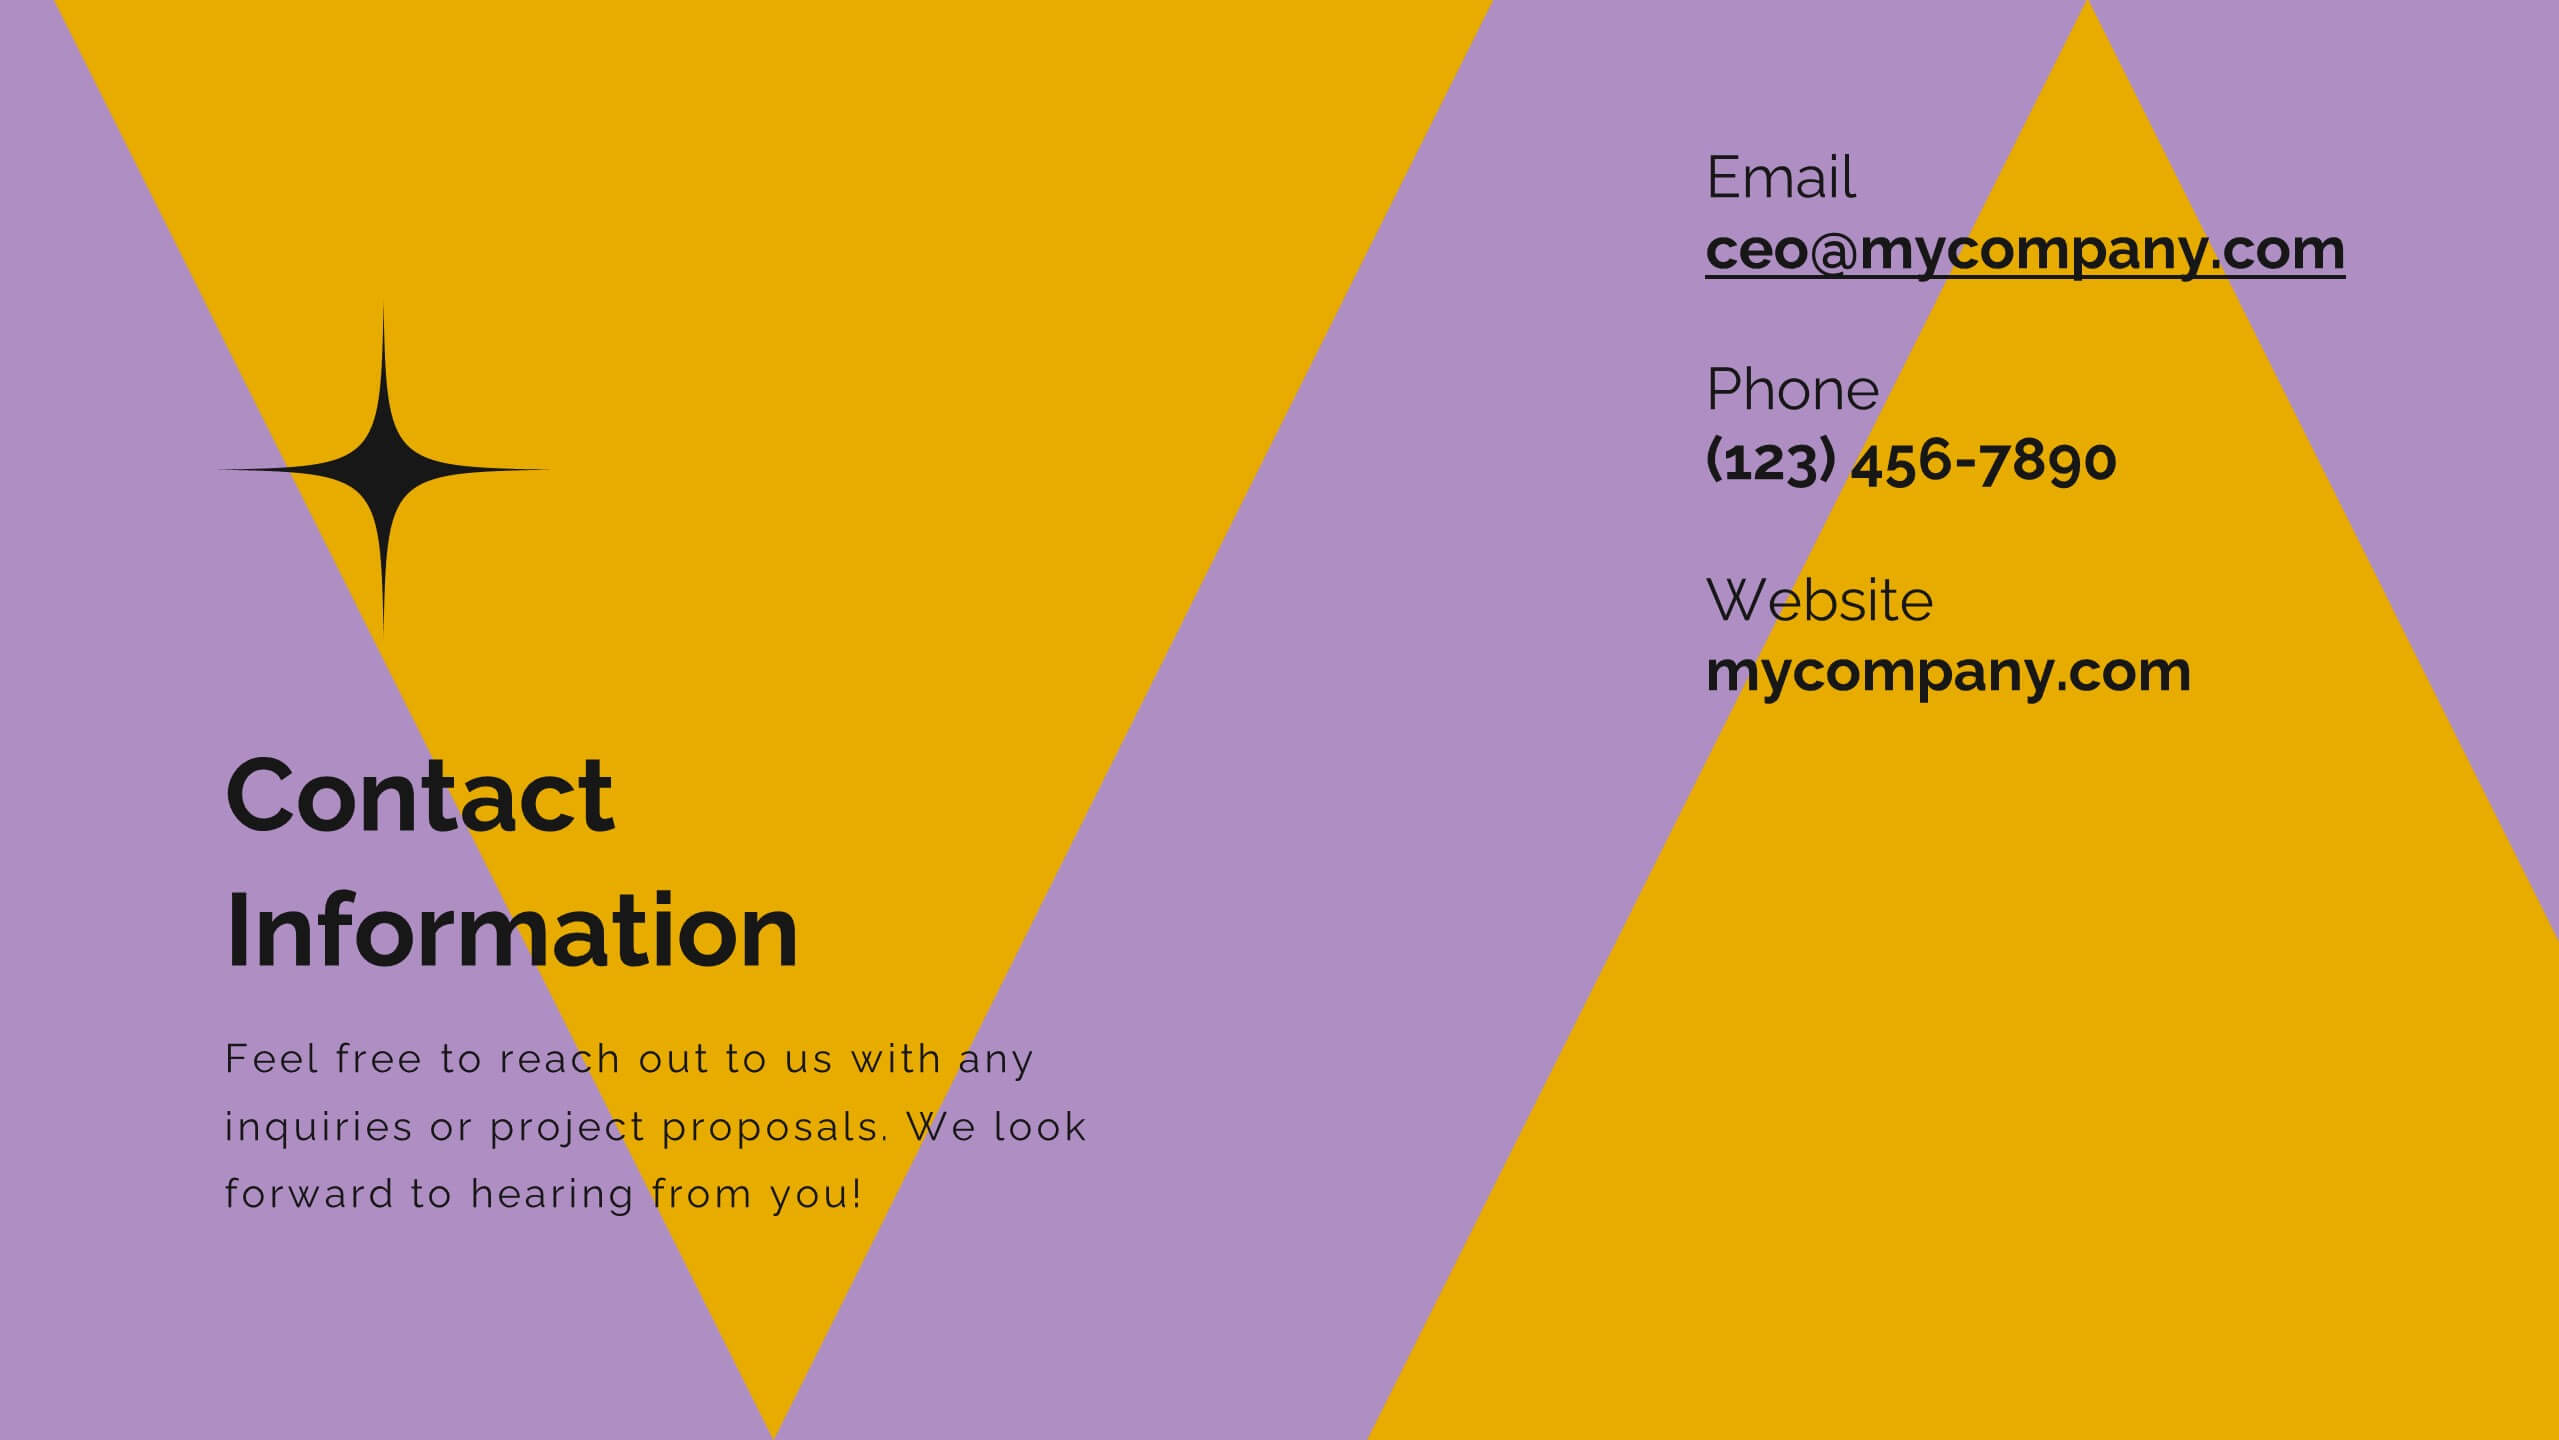
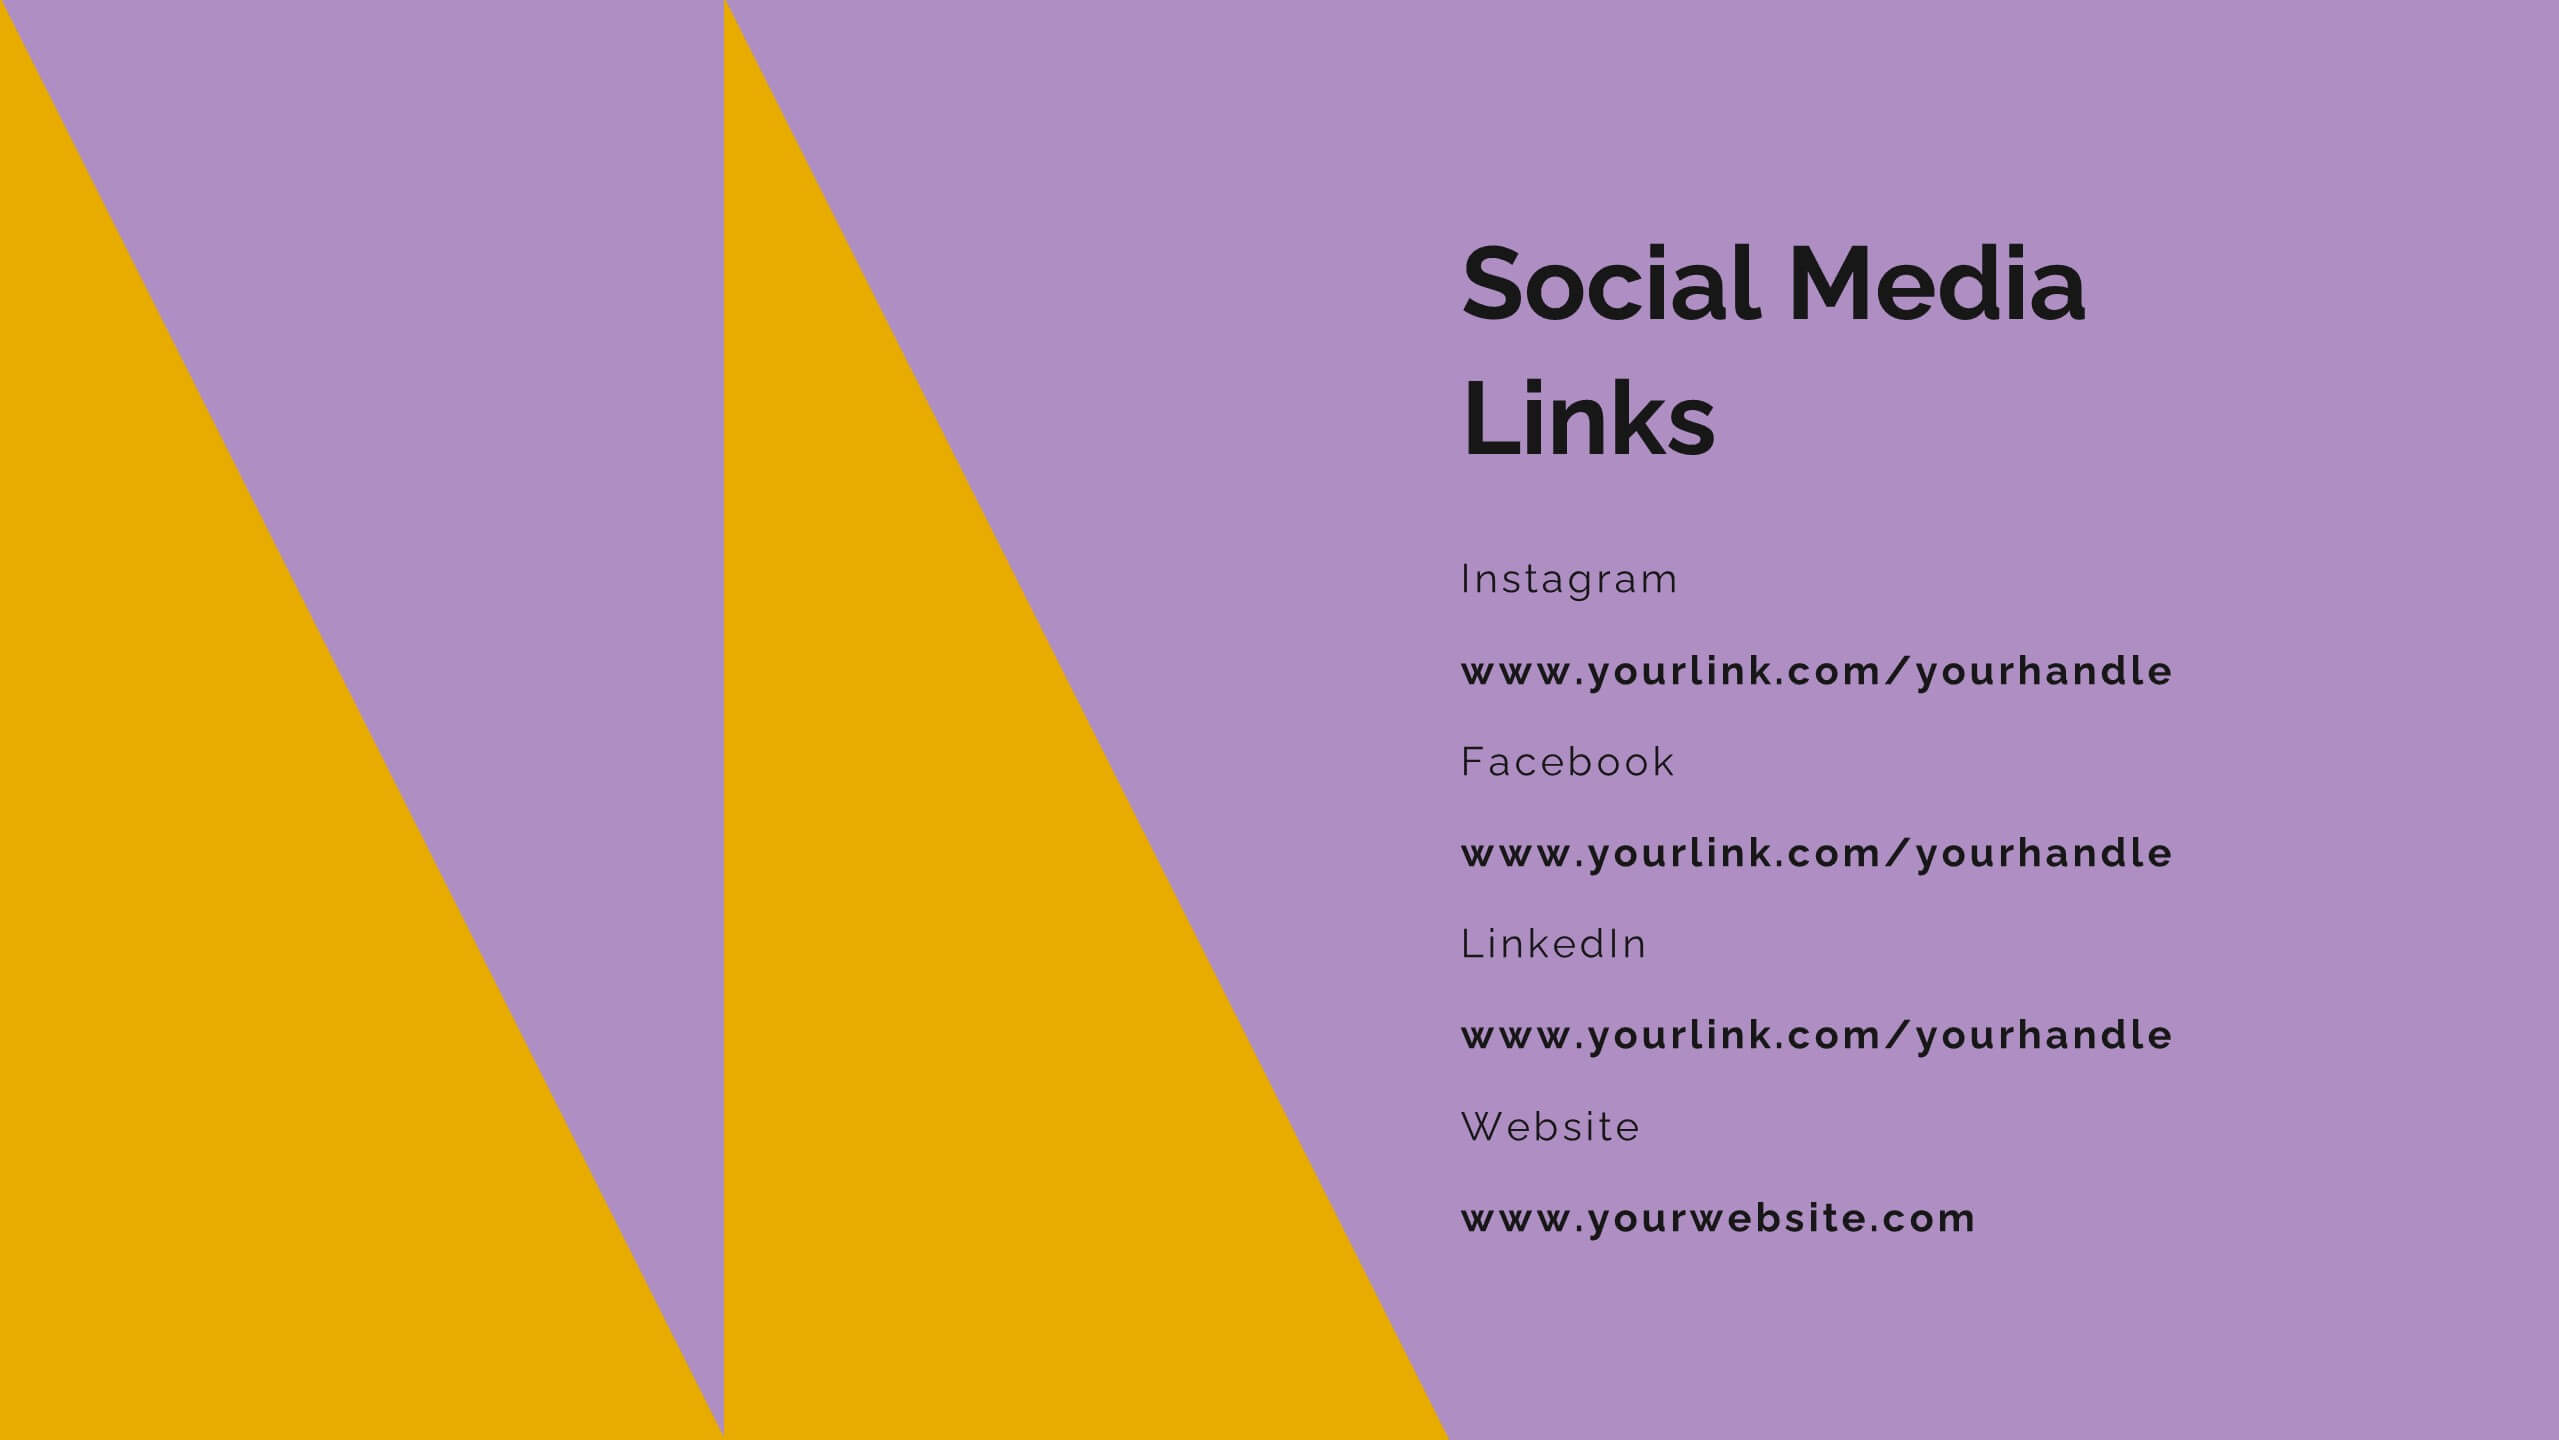
Vortex Artist Portfolio Template Presentation
Showcase your artistic brilliance with this eye-catching portfolio presentation template! Perfect for highlighting your projects, creative process, and awards, it features vibrant slides for your philosophy, collaborations, and client testimonials. Impress potential clients and collaborators with a stunning, well-organized portfolio. Compatible with PowerPoint, Keynote, and Google Slides for seamless presentations on any platform.


7 diapositivas
Objective Infographic Presentation Template
Our Objective Infographic template is designed to visually highlight the key points of a business plan and help you get your message across. With this template's simple layout and bold illustration, you can convey the most important parts of your plan in a way that is straightforward and compelling. This infographic template has been created to help you illustrate the key goal of your project. A clear and attractive infographic, this eye-catching template can be used to create interesting informative content. This will captivate your audience and keep them interested in what you have to say.


8 diapositivas
3-Layered Circular Logic Presentation
Visualize layered processes with this 3-step circular logic diagram. Perfect for illustrating progressive systems, tiered strategies, or interrelated components. Each ring represents a distinct phase, complete with editable icons and text. Compatible with PowerPoint, Keynote, and Google Slides—ideal for business models, strategic frameworks, or simplified logic breakdowns.


5 diapositivas
Dealing With Cyberbullying Infgraphics
Cyberbullying refers to the act of using digital communication platforms such as social media, instant messaging, online forums, or email to harass, intimidate, or harm others. This infographic template is designed to raise awareness about cyberbullying and provide guidance on how to effectively deal with it. This template aims to educate individuals, parents, educators, and organizations about the impact of cyberbullying and empower them to prevent and address this issue. This template can be used by schools, community organizations, or online safety advocates to raise awareness about cyberbullying, and foster a safer online environment.


6 diapositivas
Internal Communication Strategy Presentation
Bring your message to life with a dynamic slide that turns communication goals into a simple, engaging visual story. This presentation highlights key steps, channels, and team roles to help audiences understand how information flows across an organization. Clean icons and structured layouts make every point clear and memorable. Fully compatible with PowerPoint, Keynote, and Google Slides.


7 diapositivas
Creative Thinking and Disruption Model
Visualize your strategy for breakthrough ideas with the Creative Thinking and Disruption Model Presentation. Featuring a bold head silhouette layout, this slide highlights six key elements of innovative thinking—perfect for workshops, leadership discussions, or startup pitches. Fully customizable in PowerPoint, Keynote, and Google Slides.


22 diapositivas
Inspirae Project Status Report Presentation
This sleek and modern project status report presentation template is designed to help you effectively communicate progress, challenges, and key insights. It covers essential sections such as performance metrics, sales performance, risk assessments, and strategic initiatives, ensuring a comprehensive overview. Compatible with PowerPoint, Keynote, and Google Slides for seamless customization.


6 diapositivas
Porter's Five Forces Strategy Presentation
Give your competitive analysis a bold, intuitive flow with a clean layout that visually breaks down each force in a simple, strategic way. This presentation helps you highlight market pressures, evaluate risks, and support smarter decision-making with clarity and confidence. Fully editable and compatible with PowerPoint, Keynote, and Google Slides.


25 diapositivas
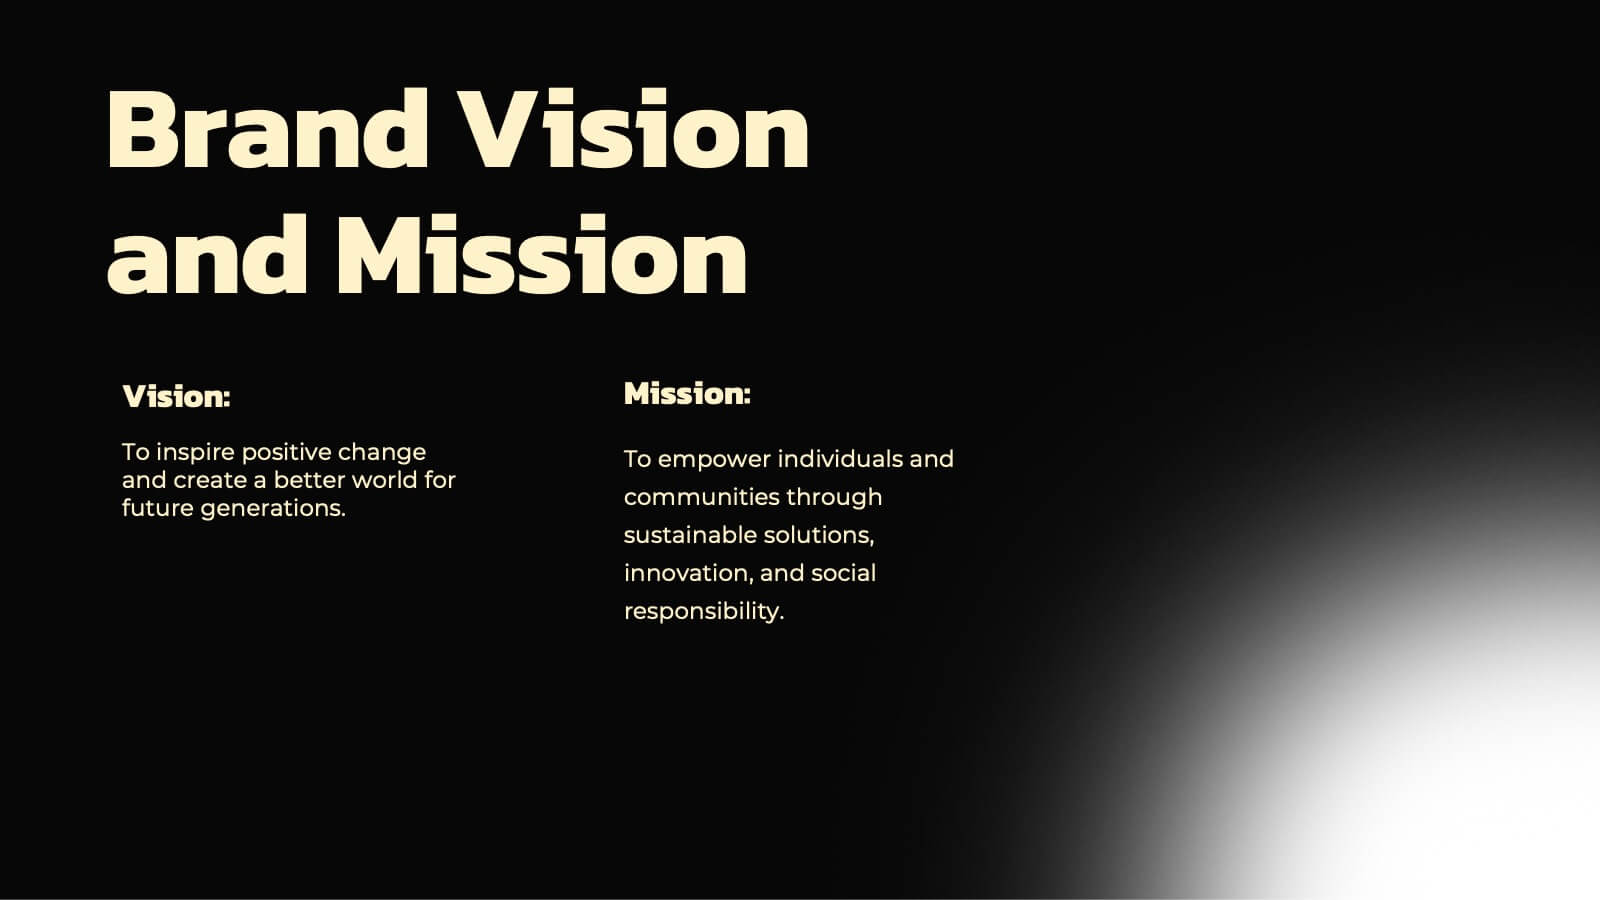
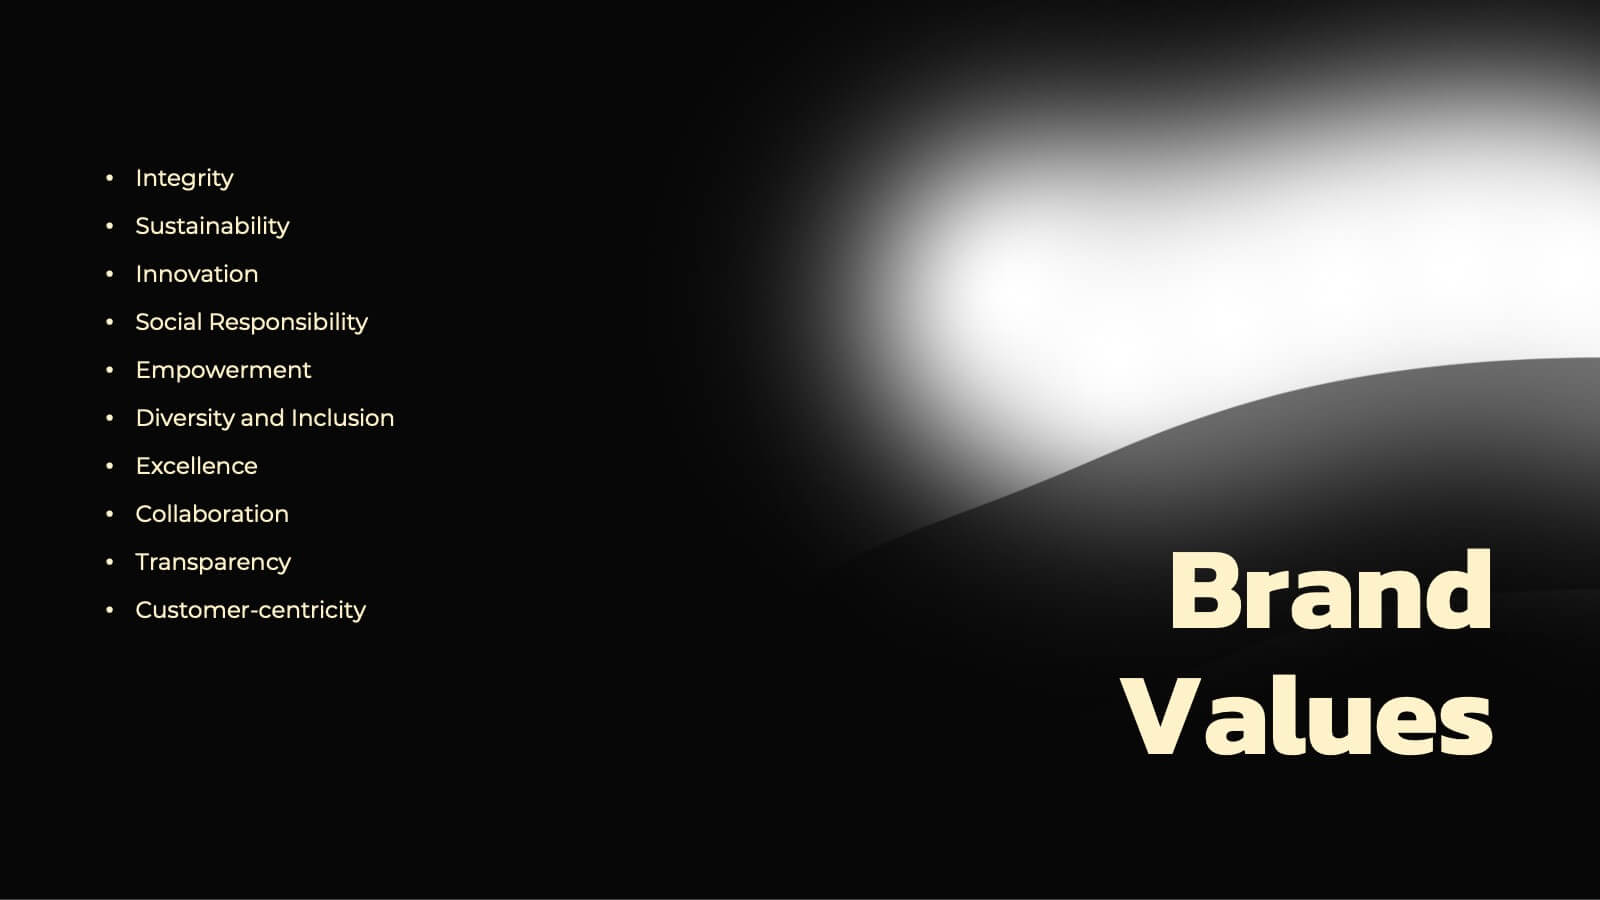
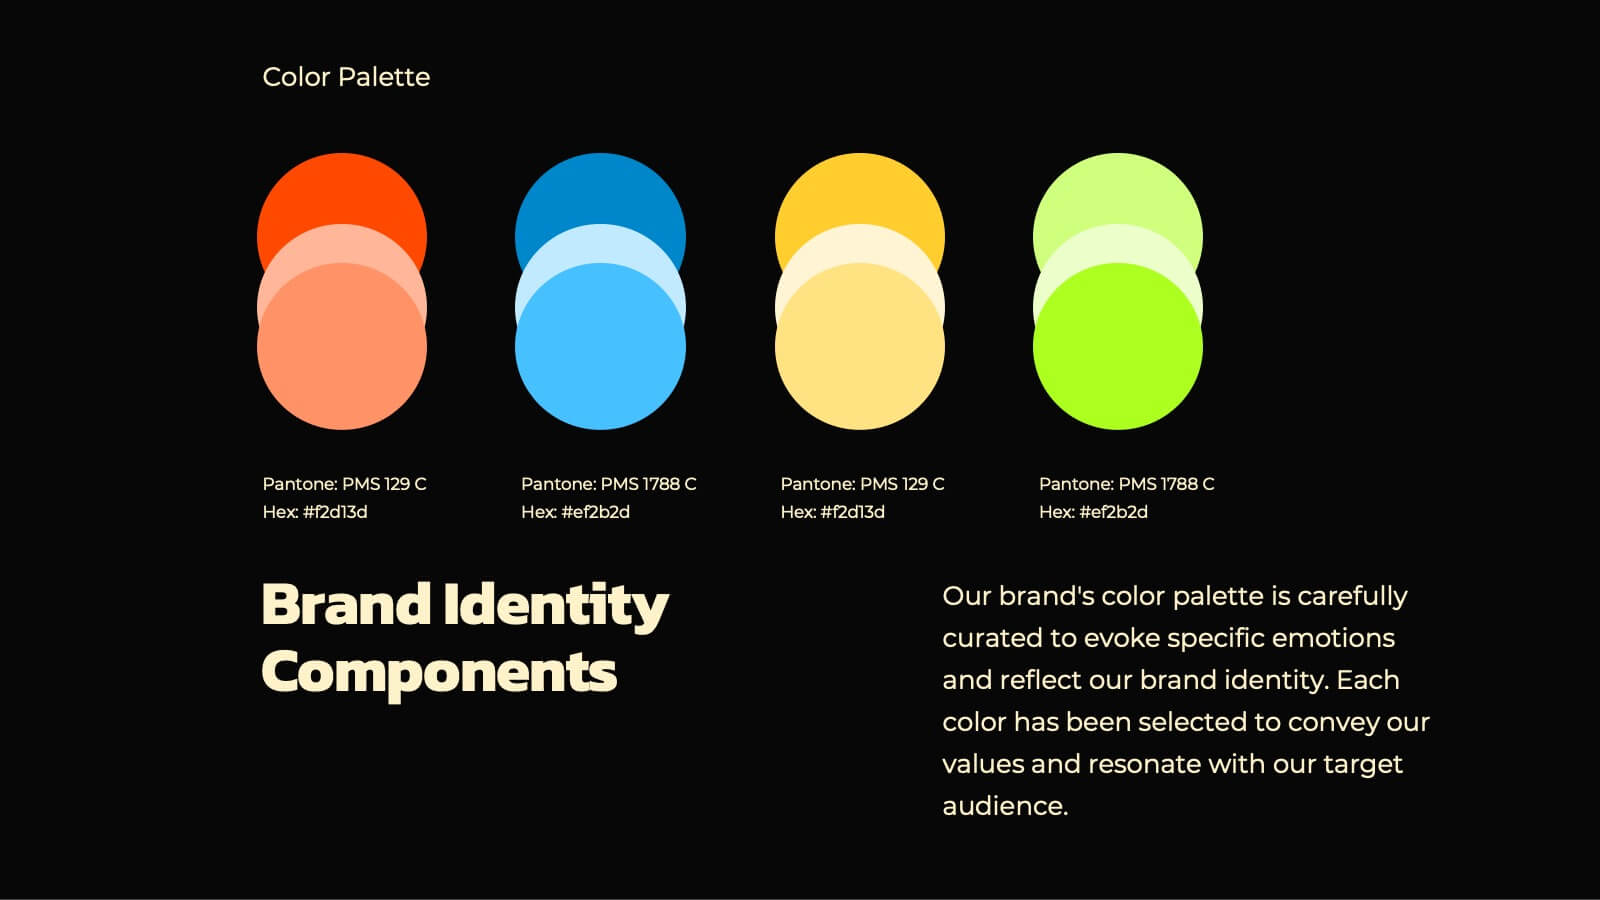
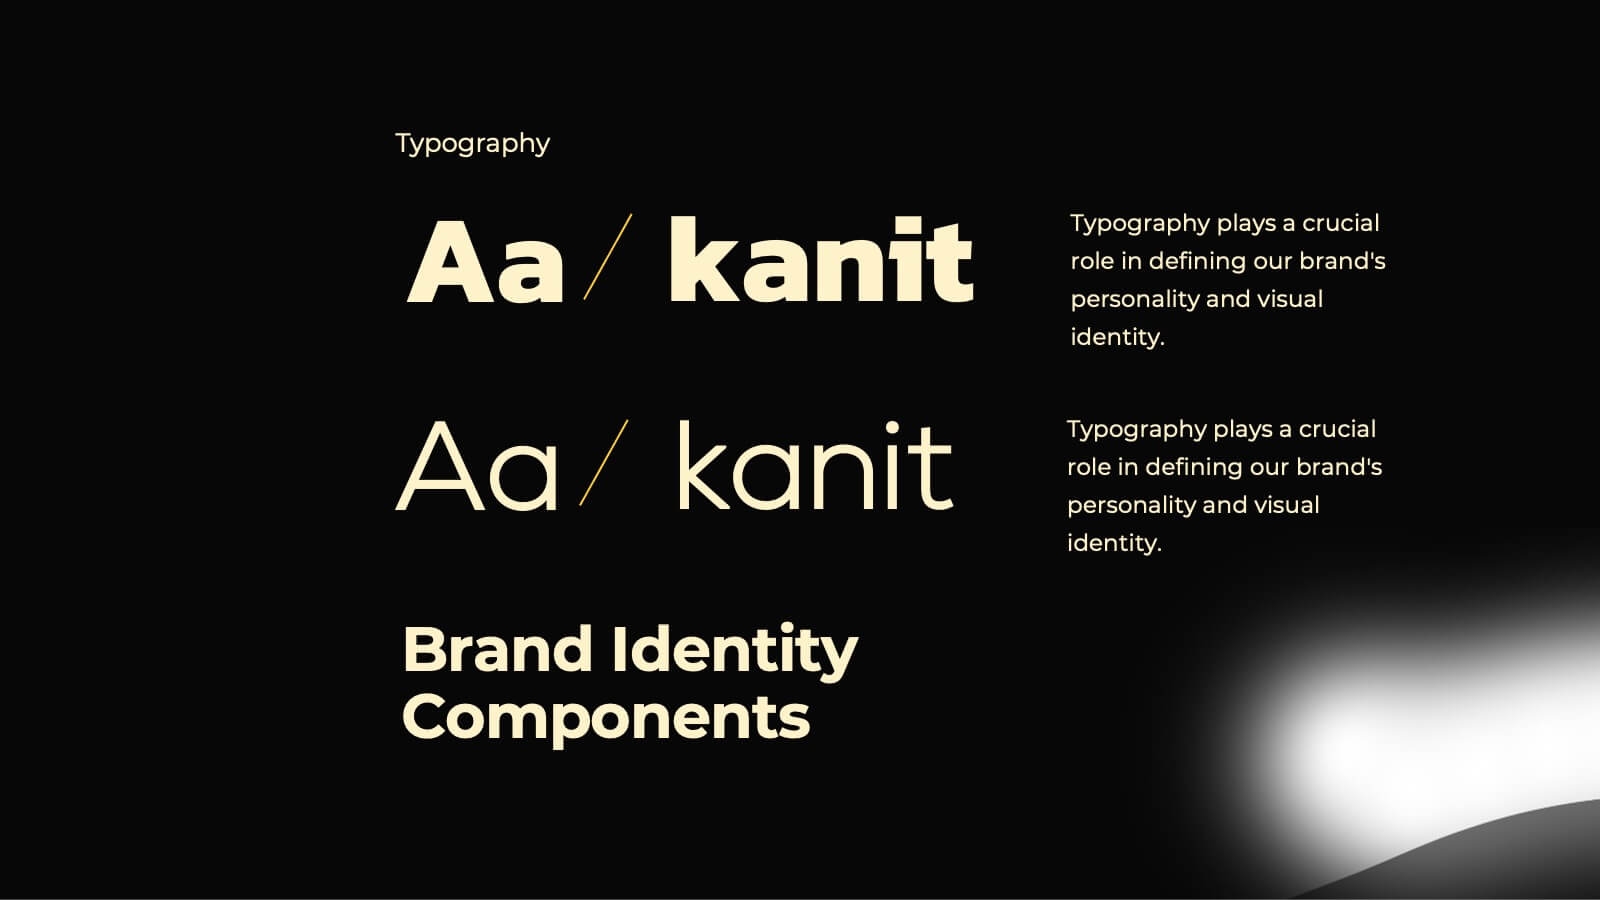
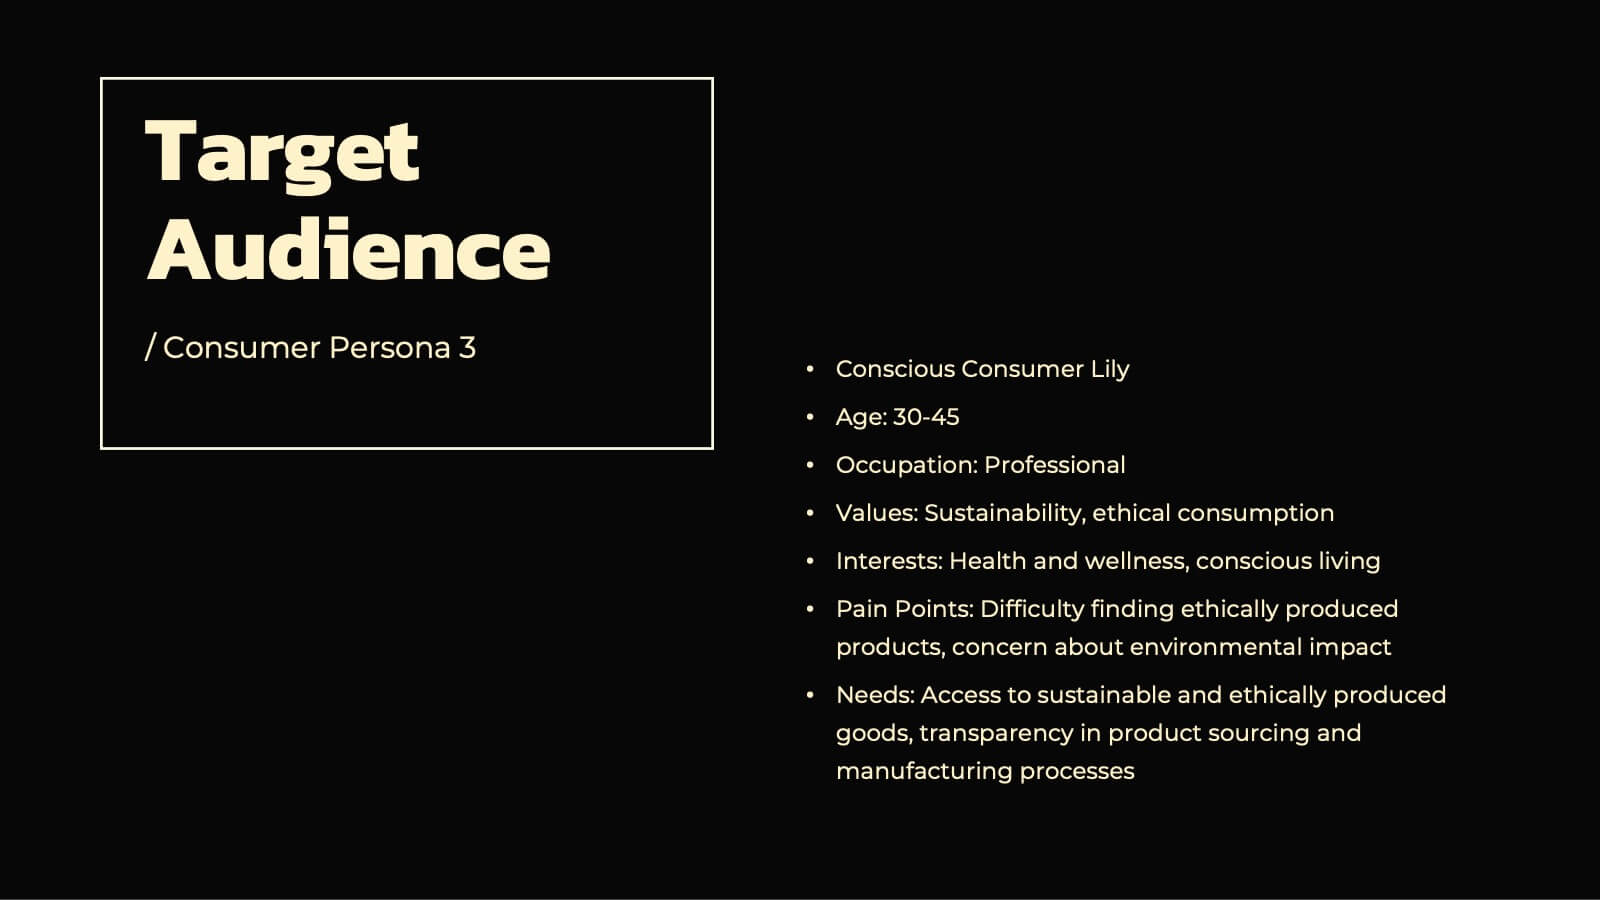
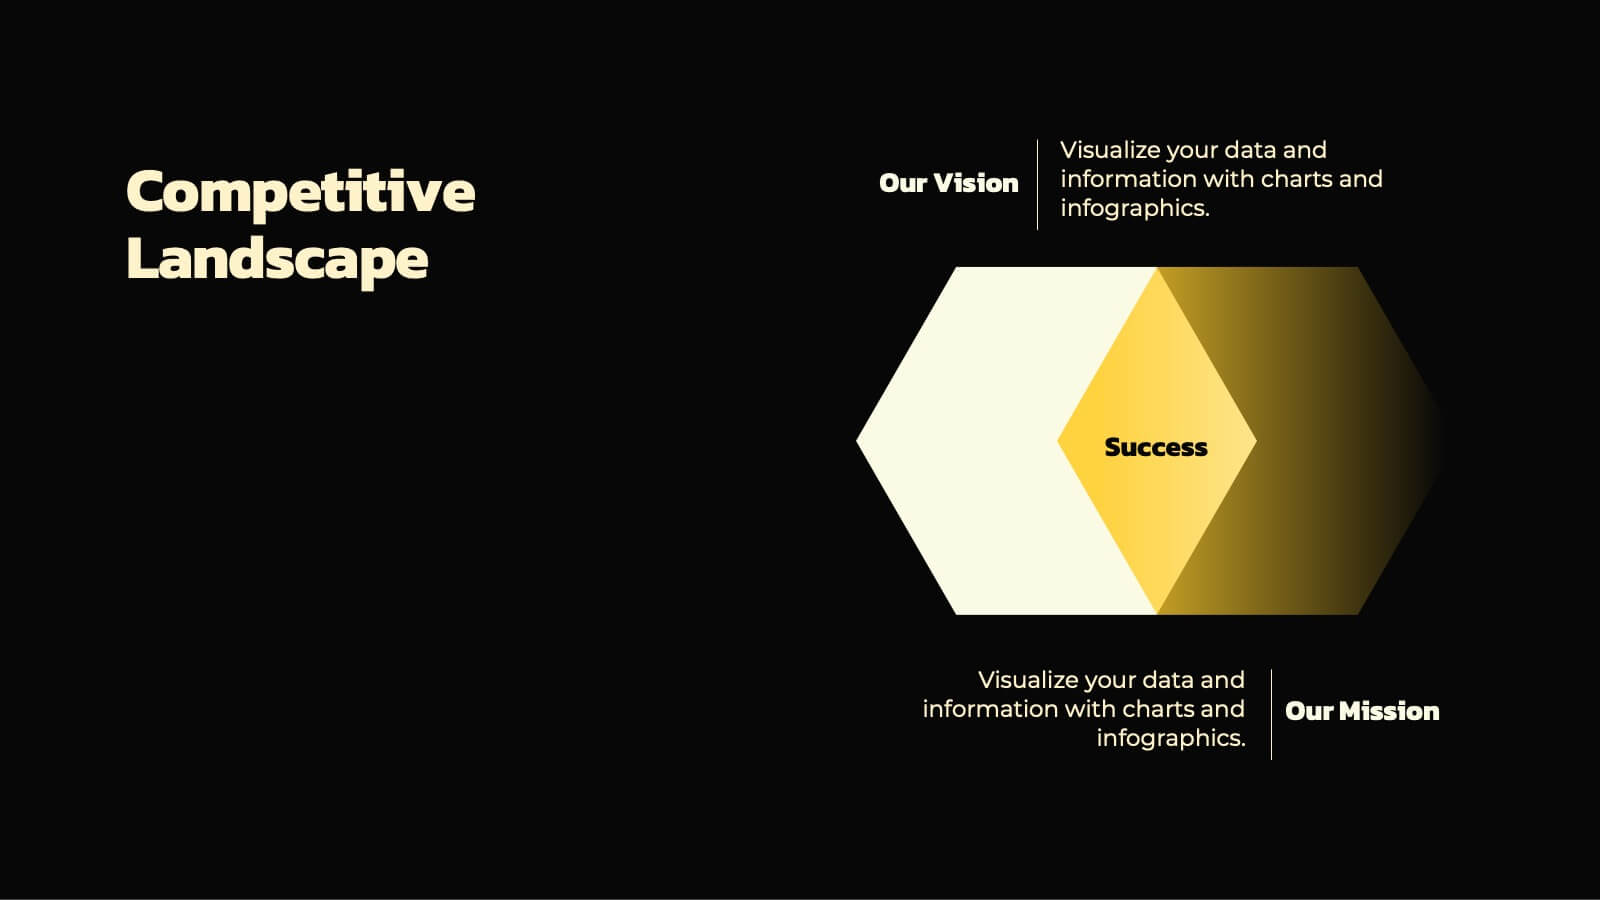
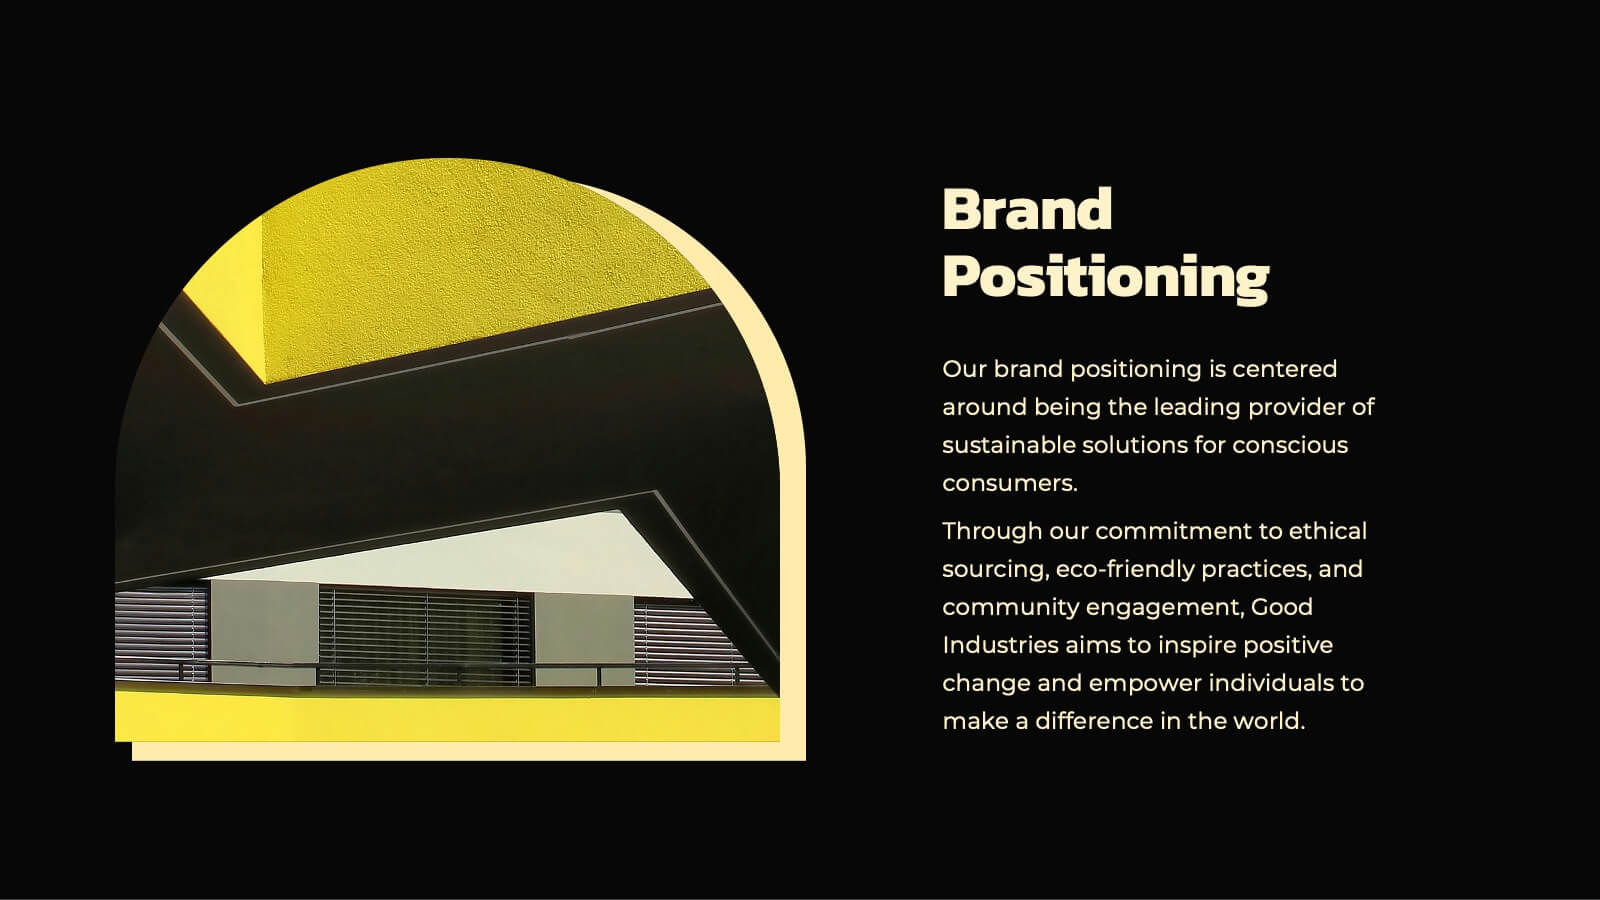
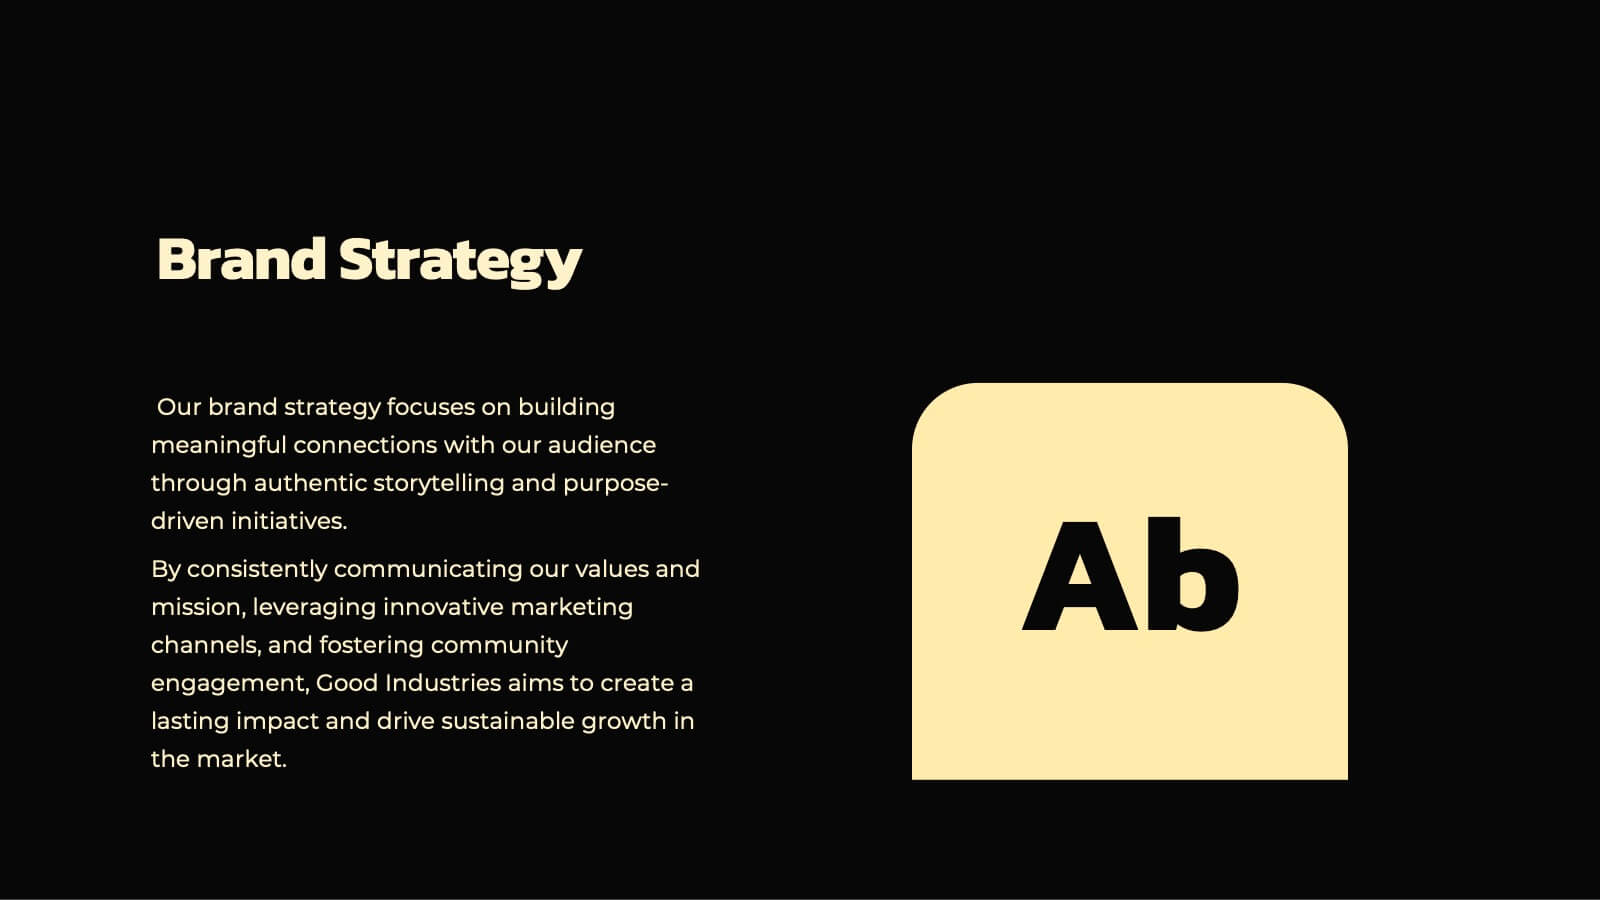
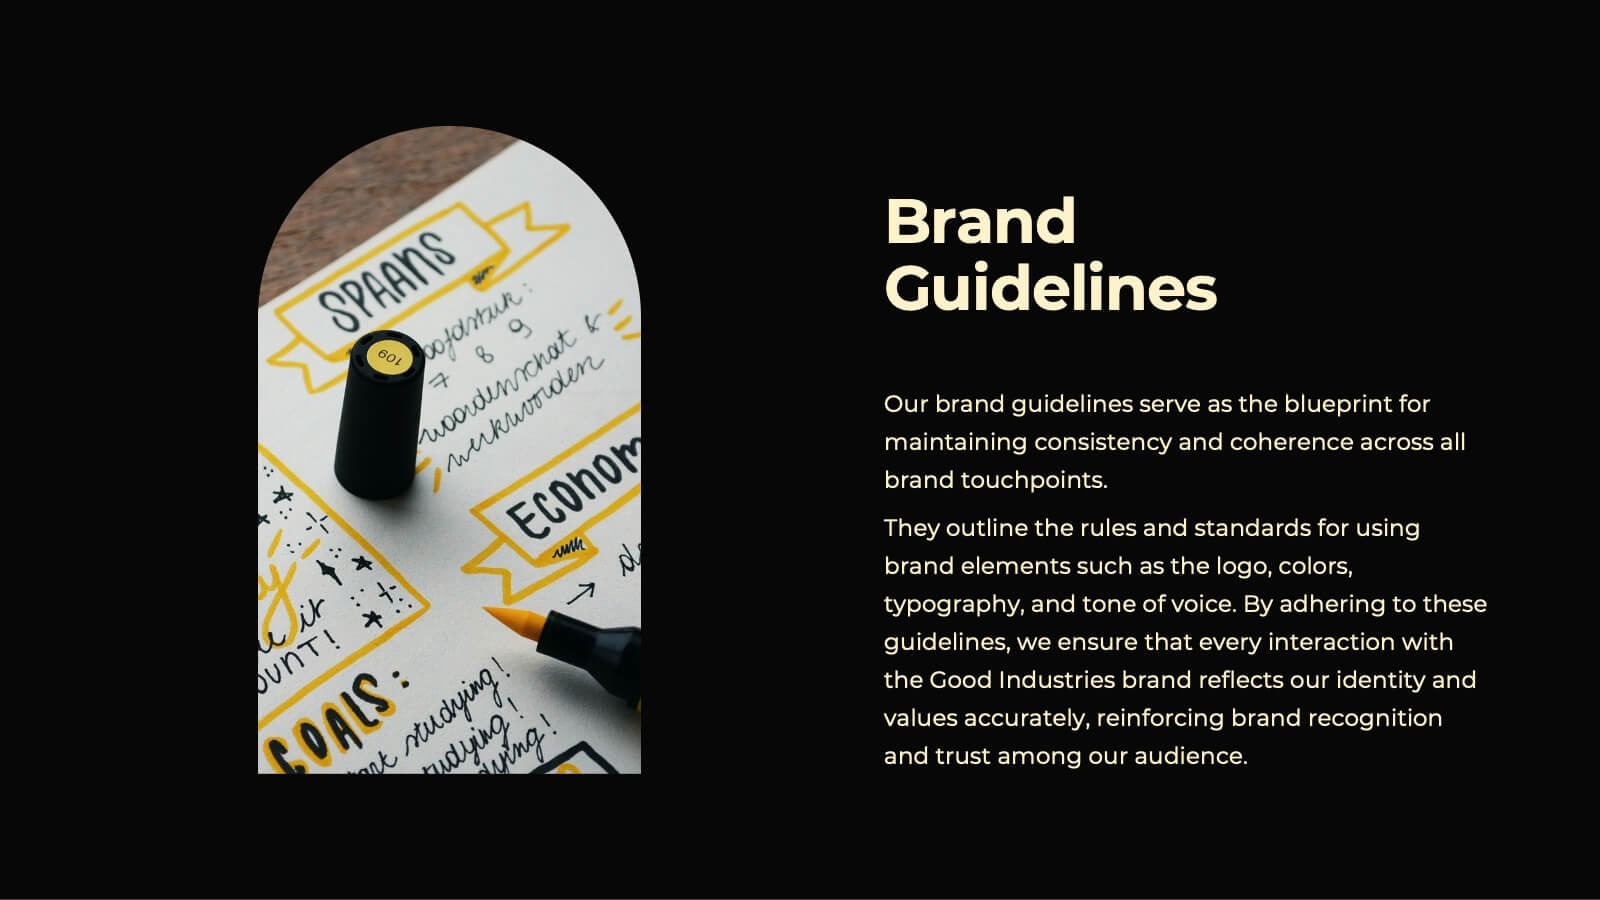
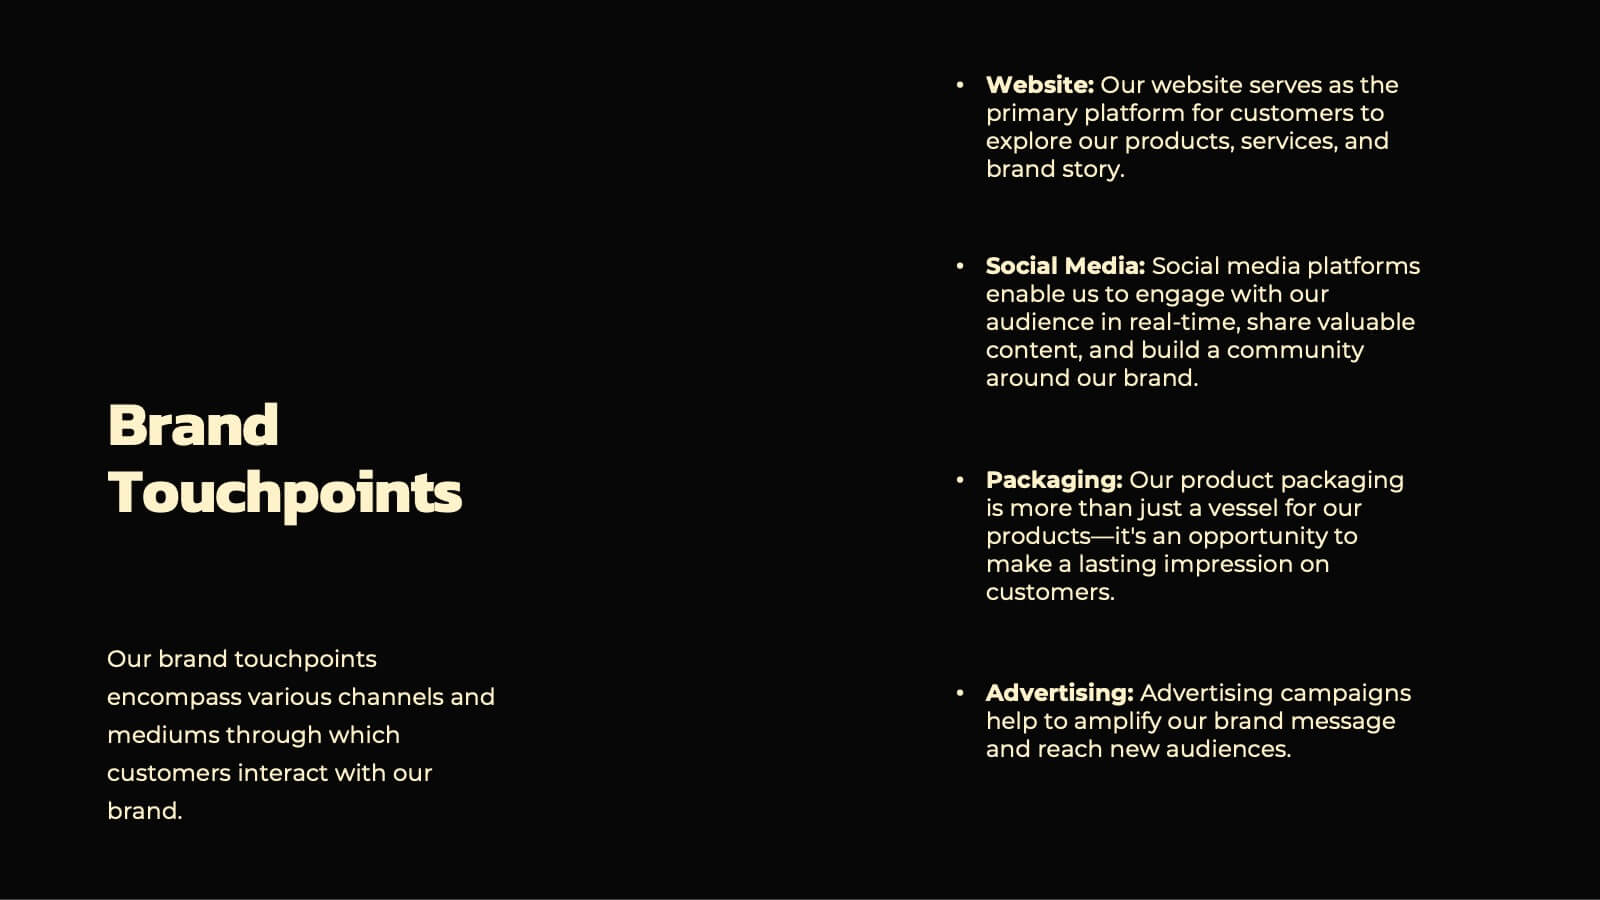
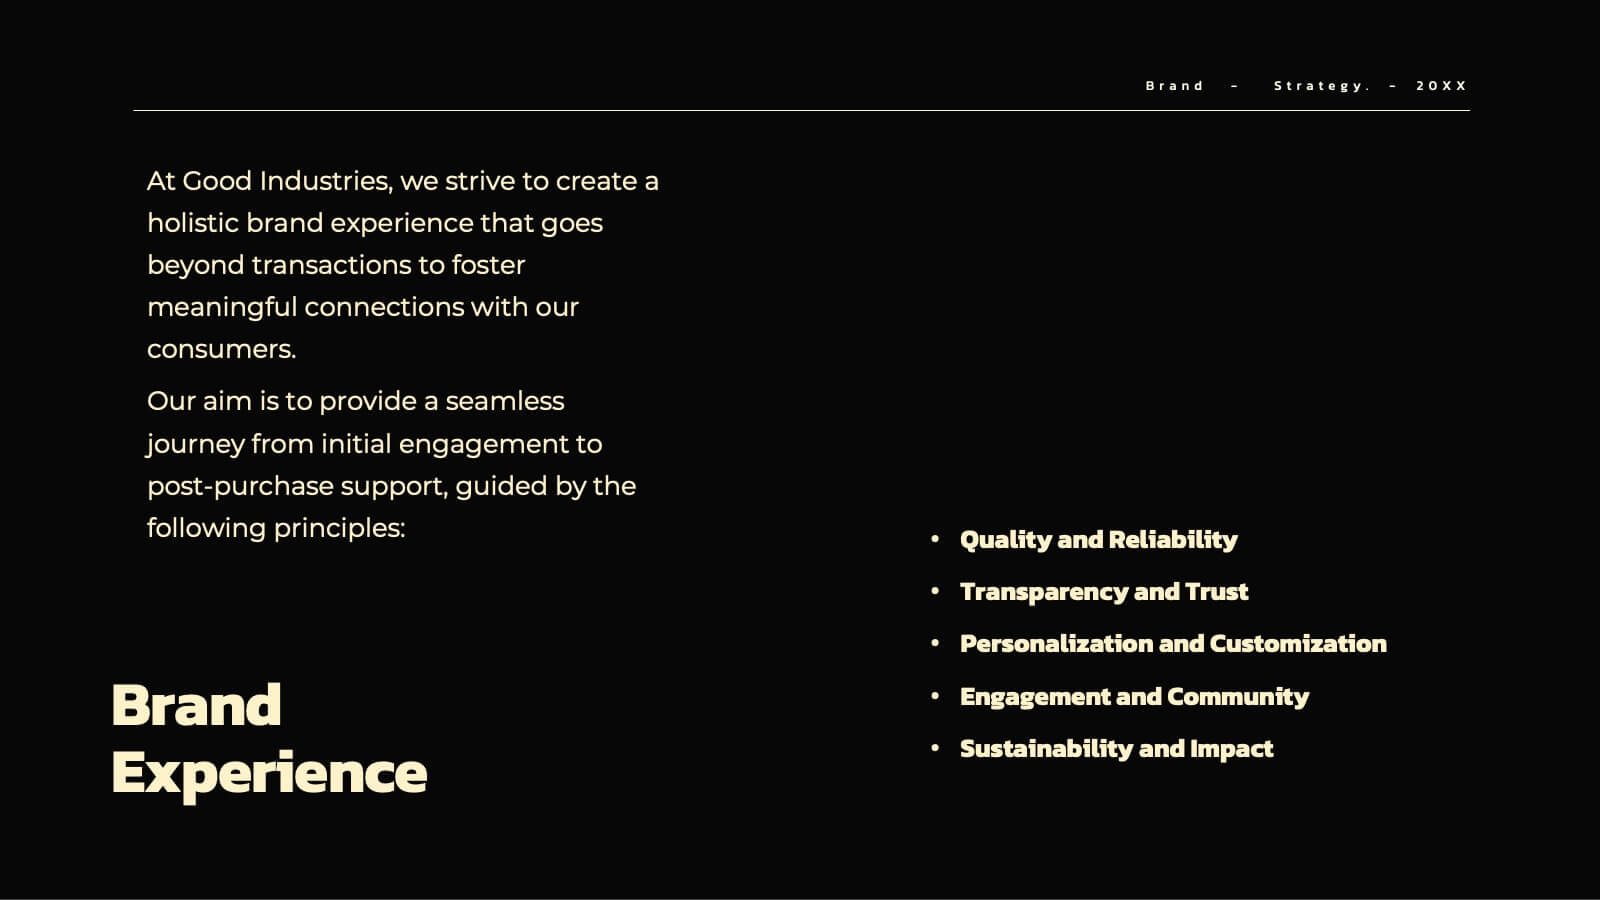
Jasper Rebranding Project Plan Presentation
Elevate your brand transformation with this sleek rebranding presentation template! It covers everything from mission and values to market analysis and brand positioning. Perfect for showcasing your brand guidelines and touchpoints. Fully customizable, and compatible with PowerPoint, Keynote, and Google Slides, making your rebranding process seamless and professional.


20 diapositivas
Pulsebeat Sales Proposal Presentation
Seal the deal with this compelling sales proposal template, crafted to showcase your offerings, customer value, and competitive edge with clarity. Including slides for sales objectives, process, pricing strategy, and performance metrics, it’s perfect for sales teams aiming to impress. Compatible with PowerPoint, Keynote, and Google Slides for effortless presentation.


21 diapositivas
Utopia Marketing Proposal Template Presentation
Unleash your marketing potential with this vibrant, modern presentation template. Perfect for presenting marketing proposals, industry overviews, and consumer behavior analysis, it features a colorful design that captures attention. Highlight key strategies like social media, influencer marketing, and SEO trends to engage your audience. Compatible with PowerPoint, Keynote, and Google Slides, it ensures seamless presentations on any platform.


27 diapositivas
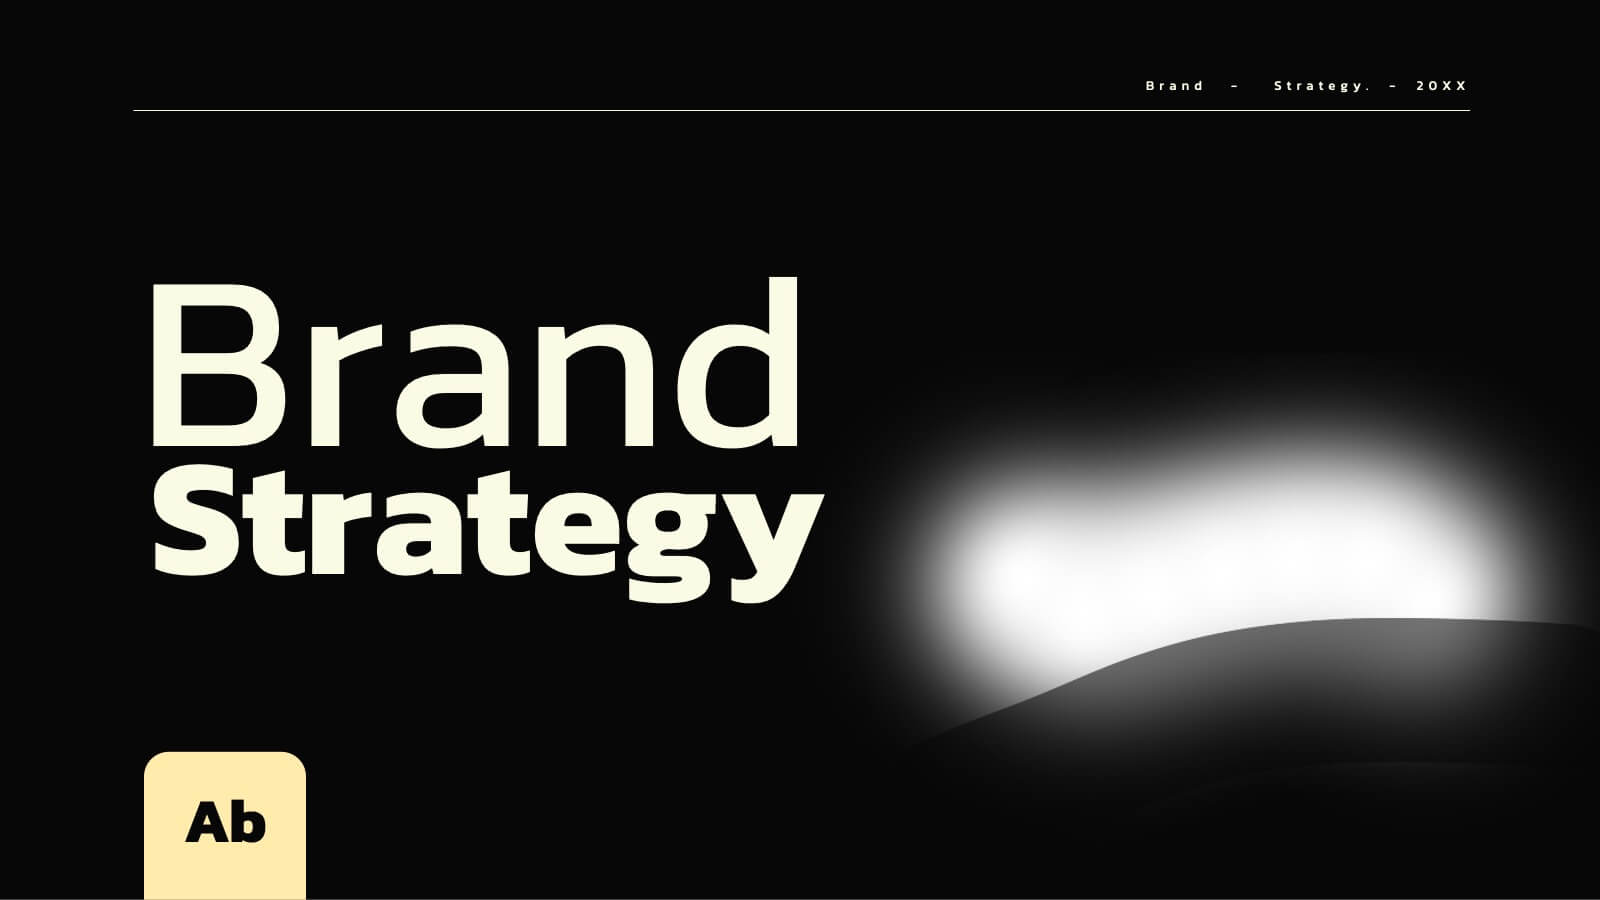
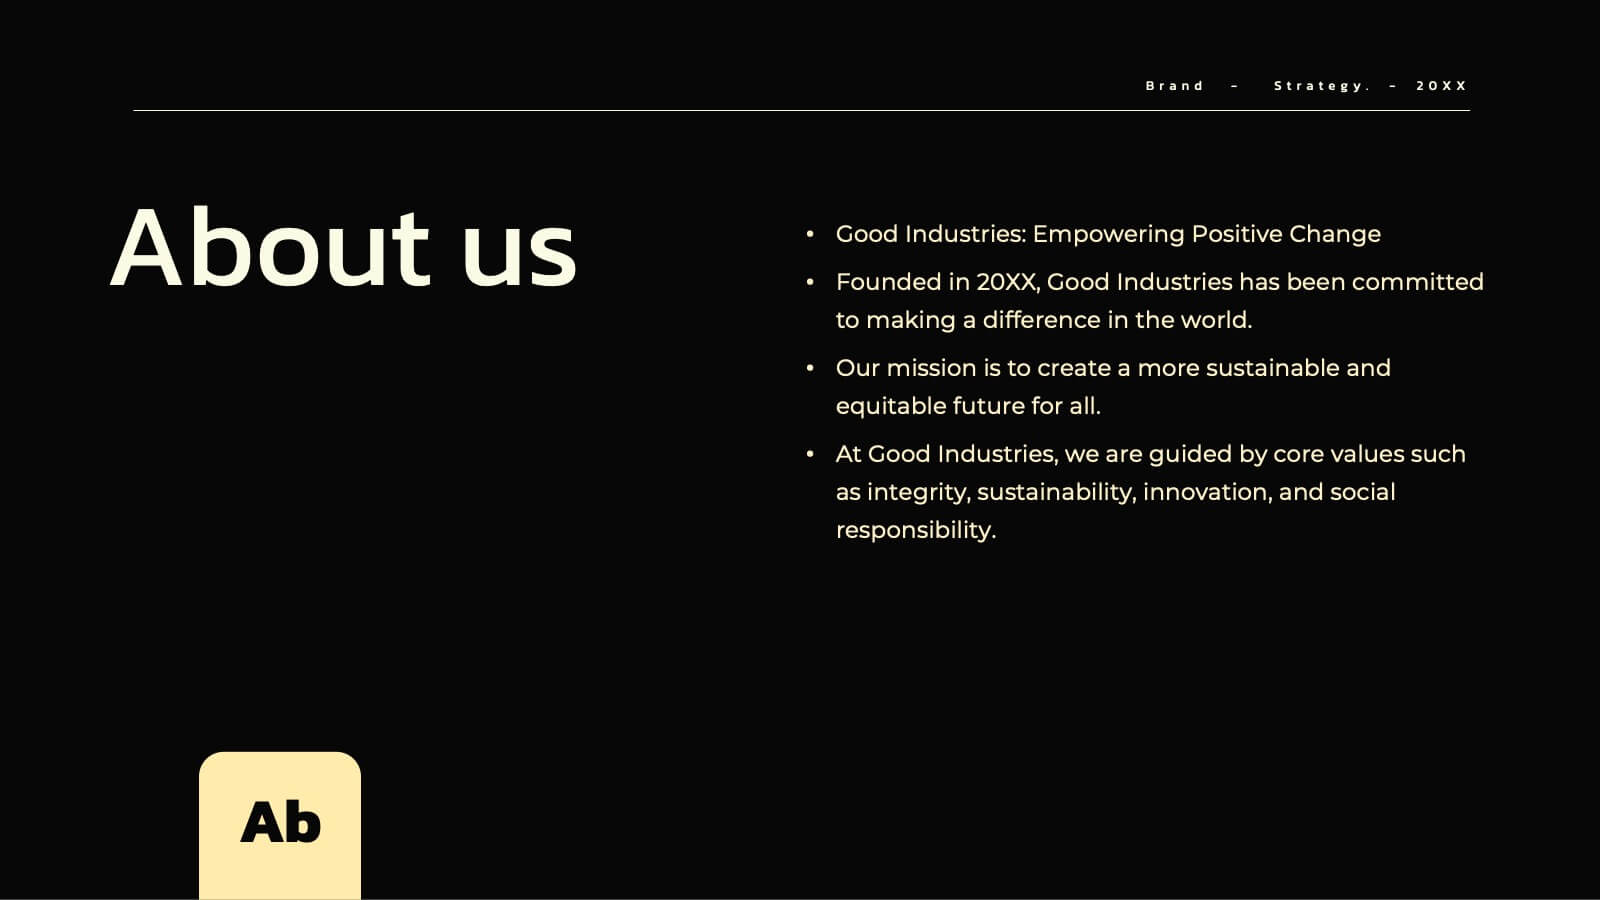
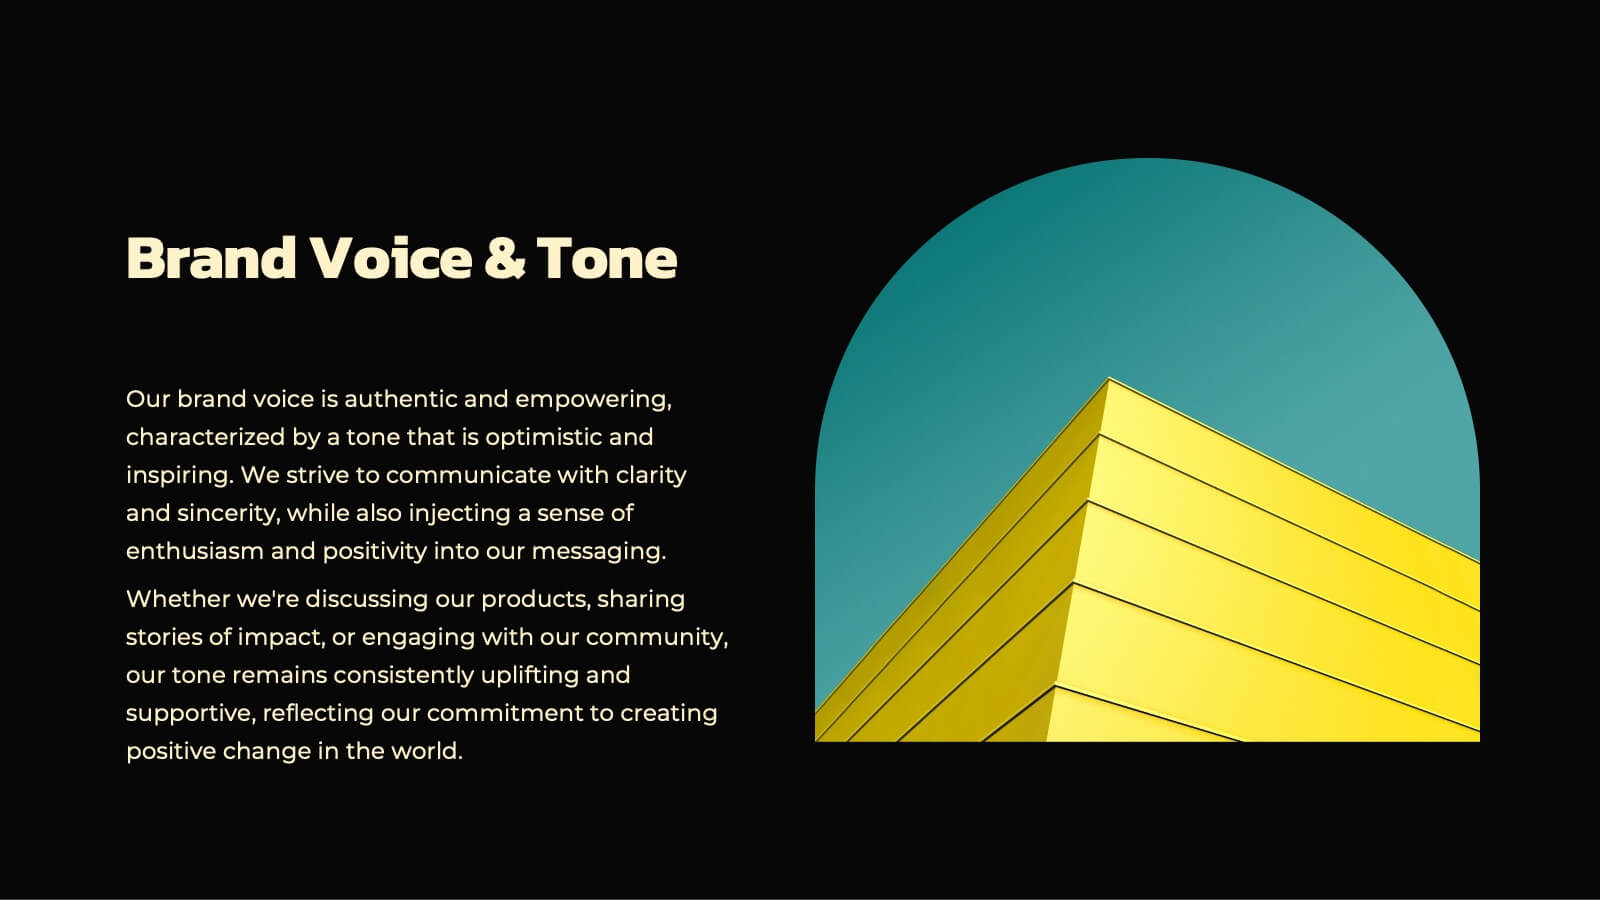
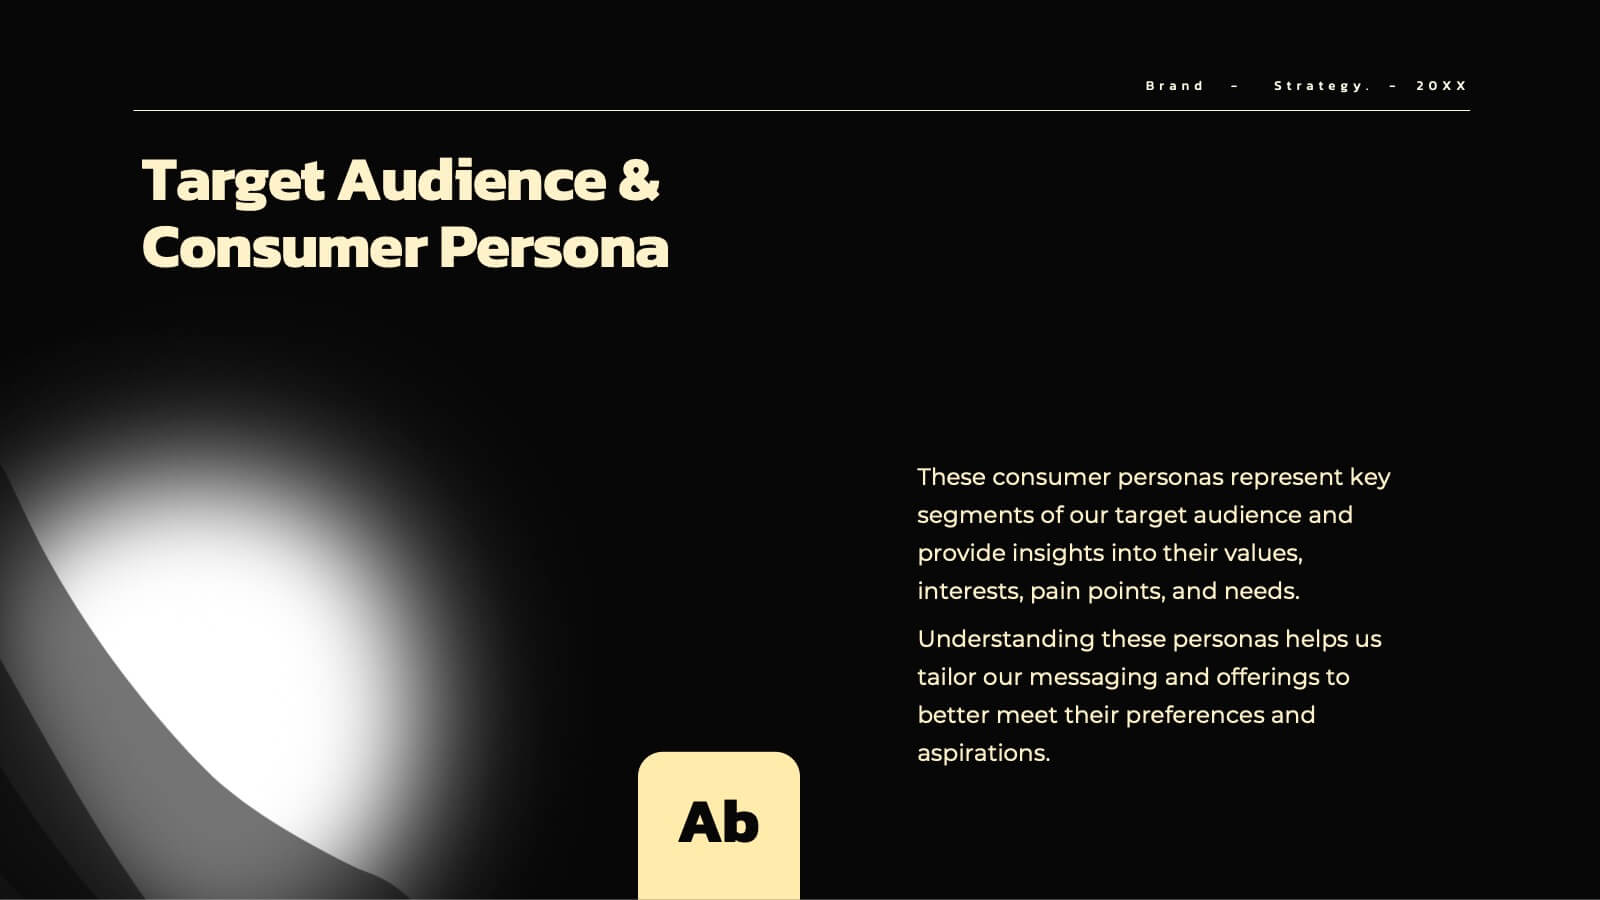
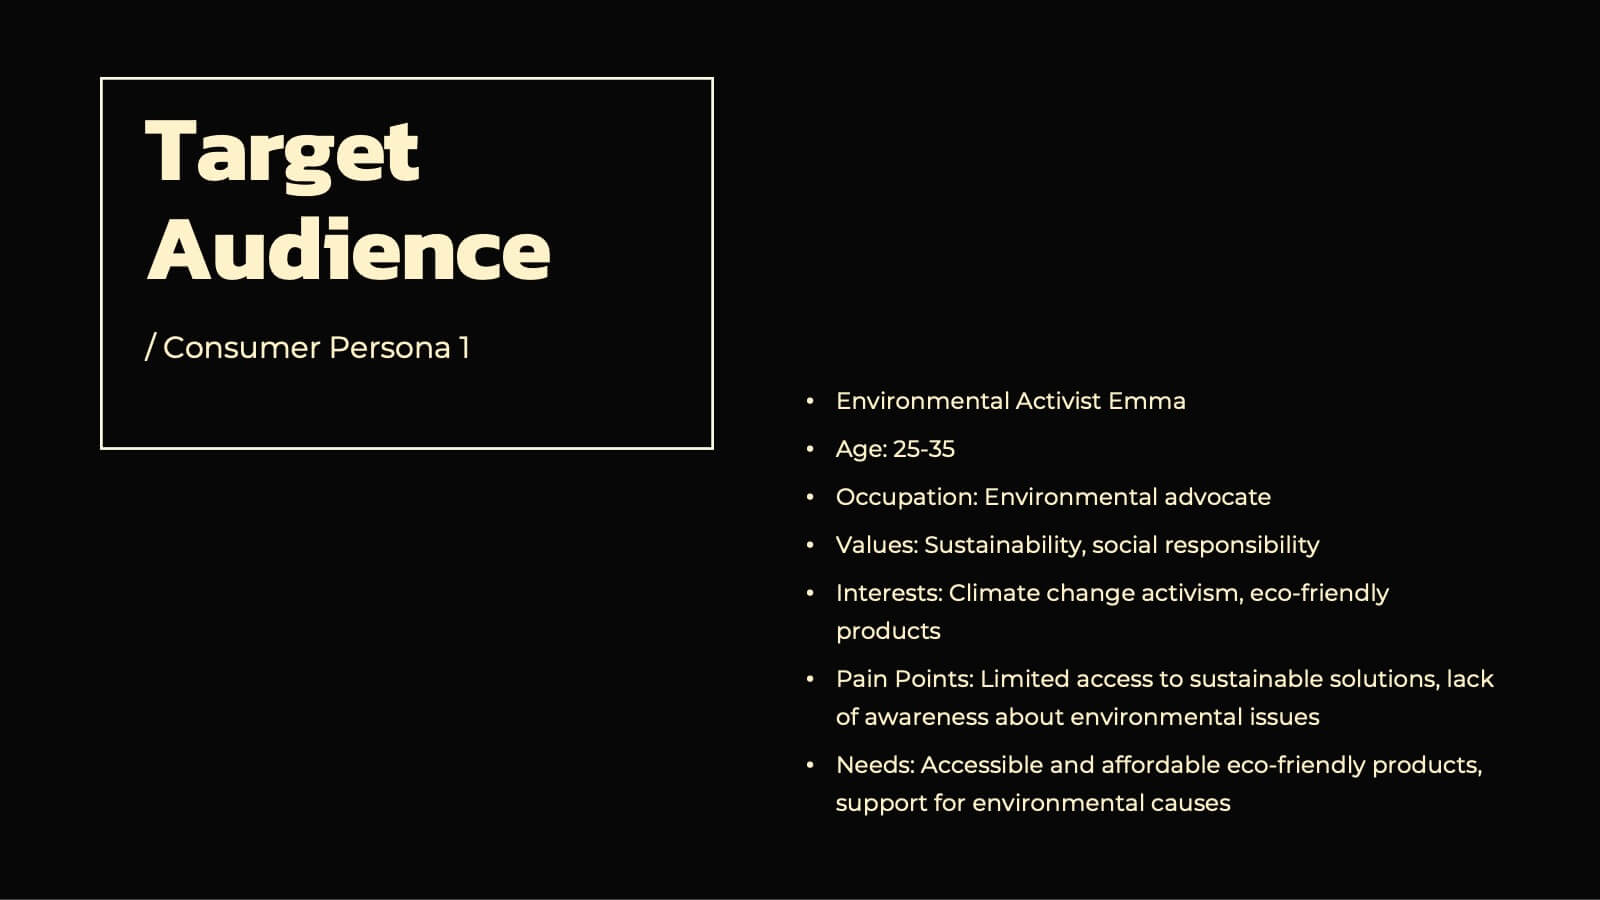
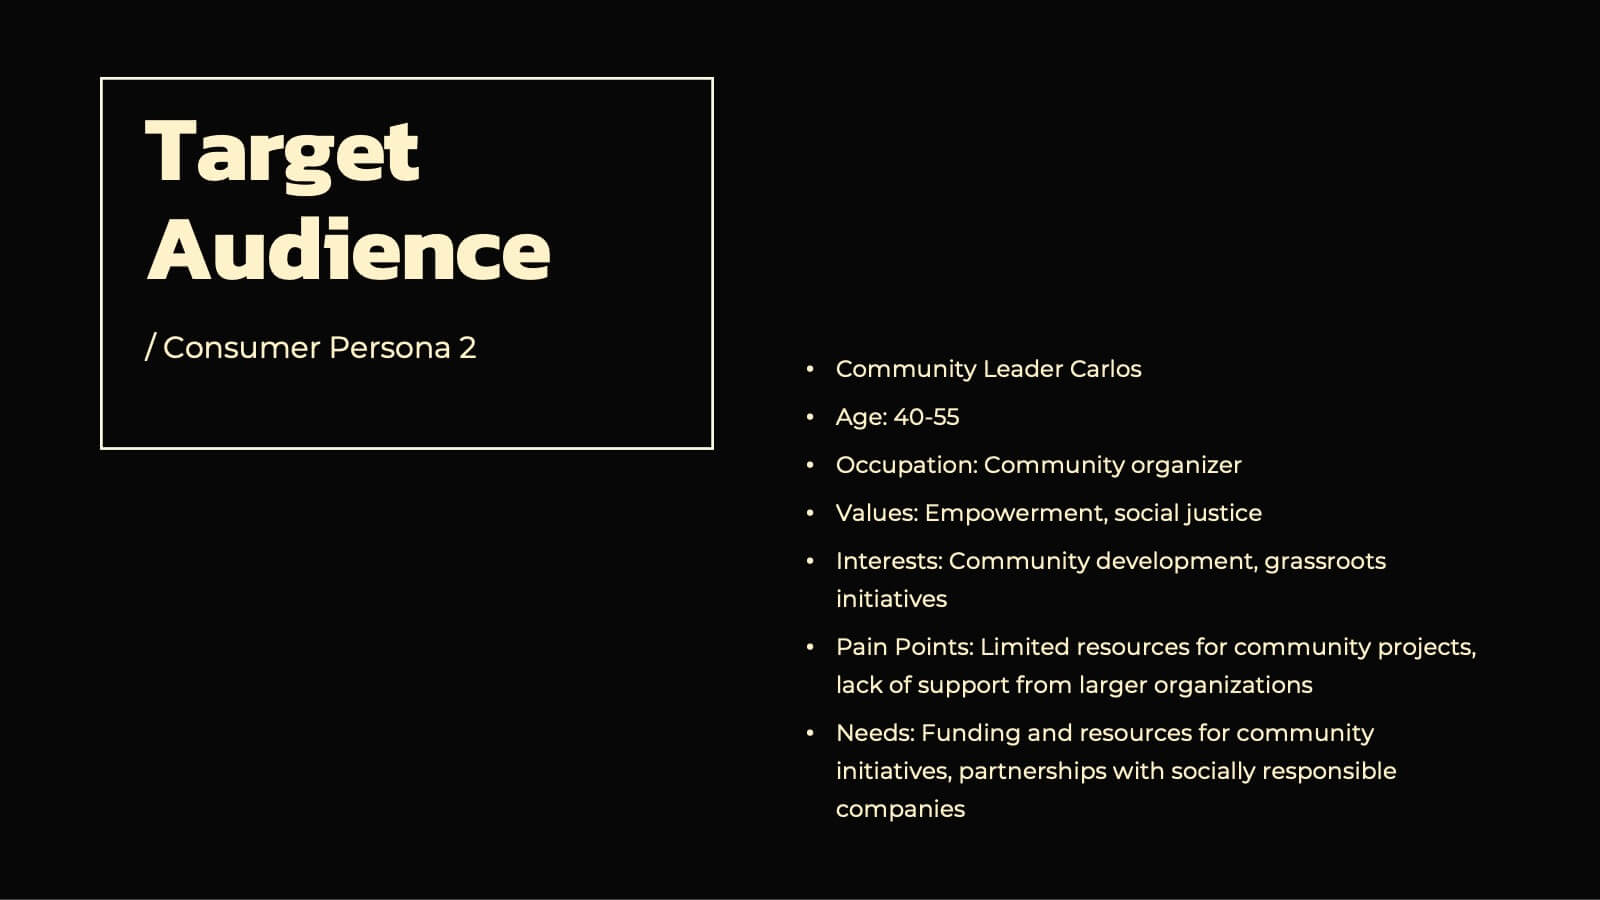
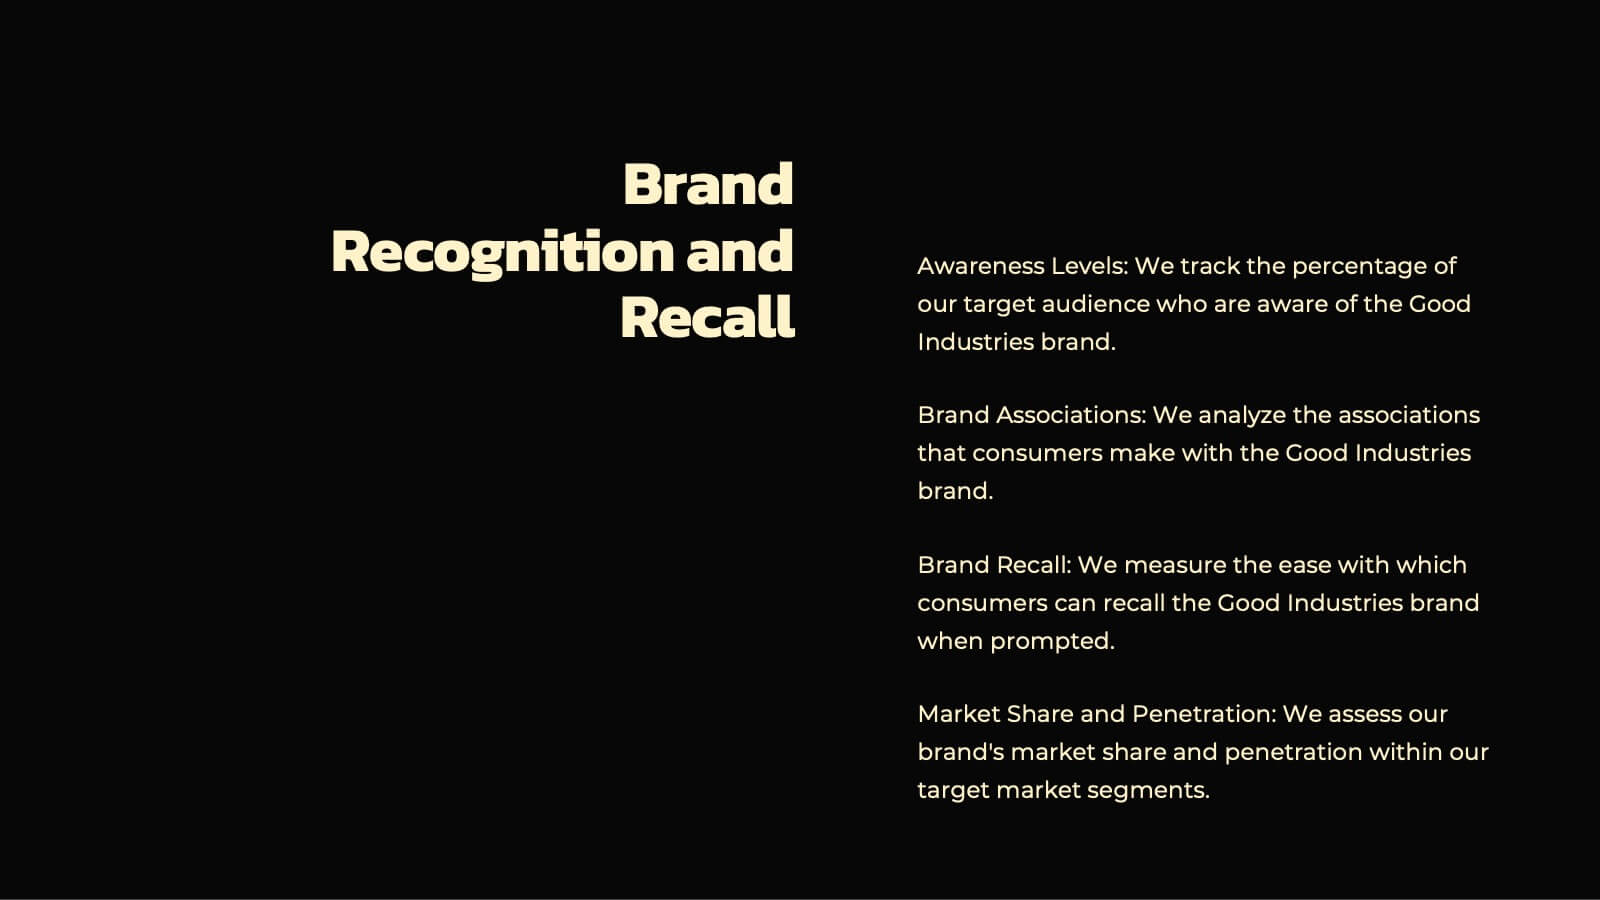
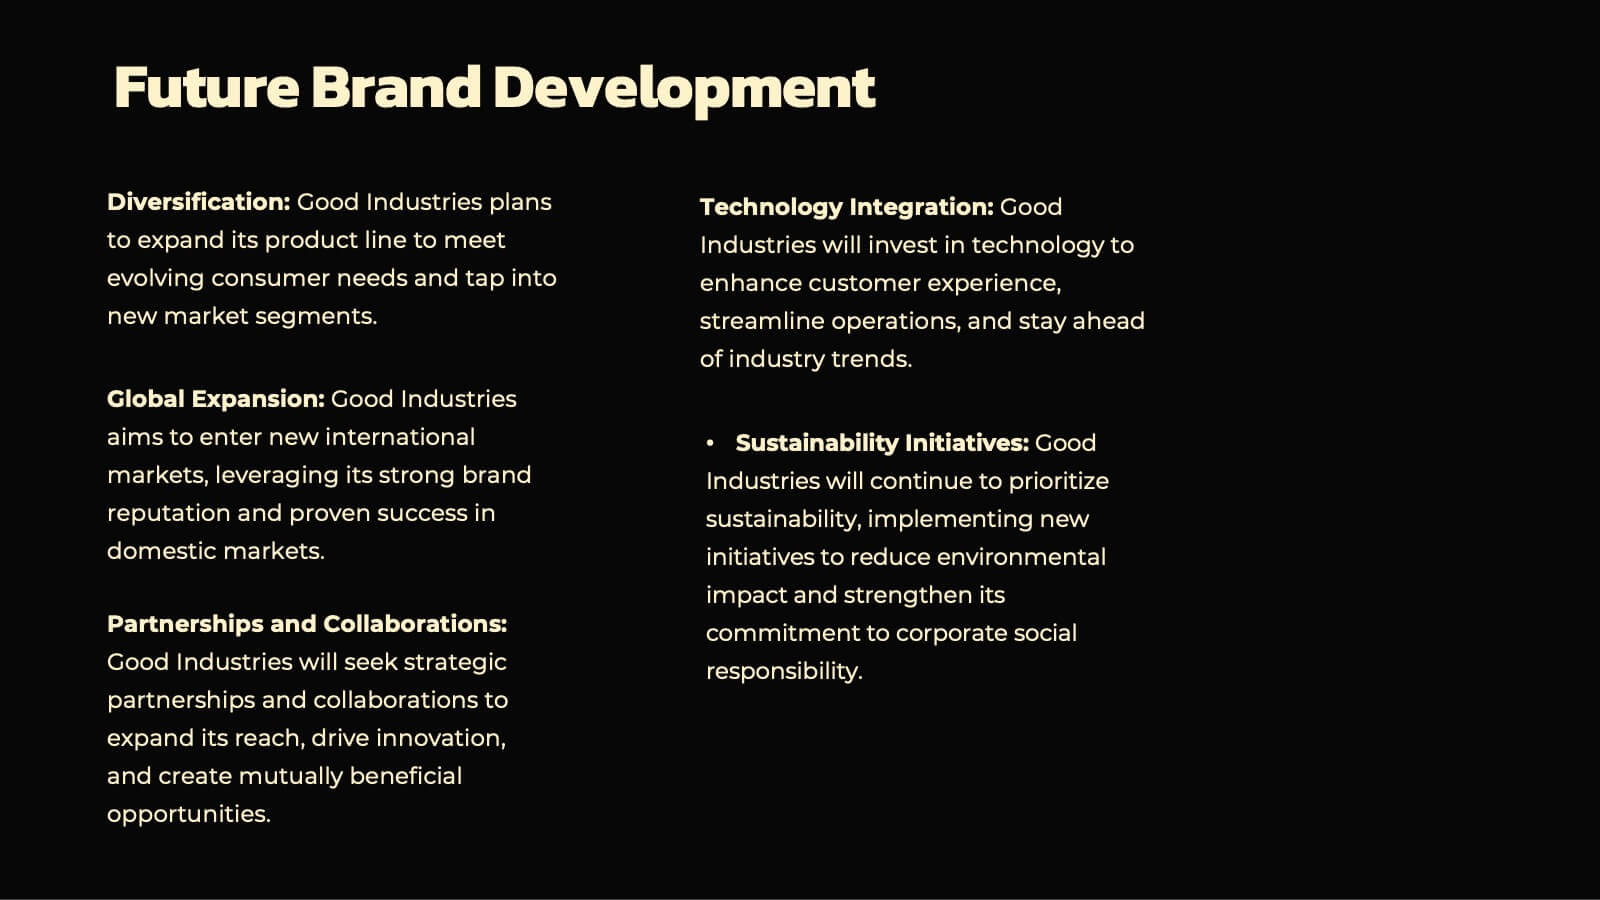
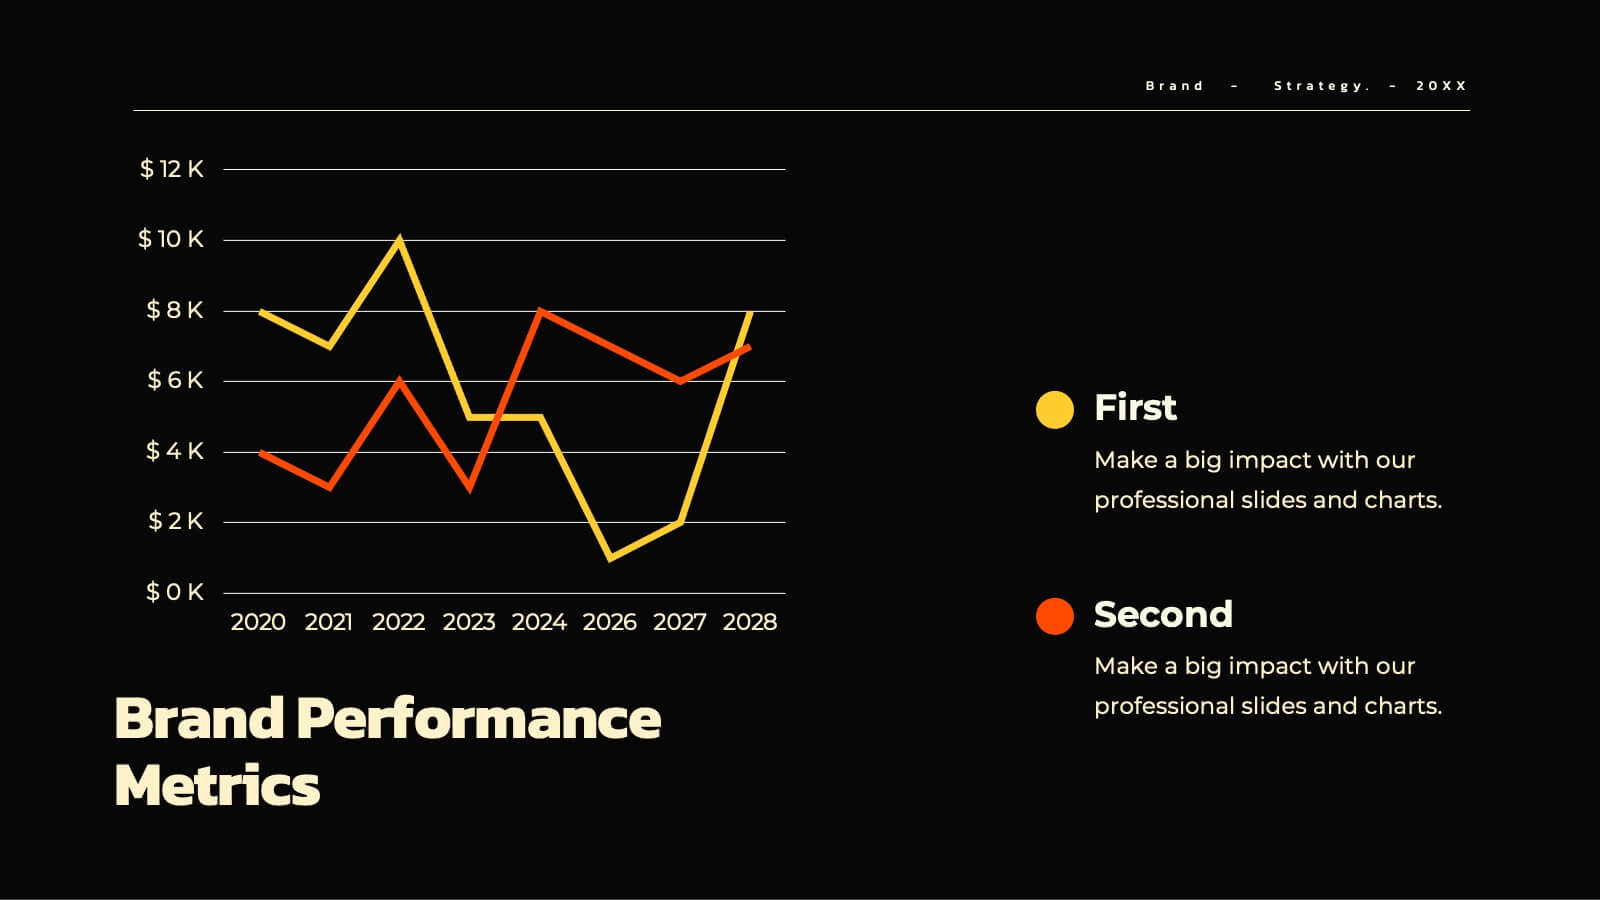
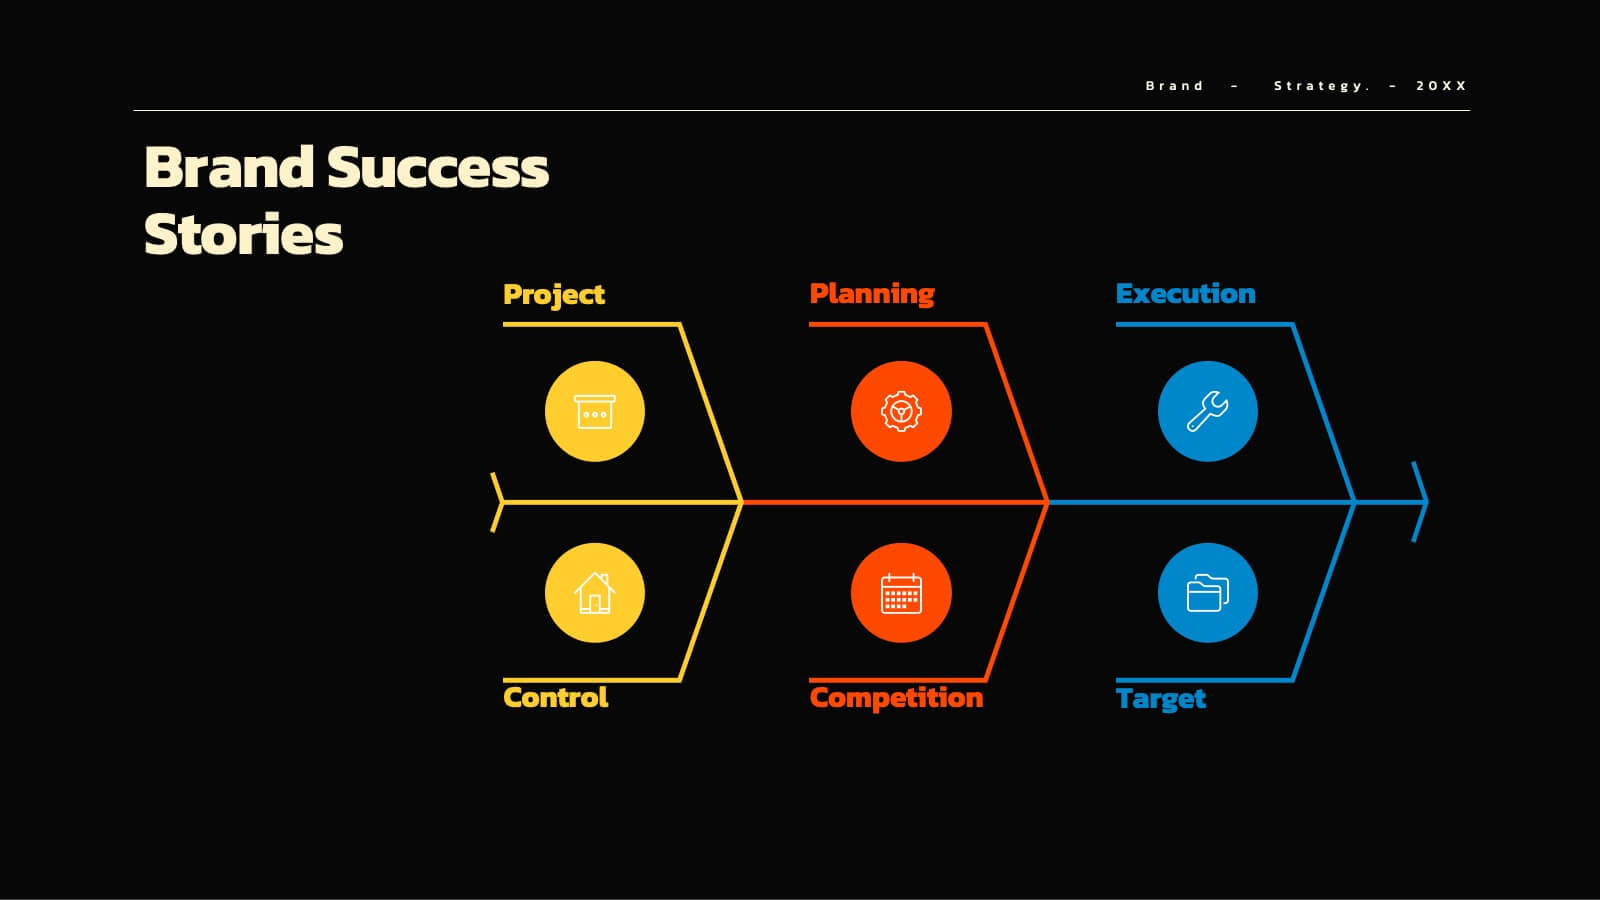
Aqua Brand Strategy Report Presentation
Make waves with this fresh, aqua-inspired presentation template, perfect for delivering a standout brand strategy report! Designed to help you showcase your brand's vision, market positioning, and strategic goals, it features a clean, modern layout that grabs attention. Compatible with PowerPoint, Keynote, and Google Slides for effortless customization.


7 diapositivas
Team Work Strategy Infographic
Harness the collective strength of your team with our team work strategy infographic. Set against a pristine white backdrop, this design is accentuated with vivid strokes of purple, blue, yellow, and orange, symbolizing the diverse skills and unity in a team. Crafted for seamless compatibility with Powerpoint, Keynote, and Google Slides, the template features versatile graphics, detailed icons, and adaptable image placeholders. Envisage the synergy, collaboration, and the strategic prowess of a unified team, all laid out in a visually appealing format.


6 diapositivas
Root Cause Analysis of Key Problems Presentation
Get to the heart of business issues with this Root Cause Analysis of Key Problems presentation. This template helps you break down complex challenges into actionable components: Who, What, When, Where, Why, and How. Clean, color-coded arrows ensure clarity. Ideal for strategic reviews and process optimization. Fully editable in Canva, PowerPoint, and Google Slides.


5 diapositivas
Business Influence Stakeholder Analysis Presentation
Enhance your project's success with our Business Influence Stakeholder Analysis Presentation template, designed to identify and prioritize stakeholders based on their influence and impact. This template is ideal for strategic planning and ensuring all key stakeholders are considered. Compatible with PowerPoint, Keynote, and Google Slides."