


Características


¿Tienes alguna pregunta?
Recomendar


19 diapositivas
Zenith Sales Proposal Presentation
Get ready to blow your clients away with this electrifying sales proposal template! Packed with sections on project scope, bold objectives, timelines, and jaw-dropping pricing, it’s designed to make a powerful impact. The sleek, cutting-edge design ensures you’ll leave a lasting impression. Fully compatible with PowerPoint, Keynote, and Google Slides!


26 diapositivas
The Rise of Smart Cities Presentation
This presentation template is dedicated to urban developers, technology enthusiasts, and policy makers interested in the advancement of smart cities. The template serves as a deep dive into the integration of technology within urban settings to boost sustainability, efficiency, and quality of life. It is designed with a sleek, modern aesthetic, using a color palette that reflects innovation and modernity, which makes it visually appealing and easy to navigate. The content is structured to demystify complex concepts about smart cities, featuring sections on IoT implementations, eco-friendly urban development, and smart public services. It includes varied slide types such as diagrams, infographics, and statistical displays to showcase data and case studies from cities that are pioneers in this domain. The template is compatible with multiple presentation platforms like PowerPoint, Google Slides, and Keynote, ensuring it can be utilized across different devices and settings. This makes it a versatile tool for presentations in educational, professional, and conference contexts, aiming to inspire and educate on the transformative power of smart urban planning.


4 diapositivas
Employee Performance Feedback
Showcase progress clearly with this Employee Performance Feedback presentation. Featuring skill-based metrics, productivity scores, and analysis ratings, this layout uses visual data bars to evaluate team performance at a glance. Perfect for HR reviews, team assessments, or quarterly check-ins. Fully editable in PowerPoint, Keynote, and Google Slides.


6 diapositivas
TAM SAM SOM for Target Reach Forecasting Presentation
Break down your market reach with clarity using the TAM SAM SOM for Target Reach Forecasting Presentation. This sleek, layered circle diagram is ideal for illustrating your total addressable market, serviceable market, and obtainable market. Customize easily in PowerPoint, Keynote, or Google Slides to align with your brand and business strategy.


6 diapositivas
Customer Loyalty Rewards Structure Presentation
Illustrate your brand’s customer retention strategy with the Customer Loyalty Rewards Structure presentation. This visually engaging template highlights reward tiers, perks, and loyalty card systems—perfect for showcasing how customers earn incentives over time. Ideal for marketing teams, retail businesses, and loyalty program proposals. Fully editable in PowerPoint, Keynote, and Google Slides.


5 diapositivas
Marketing Wheel Strategy Presentation
Enhance your marketing presentations with our "Marketing Wheel Strategy Presentation" template. This infographic is designed to visually represent the interconnected components of a marketing strategy, organized in a wheel format for clarity. Each segment, color-coded for distinction, covers different aspects such as planning, execution, analysis, and optimization, demonstrating their interdependence. This layout is perfect for illustrating how each part contributes to the overall effectiveness of a marketing plan. Ideal for marketing professionals and strategists, it facilitates detailed strategy discussions and comprehensive planning sessions. Fully compatible with PowerPoint, Keynote, and Google Slides, this template is essential for delivering clear and effective marketing presentations.


10 diapositivas
Key Business Insights Executive Summary Presentation
Showcase your strategic insights effectively with the 'Key Business Insights Executive Summary' template. This visually appealing tool highlights critical data points and metrics, enabling a clear presentation of business achievements and forecasts. Perfectly tailored for use in PowerPoint, Keynote, and Google Slides, it ensures your executive summaries are both comprehensive and compelling.


5 diapositivas
Environment Articles Infographic
The Environment is important for a number of reasons, it is essential that we take care of it and minimize our impact on it. This vertical Infographic is a visual representations of information related to environmental topics, presented in a vertical format. These infographics are designed to effectively communicate key facts, statistics, and concepts about the environment in a visually appealing and easily digestible manner. This consist of a series of vertically arranged sections or columns, each containing relevant information and visuals. These sections can cover a wide range of environmental topics, such as climate change, renewable energy, pollution, and sustainable practices.


7 diapositivas
Corporation Hierarchy Infographic
Discover the intricate layers of corporate structure with our corporation hierarchy infographic. Set in an appealing blend of blue, yellow, and white, this template artfully depicts the hierarchal ladder commonly seen in major corporations. From CEOs to interns, it beautifully outlines every rung. This infographic is indispensable for business students, corporate trainers, managers, and anyone seeking to understand the inner workings of a corporation. Designed with precision and clarity, it's perfectly suited for PowerPoint, Keynote, and Google Slides, making your presentations not only informative but also visually captivating.


5 diapositivas
Medical Services Infographics
Navigate the complexities of healthcare information with our medical services infographics. Rendered in a life-affirming palette of blue and red, these infographics elucidate various facets of medical services. The template serves as a lifeline for healthcare professionals, and public health advocates by providing a clear, visual narrative of services, processes, and advancements in the medical field. Compatible with Powerpoint, Keynote, and Google Slides. Its creative yet informative style, enhanced with relevant graphics and icons, ensure that critical information catches the eye, improves understanding, and encourages engagement.

22 diapositivas
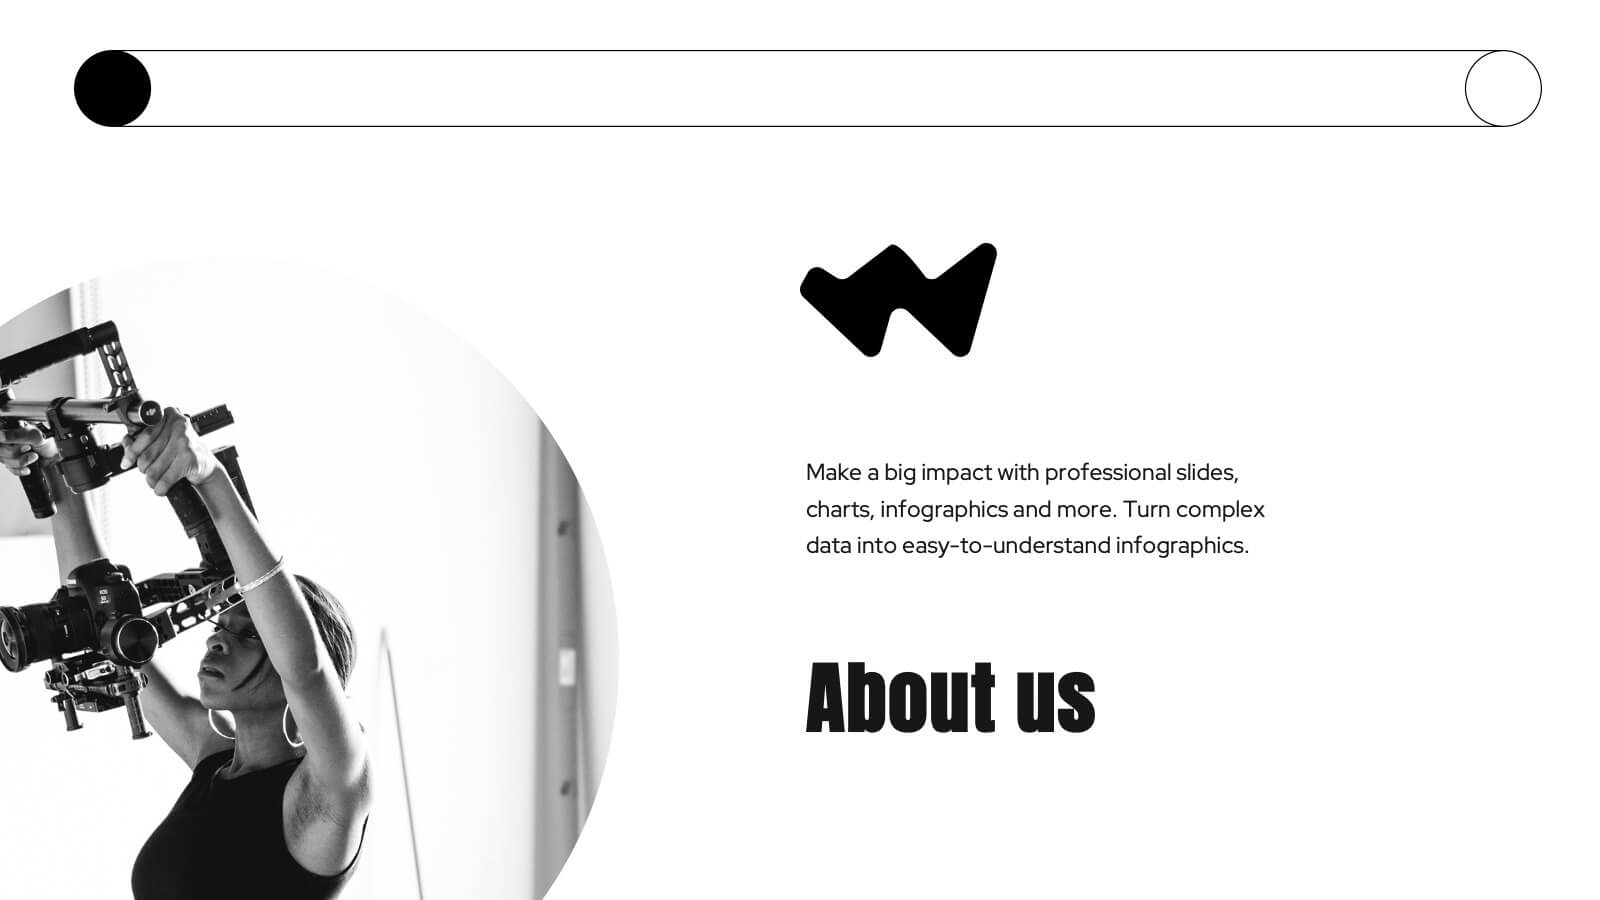
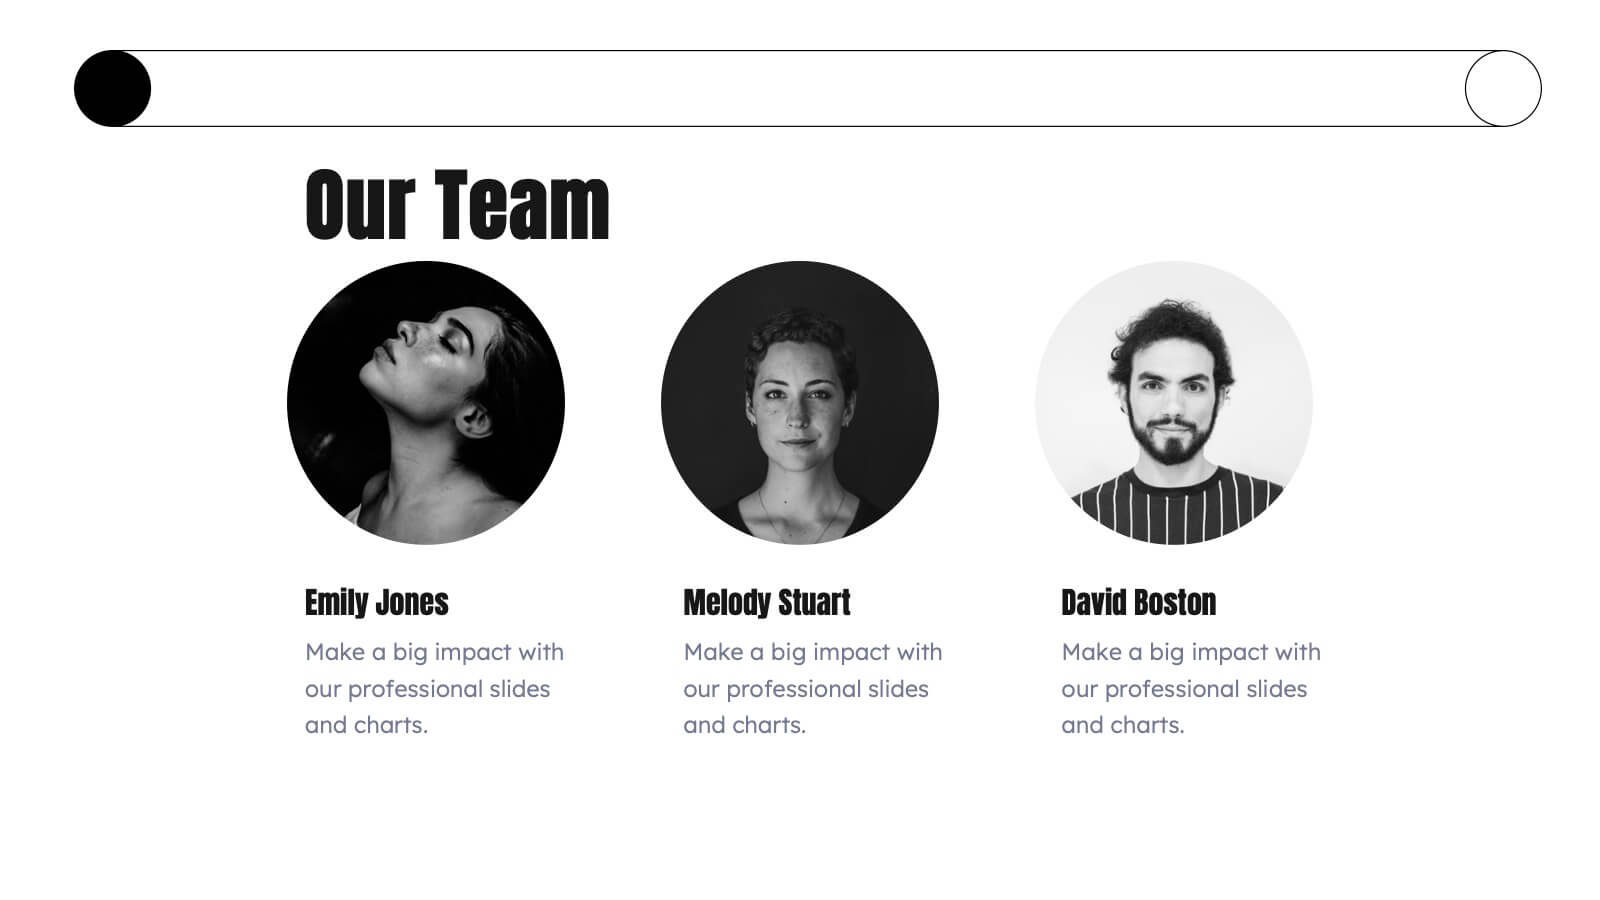
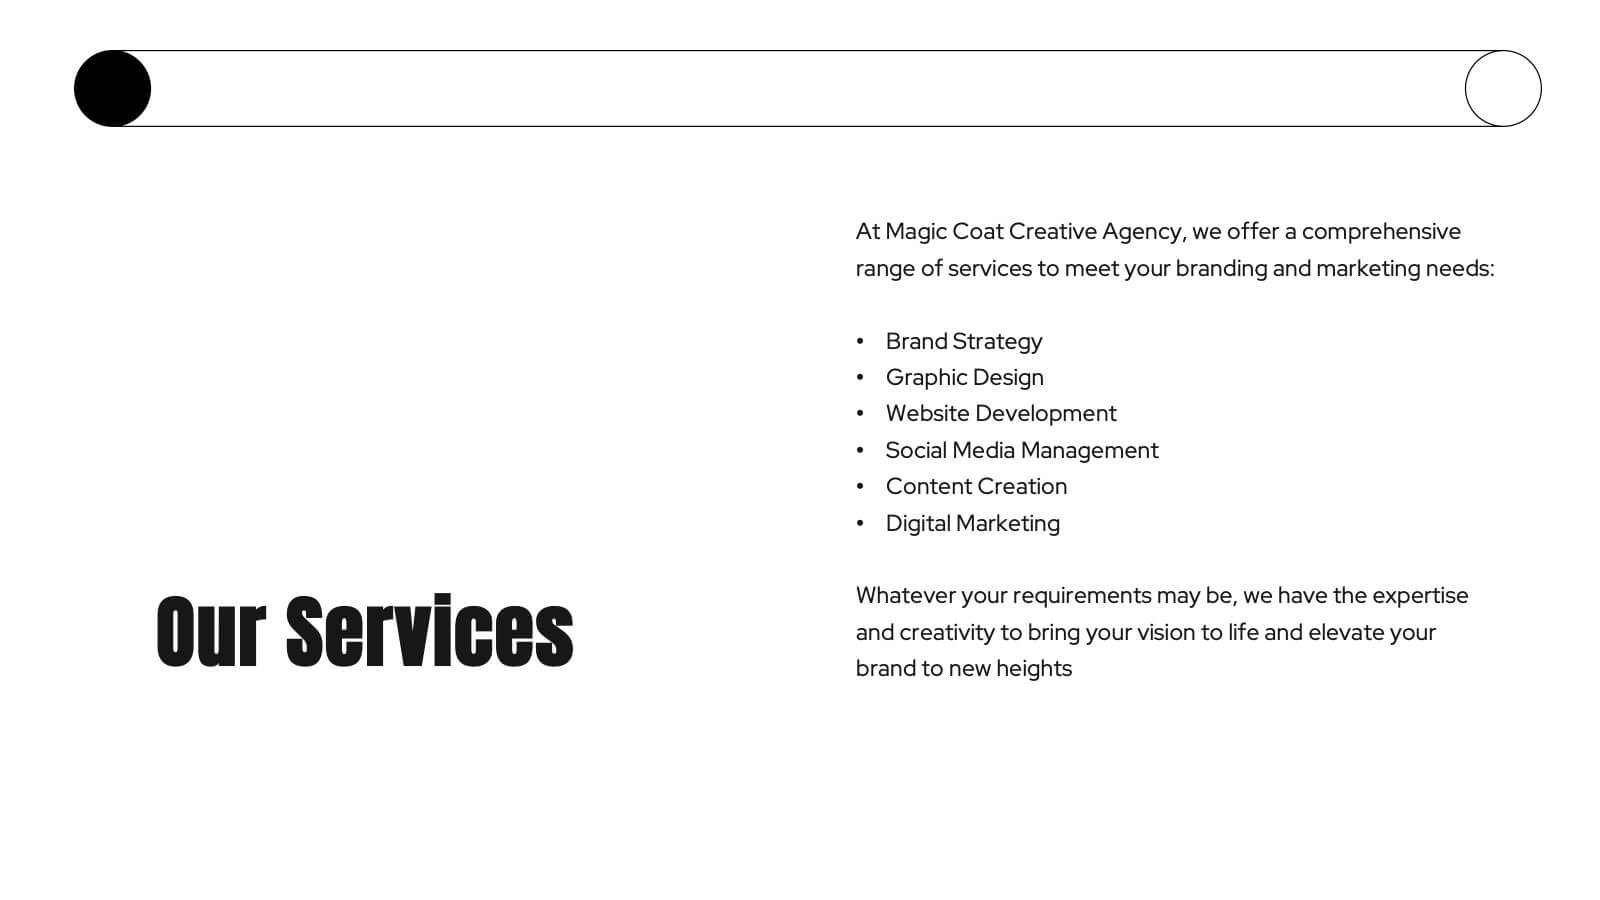
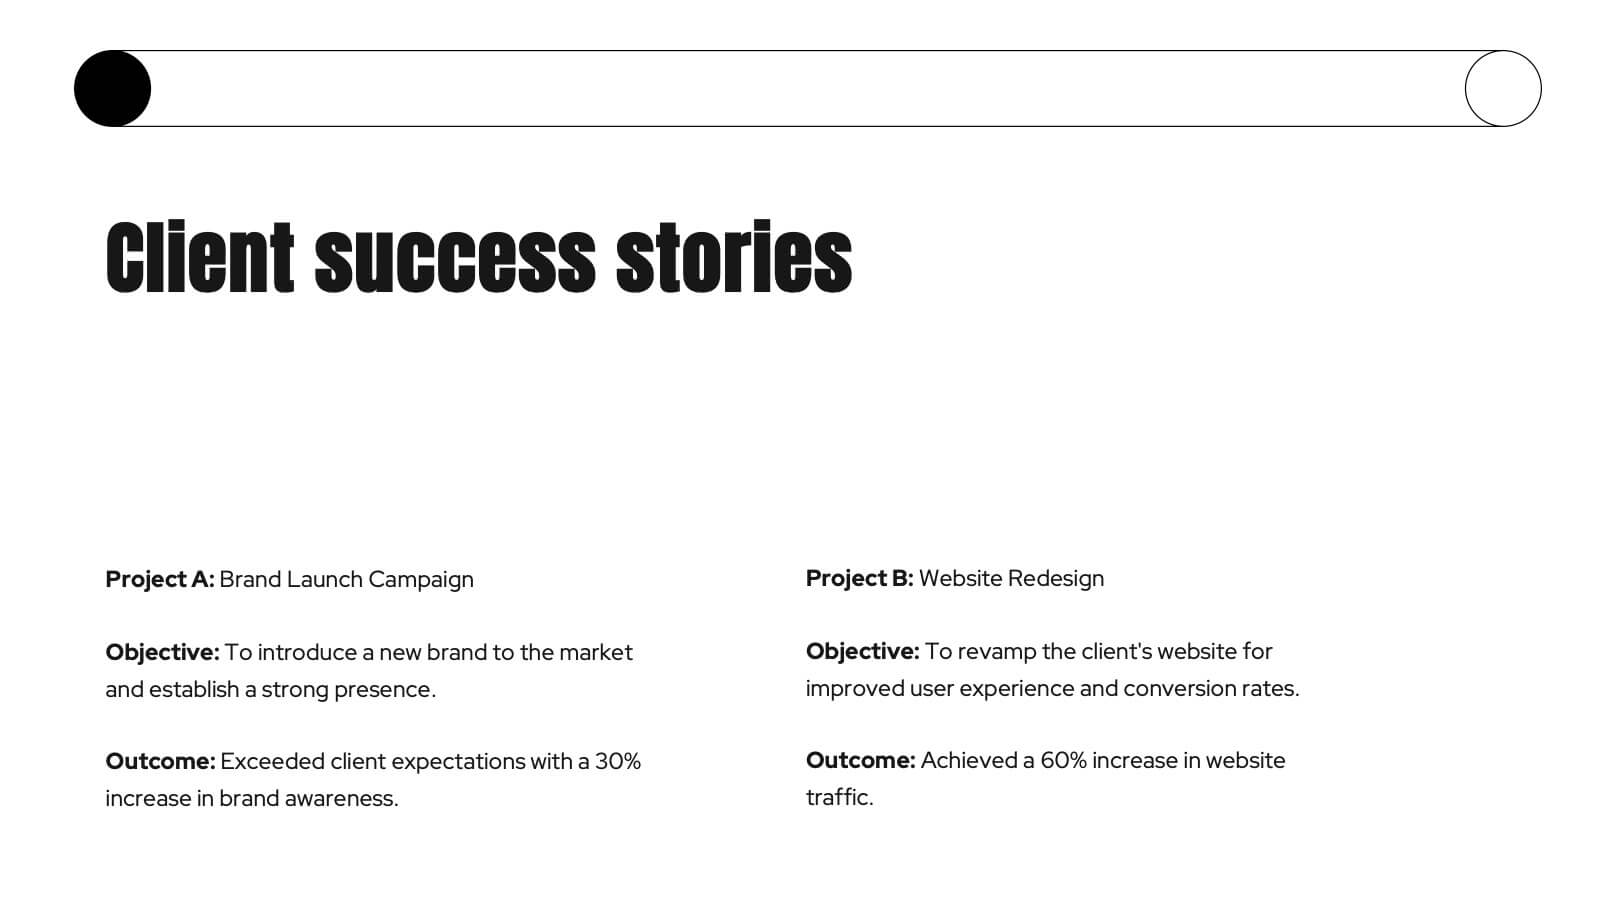
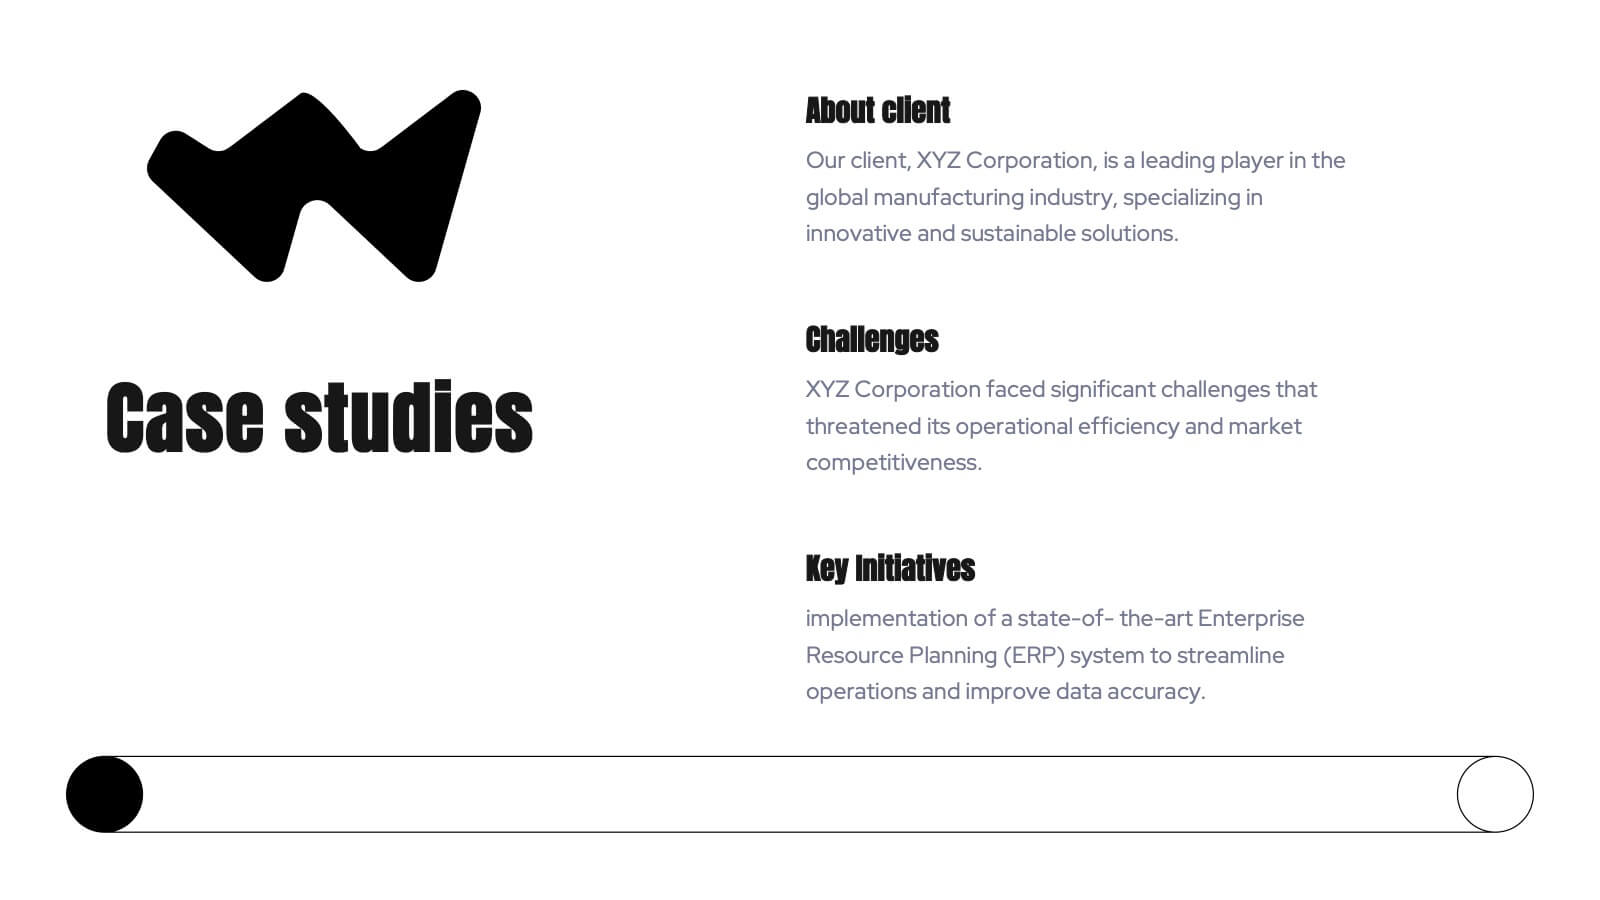
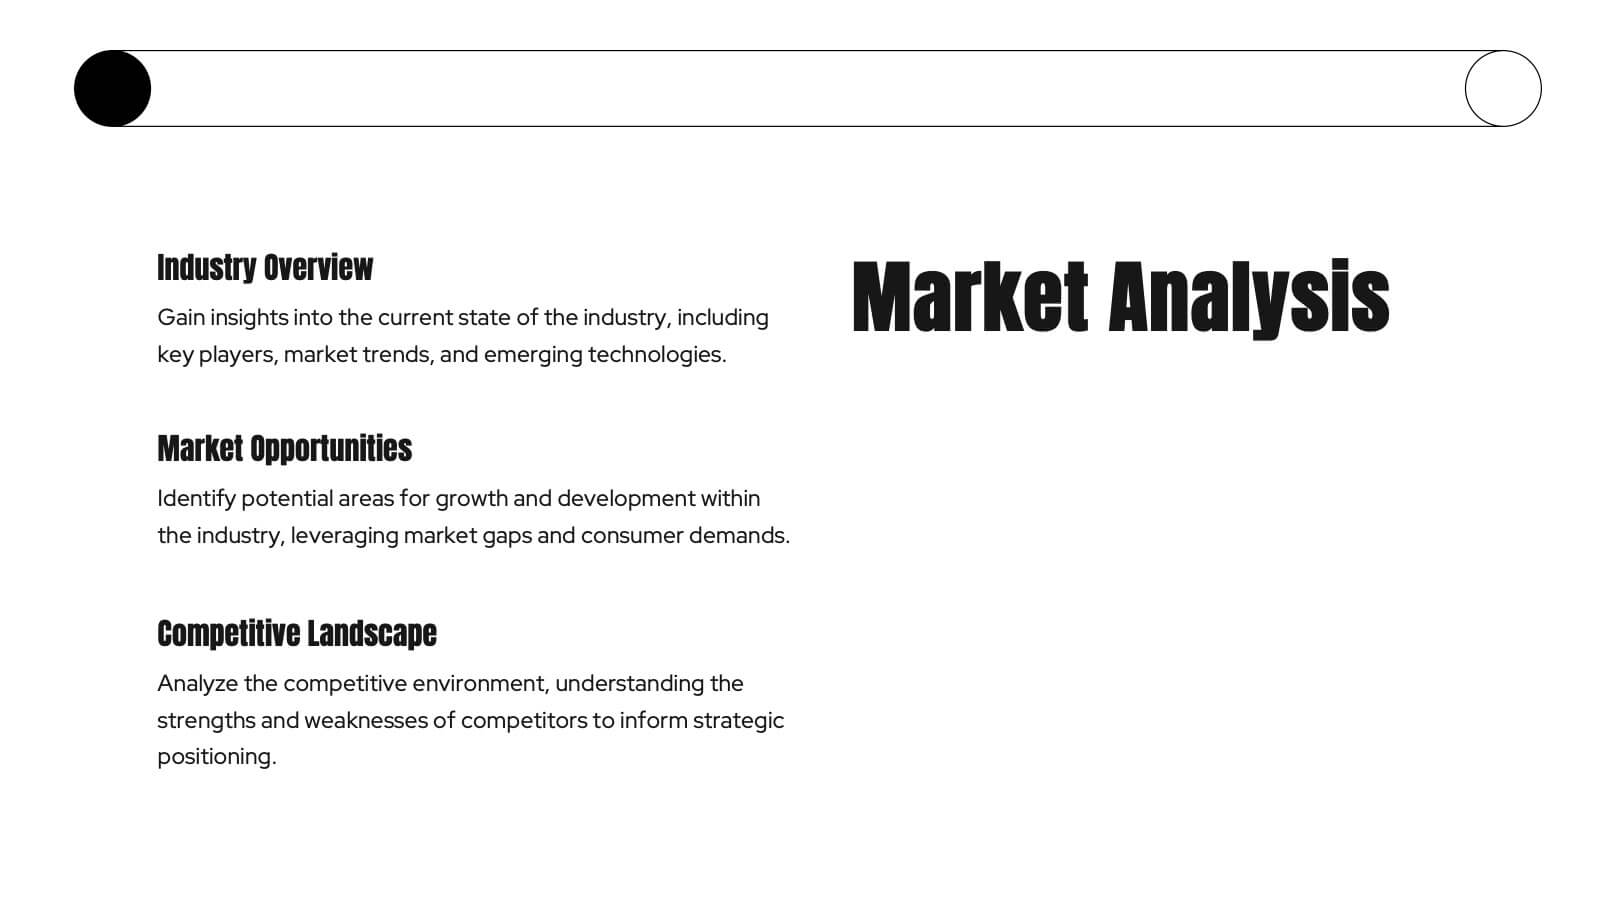
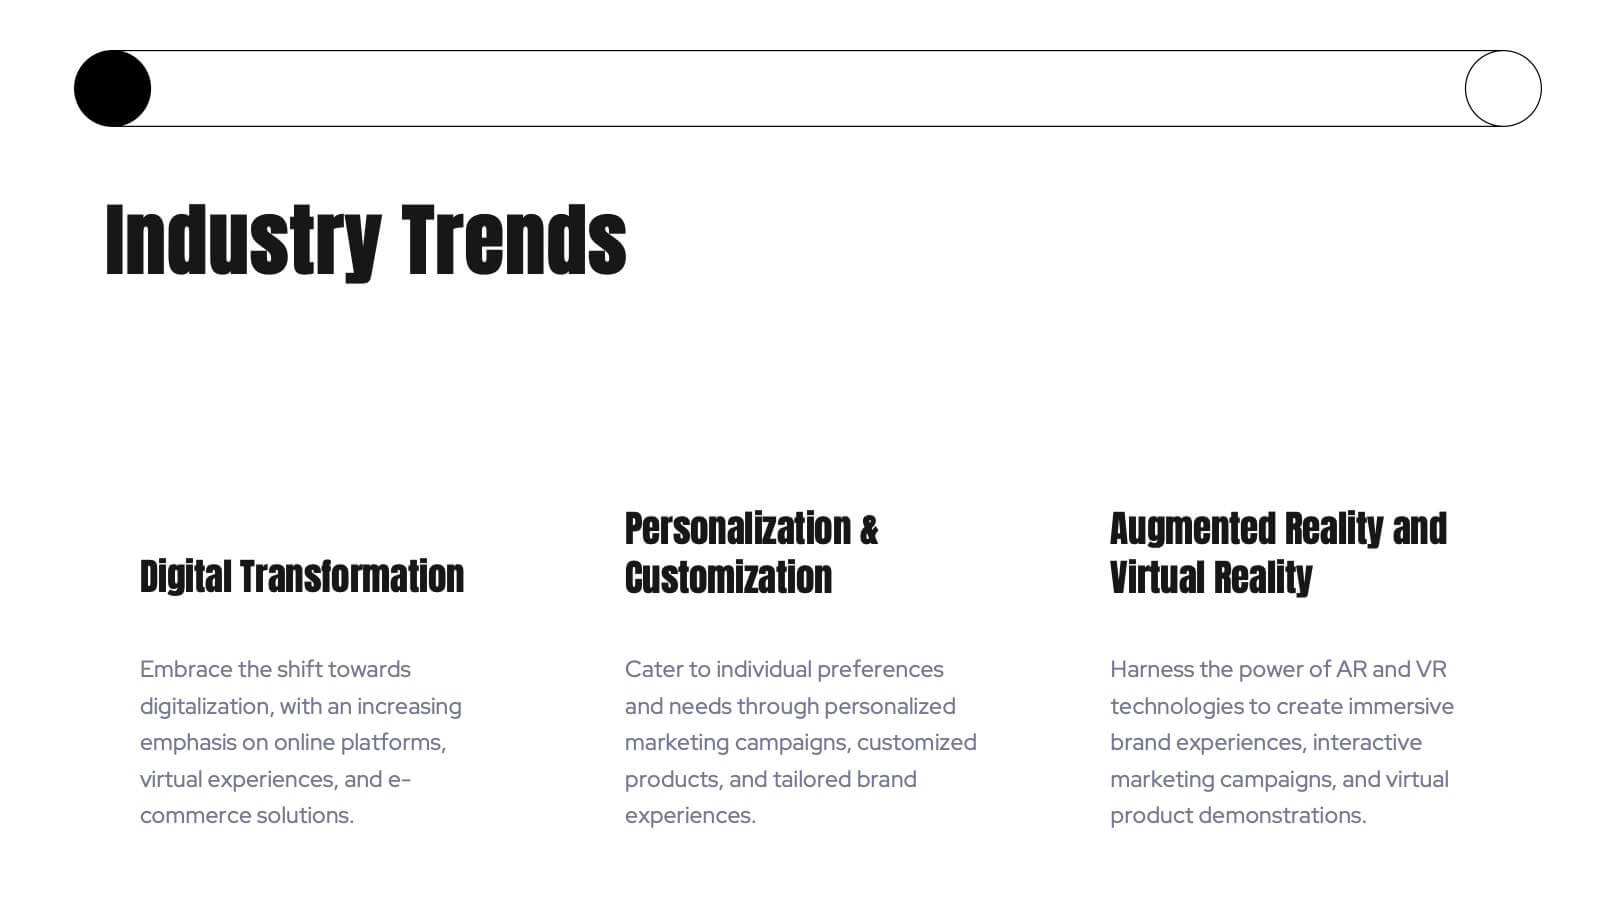
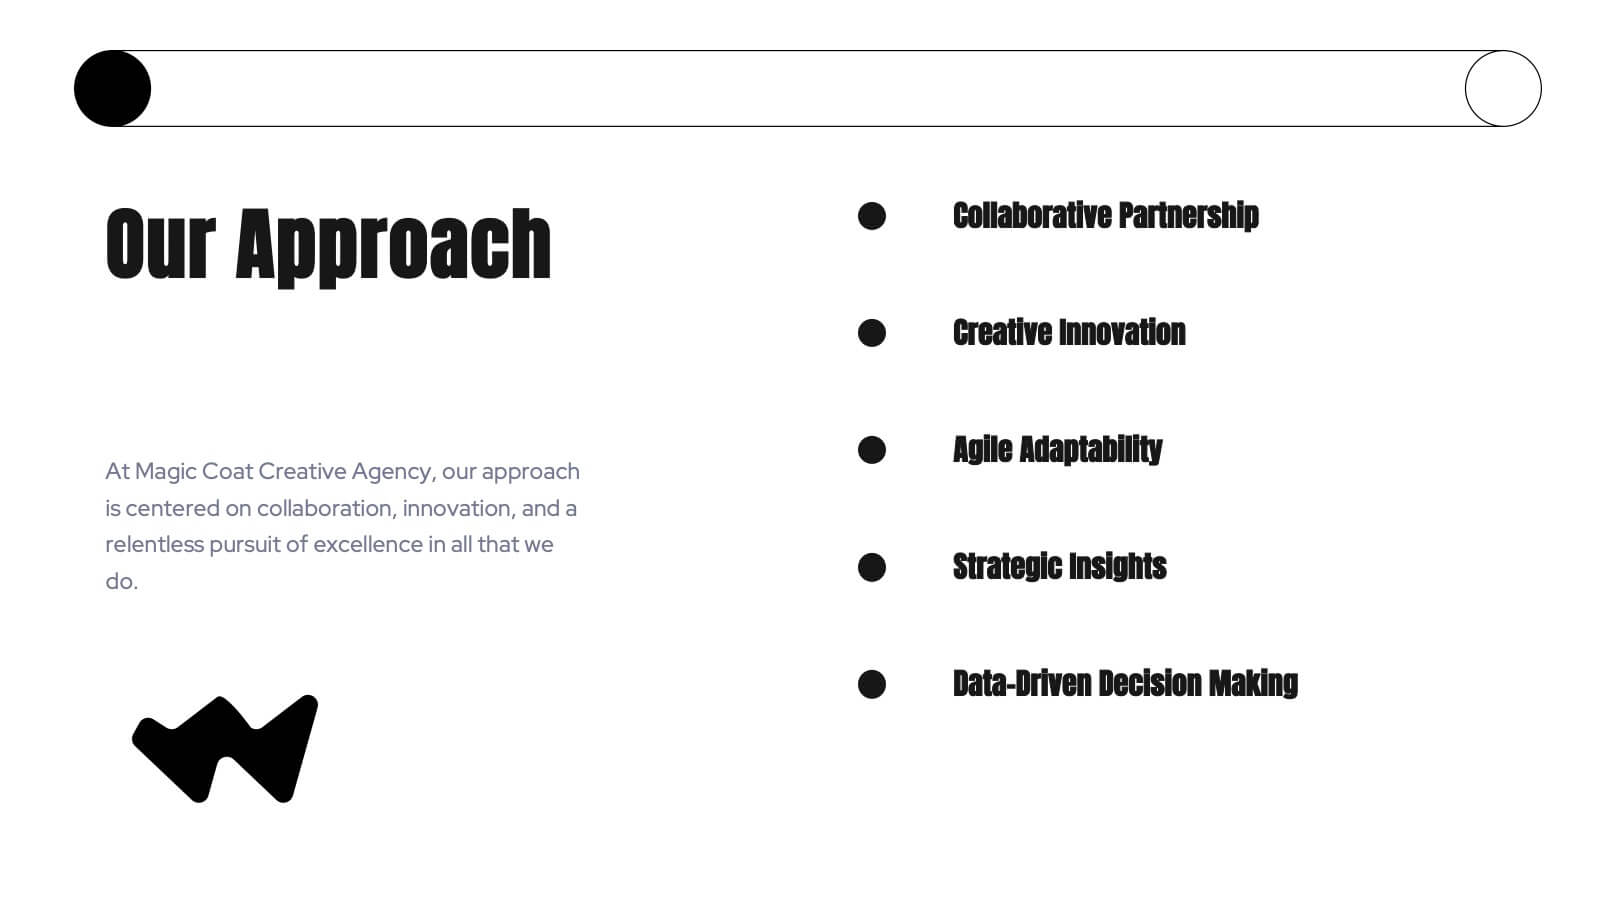
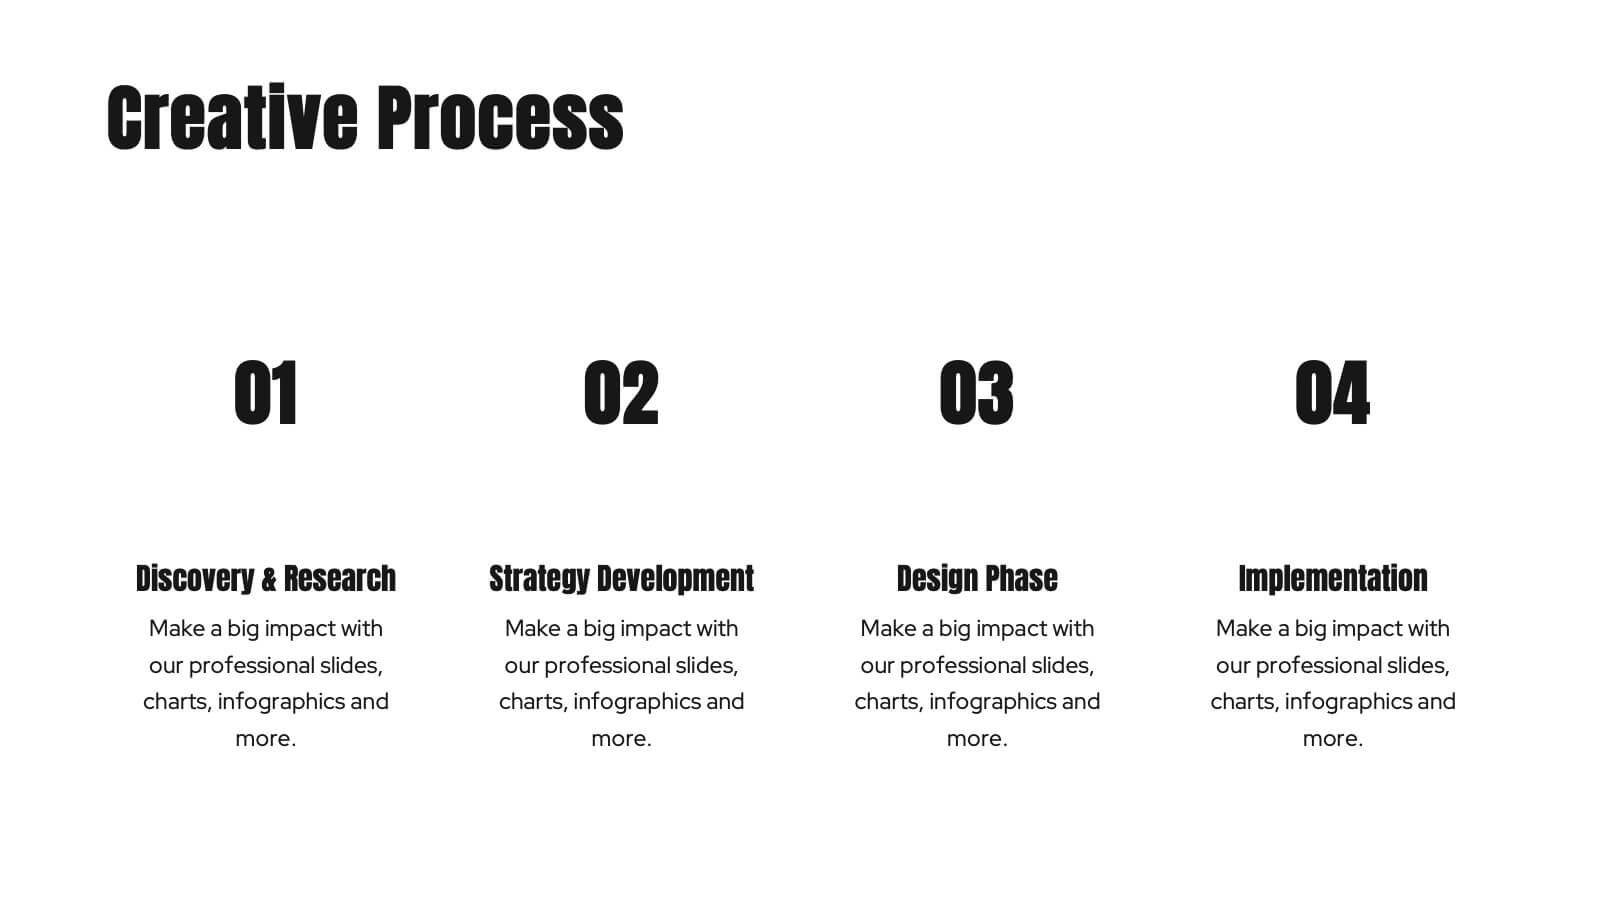
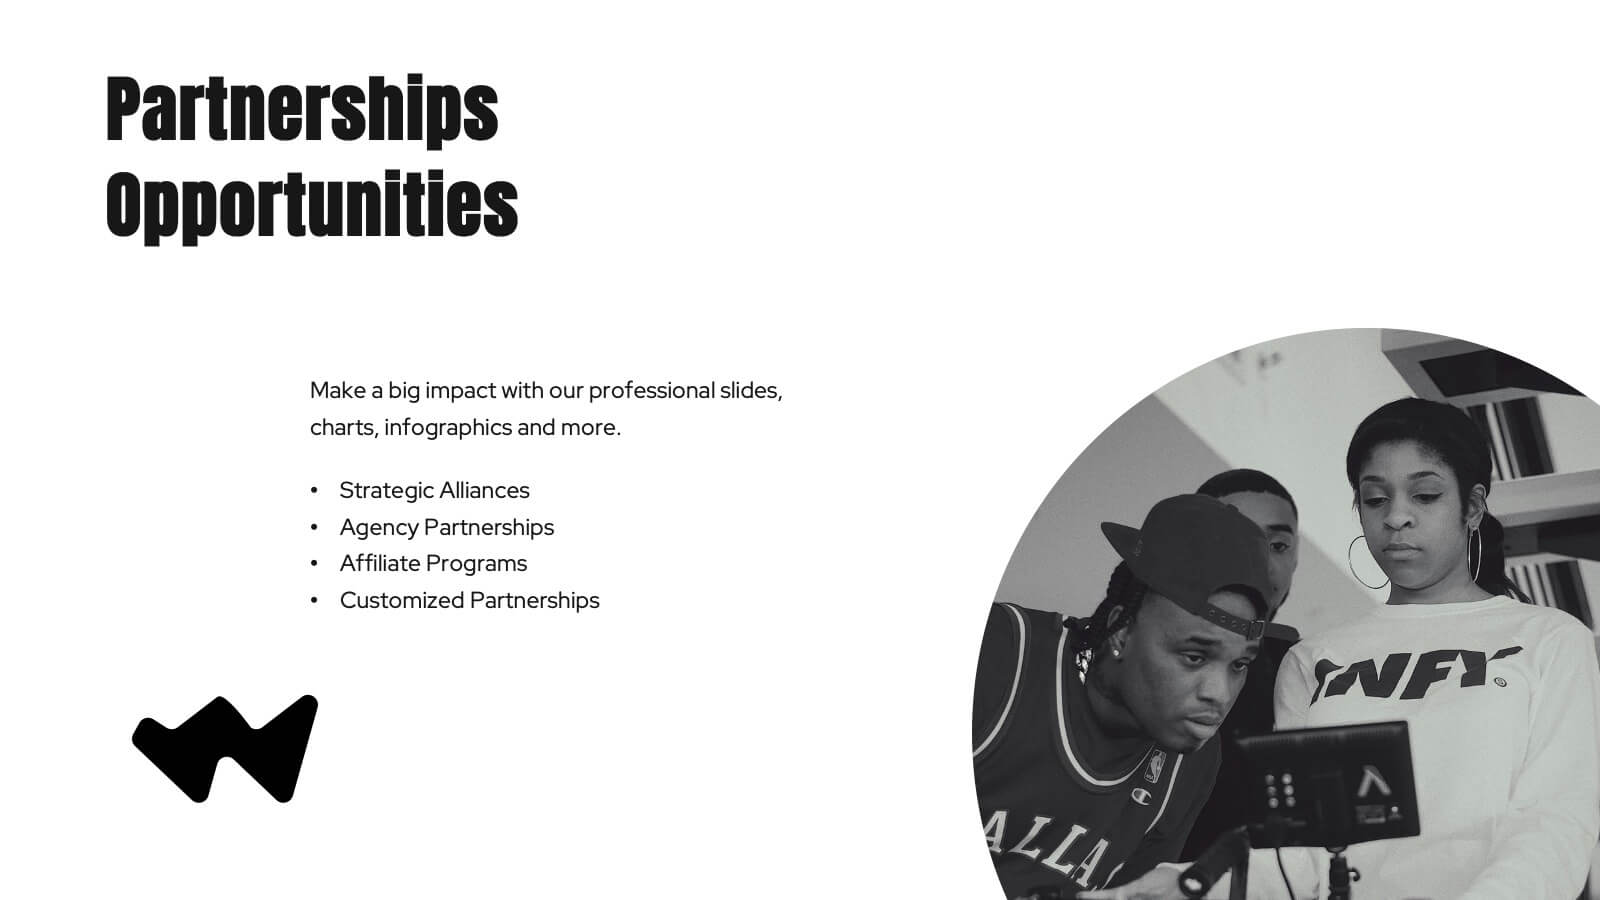
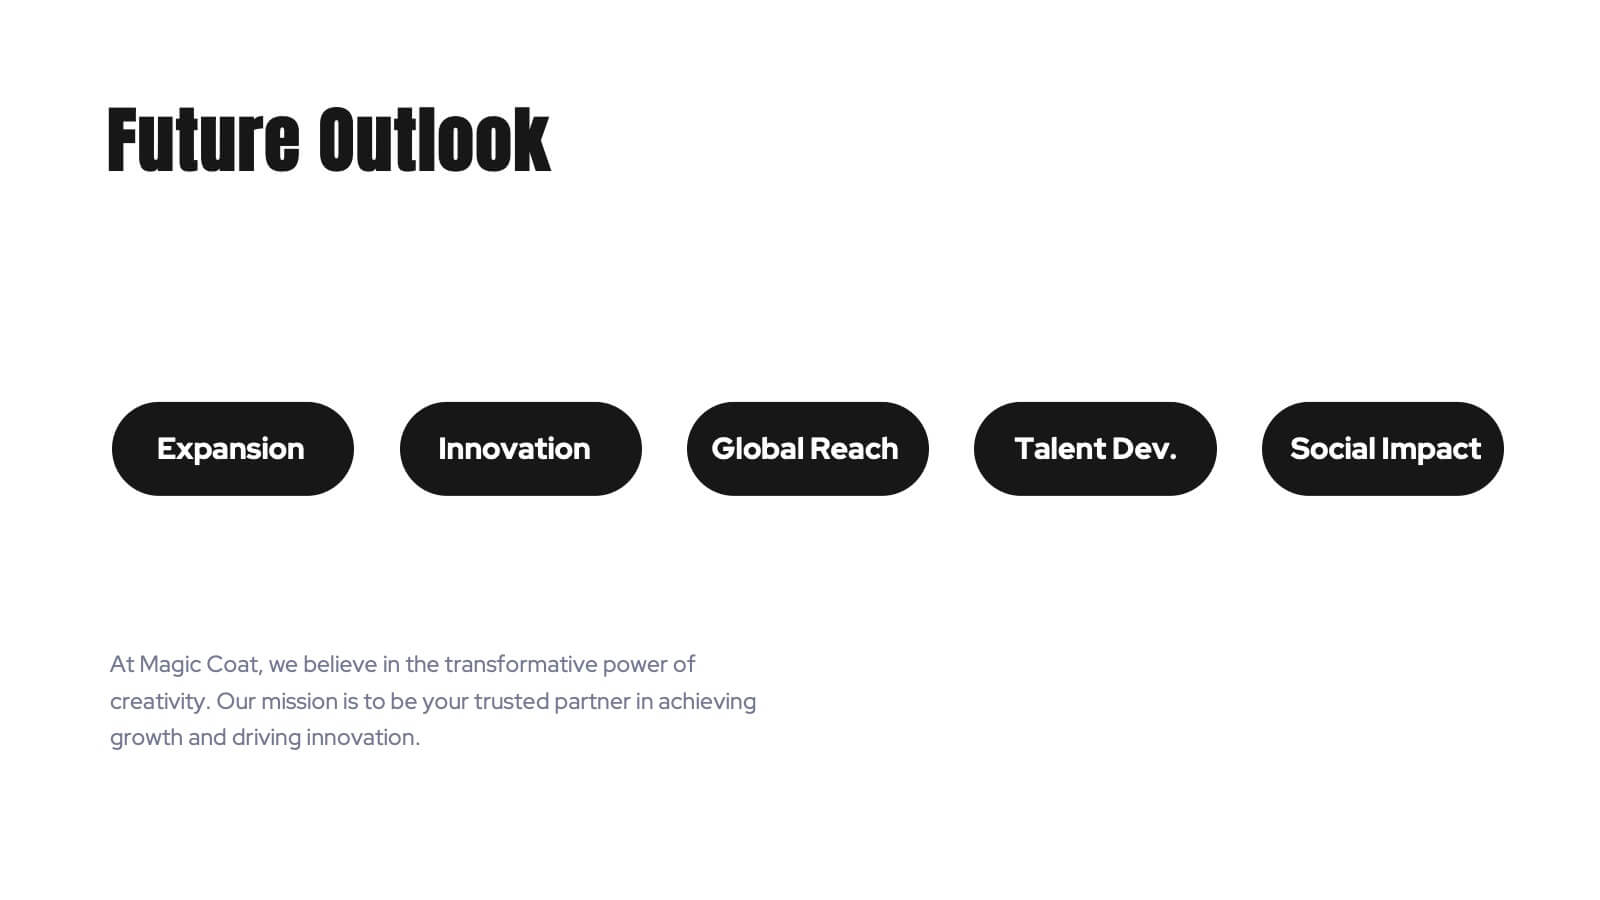
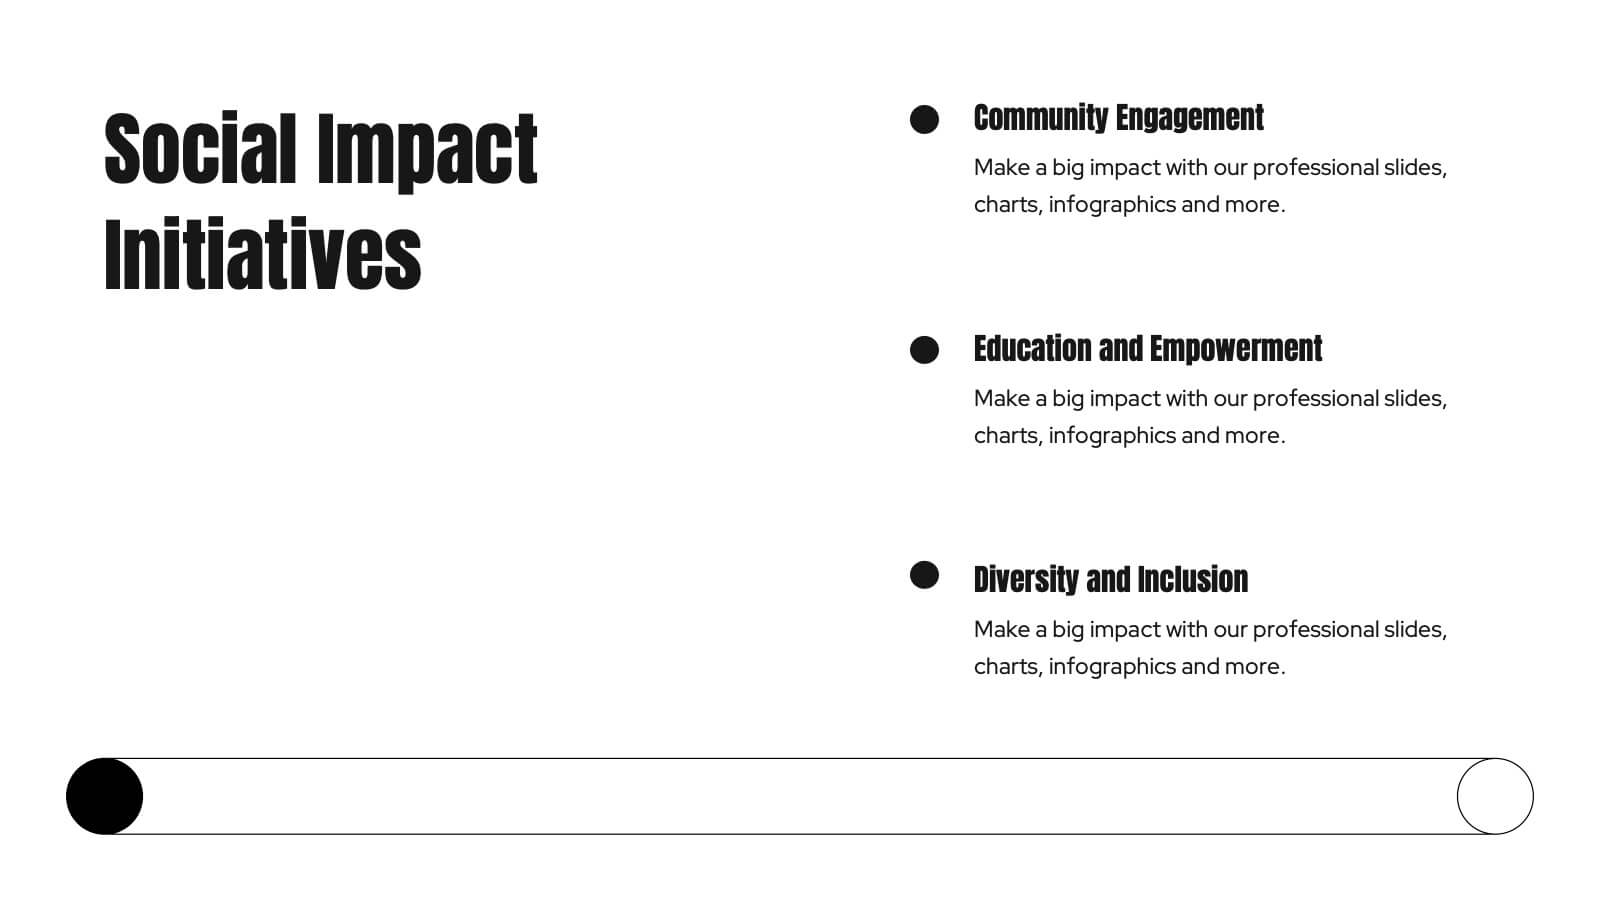
Kraken Agency Portfolio Presentation
This agency portfolio template showcases your agency's work and expertise with a sleek, modern design. It features slides for client success stories, case studies, services, market analysis, and creative process. Perfect for demonstrating your team’s skills and approach. Compatible with PowerPoint, Keynote, and Google Slides for easy customization and presentation.


6 diapositivas
McKinsey 7S Advantage Infographic
The McKinsey 7S model is a strategic management framework developed by consulting firm McKinsey & Company in the 1980s. This infographic template helps explain and understand the McKinsey 7S framework, a widely used management model for organizational effectiveness. This template provides an informative overview of the seven key elements of the framework, their interrelationships, and their impact on organizational performance. This template is designed for professionals, consultants, or anyone interested in understanding and applying the McKinsey 7S framework. Fully customizable and compatible with Powerpoint, Keynote, and Google Slides.


7 diapositivas
Pillar Distribution Infographic
Discover a striking visual representation of data with the pillar distribution Infographic. Bathed in shades of blue, white, and green, this template masterfully showcases the core foundations of any topic in a 'pillar' format. Specifically tailored for business analysts, educators, and marketers, the infographic aids in simplifying dense information. With its crisp graphics, bespoke icons, and dedicated image placeholders, conveying your insights becomes an engaging narrative experience. Its versatility ensures smooth integration with PowerPoint, Keynote, and Google Slides, transforming any presentation into a captivating visual story.


5 diapositivas
Cloud Computing Services Overview Presentation
Simplify cloud service explanations with this Cloud Computing Services Overview template. Perfect for IT professionals, business leaders, and tech strategists, this slide visually breaks down key cloud services and infrastructure using an intuitive, easy-to-understand layout. Featuring color-coded icons and modern design, this template helps showcase essential cloud computing components effectively. Fully compatible with PowerPoint, Keynote, and Google Slides for seamless integration into your presentations.


7 diapositivas
Hierarchy Needs Infographic
The Hierarchy of Needs, is a framework that categorizes human needs into five levels, often depicted as a pyramid. This visually engaging infographic template lays out the psychological journey each individual undertakes, climbing the pyramid of needs towards a successful life. Compatible with Powerpoint, Keynote, and Google Slides. Utilize visual elements to guide your audience in understanding their unique journey through the hierarchy, highlighting the importance of each stage. This template will guide you through the layers of hierarchy within organizations, providing an understanding of leadership and organizational structure.


7 diapositivas
International Finance Infographic
International finance is a branch of economics and financial studies that deals with monetary interactions that occur between two or more countries. Dive into the intricate world of finance with our visually captivating international finance infographic. This template is your passport to understanding the complexities and opportunities in the global financial landscape. With this template you will be able to analyze the dynamics of exchange rates, foreign investment, and how these factors influence global economics. This infographic is crafted to provide a holistic view of the world of finance.


12 diapositivas
5-Step Growth Strategy Presentation
Map out your success with this 5-step growth strategy template. Designed for business professionals, this layout simplifies complex strategies into clear, actionable steps, guiding teams through each stage of expansion. Ideal for strategic planning, goal setting, and performance tracking. Fully customizable and compatible with PowerPoint, Keynote, and Google Slides.