


Características


¿Tienes alguna pregunta?
Recomendar


4 diapositivas
EU Business Coverage Map Presentation
Highlight your European business presence with the EU Business Coverage Map Presentation. This slide layout uses pinpoint markers and color-coded regions to showcase operations, regional offices, or market coverage across Europe. Ideal for quarterly reports, sales updates, or investor briefings. Fully editable in PowerPoint, Keynote, Google Slides, and Canva.


21 diapositivas
Frostwind Financial Report Presentation
Deliver a comprehensive financial report with the Frostwind Financial Report Presentation. This sleek and modern template is designed to captivate your audience while showcasing essential business metrics and insights. With dedicated sections for key highlights, financial summaries, performance metrics, and operational updates, this presentation ensures clarity and professionalism. Dive deeper into customer feedback, market trends analysis, and competitive insights to provide a well-rounded view of your organization's performance. Showcase strategic initiatives, goals review, and next week's priorities with visually engaging charts and graphics. The inclusion of a Q&A and recommendations for improvement slide allows for seamless interaction with your audience. Perfect for corporate meetings, annual reviews, and financial updates, this template is fully customizable to suit your branding. Compatible with PowerPoint, Google Slides, and Keynote, it offers versatility and ease of use, ensuring you leave a lasting impression. Take your financial reporting to the next level!


26 diapositivas
Maev Presentation Template
Maev is a perfect modern template with a clean and professional feel. Maev was designed by professionals to help businesses connect with their audience. This template has a modern, chic aesthetic and very detailed look which is extremely appealing. The colors are fresh which help keep the look clean and easy to read. The theme comes packed with features to target your audience and help you get your message across. Charts, timelines and easy to edit text, this template is perfect for businesses seeking to make an impression on their audience. by demonstrating they are transparent and reliable.


6 diapositivas
Formal Numbers Infographics
Enter the world of formal numbers, a vital concept in mathematics and science! This infographic acts as your gateway to comprehending the structure and significance of formal numbers. From the fundamental properties of natural numbers to the intricate details of real and complex numbers, we unveil the secrets that underpin these mathematical entities. Discover the mathematical significance of formal numbers across various fields, from algebra to calculus and beyond. Explore how these numbers are used in practical applications, including engineering, physics, and computer science. Gain an appreciation for the elegance and versatility of formal numbers in solving real-world problems. With this informative infographic, compatible with PowerPoint, Keynote, and Google Slides, sharing your understanding of formal numbers becomes seamless. Empower yourself with the knowledge to navigate the intricate world of mathematics. Dive into the realm of formal numbers and embark on a journey of mathematical exploration and enlightenment.


5 diapositivas
Innovative Concept Pitch Presentation
Present your big ideas with impact using this lightbulb puzzle infographic. Perfect for concept development, product ideation, or startup pitches. The layered segments help structure your content clearly. Fully customizable in PowerPoint, Keynote, and Google Slides—ideal for innovation roadmaps, creative planning, or visualizing business concepts.


4 diapositivas
Leadership Training Framework Presentation
Inspire growth and guide your team toward success with this clear and modern presentation layout. Designed to illustrate leadership principles, development stages, and coaching strategies, it helps communicate training goals with professionalism and ease. Fully customizable and compatible with PowerPoint, Keynote, and Google Slides for seamless use across platforms.


6 diapositivas
Conversion Funnel Infographic Presentation
Optimize your marketing strategy with this Conversion Funnel Infographic template. Clearly illustrate lead generation, customer retention, and sales processes in a structured format. Fully editable to match your branding—customize colors, icons, and text effortlessly. Compatible with PowerPoint, Keynote, and Google Slides for a smooth presentation experience.


7 diapositivas
Product Life Cycle Management Infographic
The Product Life Cycle is a widely recognized marketing and business model that describes the typical stages a product goes through from its introduction to the market to its decline. This infographic template is an illustrative journey through the stages of product evolution. This visually appealing infographic is your guide to understanding the life cycle of a product and the strategic management required at each phase. Compatible with Powerpoint, Keynote, and Google Slides. This template explores the phases of product life, understand the strategies needed at each stage, and navigating the landscape of product management.


4 diapositivas
Corporate Strategy Business Case Presentation
Develop a winning corporate strategy with this structured business case template! Perfect for analyzing finances, operations, market trends, and client insights, this clean and organized layout helps businesses communicate key strategies effectively. Fully customizable and compatible with PowerPoint, Keynote, and Google Slides for seamless, professional presentations.


5 diapositivas
Educational A-Z Letter Design Presentation
Present your ideas with clarity using the Educational A-Z Letter Design Presentation. This slide uses a vertical layout with stylized book-like segments and bold A–D lettering, ideal for categorizing content or showcasing multi-part learning points. Fully editable and compatible with PowerPoint, Keynote, and Google Slides.

21 diapositivas
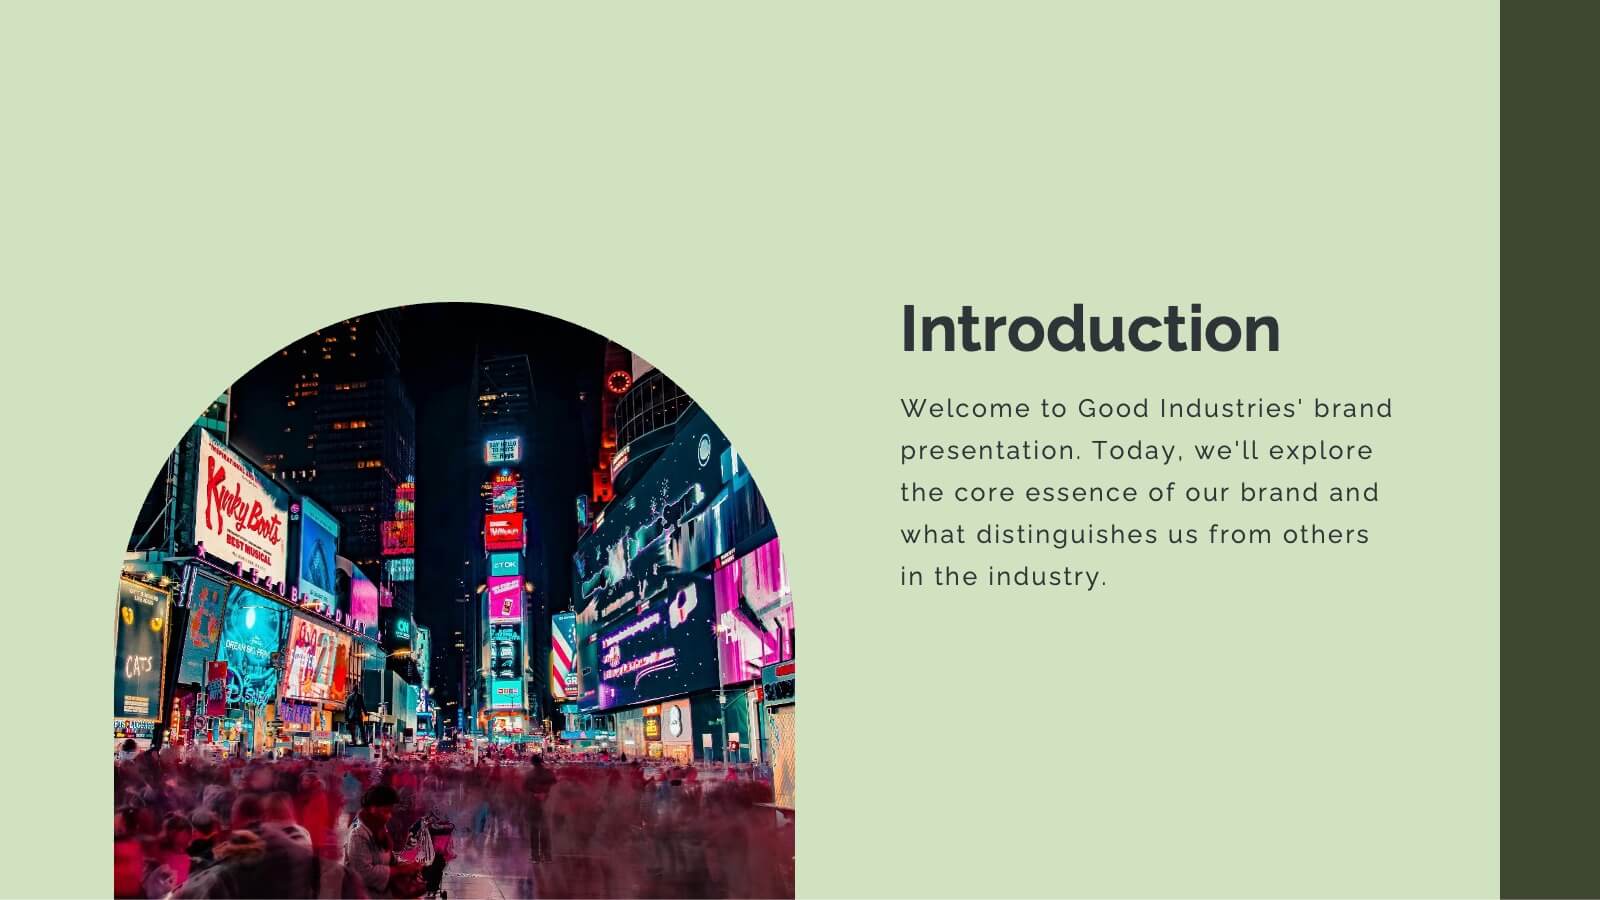
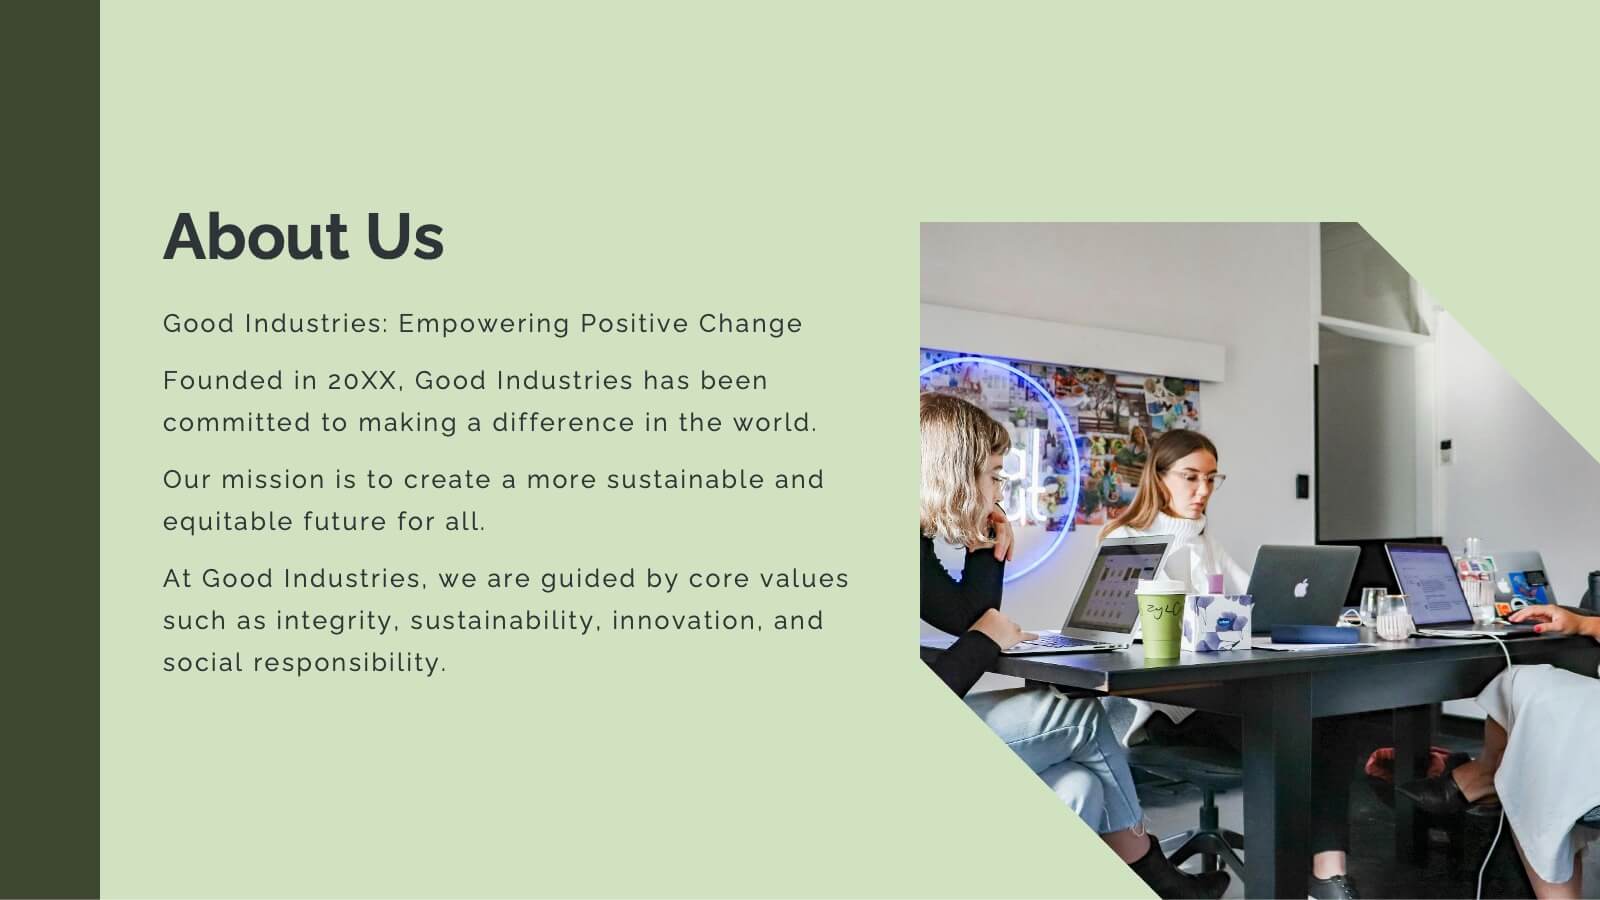
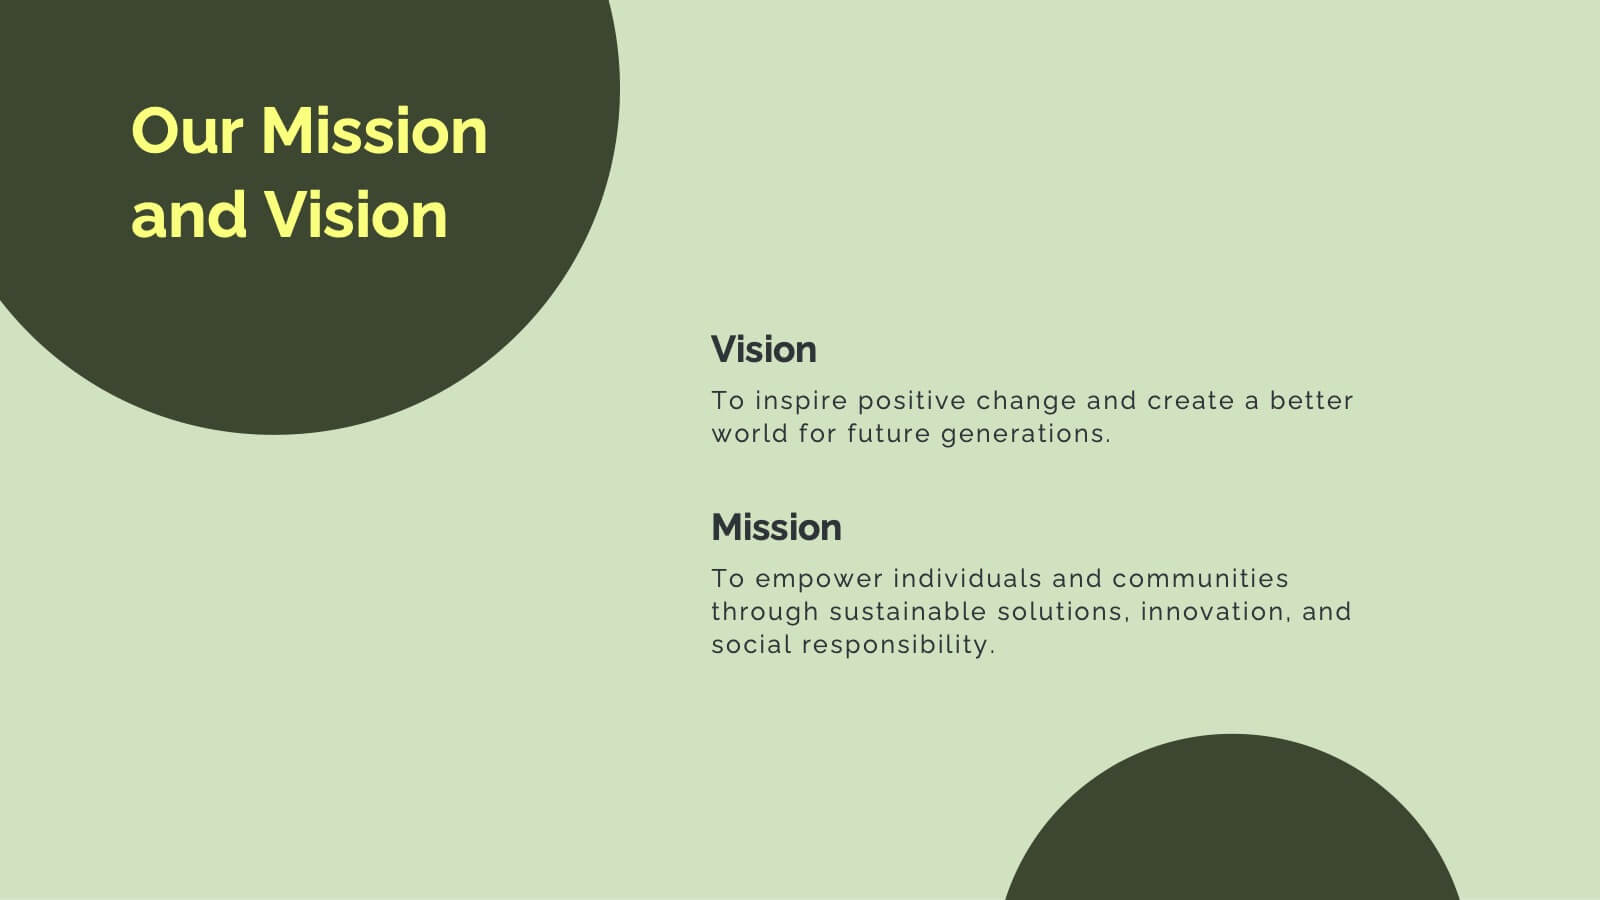
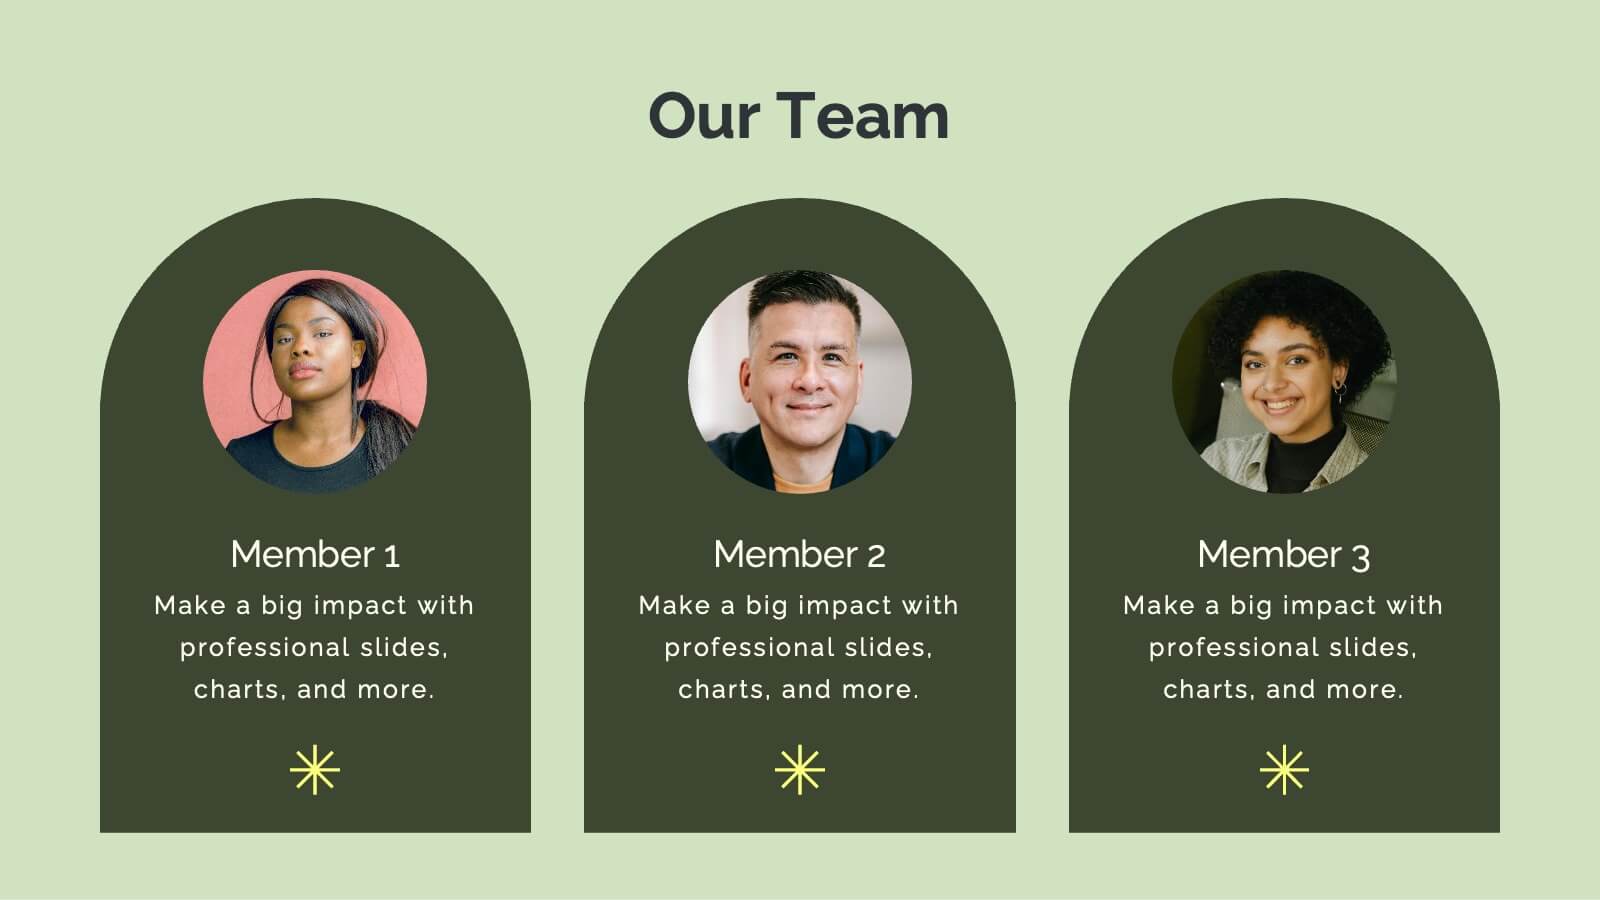
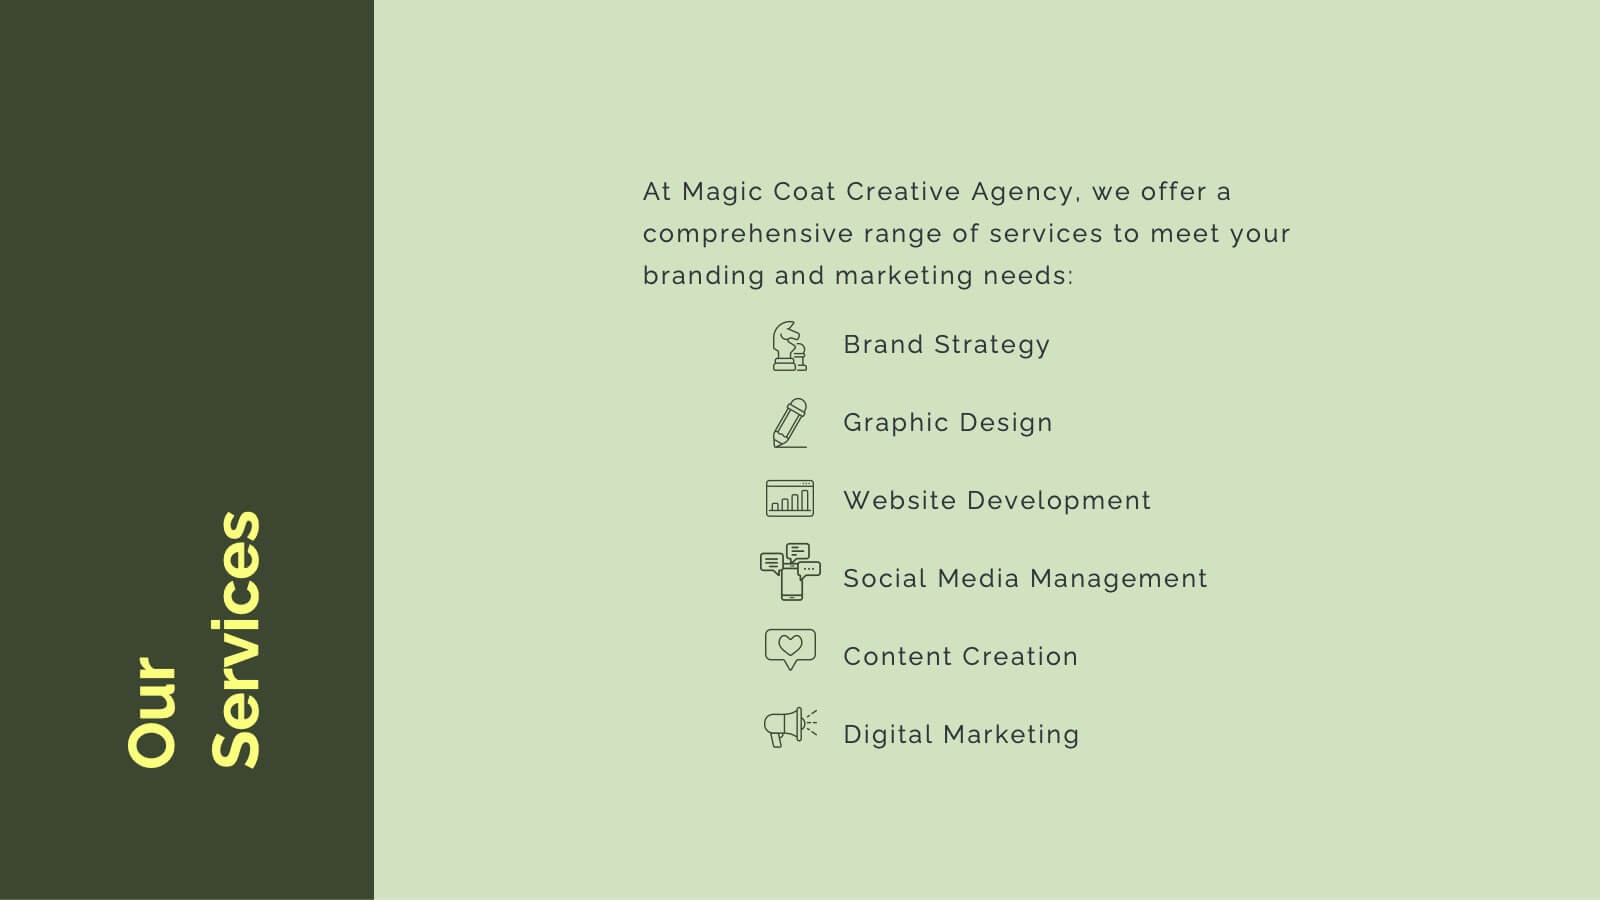
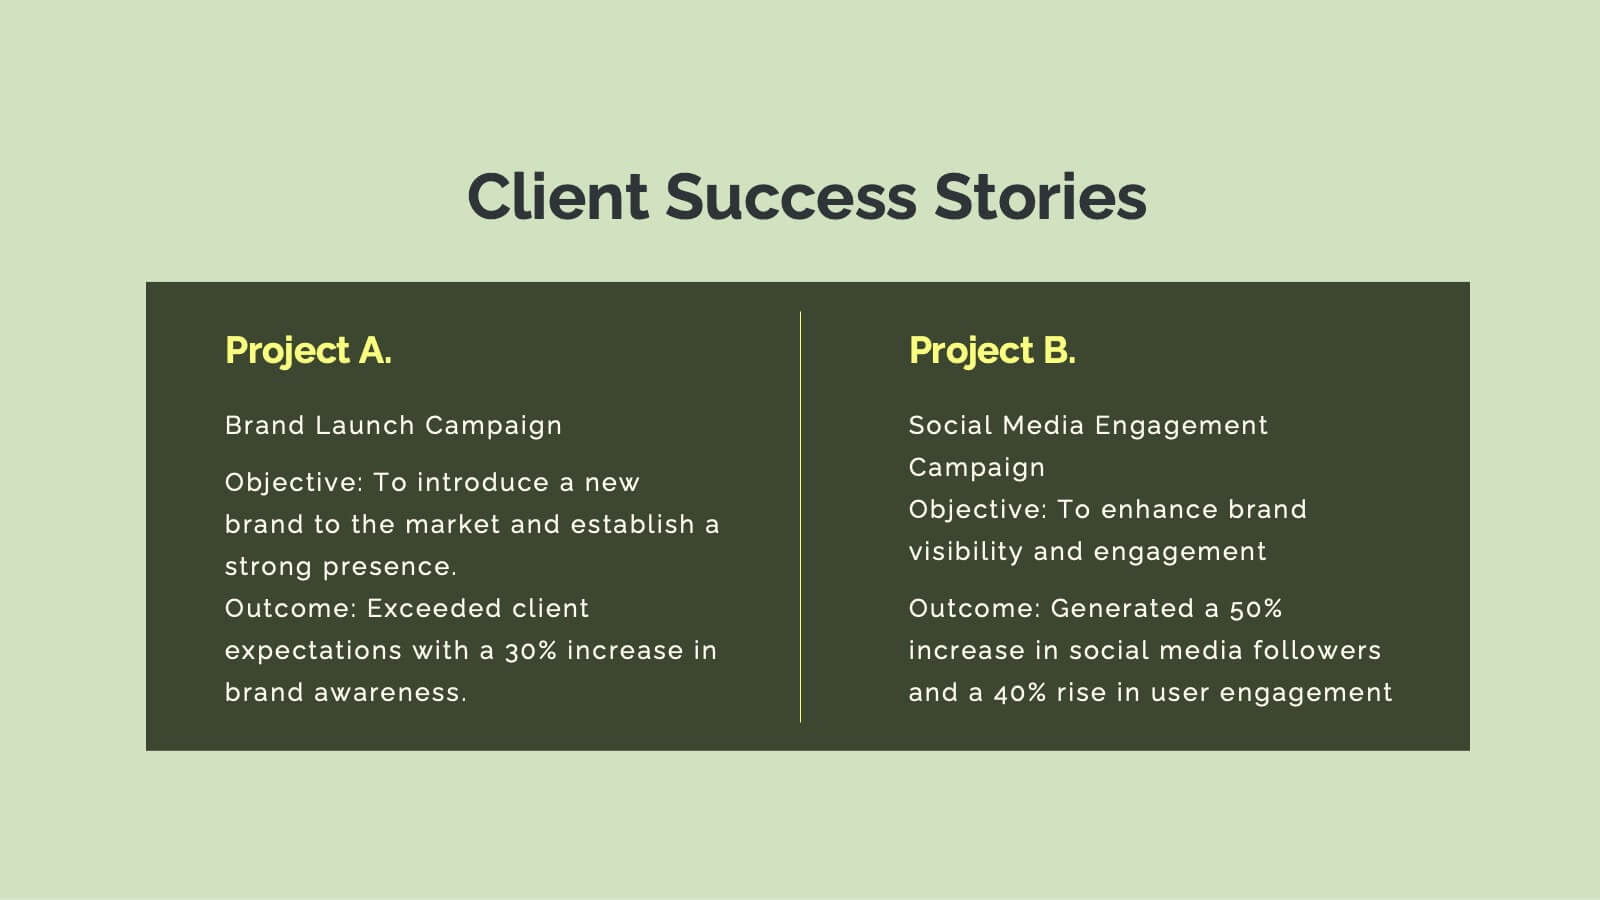
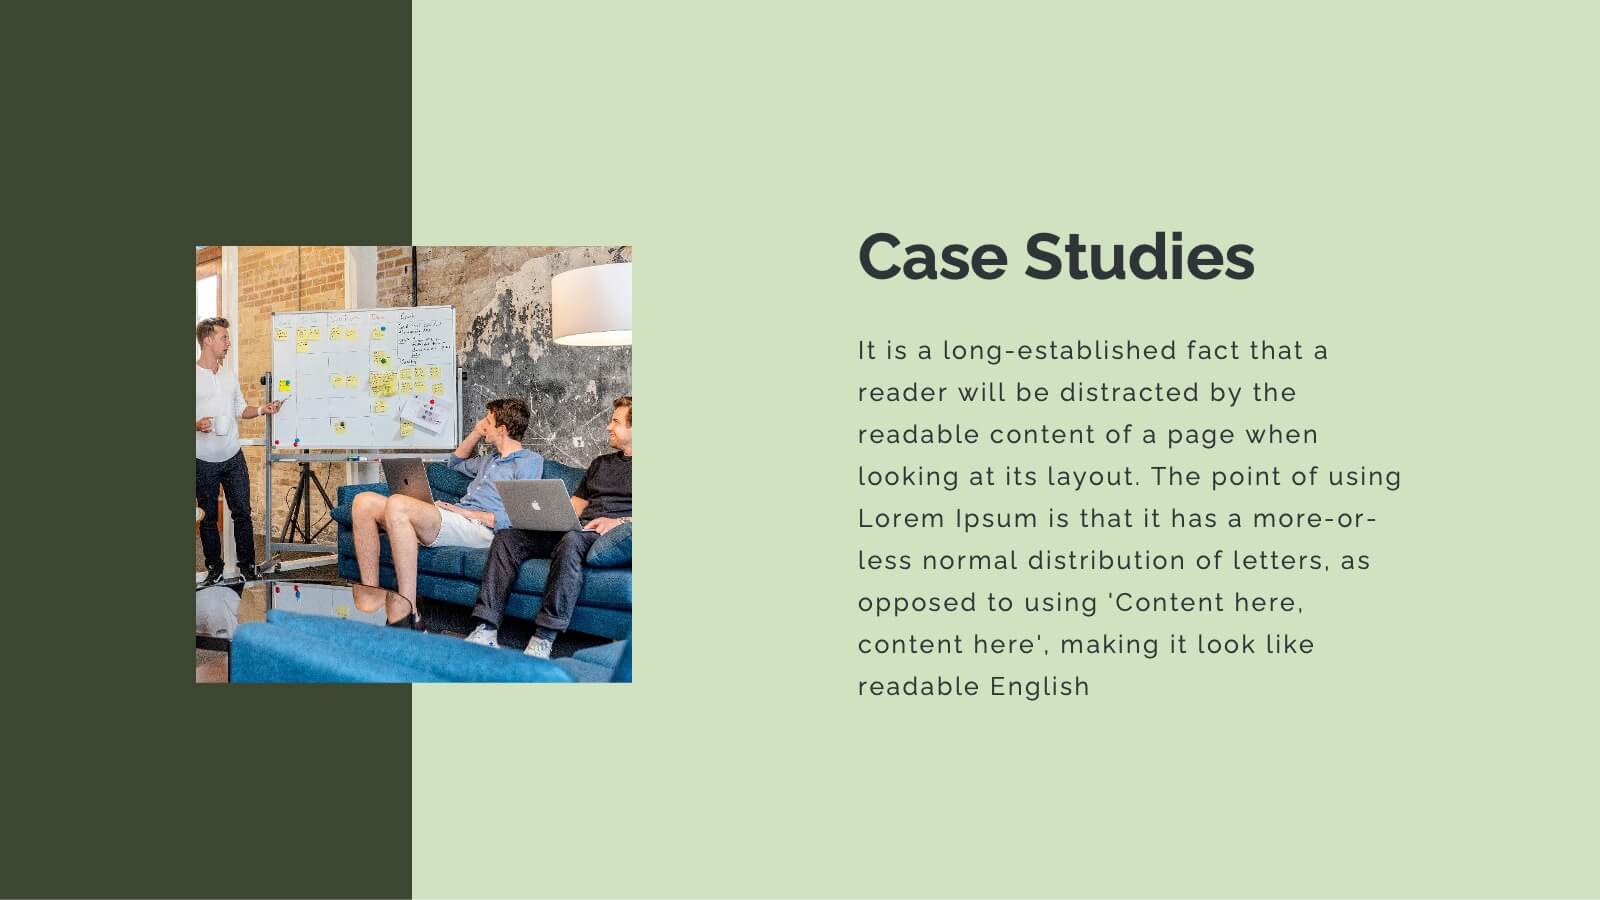
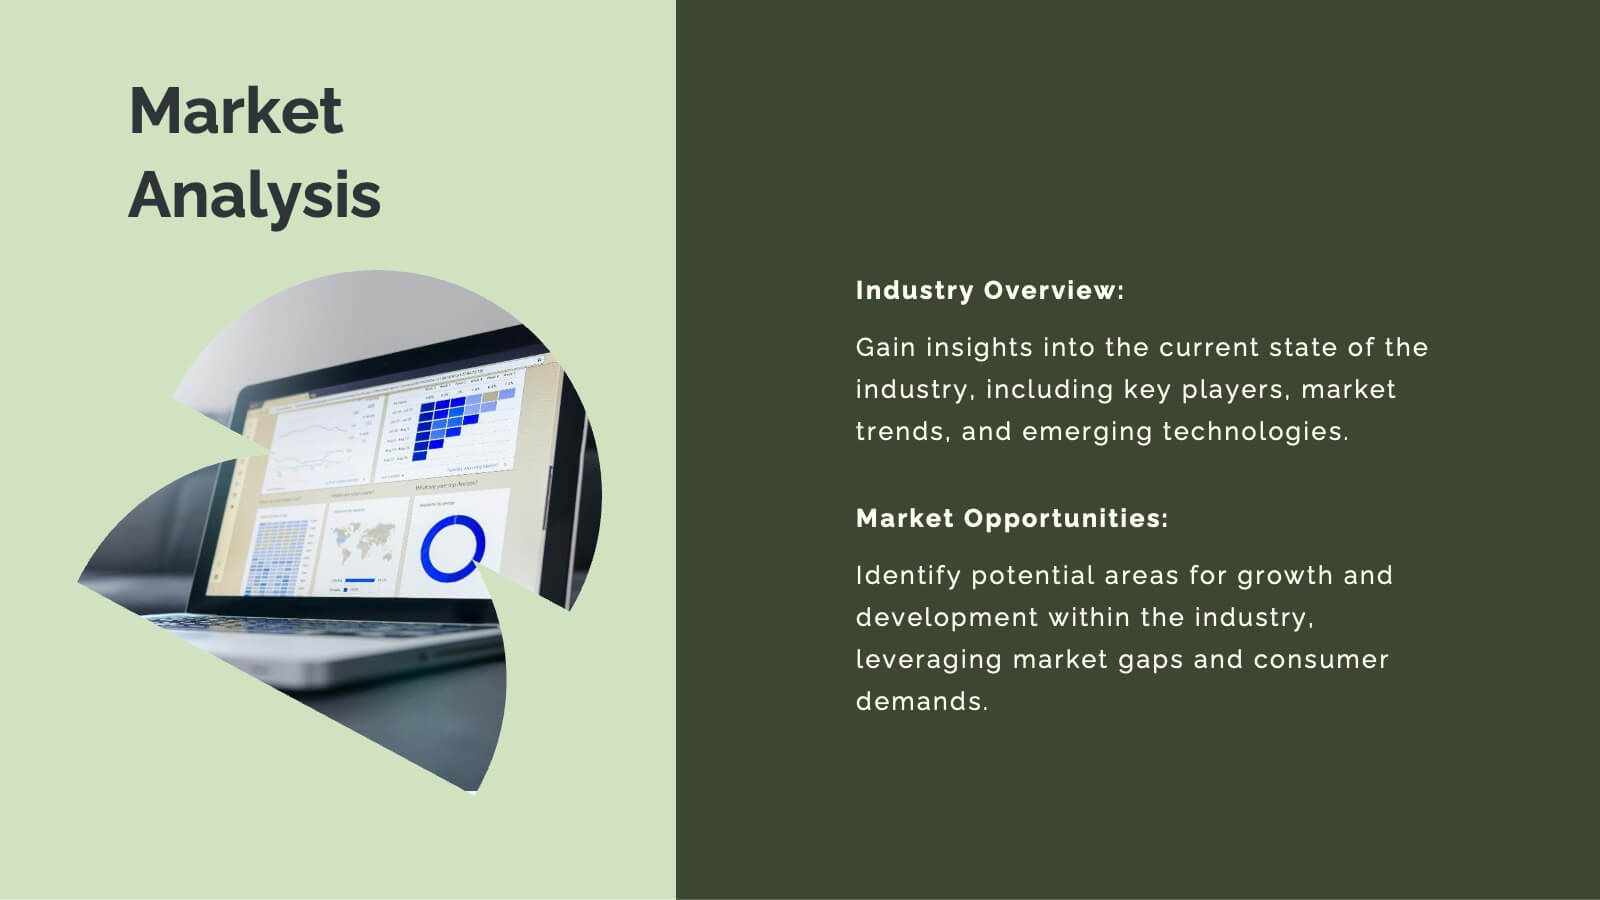
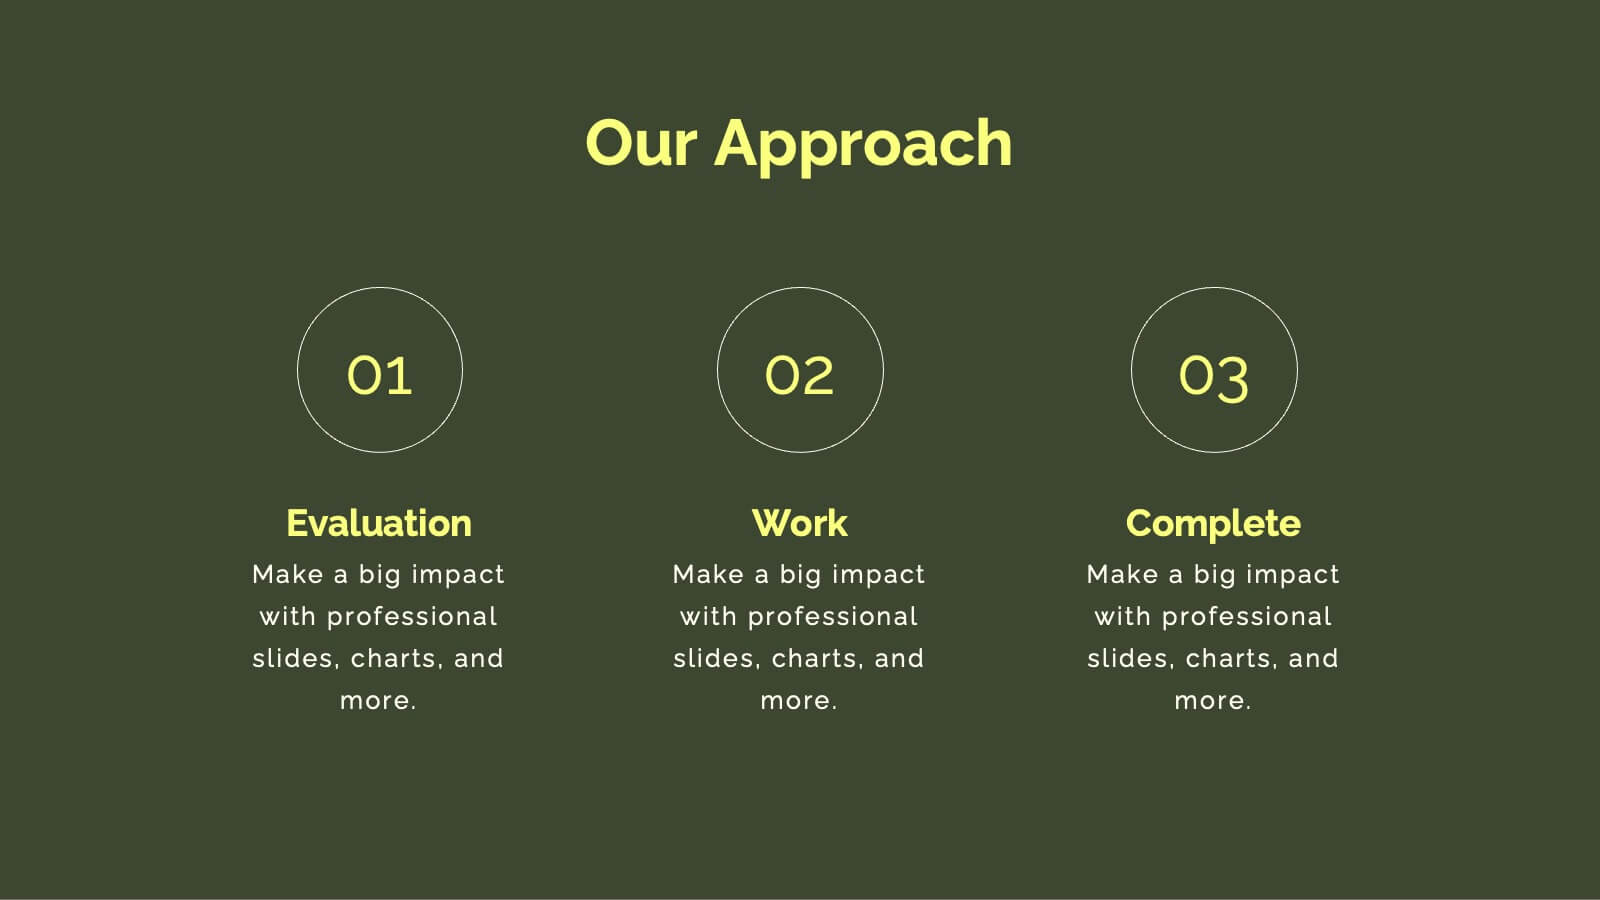
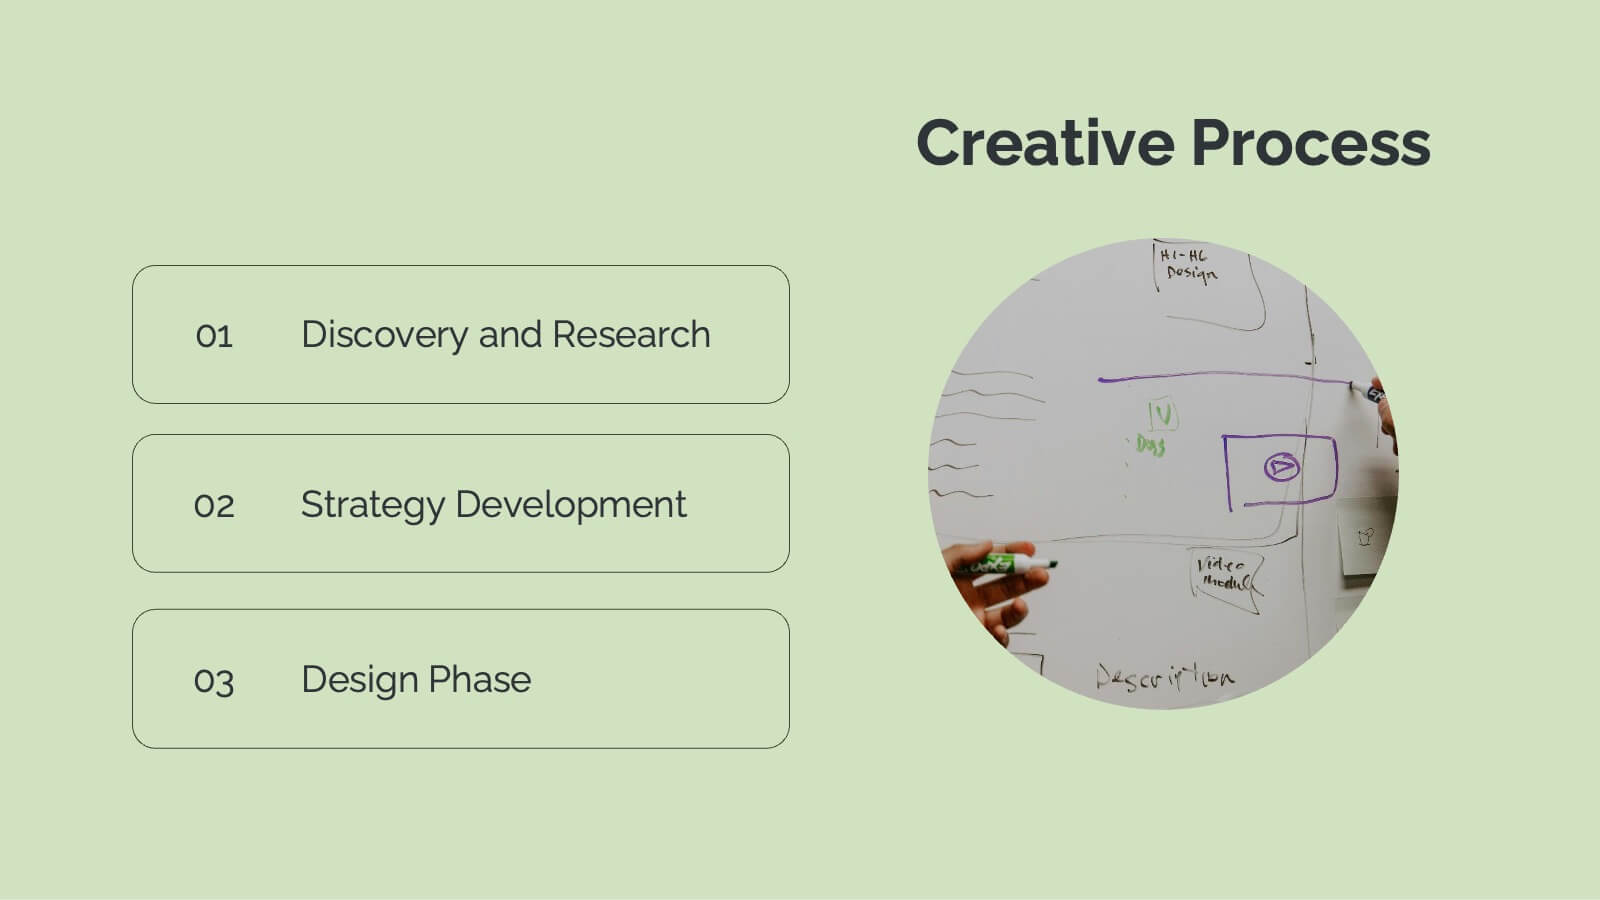
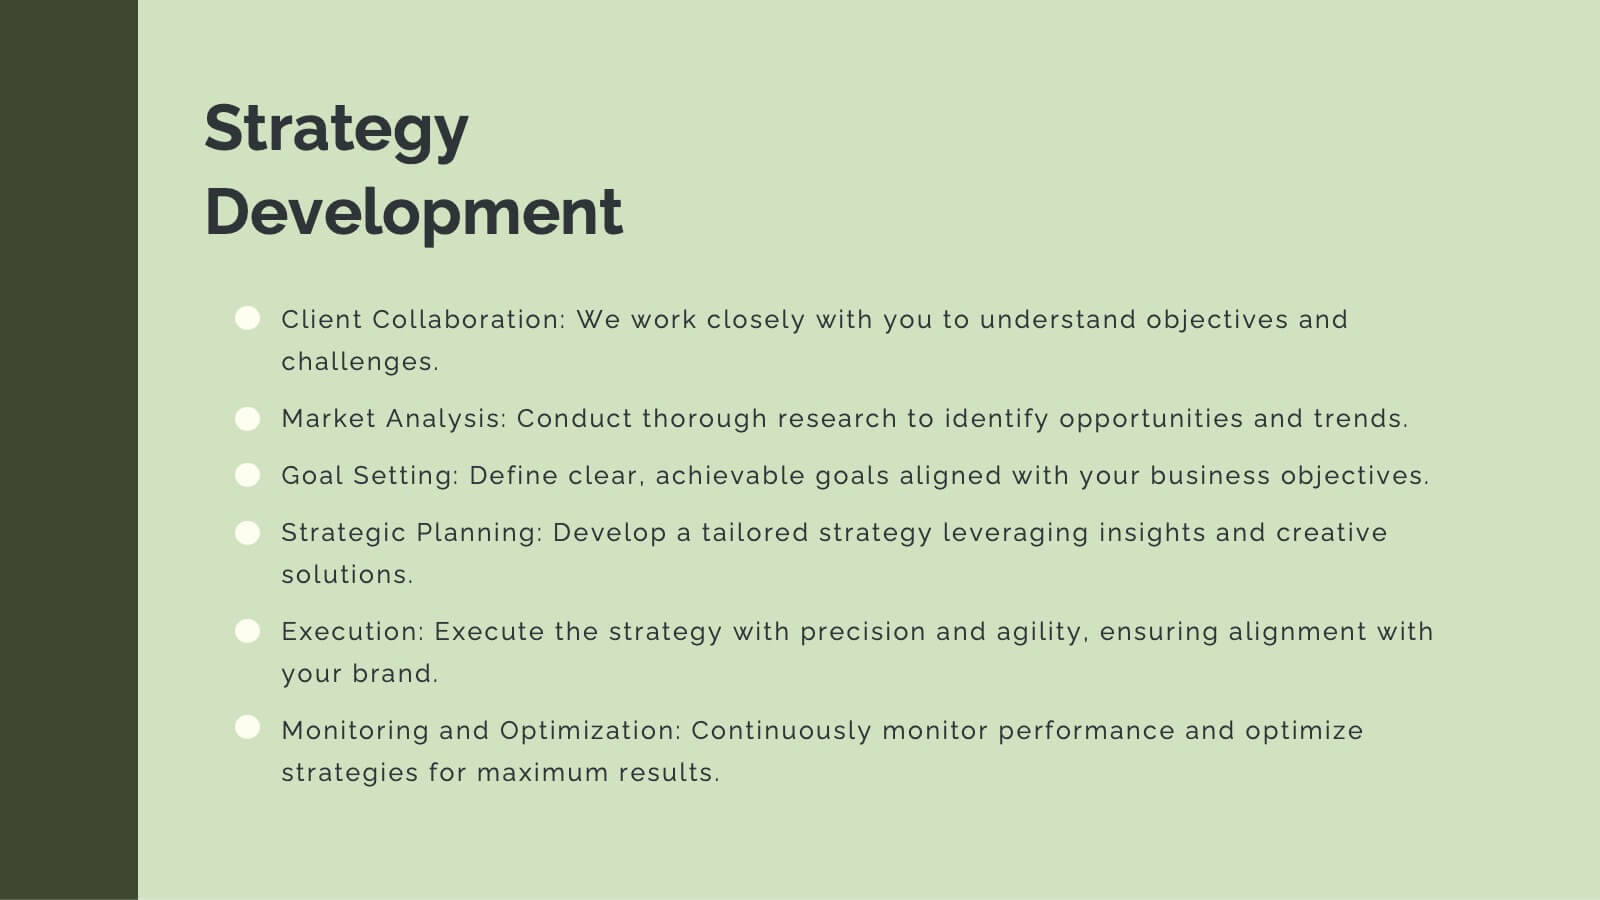
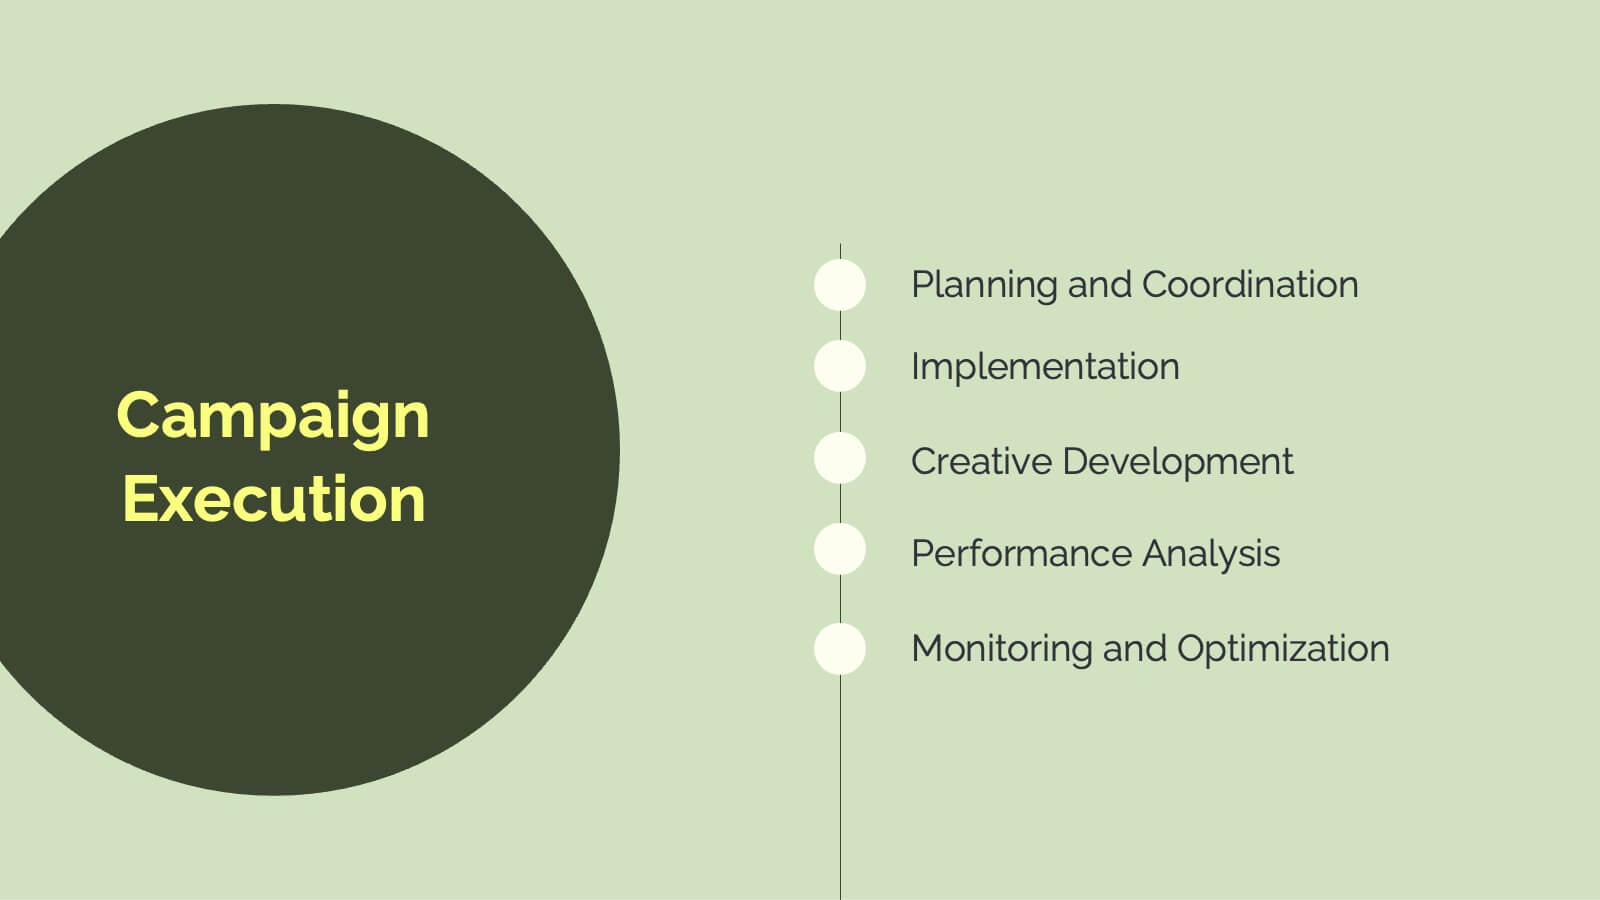
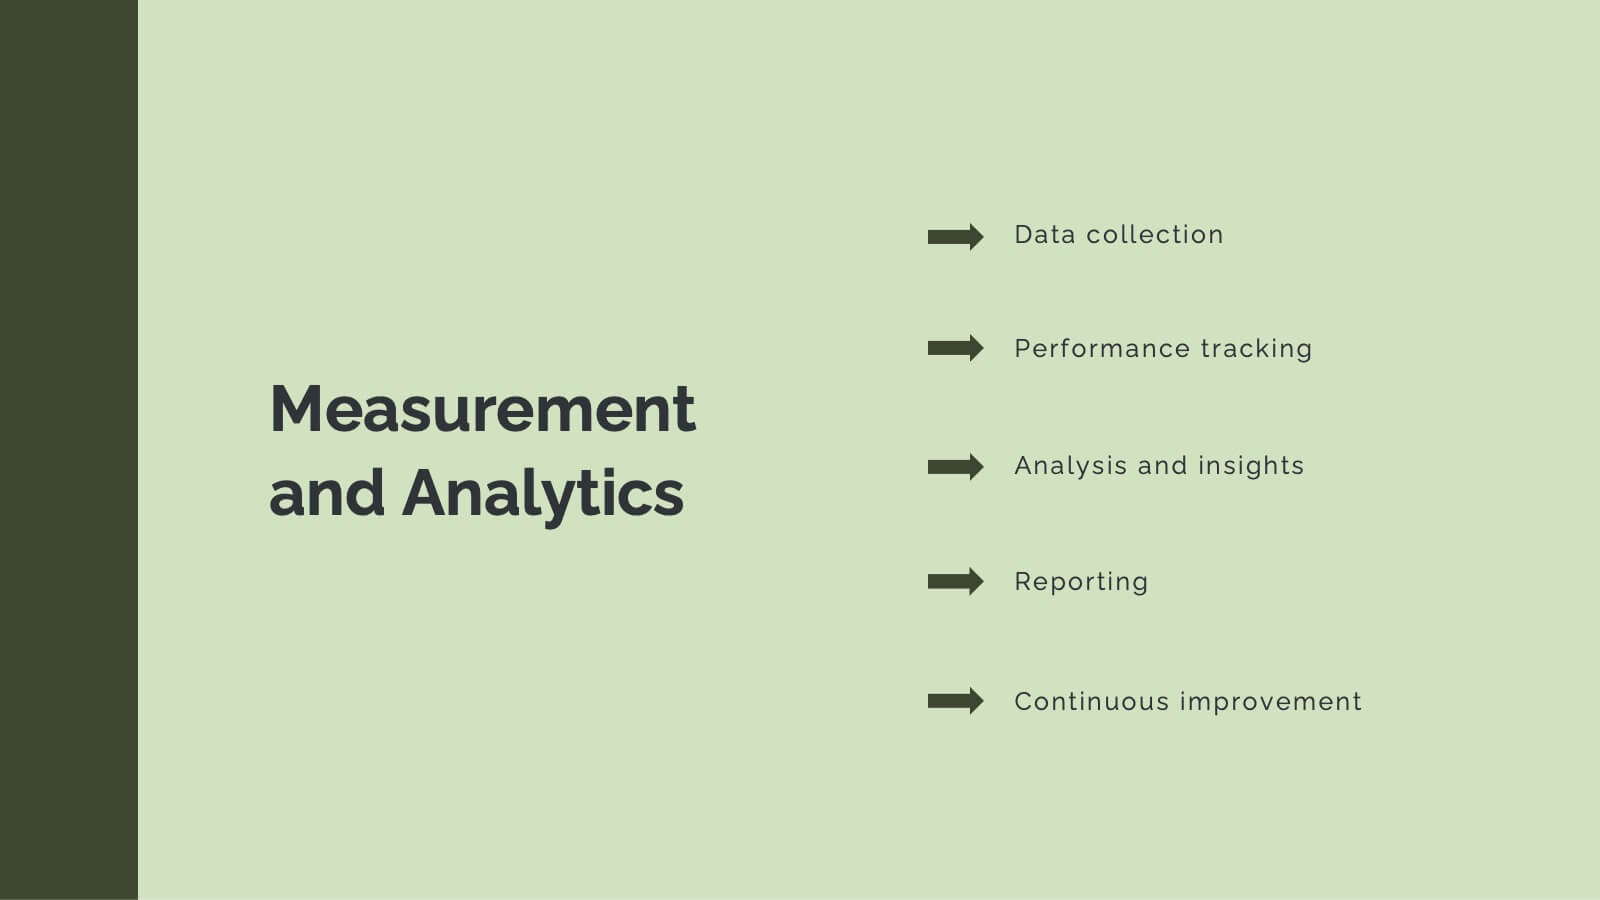
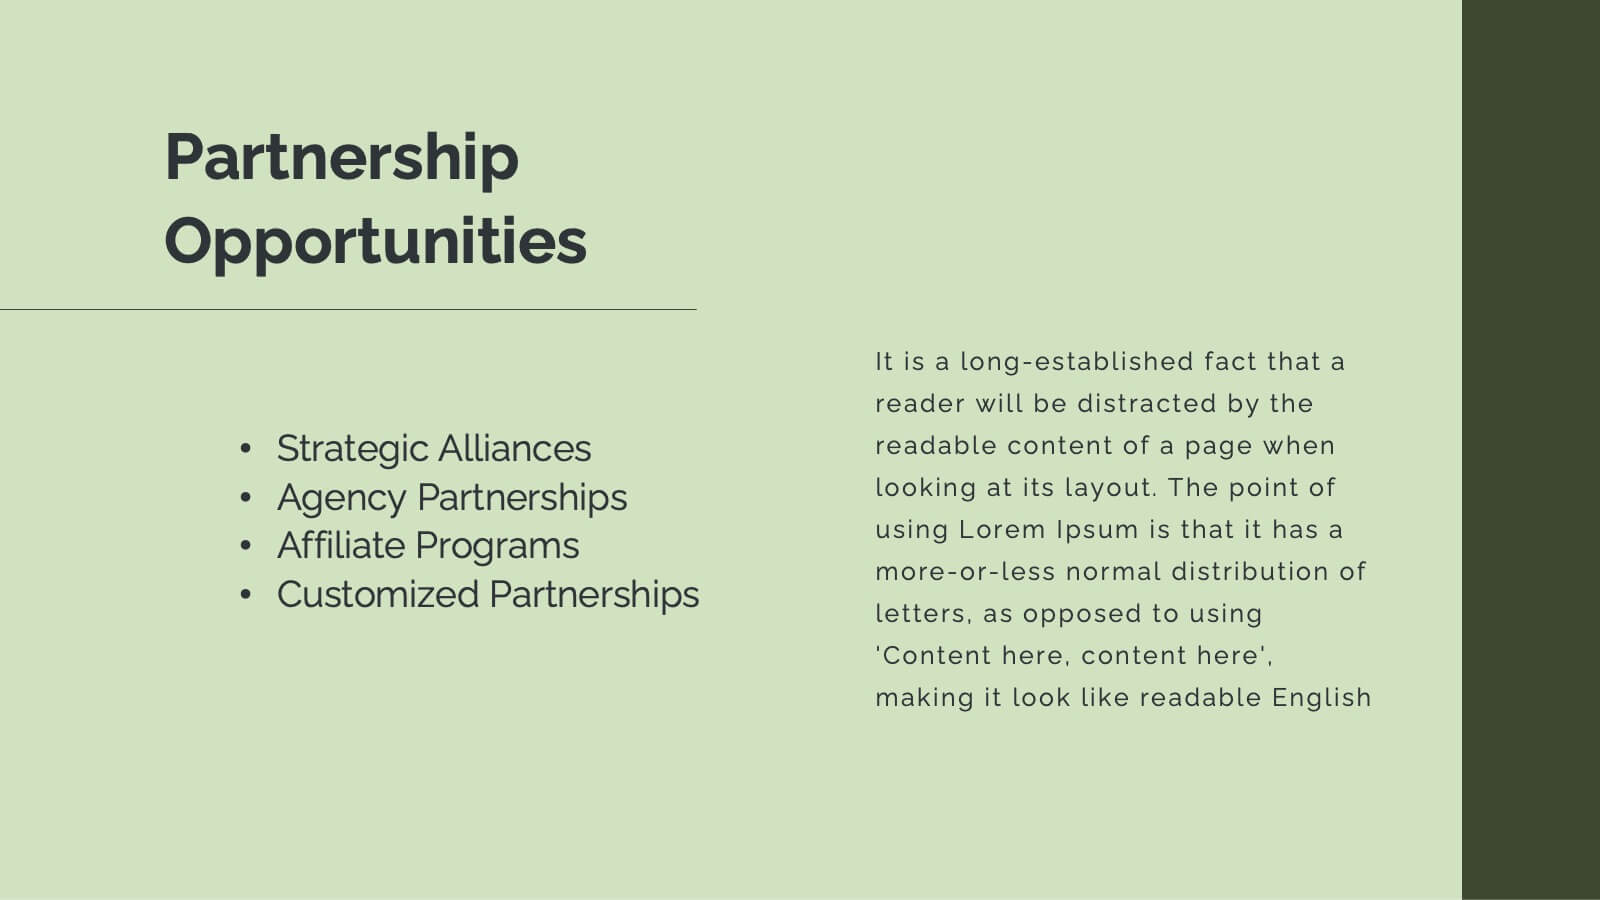
Horizon Advertising Agency Proposal Presentation
Elevate your advertising impact with this comprehensive agency proposal template. It’s meticulously designed to showcase your agency’s capabilities from strategic planning to creative execution, ensuring a persuasive presentation of services like market analysis, campaign strategies, and client success stories. Each slide is formatted to facilitate understanding and engagement, making it perfect for highlighting your team's expertise and unique approach. Compatible with major presentation platforms like PowerPoint, Google Slides, and Keynote, this template supports your efforts to secure new clients and projects seamlessly across various devices.


6 diapositivas
Ideal Customer Profile Infographic
A customer profile, also known as a buyer persona, is a detailed and semi-fictional representation of your ideal customer. This infographic template can help businesses visualize and communicate their target audience characteristics and preferences. This template is a valuable tool for educating your team and clients about your ideal customer profile. This customer profile infographic can help your team align their efforts towards effectively targeting and engaging the right audience for your products or services. Compatible with Powerpoint, Keynote, and Google Slides. Incorporate your brand's logo and color scheme to maintain consistency.


7 diapositivas
Kickoff Meeting Infographic
A meeting is a planned gathering of individuals, often from an organization or a group, who come together to discuss specific topics, share information, make decisions, or collaborate on projects. This infographic template is a visually engaging guide to launching your projects with a burst of energy and purpose. This template is your go-to tool for orchestrating that vital moment—the project kickoff—that sets the stage for success. Compatible with Powerpoint, Keynote, and Google Slides. This template is a structured way to communicate, coordinate actions, and ensure that everyone involved is aligned towards common goals.


7 diapositivas
PESTEL Chart Infographic Presentation
A PESTEL Chart is a strategic planning tool used to analyze and identify the key external factors that could affect an organization's performance and its ability to achieve its objectives. Create epic pestel charts in no time using this template. All you need to do is enter your data and the template will do the rest. Use this template as an introduction to your most important points. It is completely editable change the fonts, sizes and shapes and it can be used for any type of business or academic project. This template is available in PowerPoint, Keynote and Google Slides formats.


7 diapositivas
SCRUM Roles Infographic
Dive into the agile world with our SCRUM roles infographic. This template is designed to depict the various roles within the SCRUM framework, offering clarity and insight into the collaborative heart of agile methodologies. With a clean white canvas set against hues of blue, it provides a modern yet comprehensive overview of the roles. Ideal for agile coaches, trainers, and organizations transitioning to agile methodologies, this infographic is tailored to showcase the importance of each role. With its compatibility, spanning PowerPoint, Keynote, and Google Slides, presentations are bound to be a breeze, regardless of the platform you favor.


5 diapositivas
Agile Workflow and Role Breakdown Presentation
Visualize Agile processes with this streamlined workflow and role breakdown diagram. Perfect for Scrum teams and project leads, this layout maps out five stages using arrows, icons, and a circular feedback loop. Easily editable in PowerPoint, Keynote, and Google Slides to fit any development cycle or team structure.


2 diapositivas
Creative Business Presentation
Showcase your ideas with energy and style using this bold, contemporary presentation layout. Featuring dynamic visuals and clean typography, this template is ideal for business proposals, portfolios, and startup pitches. Easily customizable in PowerPoint, Keynote, and Google Slides to suit your brand's identity.