


Características


¿Tienes alguna pregunta?
Recomendar


23 diapositivas
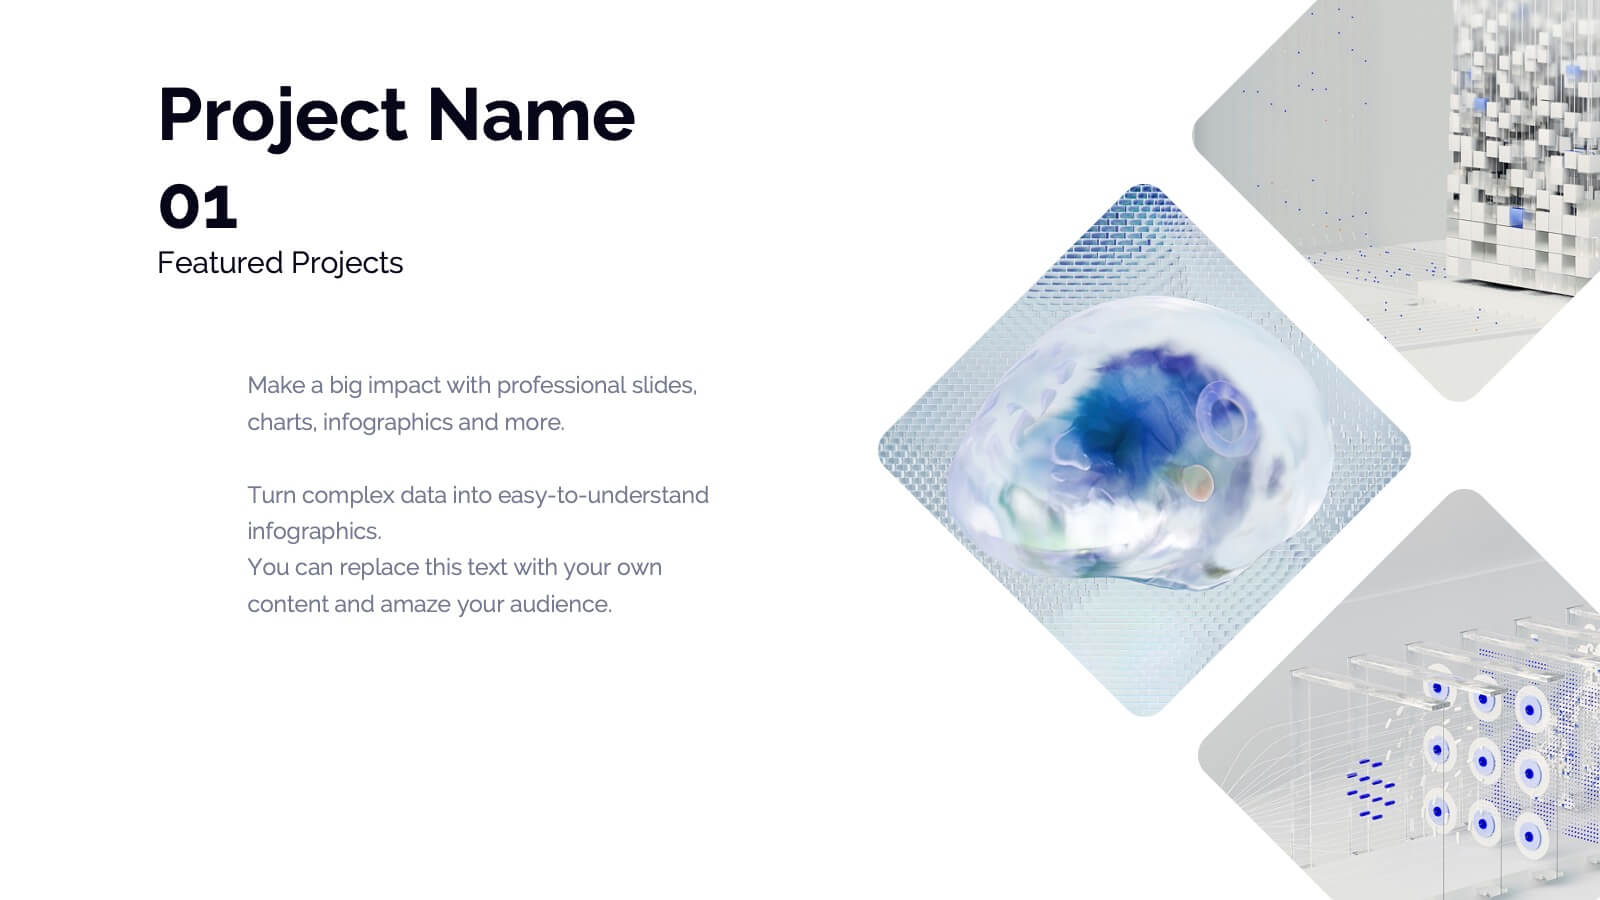
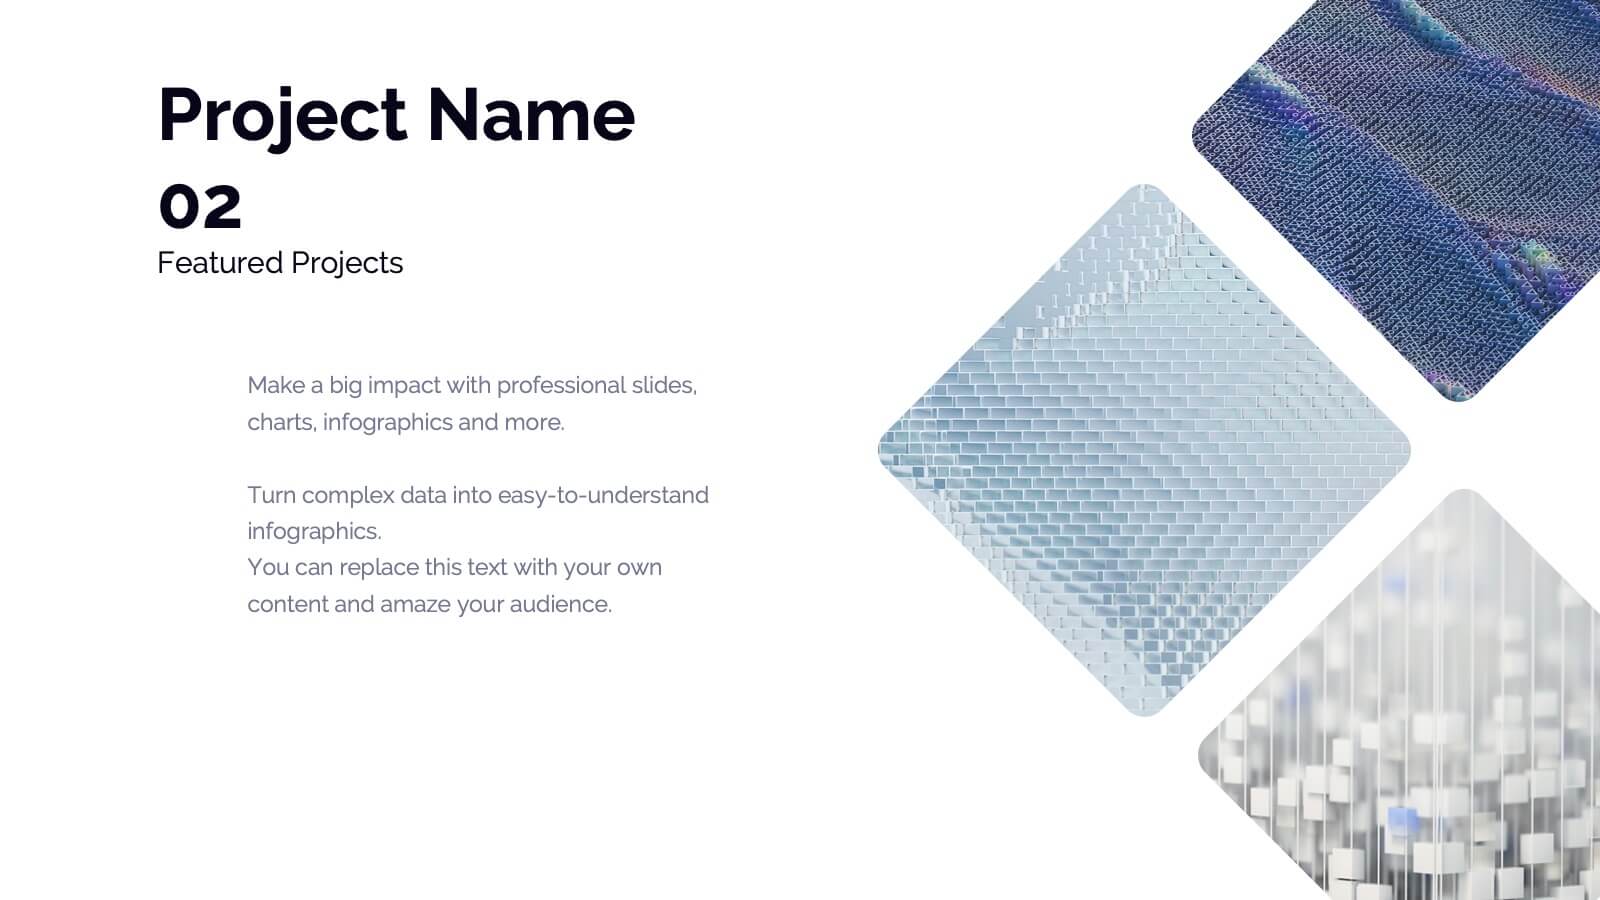
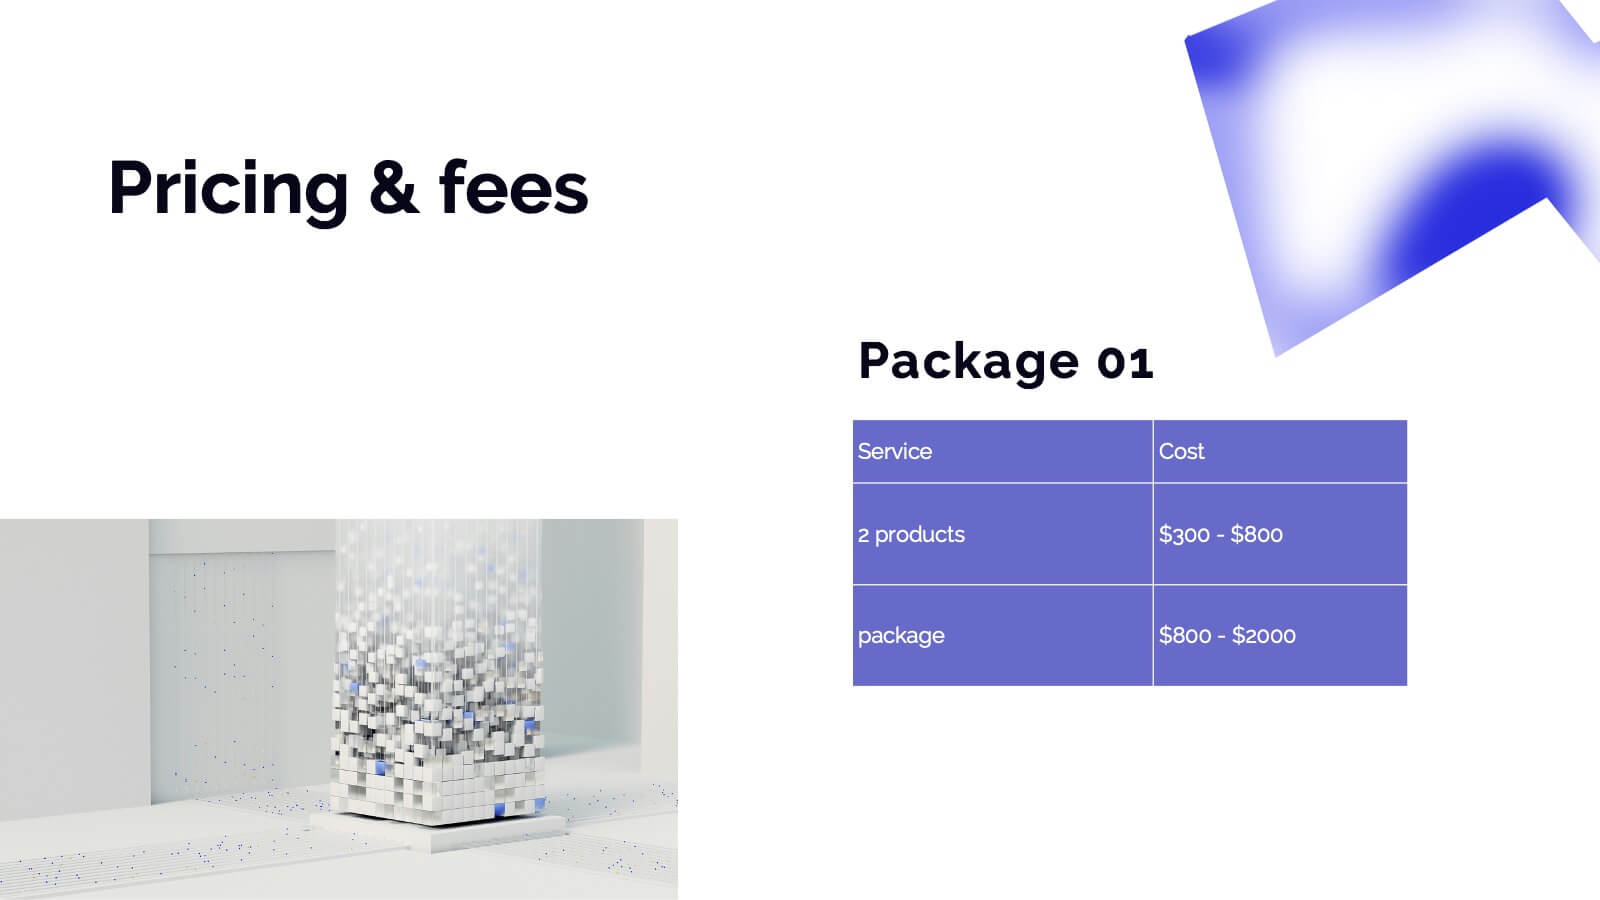
Dryad Photography Portfolio Template Presentation
Showcase your photography skills with this elegant and professional portfolio presentation template! Perfect for highlighting your projects, style, and creative process, this template covers everything from client testimonials to pricing and services offered. It’s ideal for photographers wanting to present their work with style and clarity. Compatible with PowerPoint, Keynote, and Google Slides for effortless sharing and presentations.


20 diapositivas
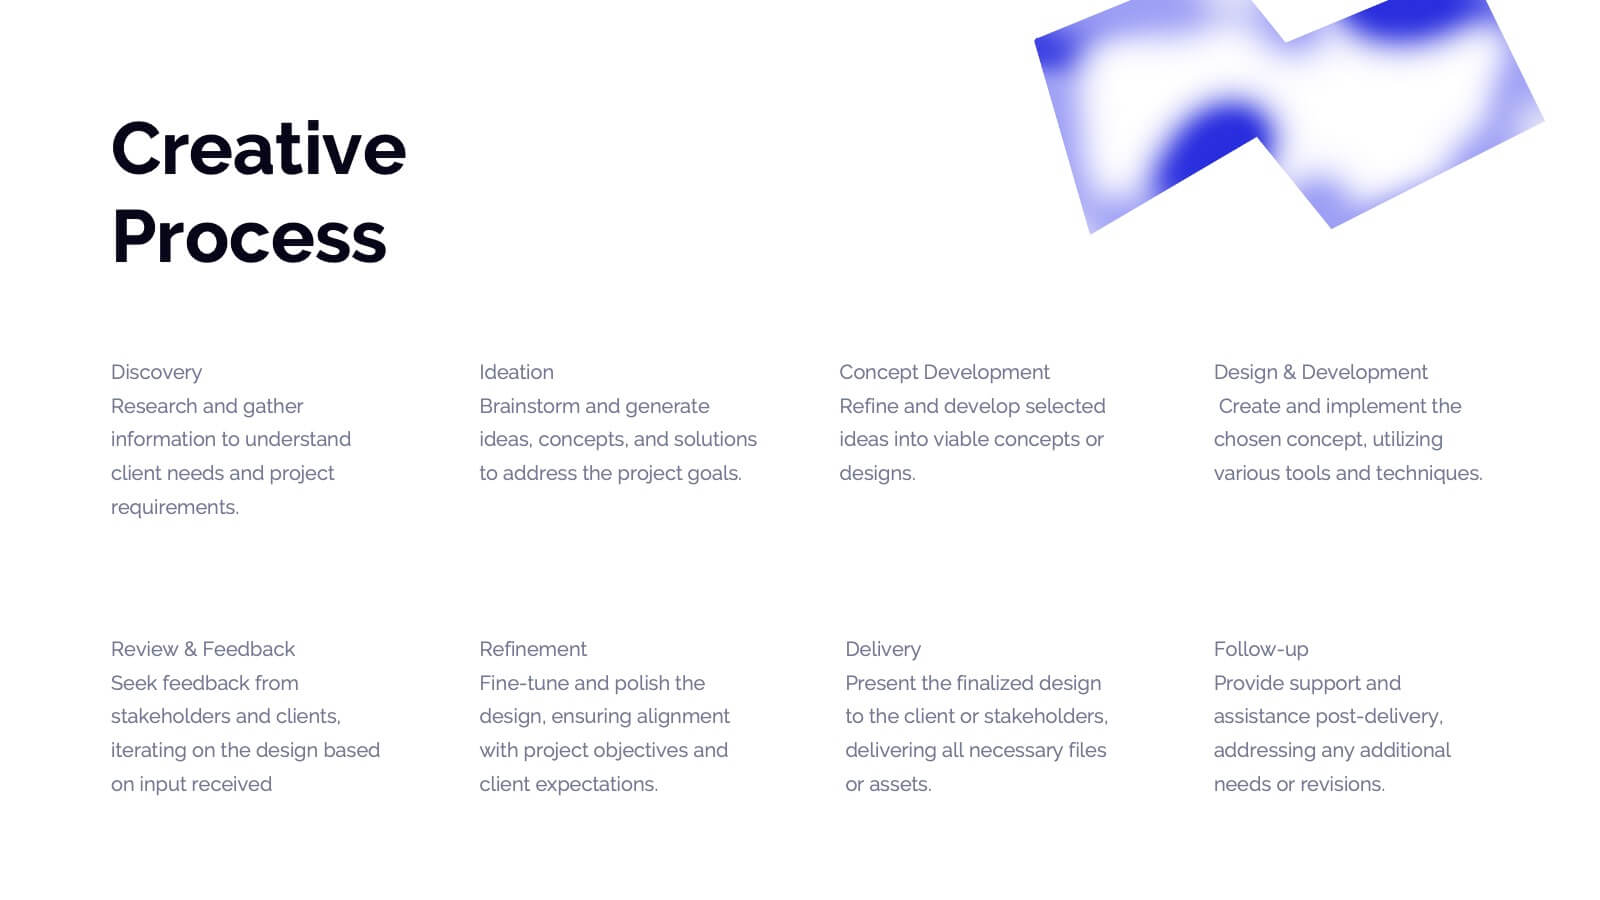
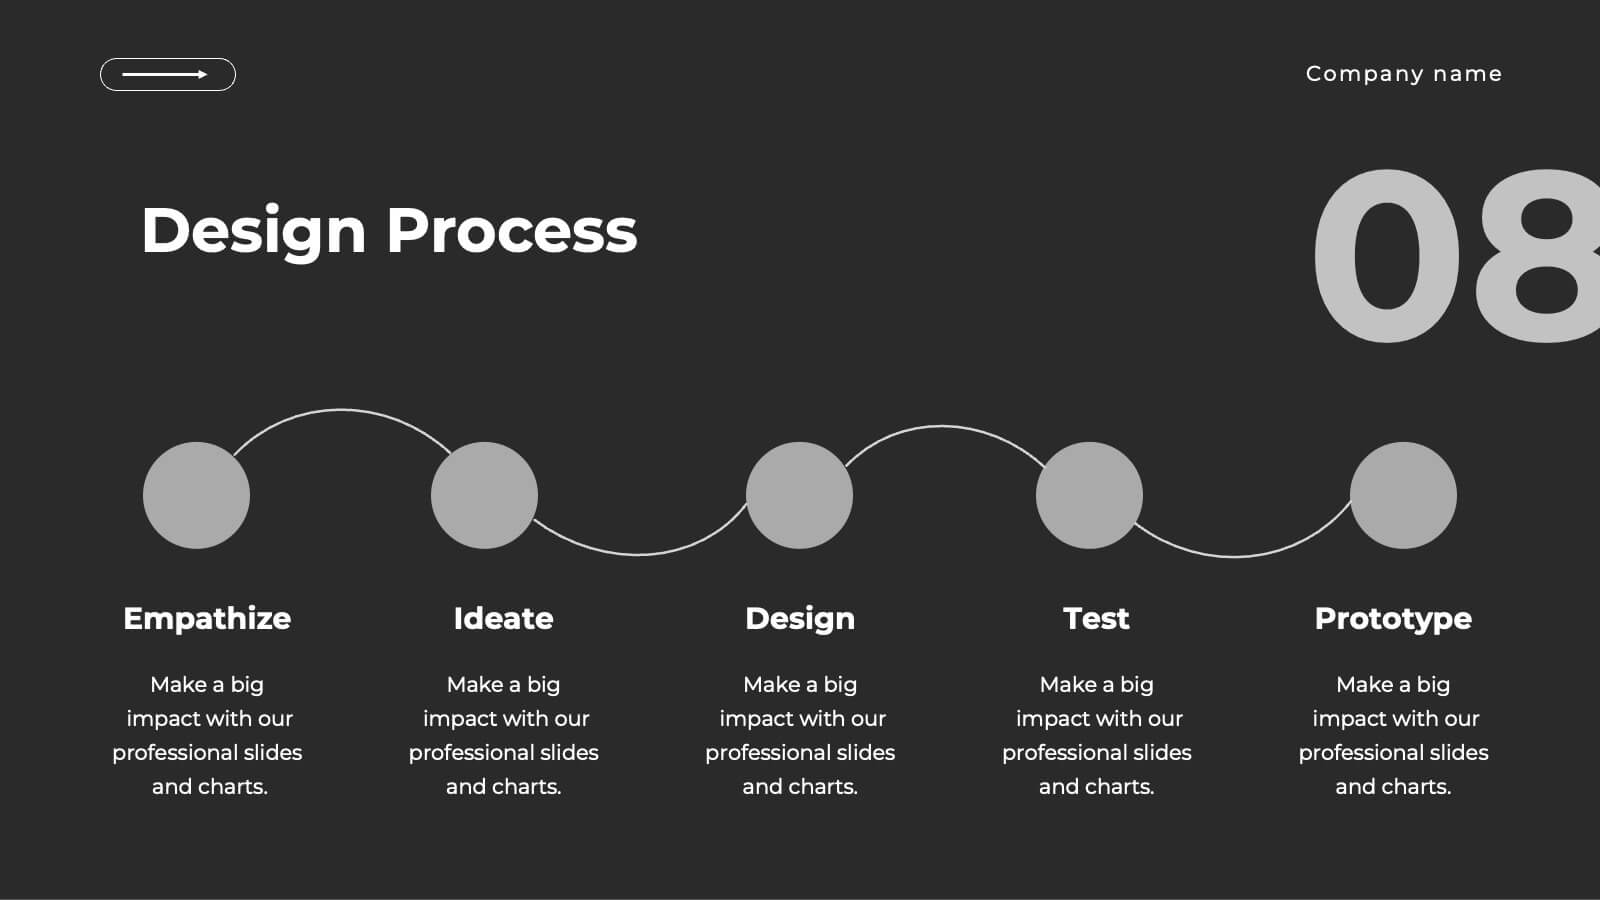
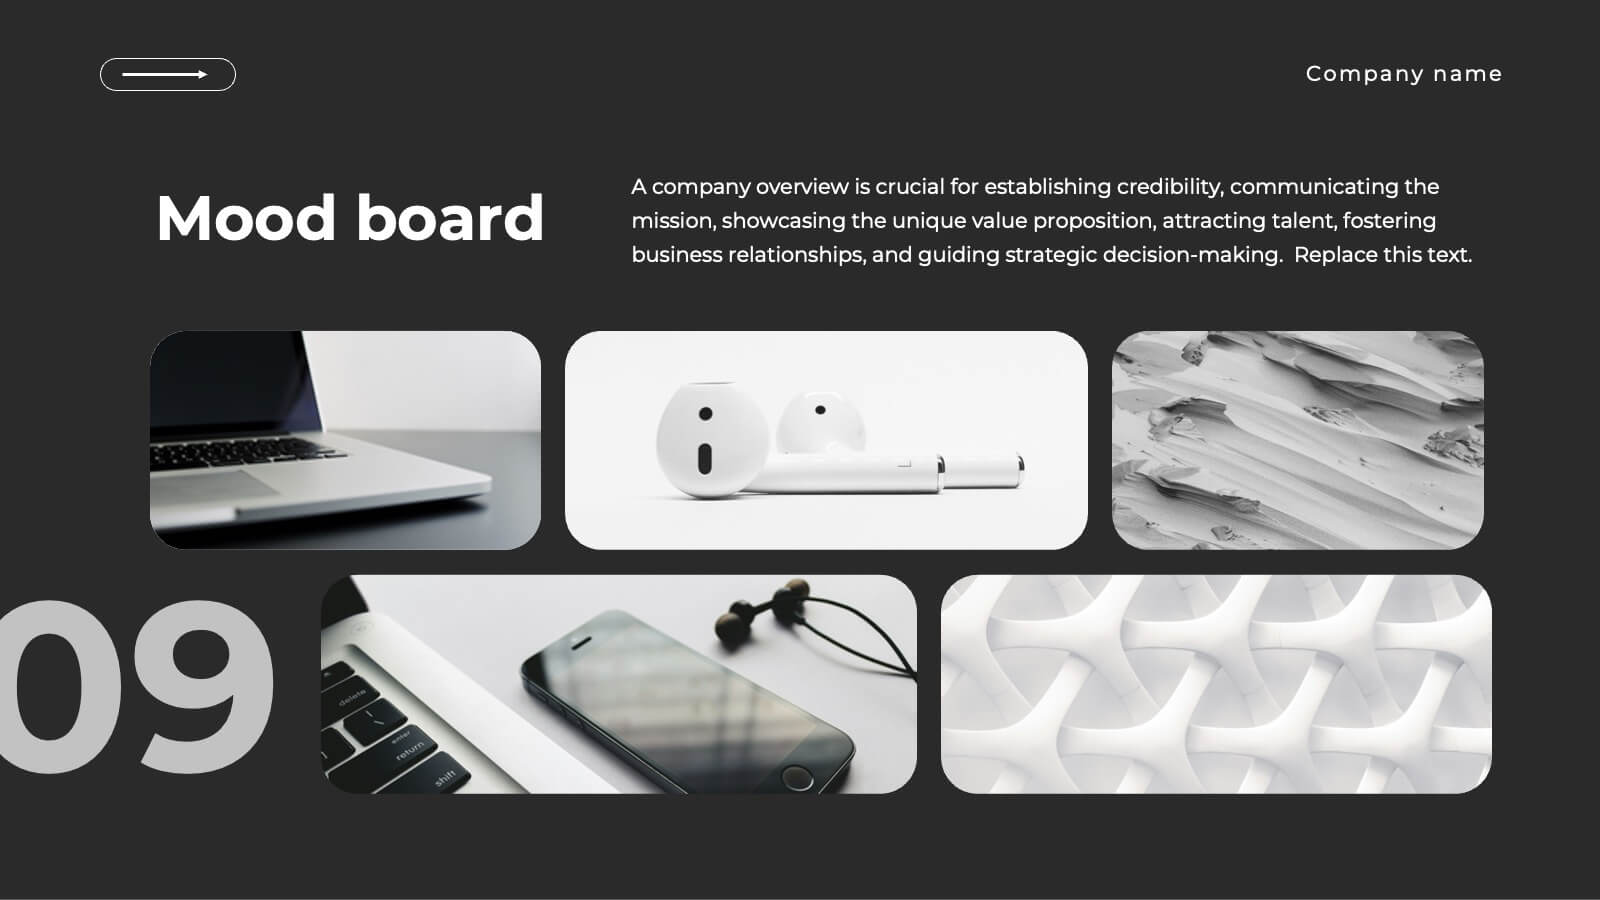
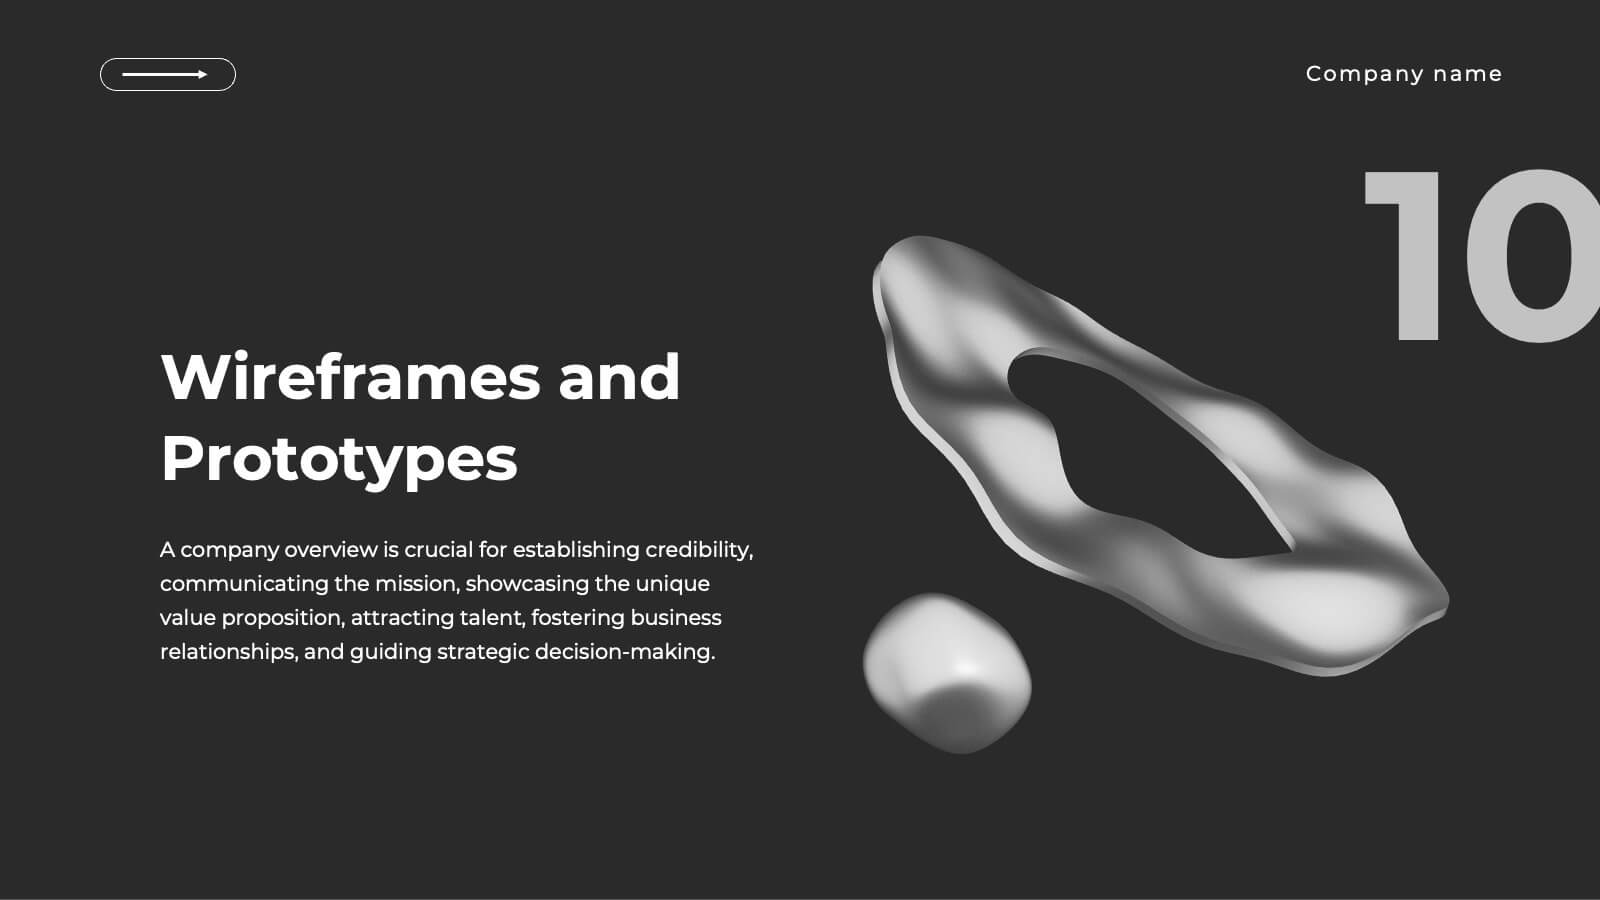
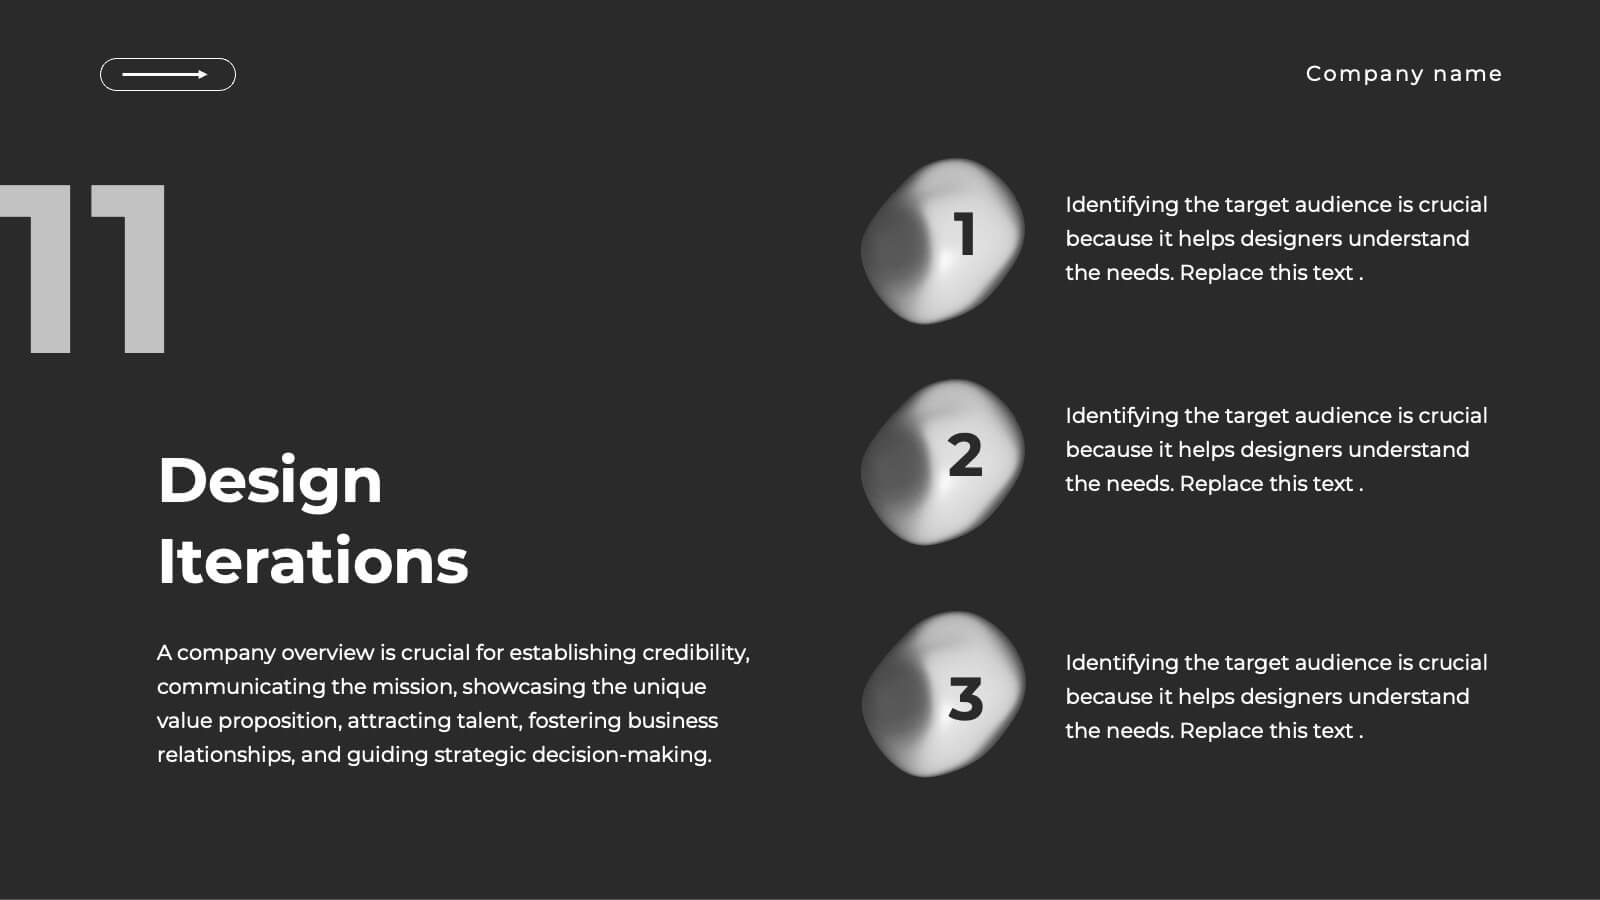
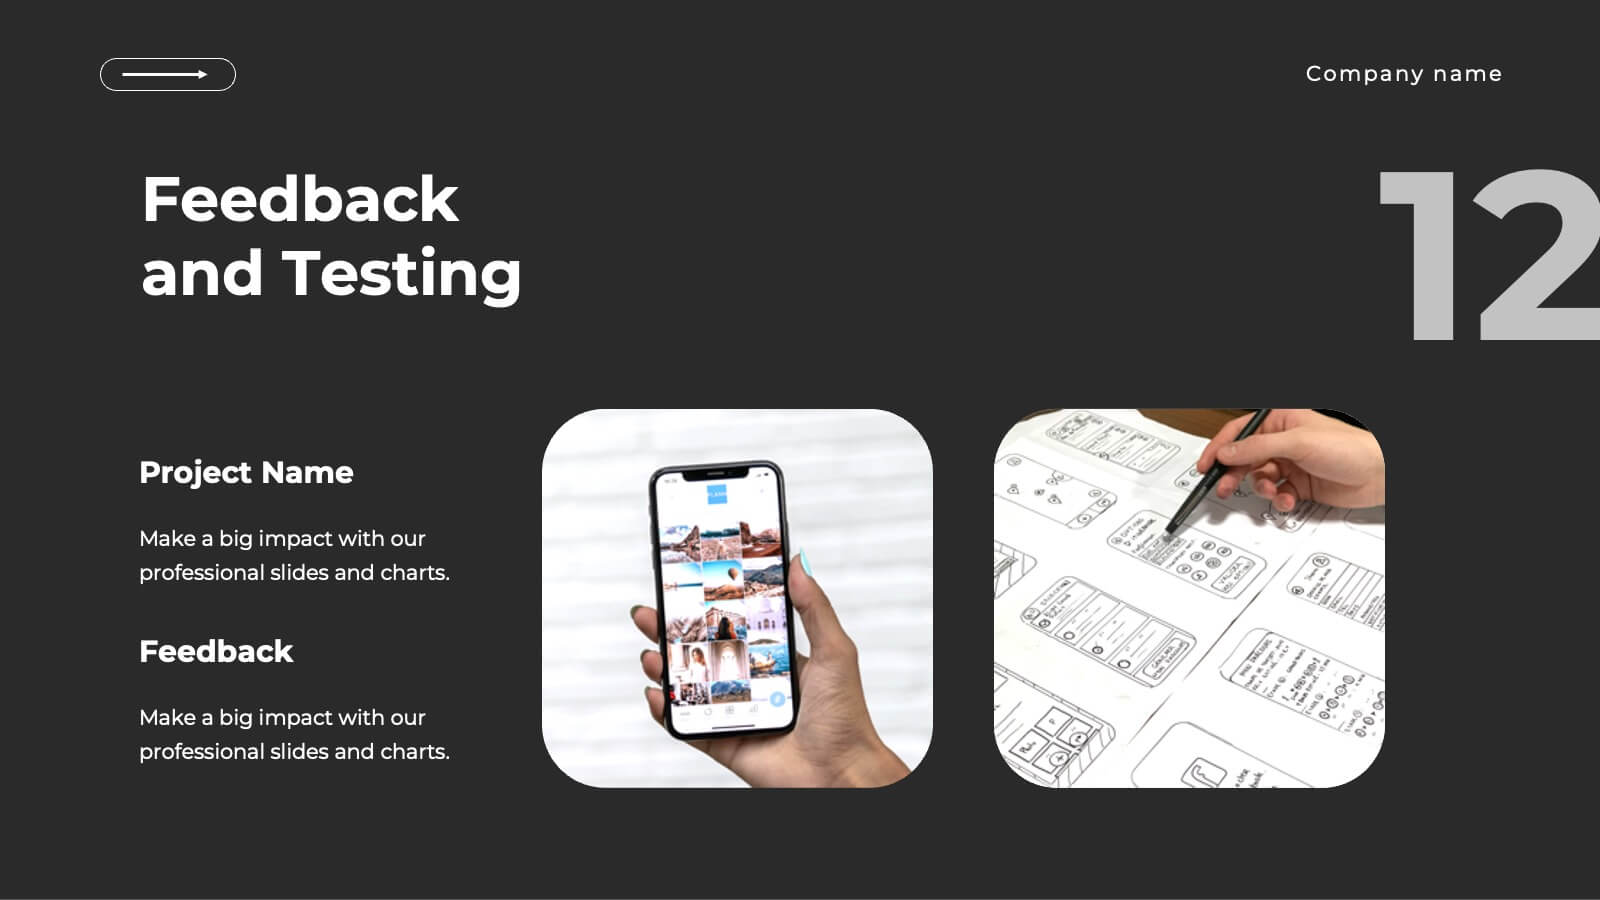
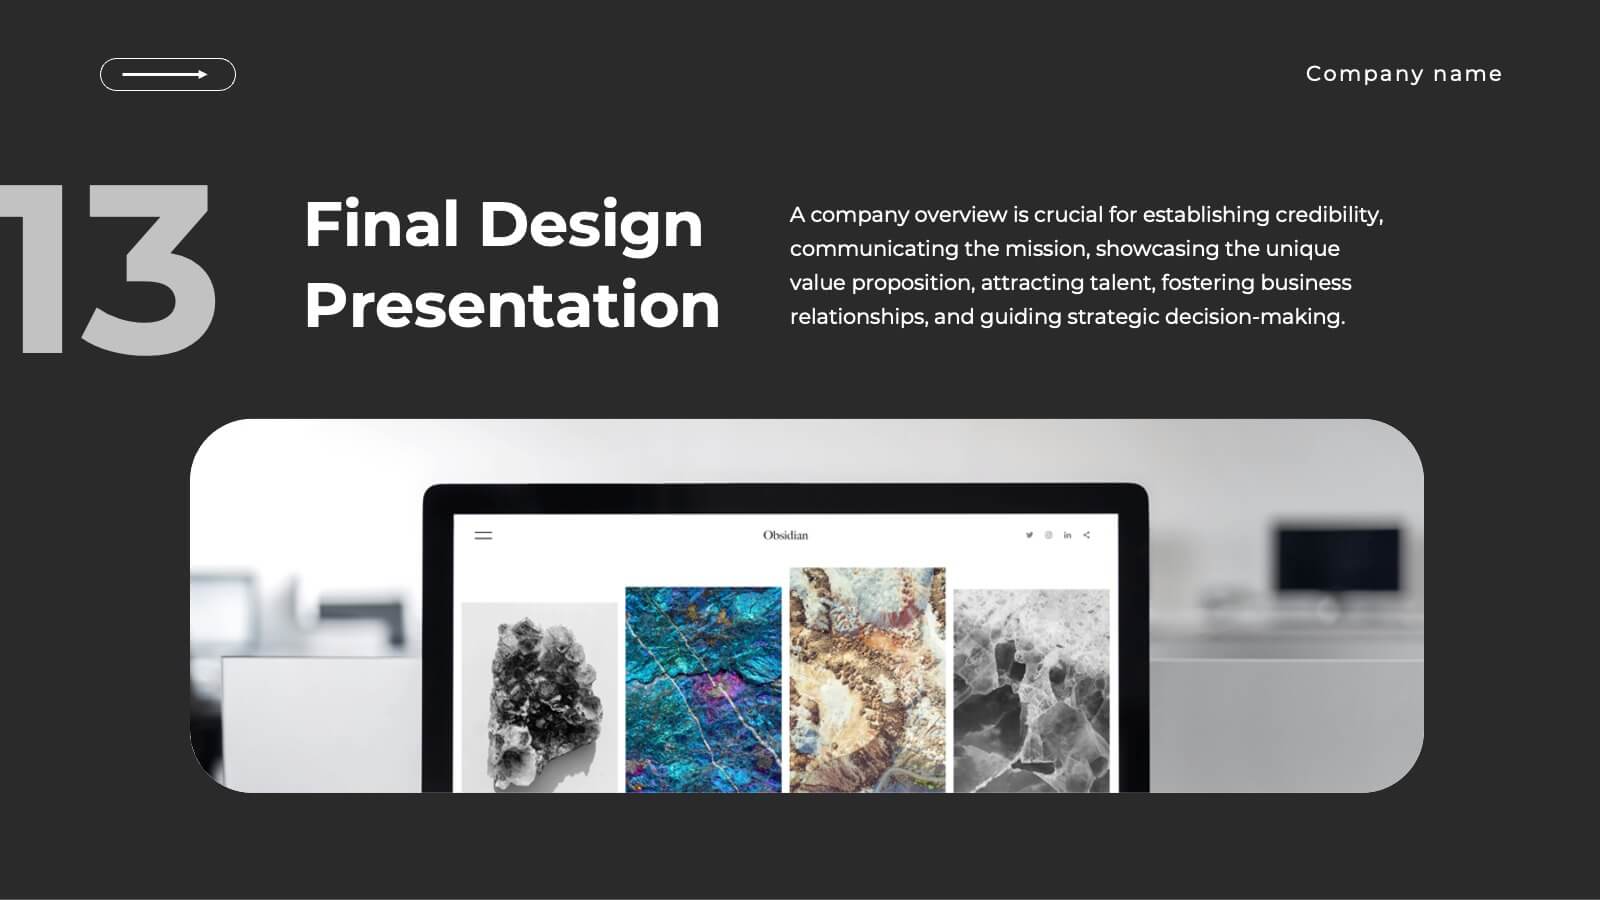
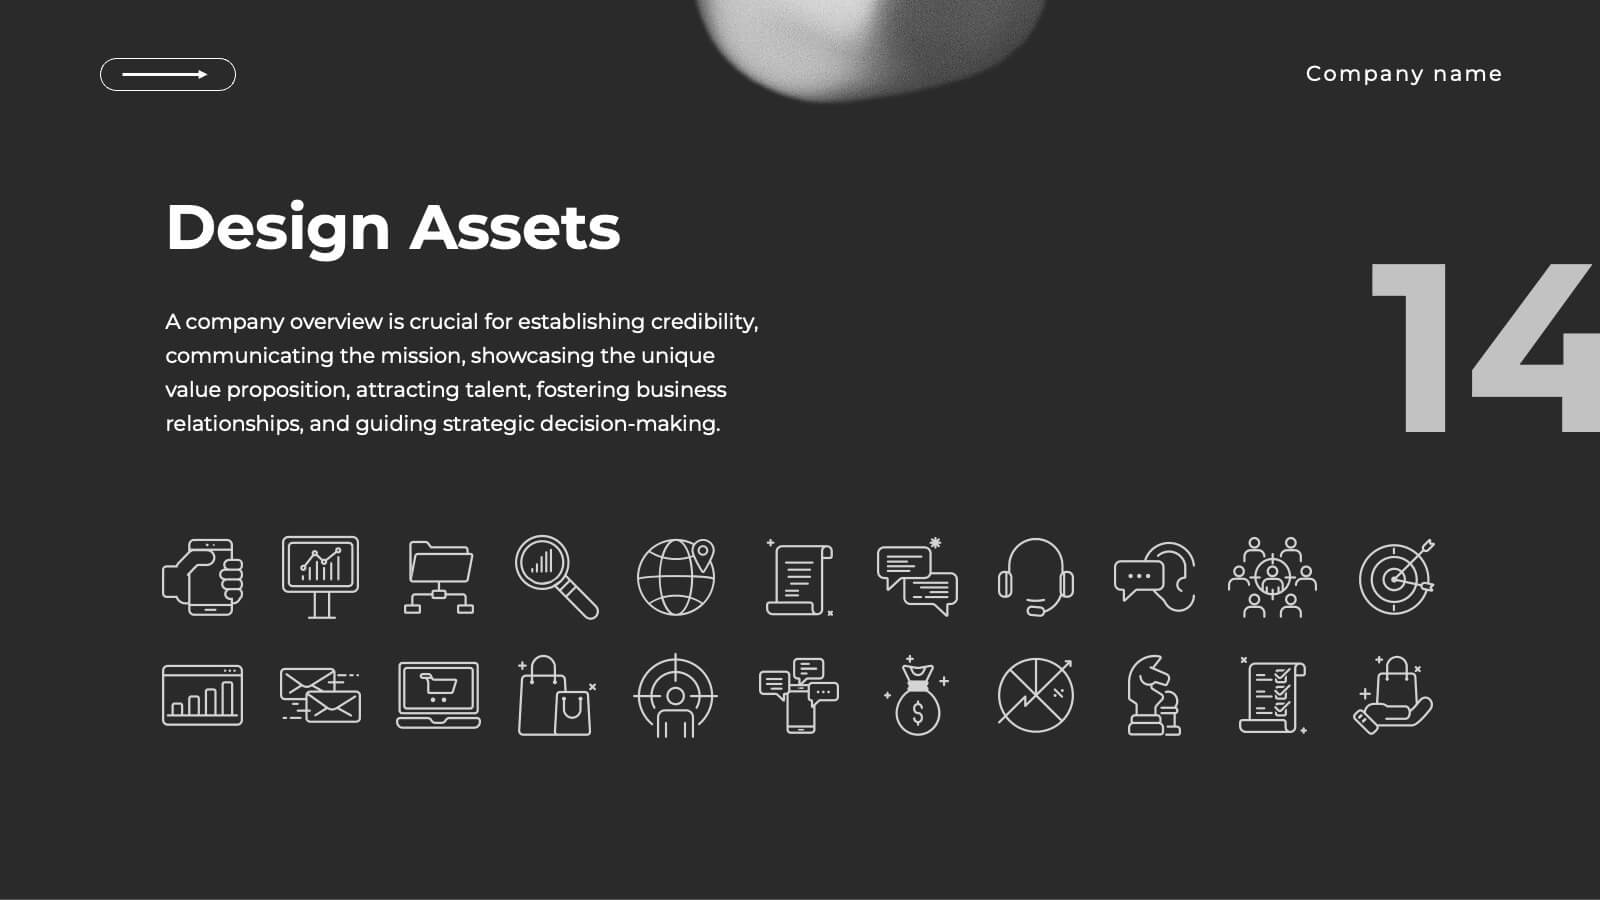
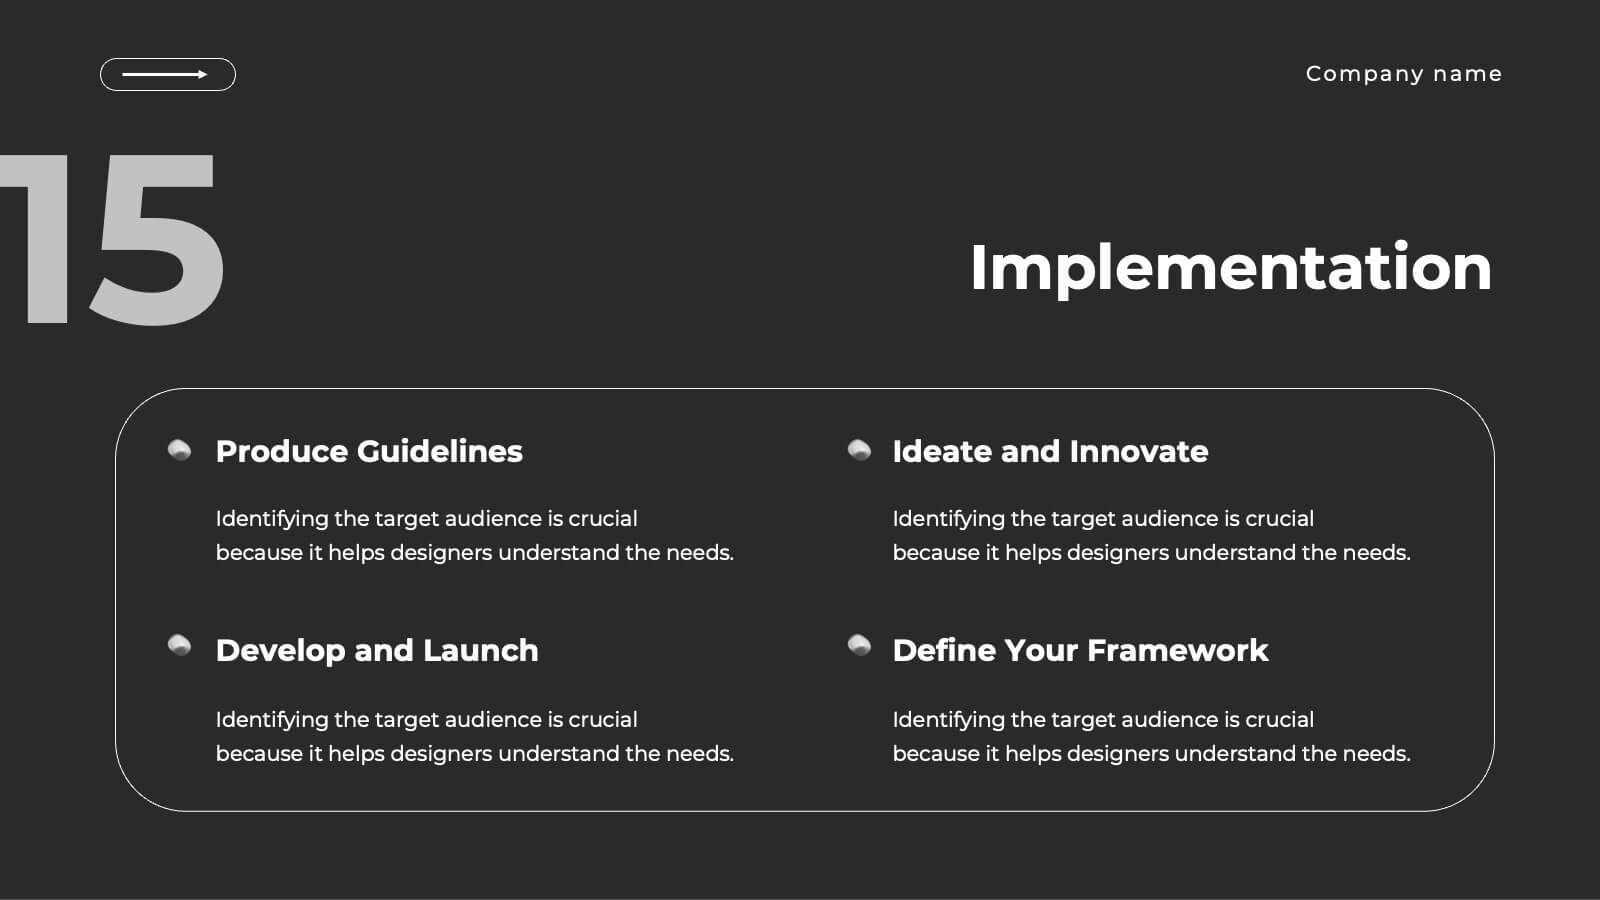
Realm UX UI Design Pitch Deck Presentation
Present your UX/UI design process with this sleek and modern design template! It covers everything from concept development to wireframes, prototypes, design iterations, and final design presentation. Fully customizable and compatible with PowerPoint, Keynote, and Google Slides, it’s perfect for design teams and professionals looking to showcase their creative process effectively.


5 diapositivas
Step-by-Step Flow Diagram Presentation
Bring clarity to every stage of your process with a clean, easy-to-follow visual path that guides your audience step by step. This presentation helps simplify workflows, instructions, and project milestones in a structured, approachable layout. Fully compatible with PowerPoint, Keynote, and Google Slides.


4 diapositivas
Target Audience Slide Deck Presentation
Make your message click instantly with a bold, puzzle-style slide that brings your audience insights to life. This presentation helps you break down key segments, user needs, and demographic details in a clear, engaging format that supports strategic decision-making. Fully compatible with PowerPoint, Keynote, and Google Slides.


8 diapositivas
Company Vision and Strategic Direction Presentation
Present your company’s long-term goals with clarity using the Company Vision and Strategic Direction Presentation. This clean, icon-led layout helps communicate your vision, focus areas, and roadmap in a linear, easy-to-follow format. Ideal for executive updates, investor decks, or team briefings. Compatible with PowerPoint, Canva, and Google Slides.

20 diapositivas
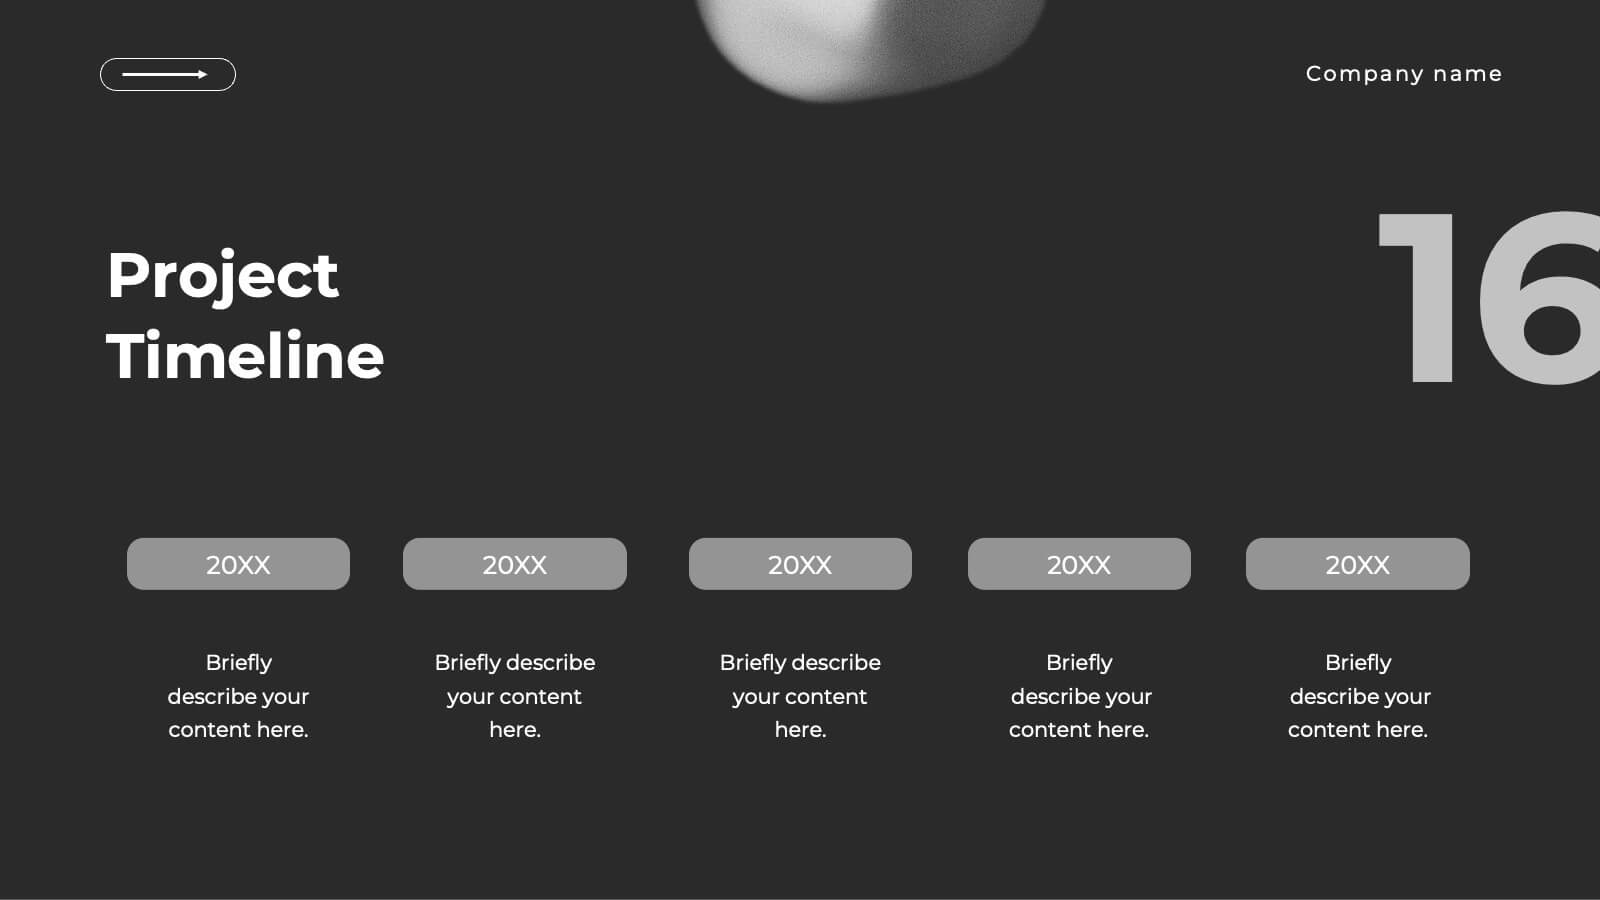
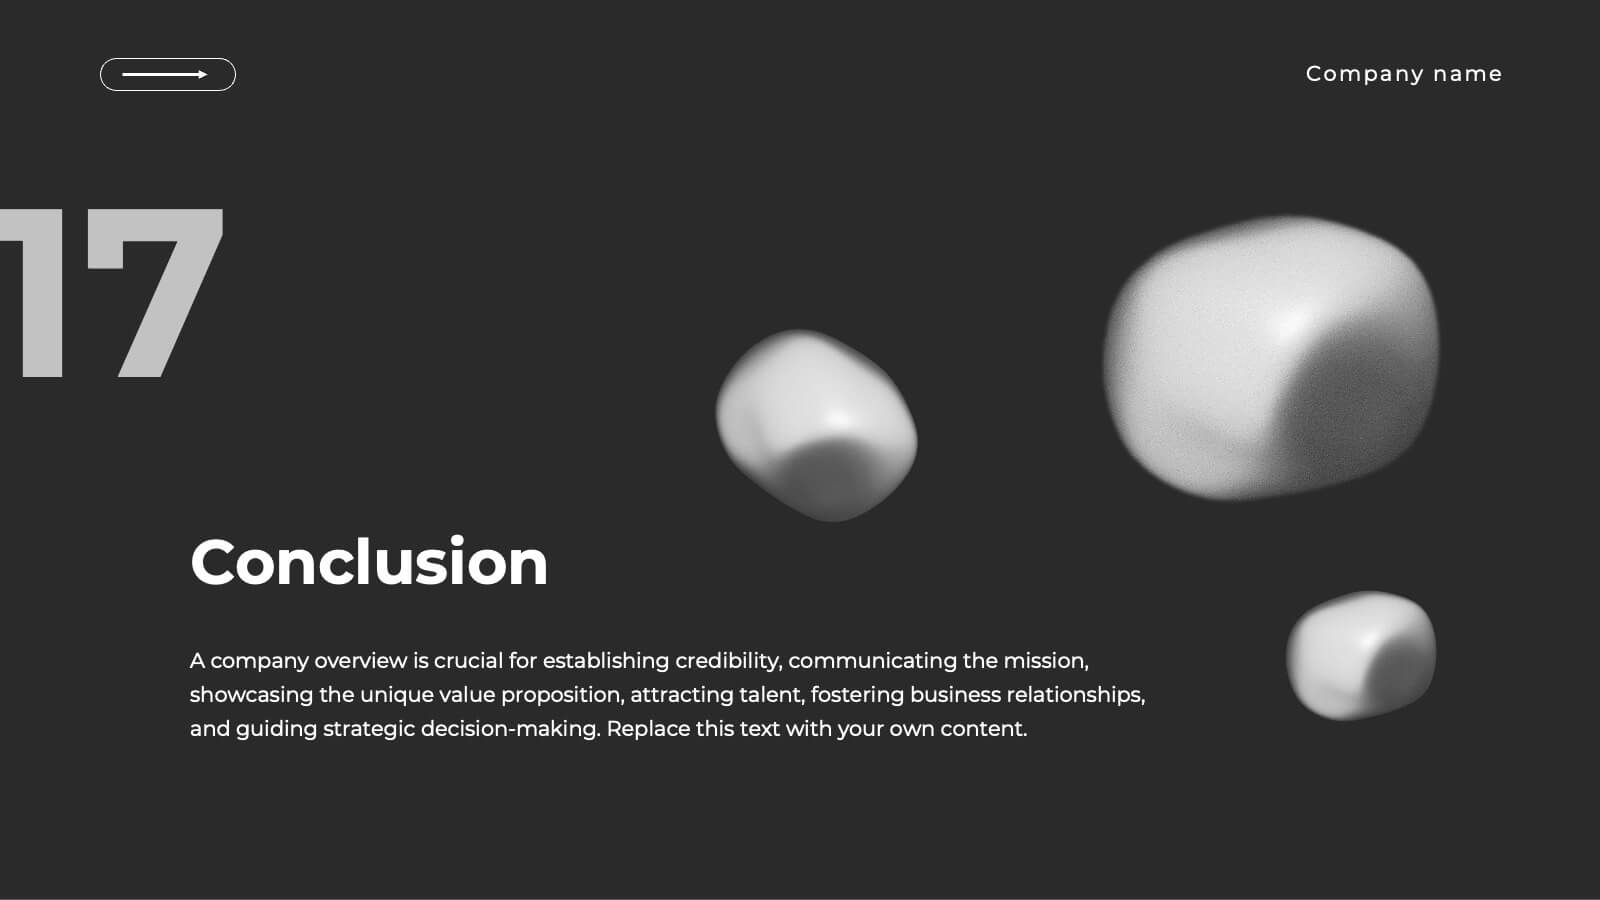
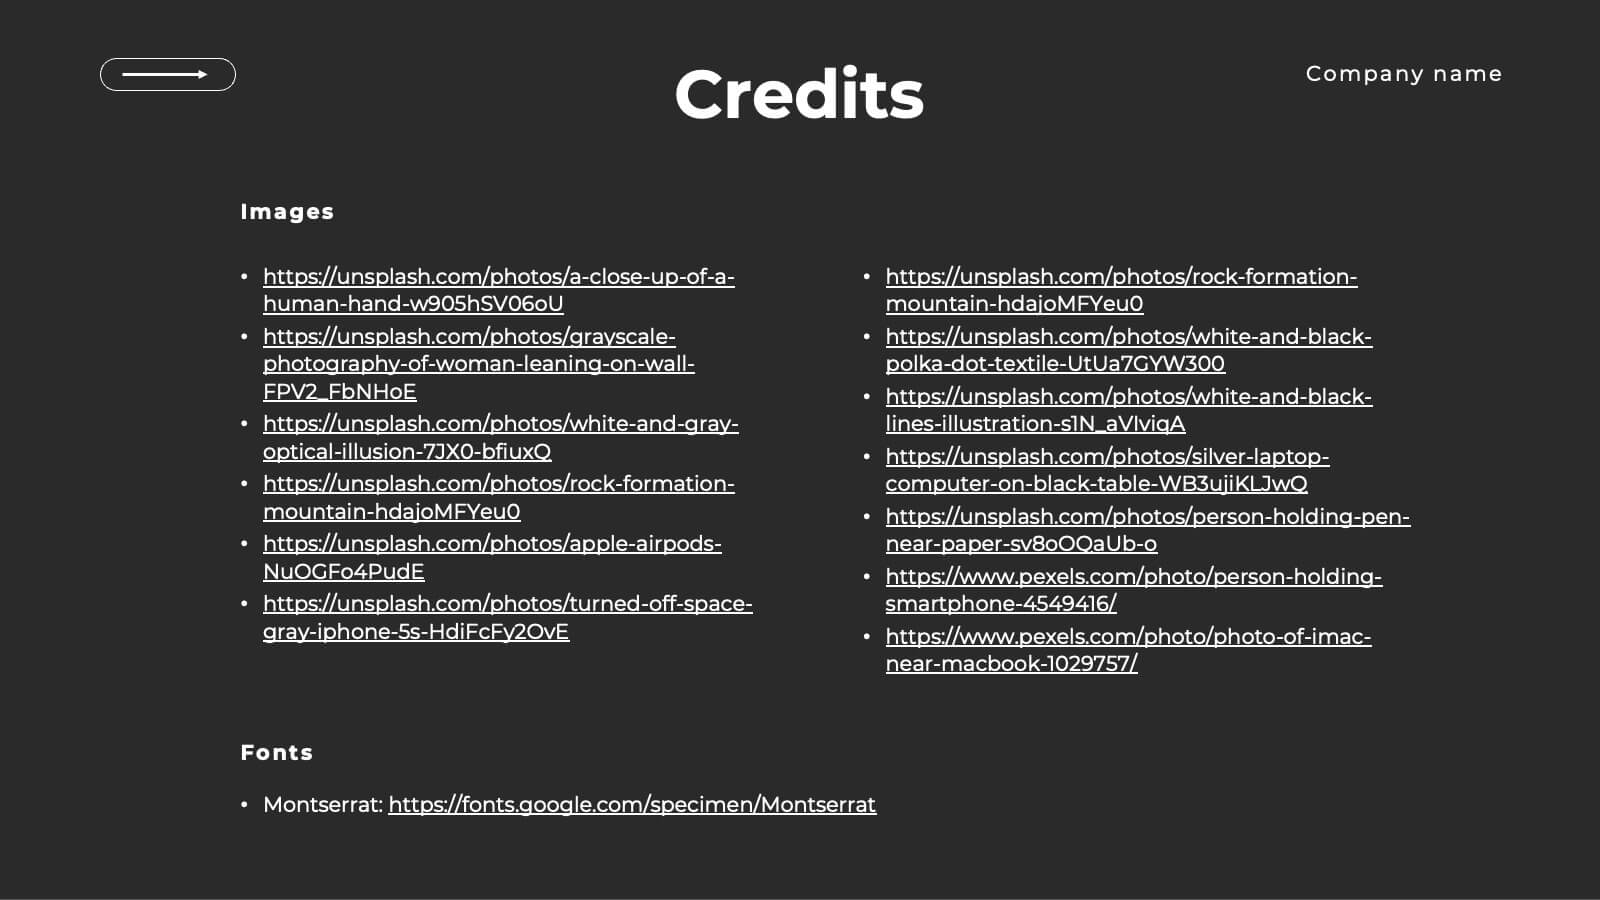
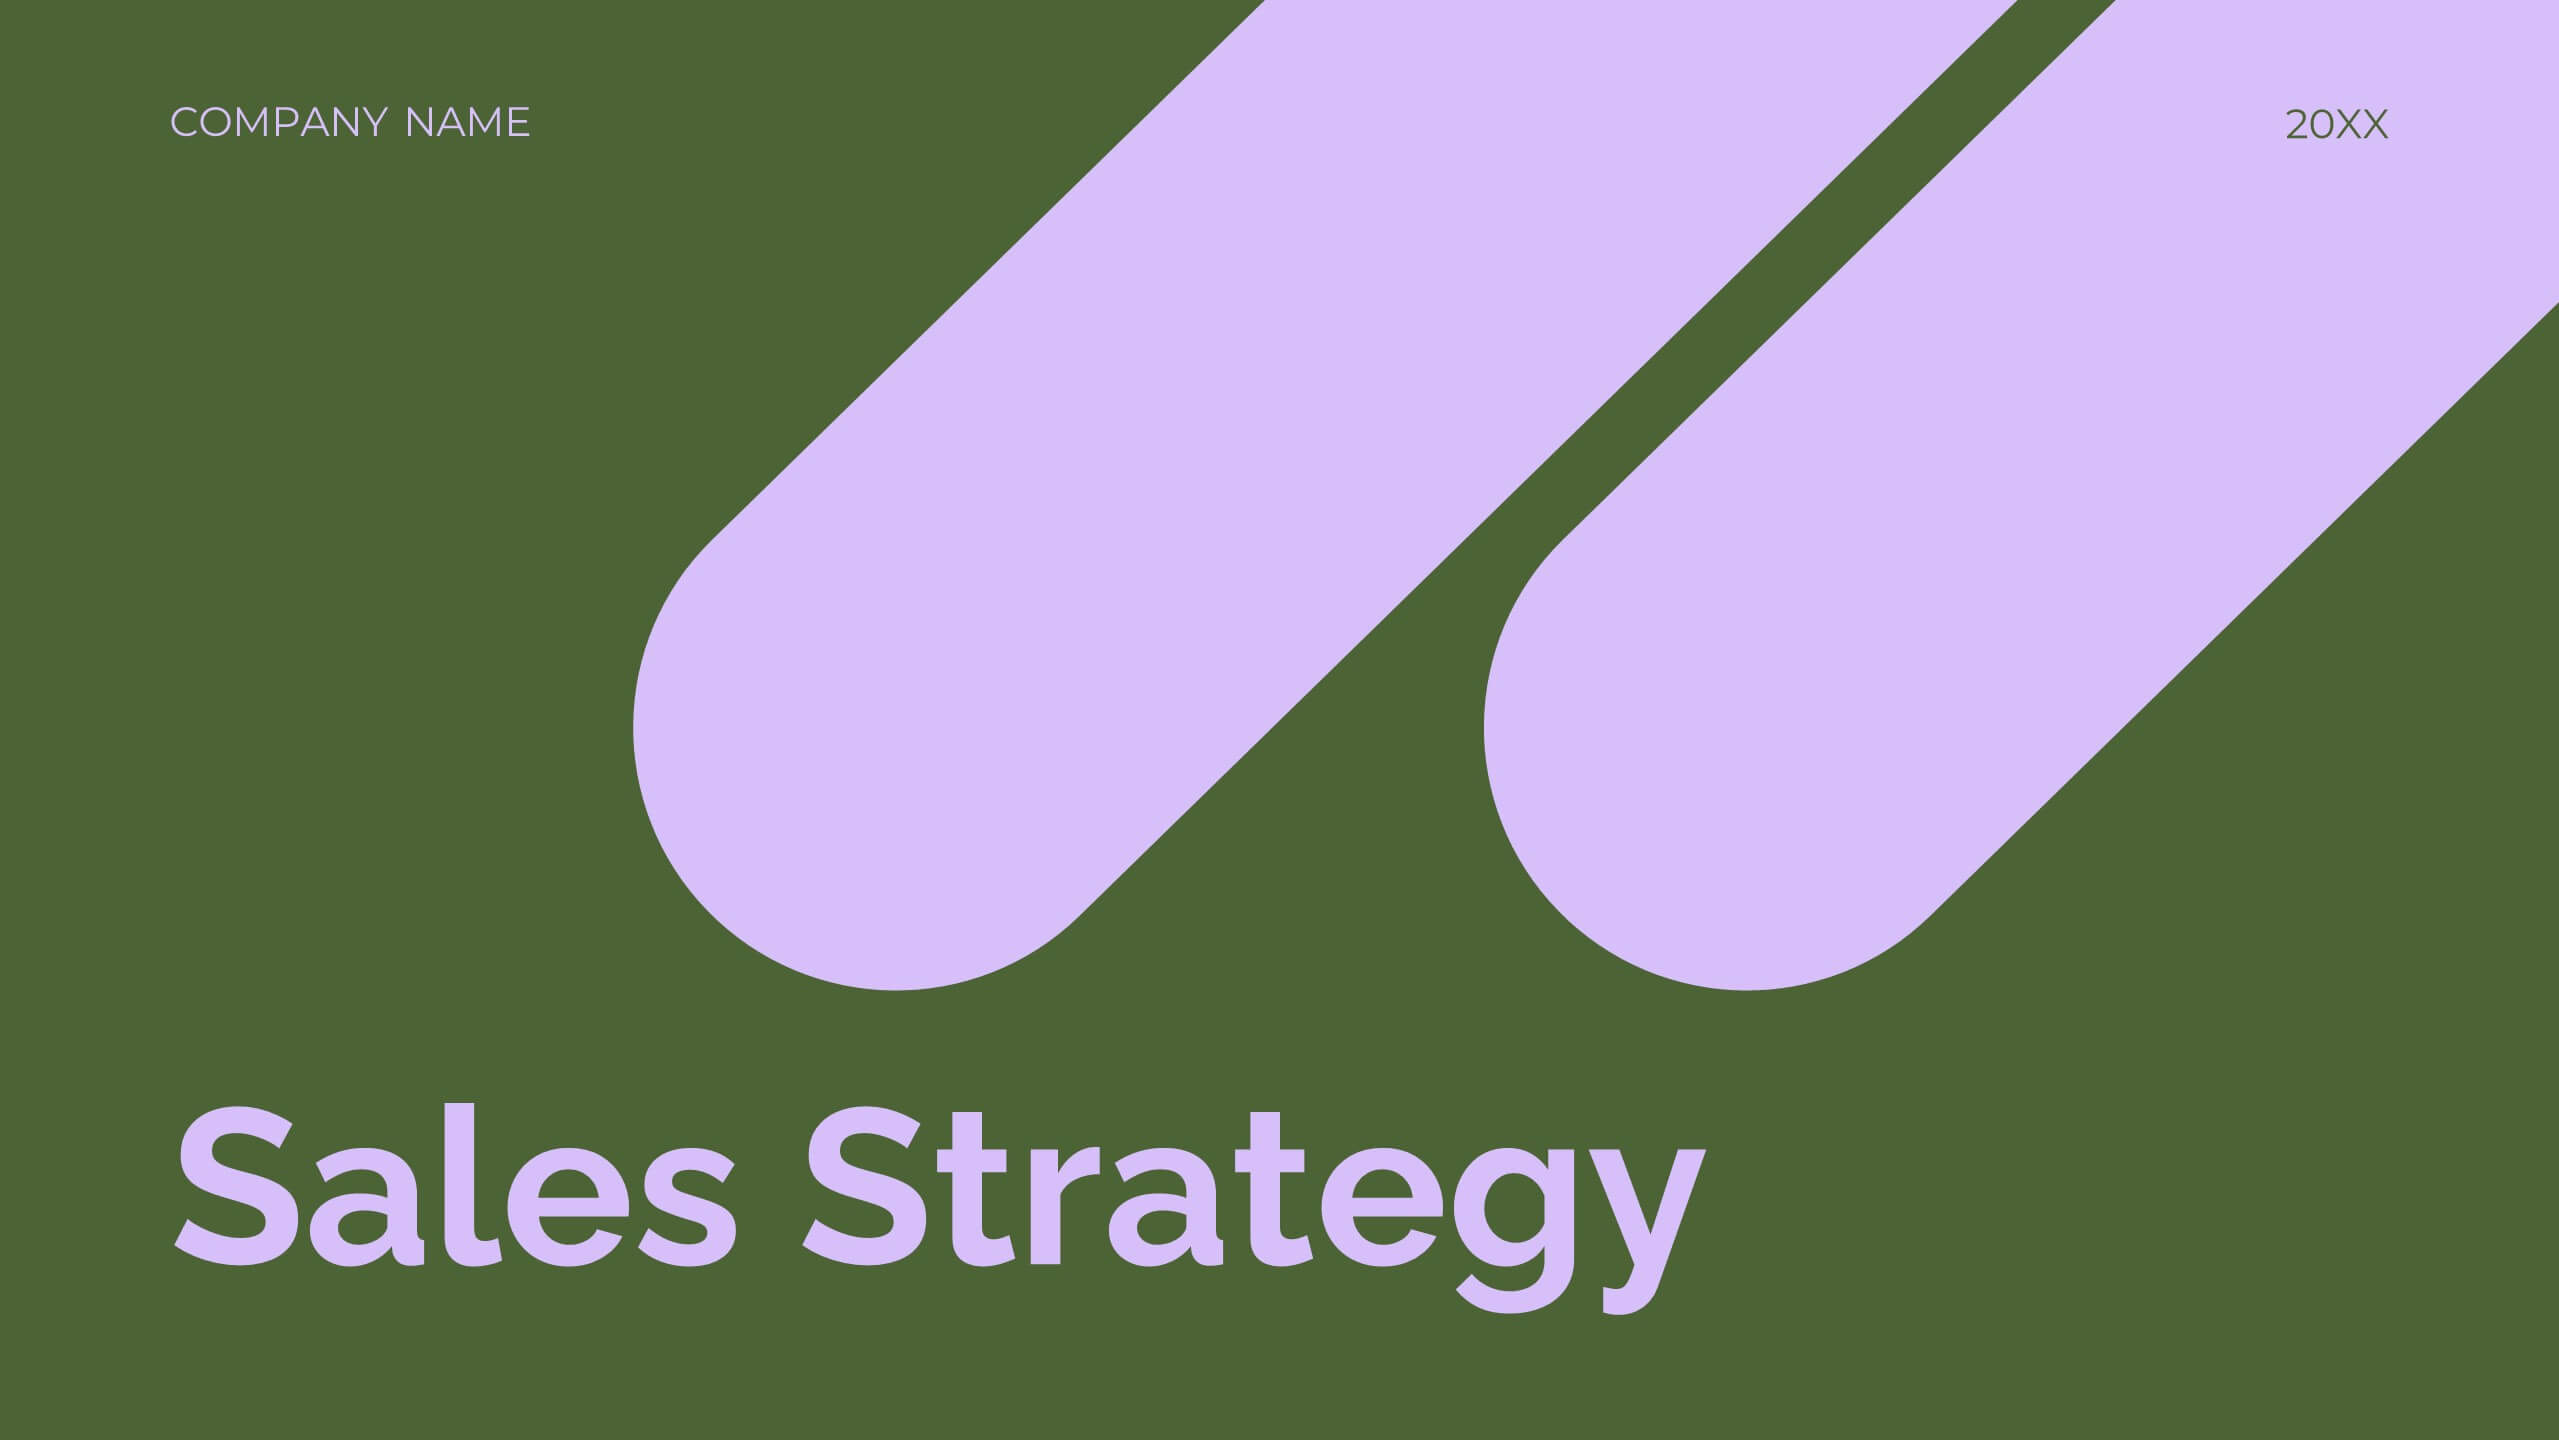
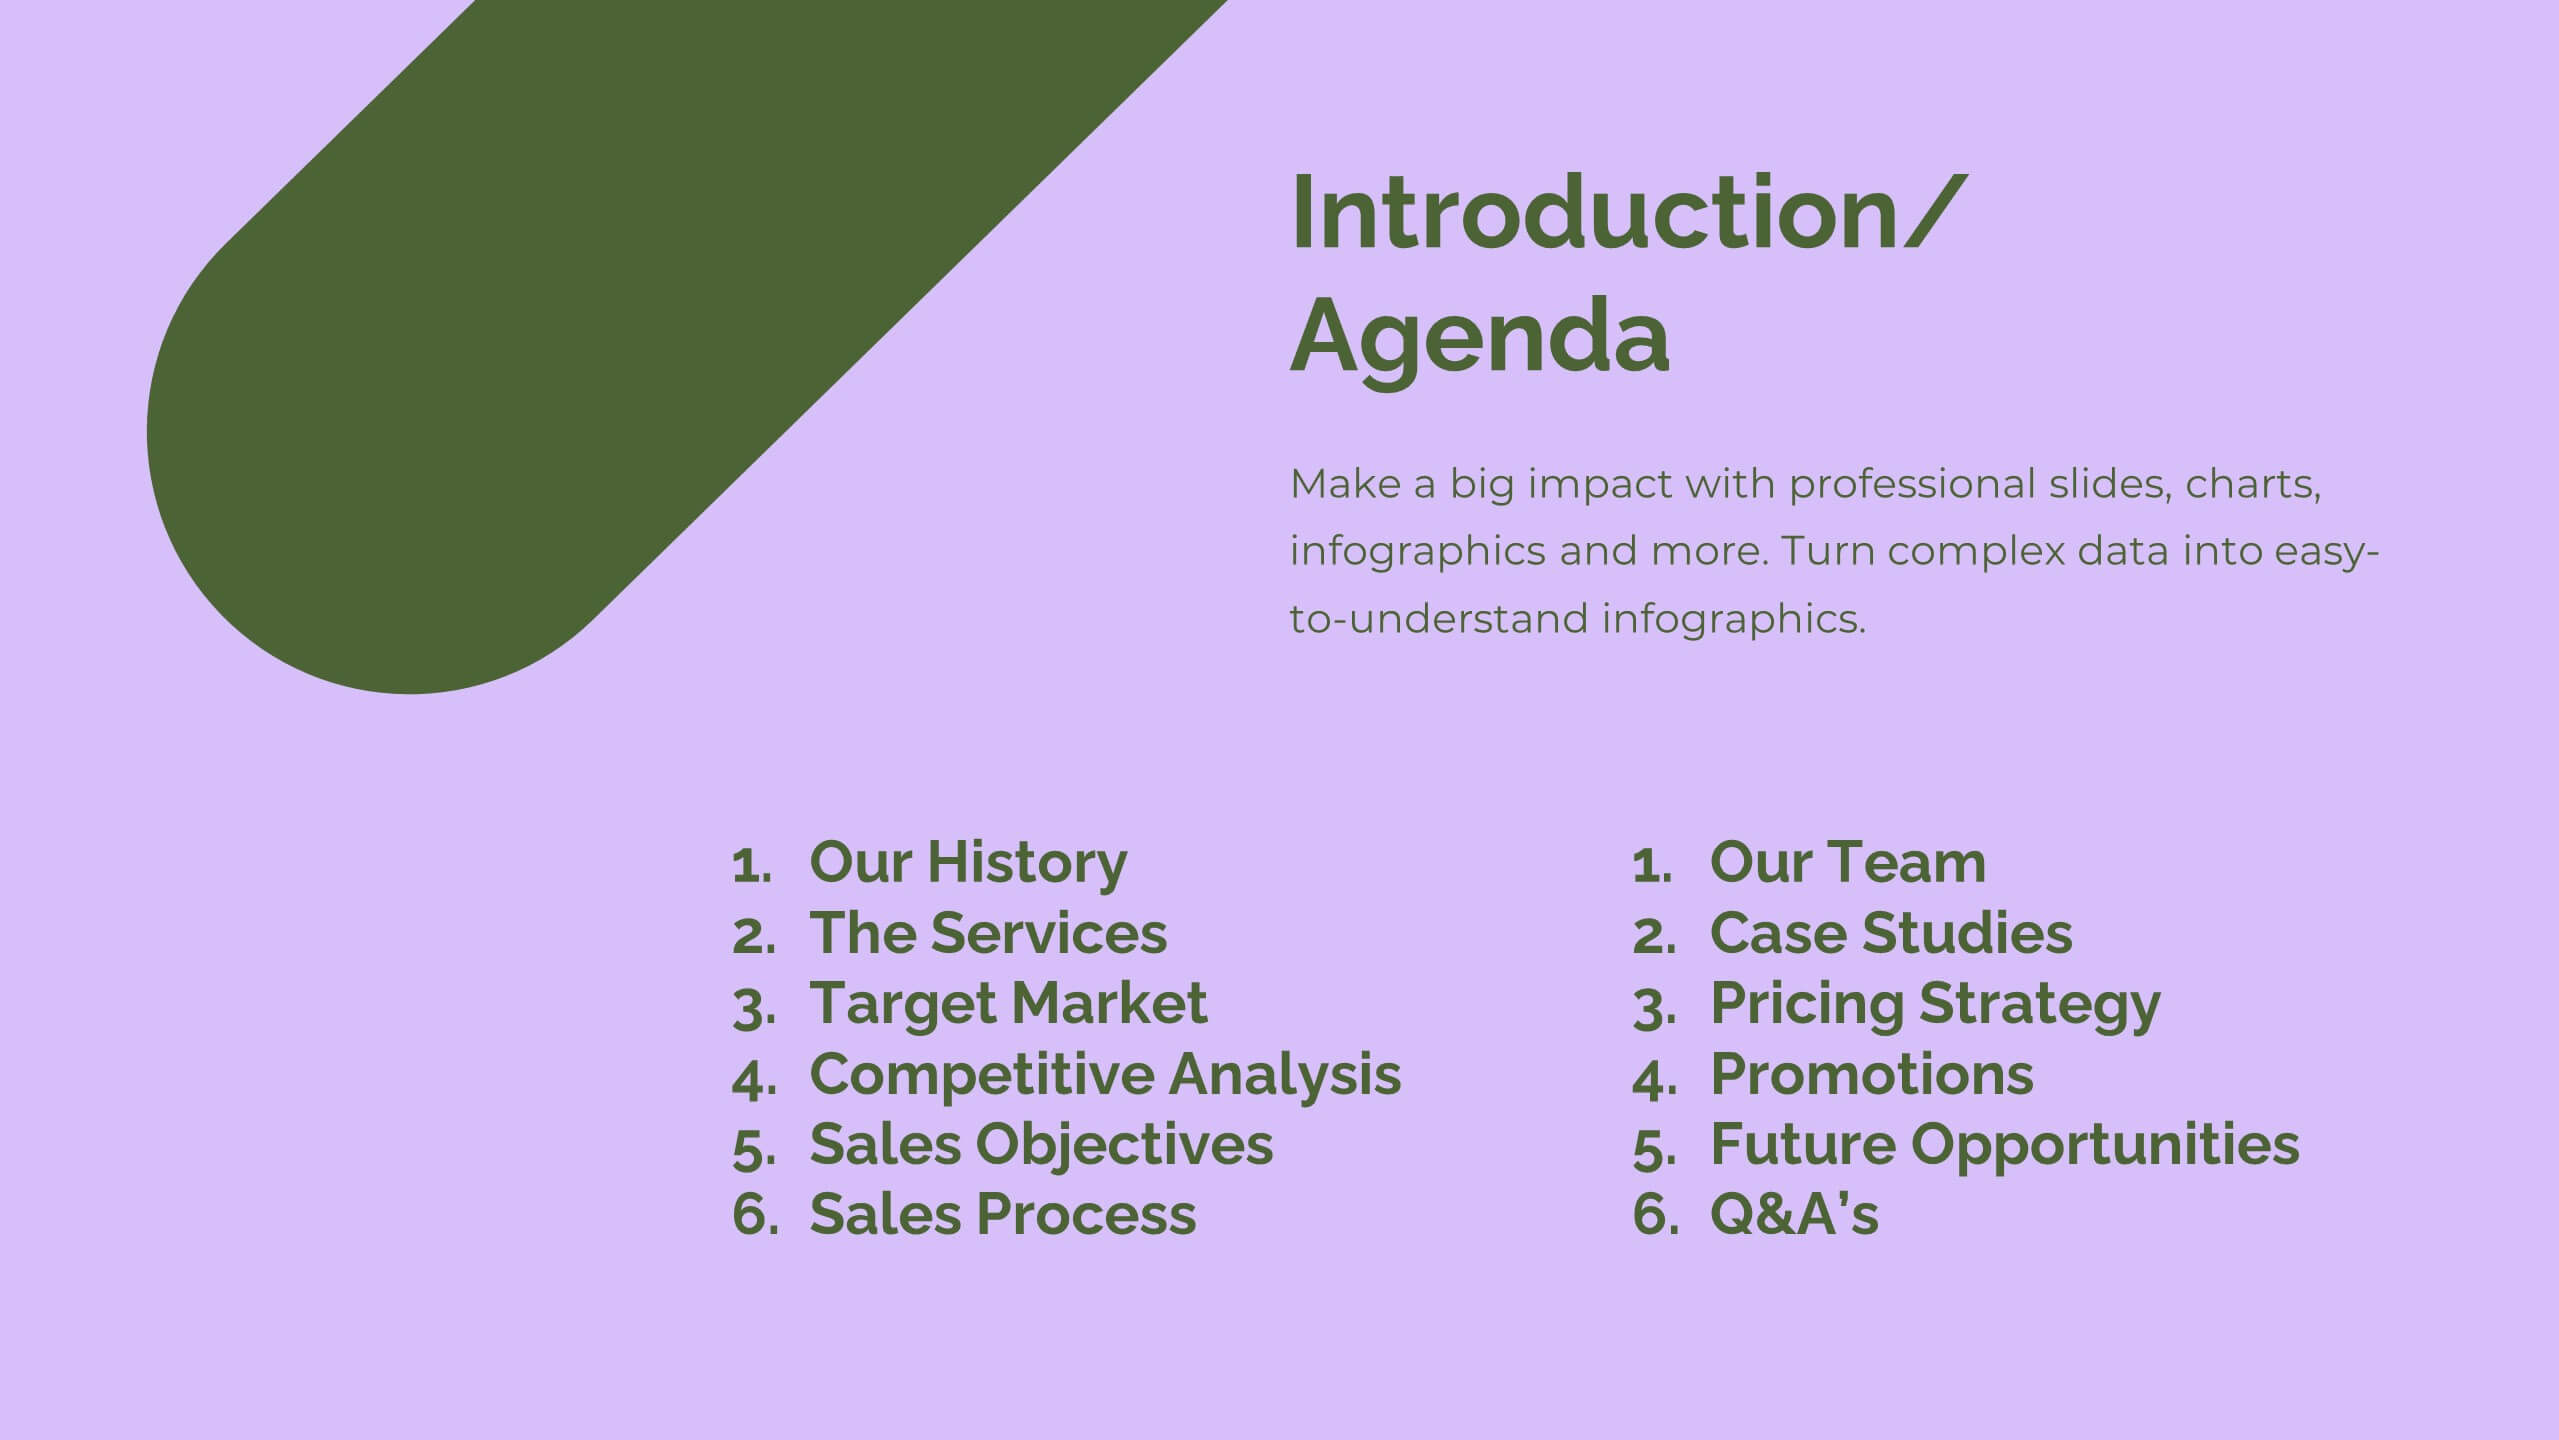
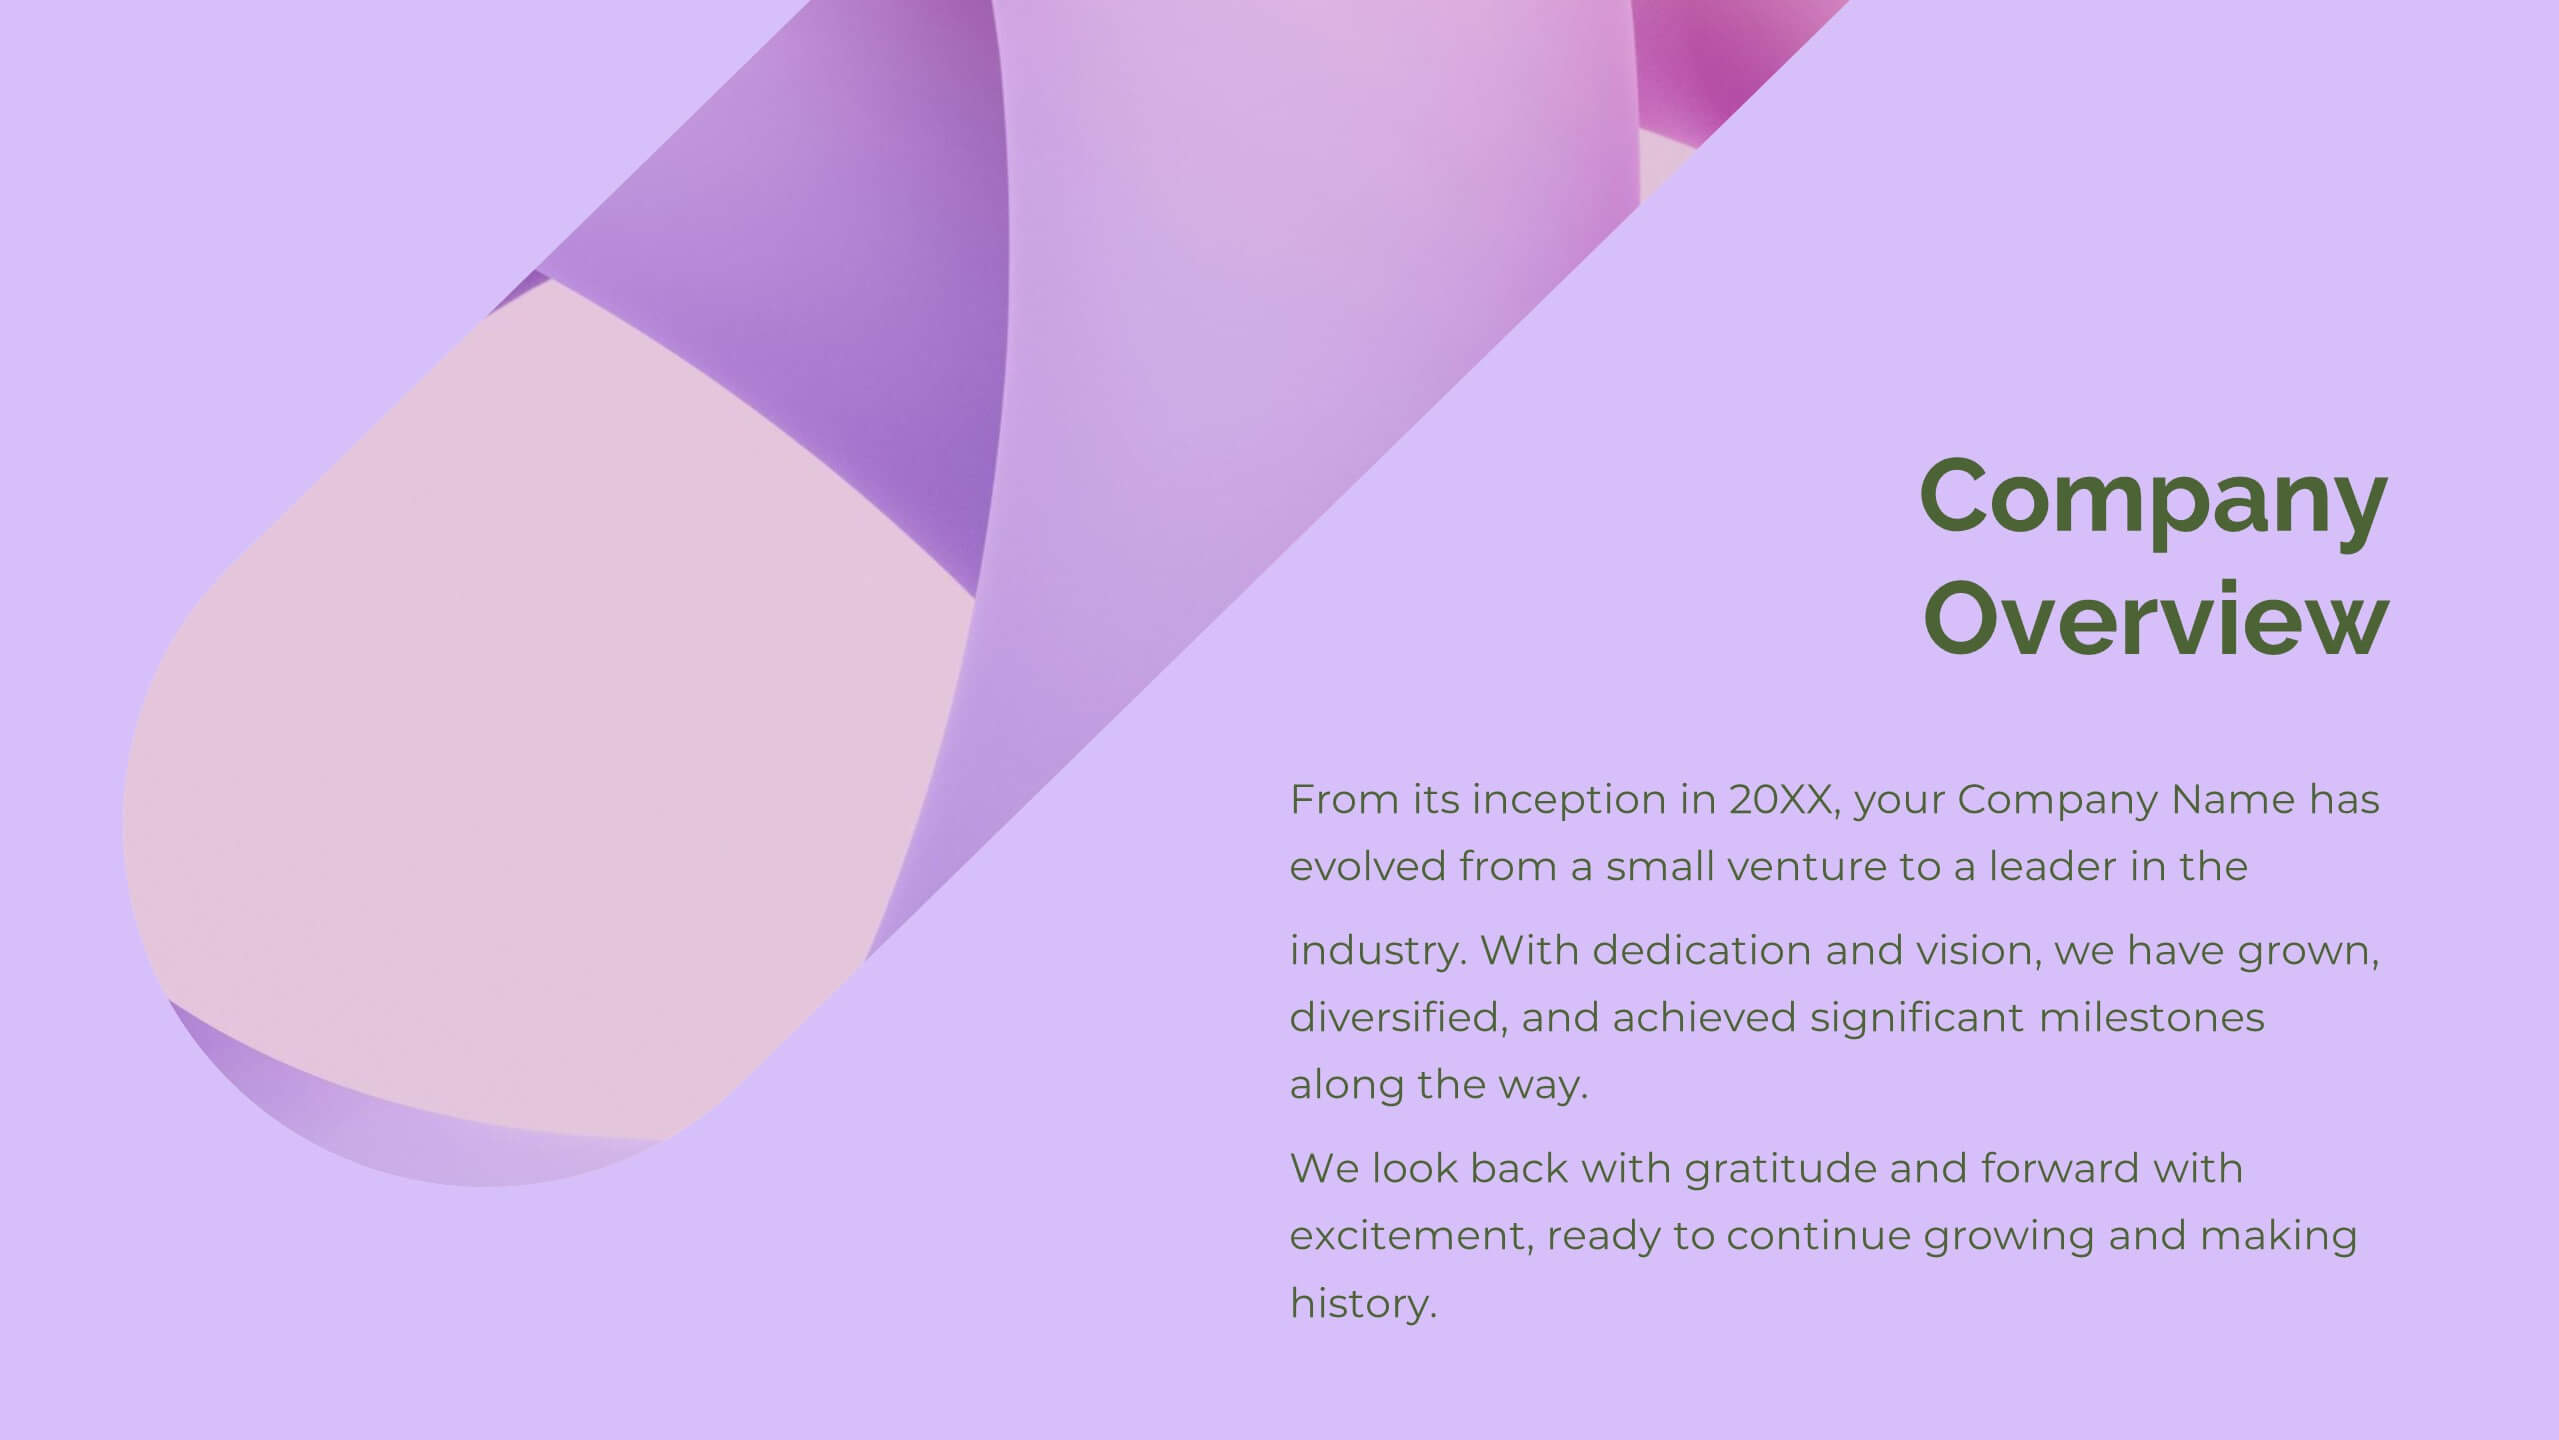
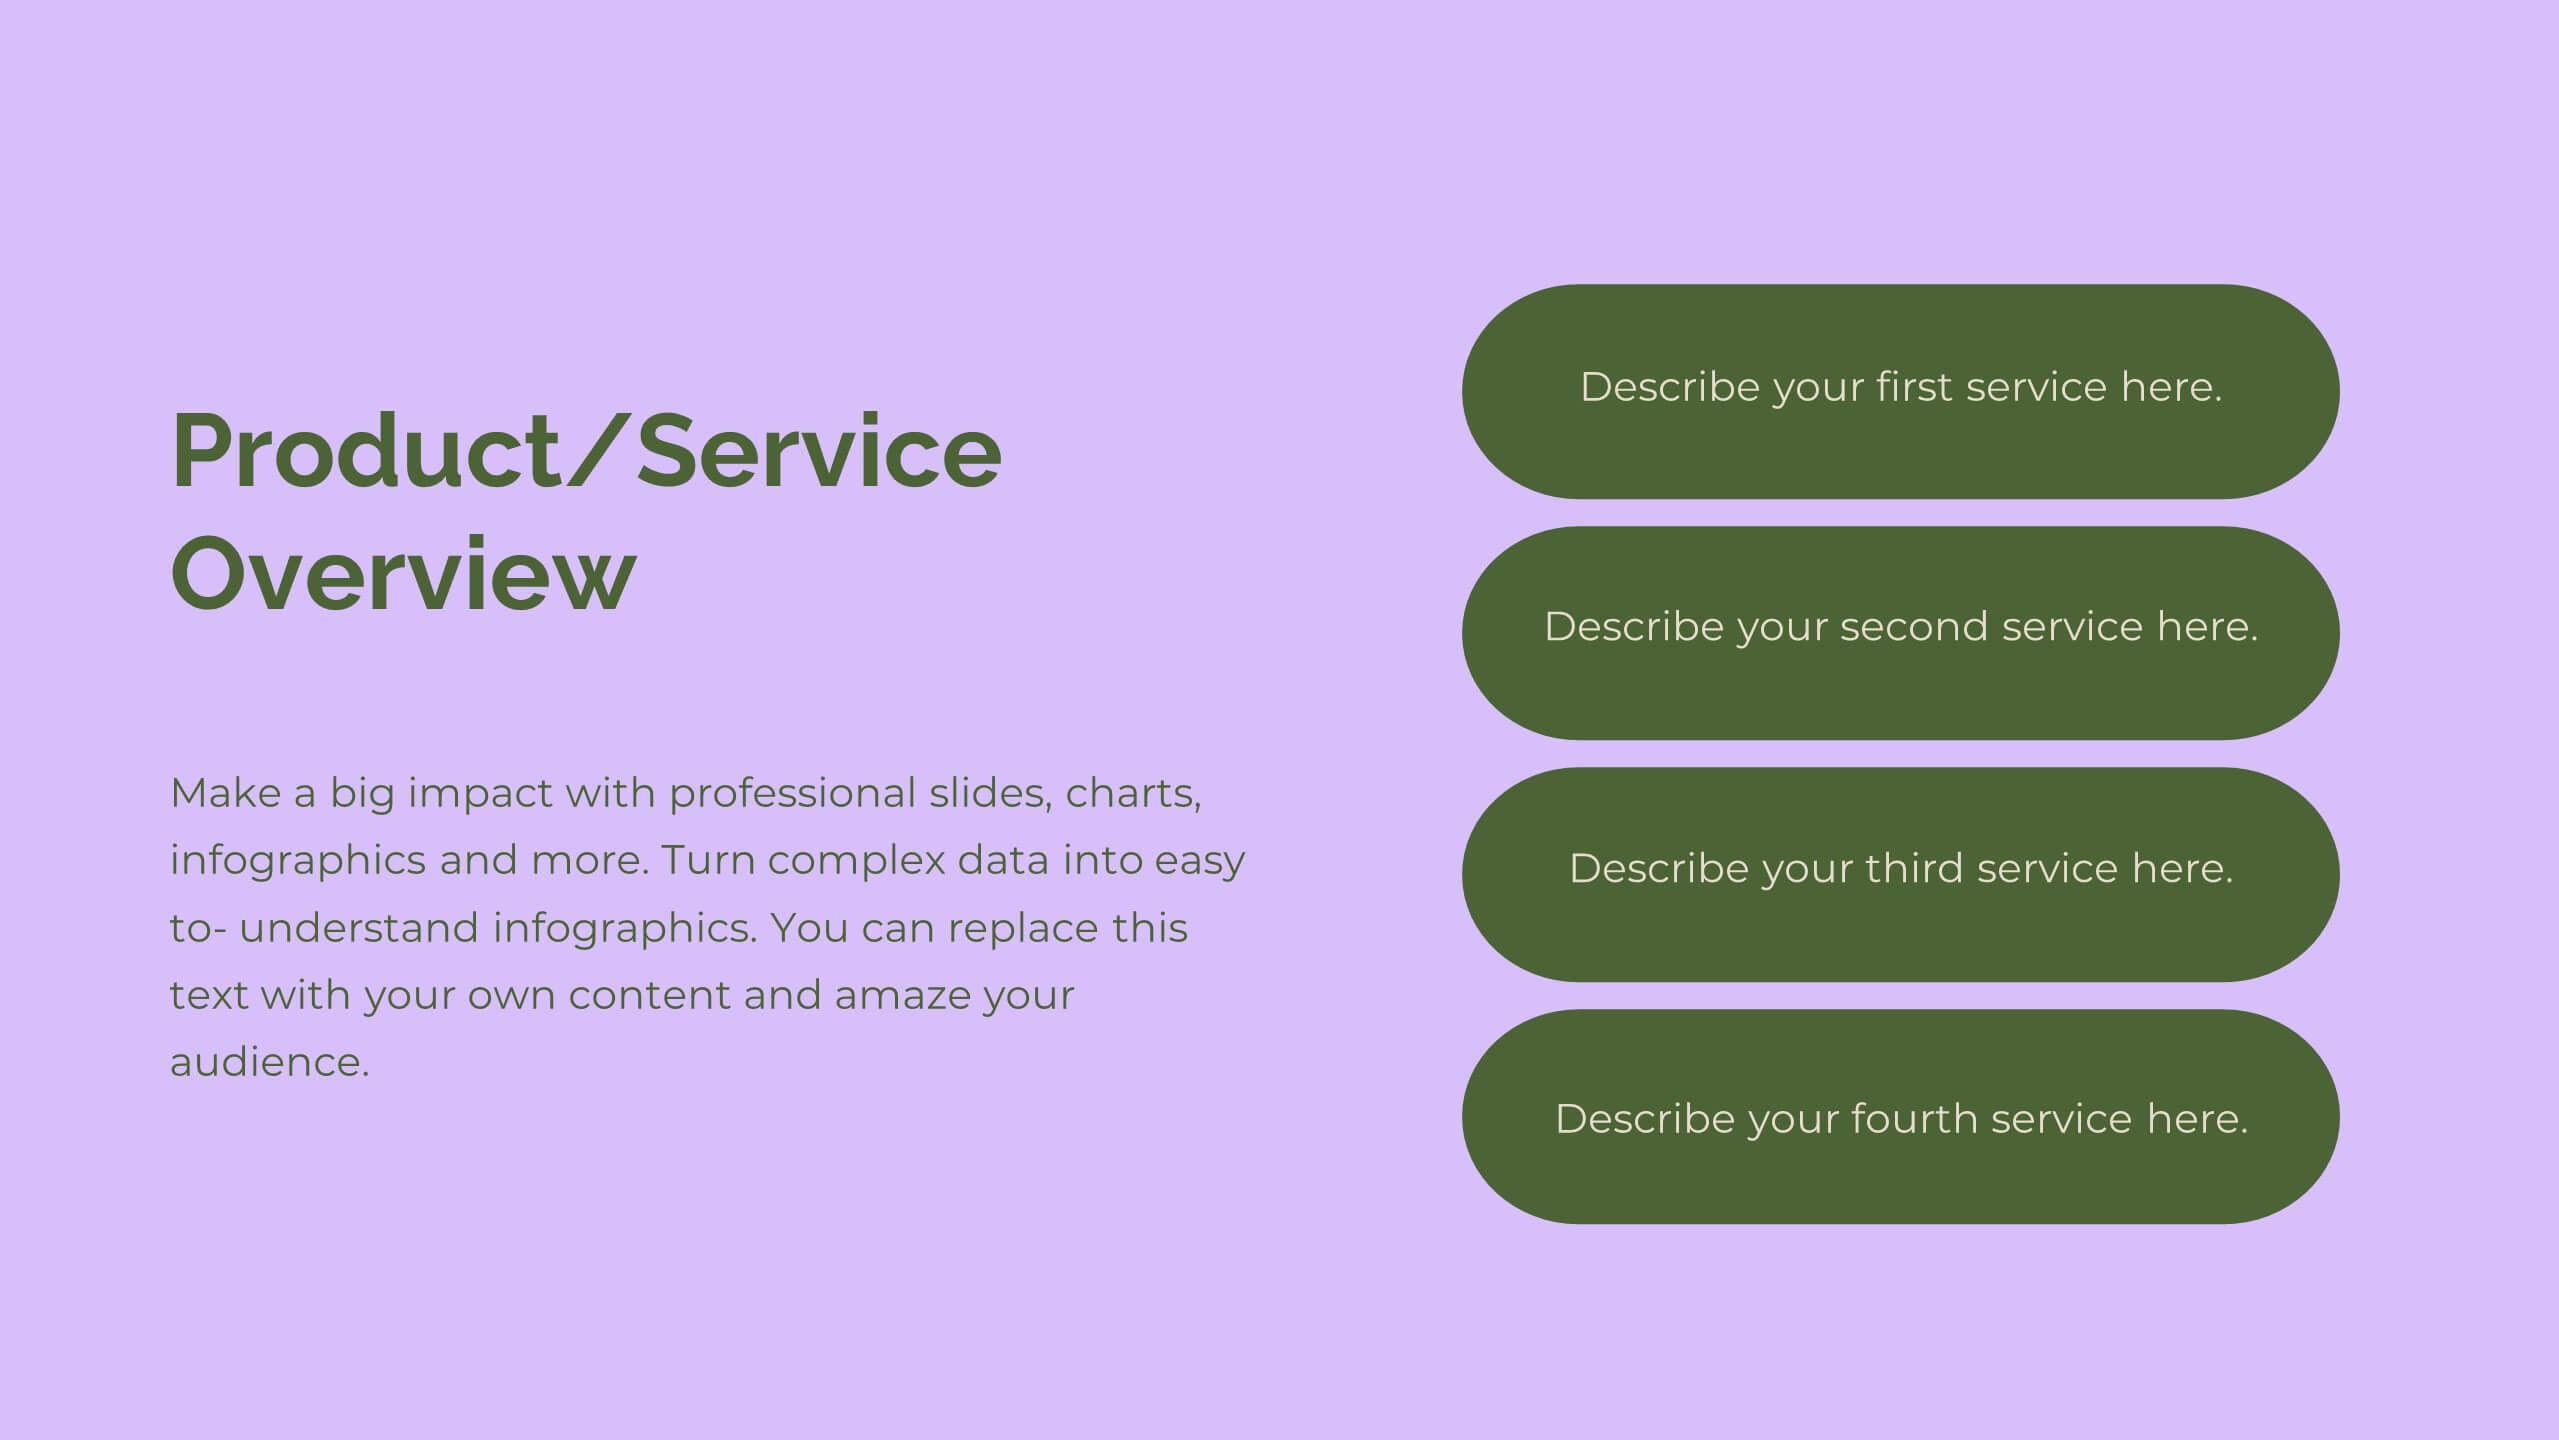
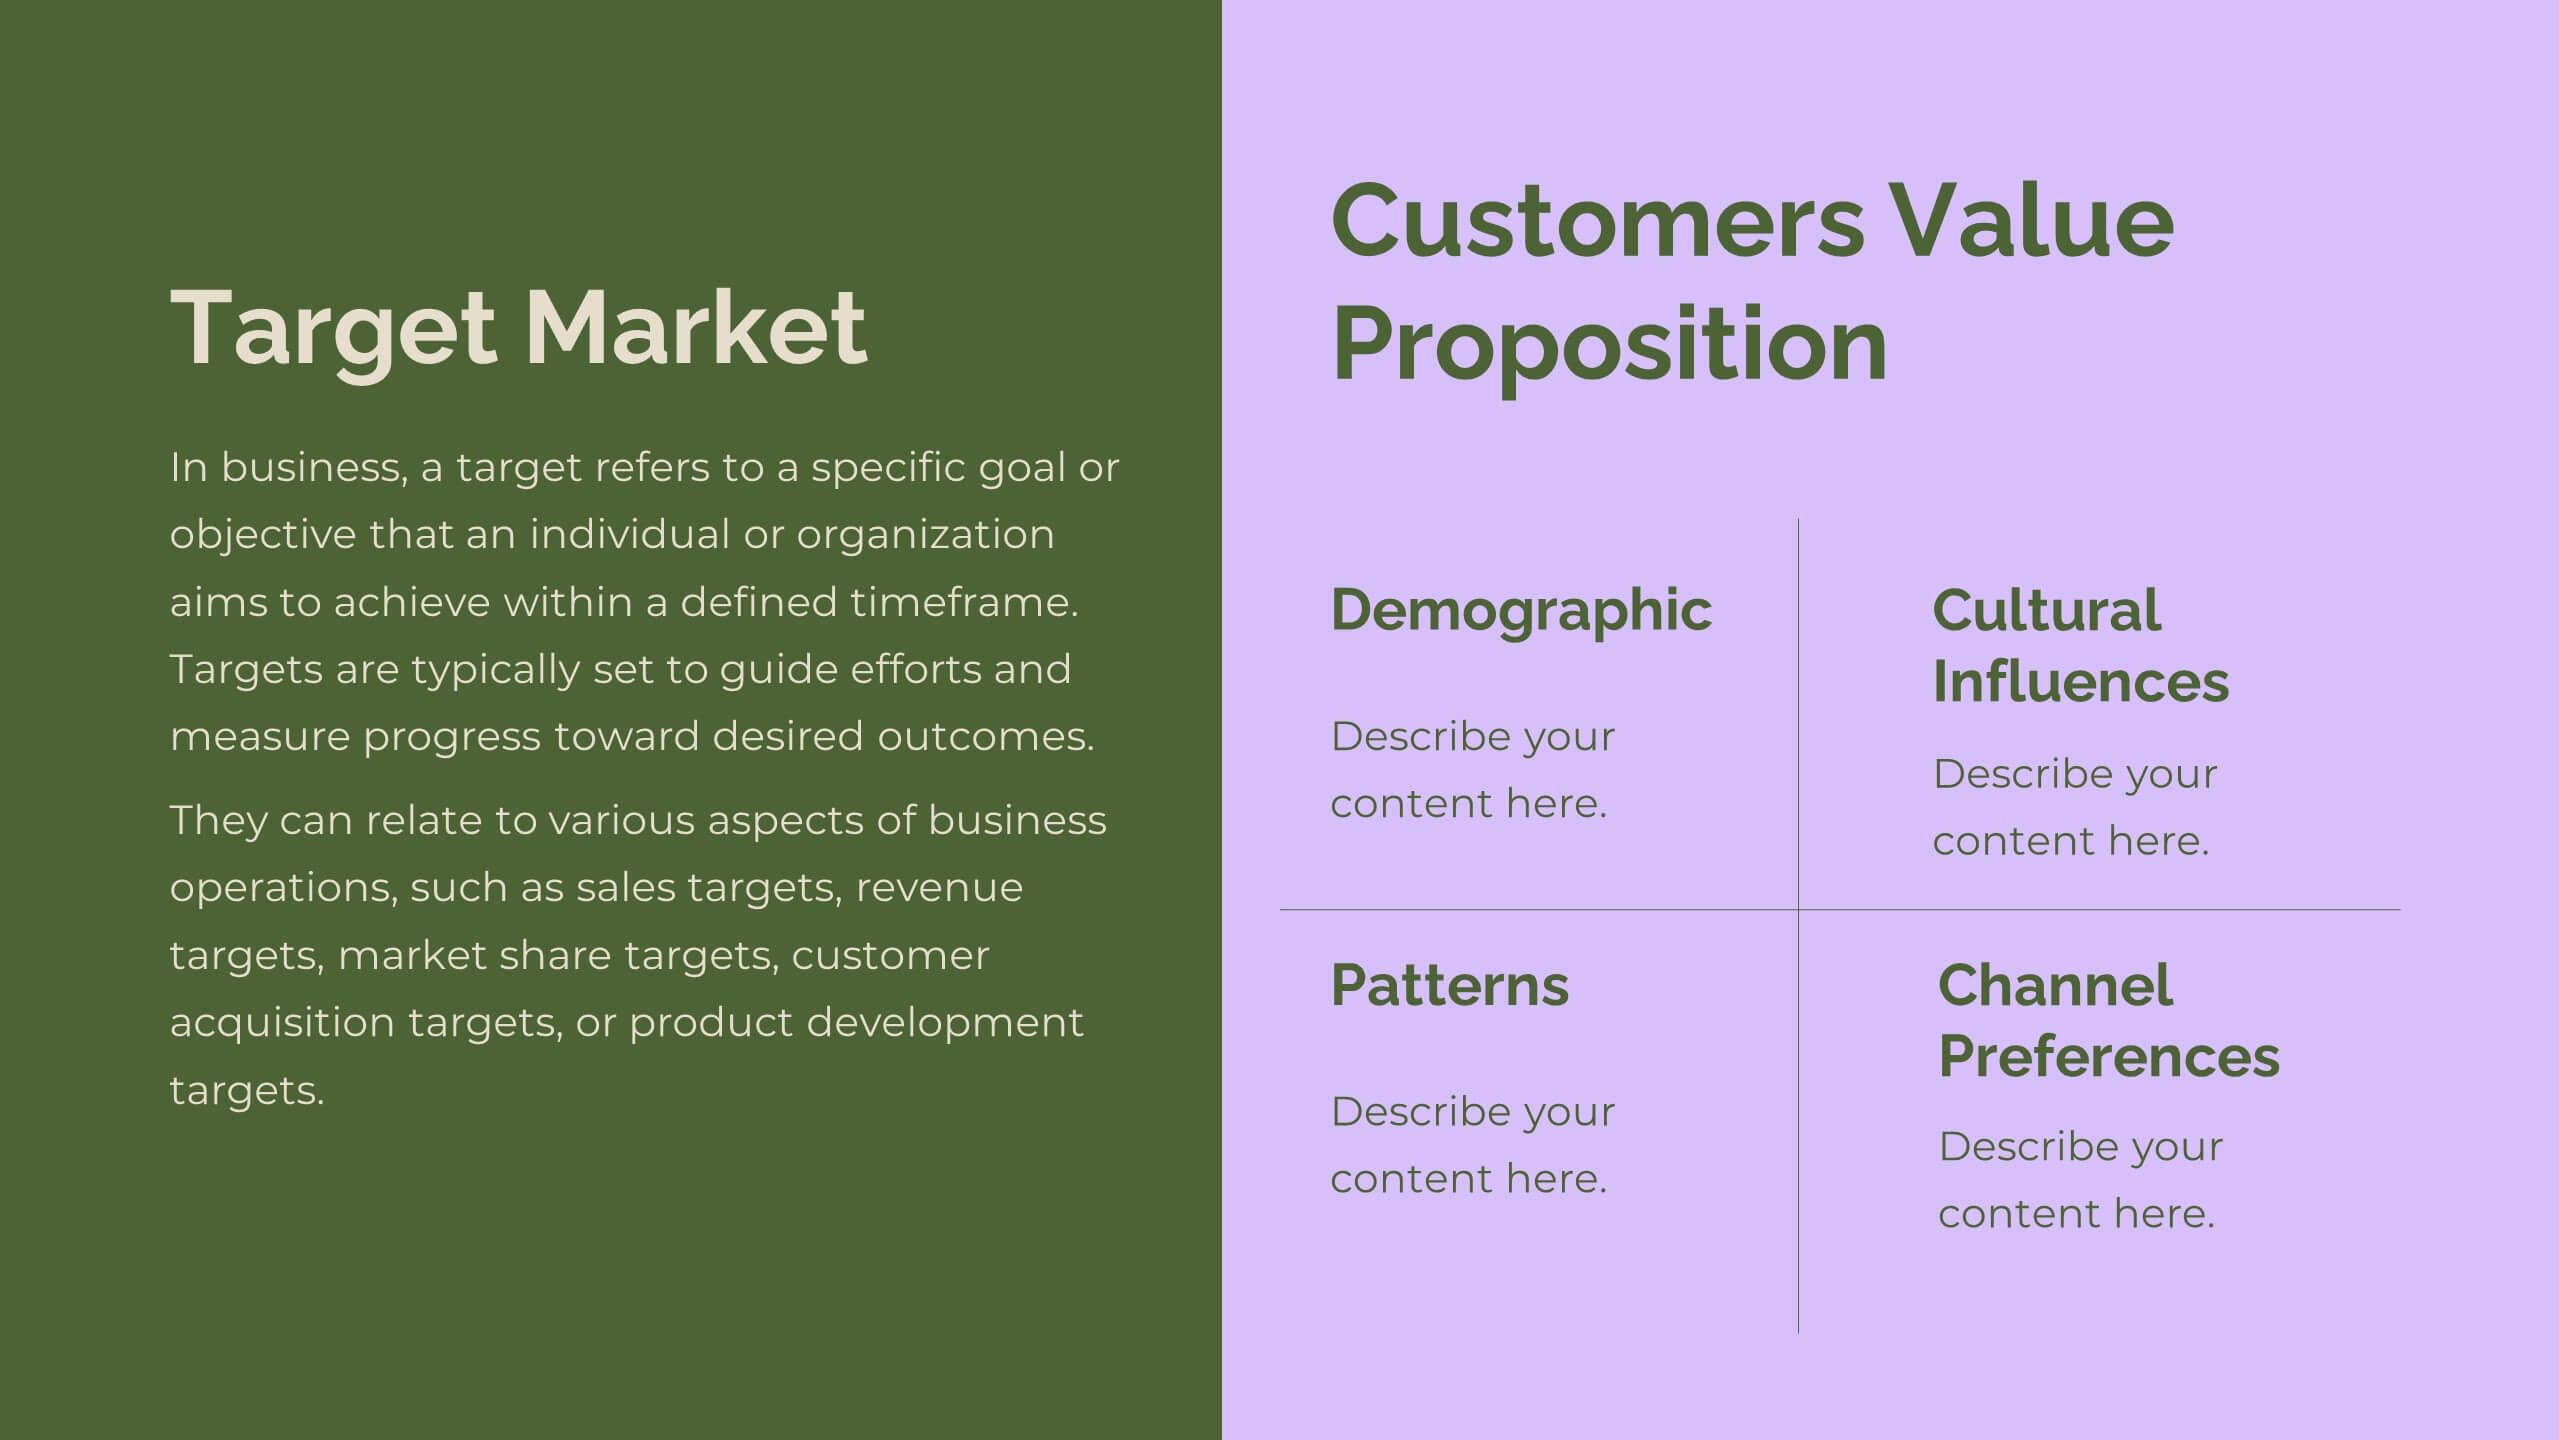
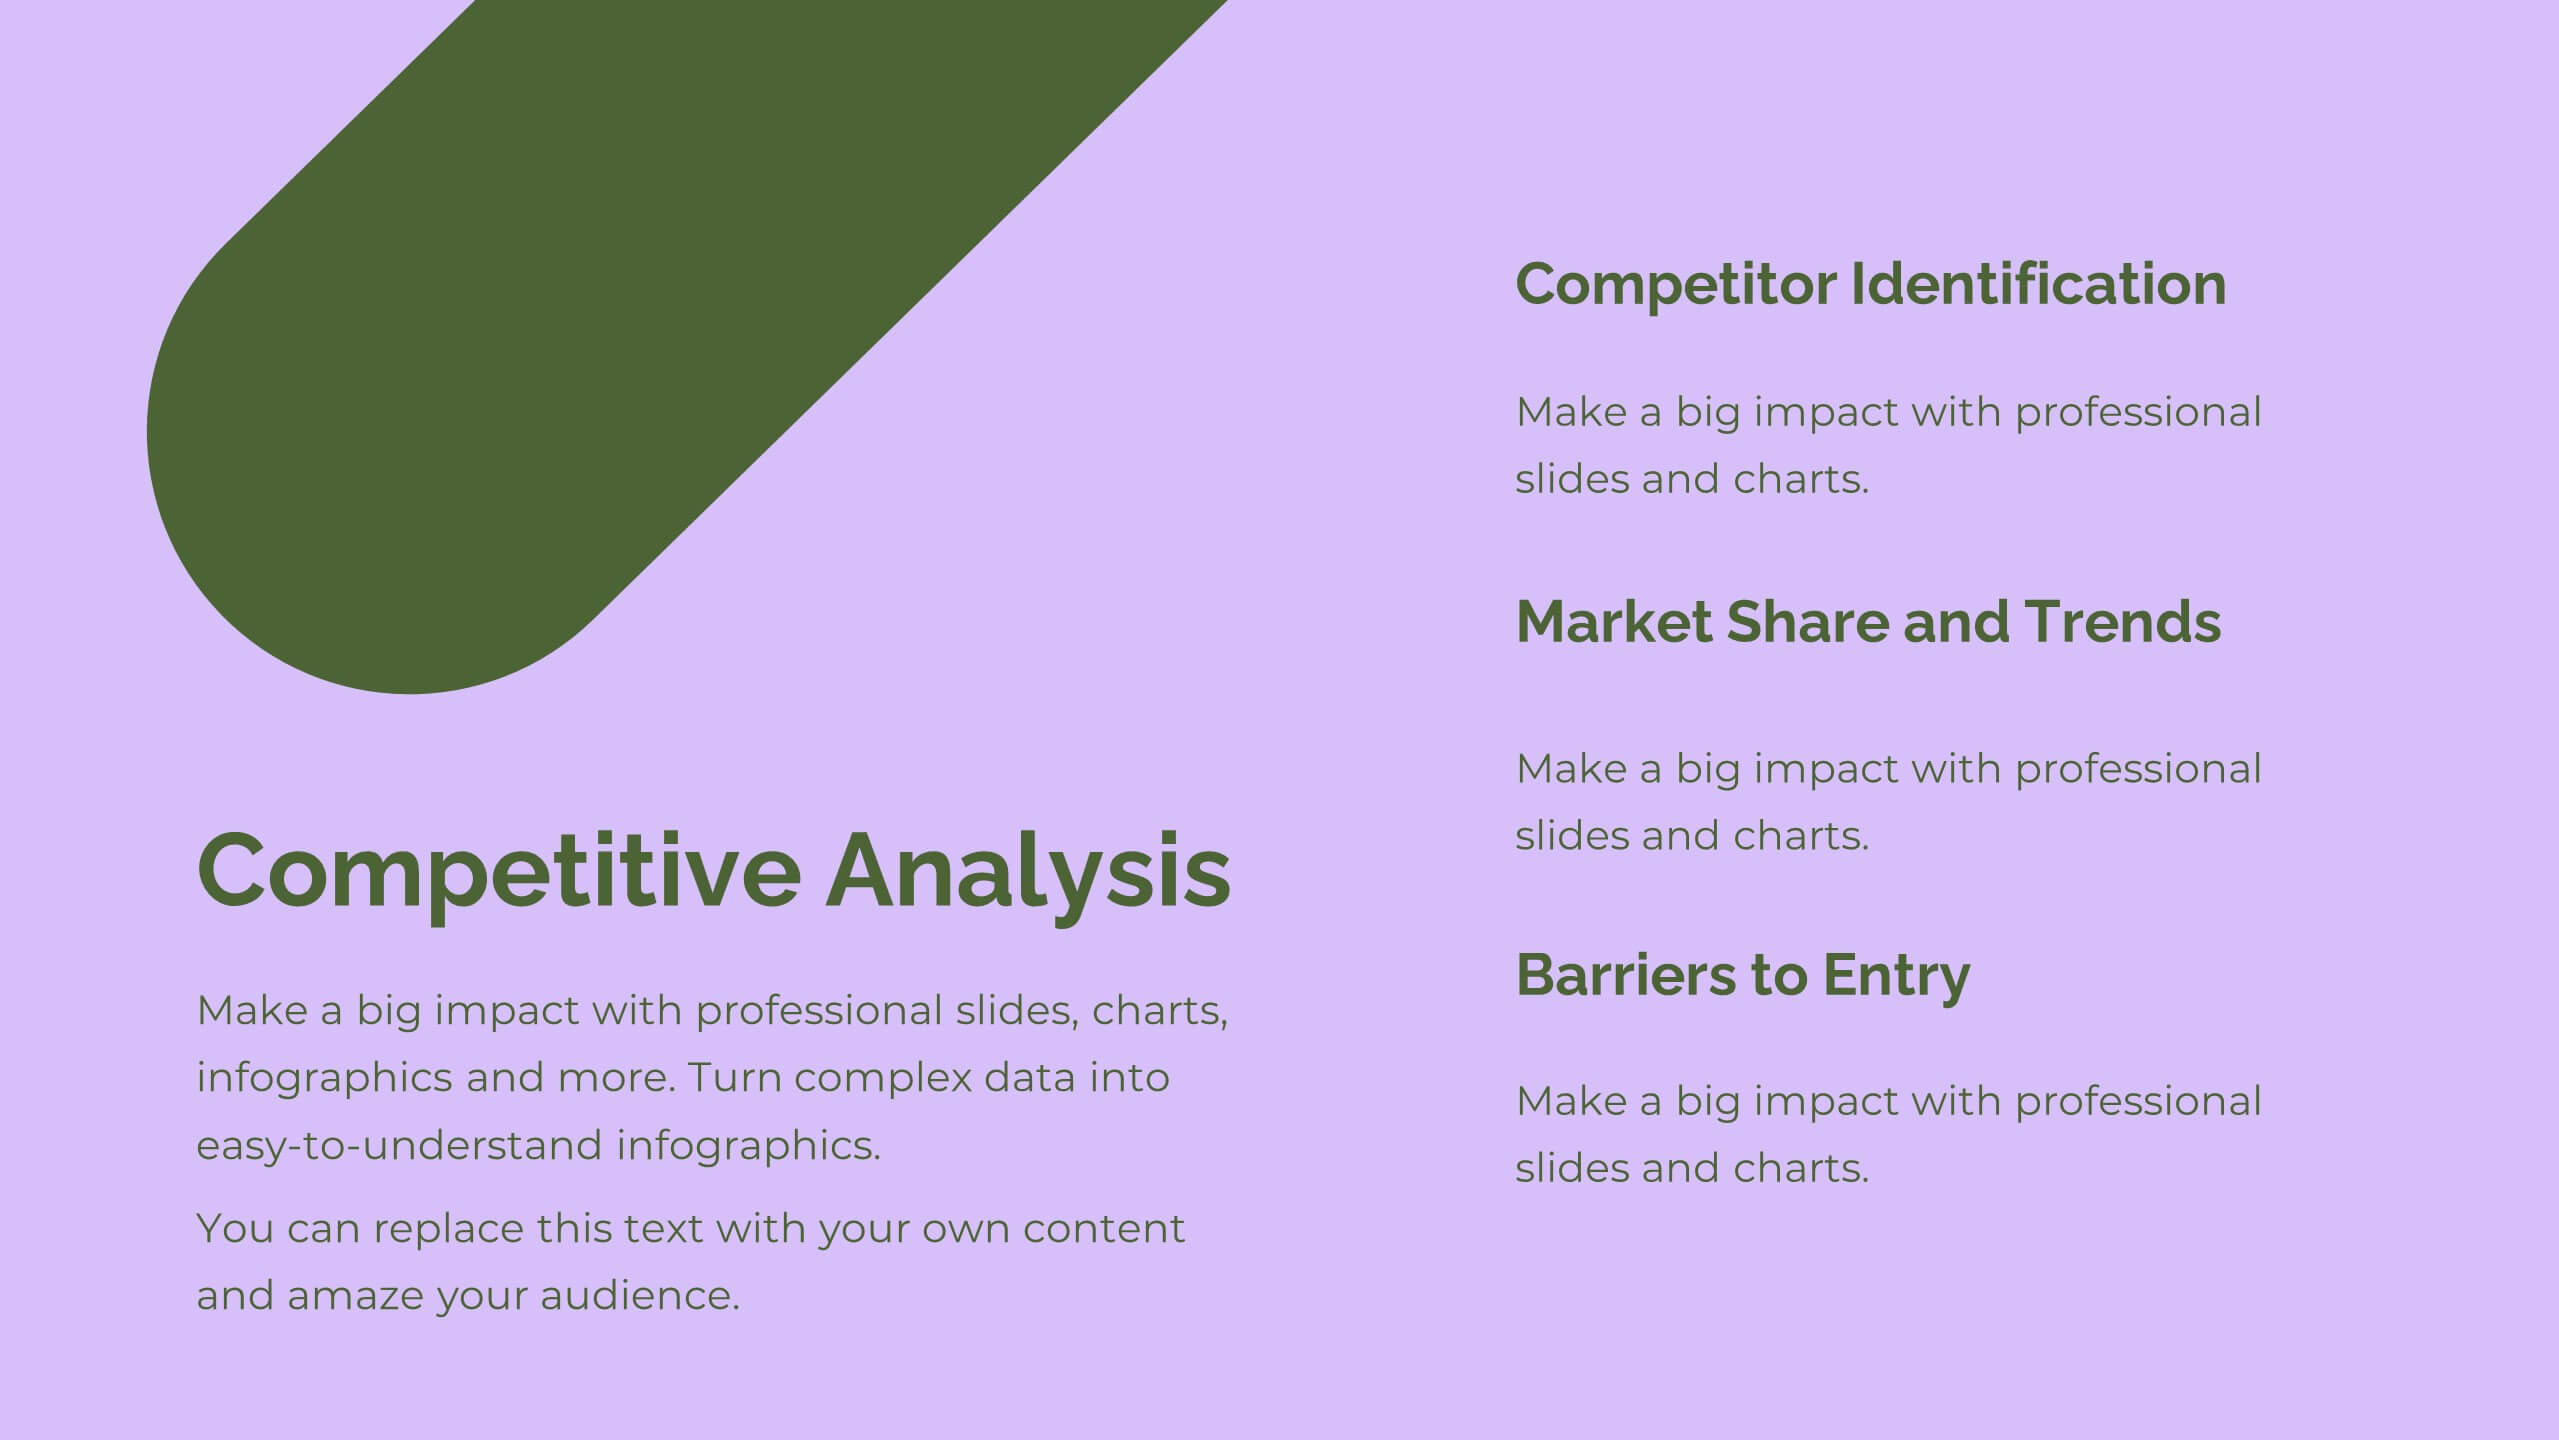
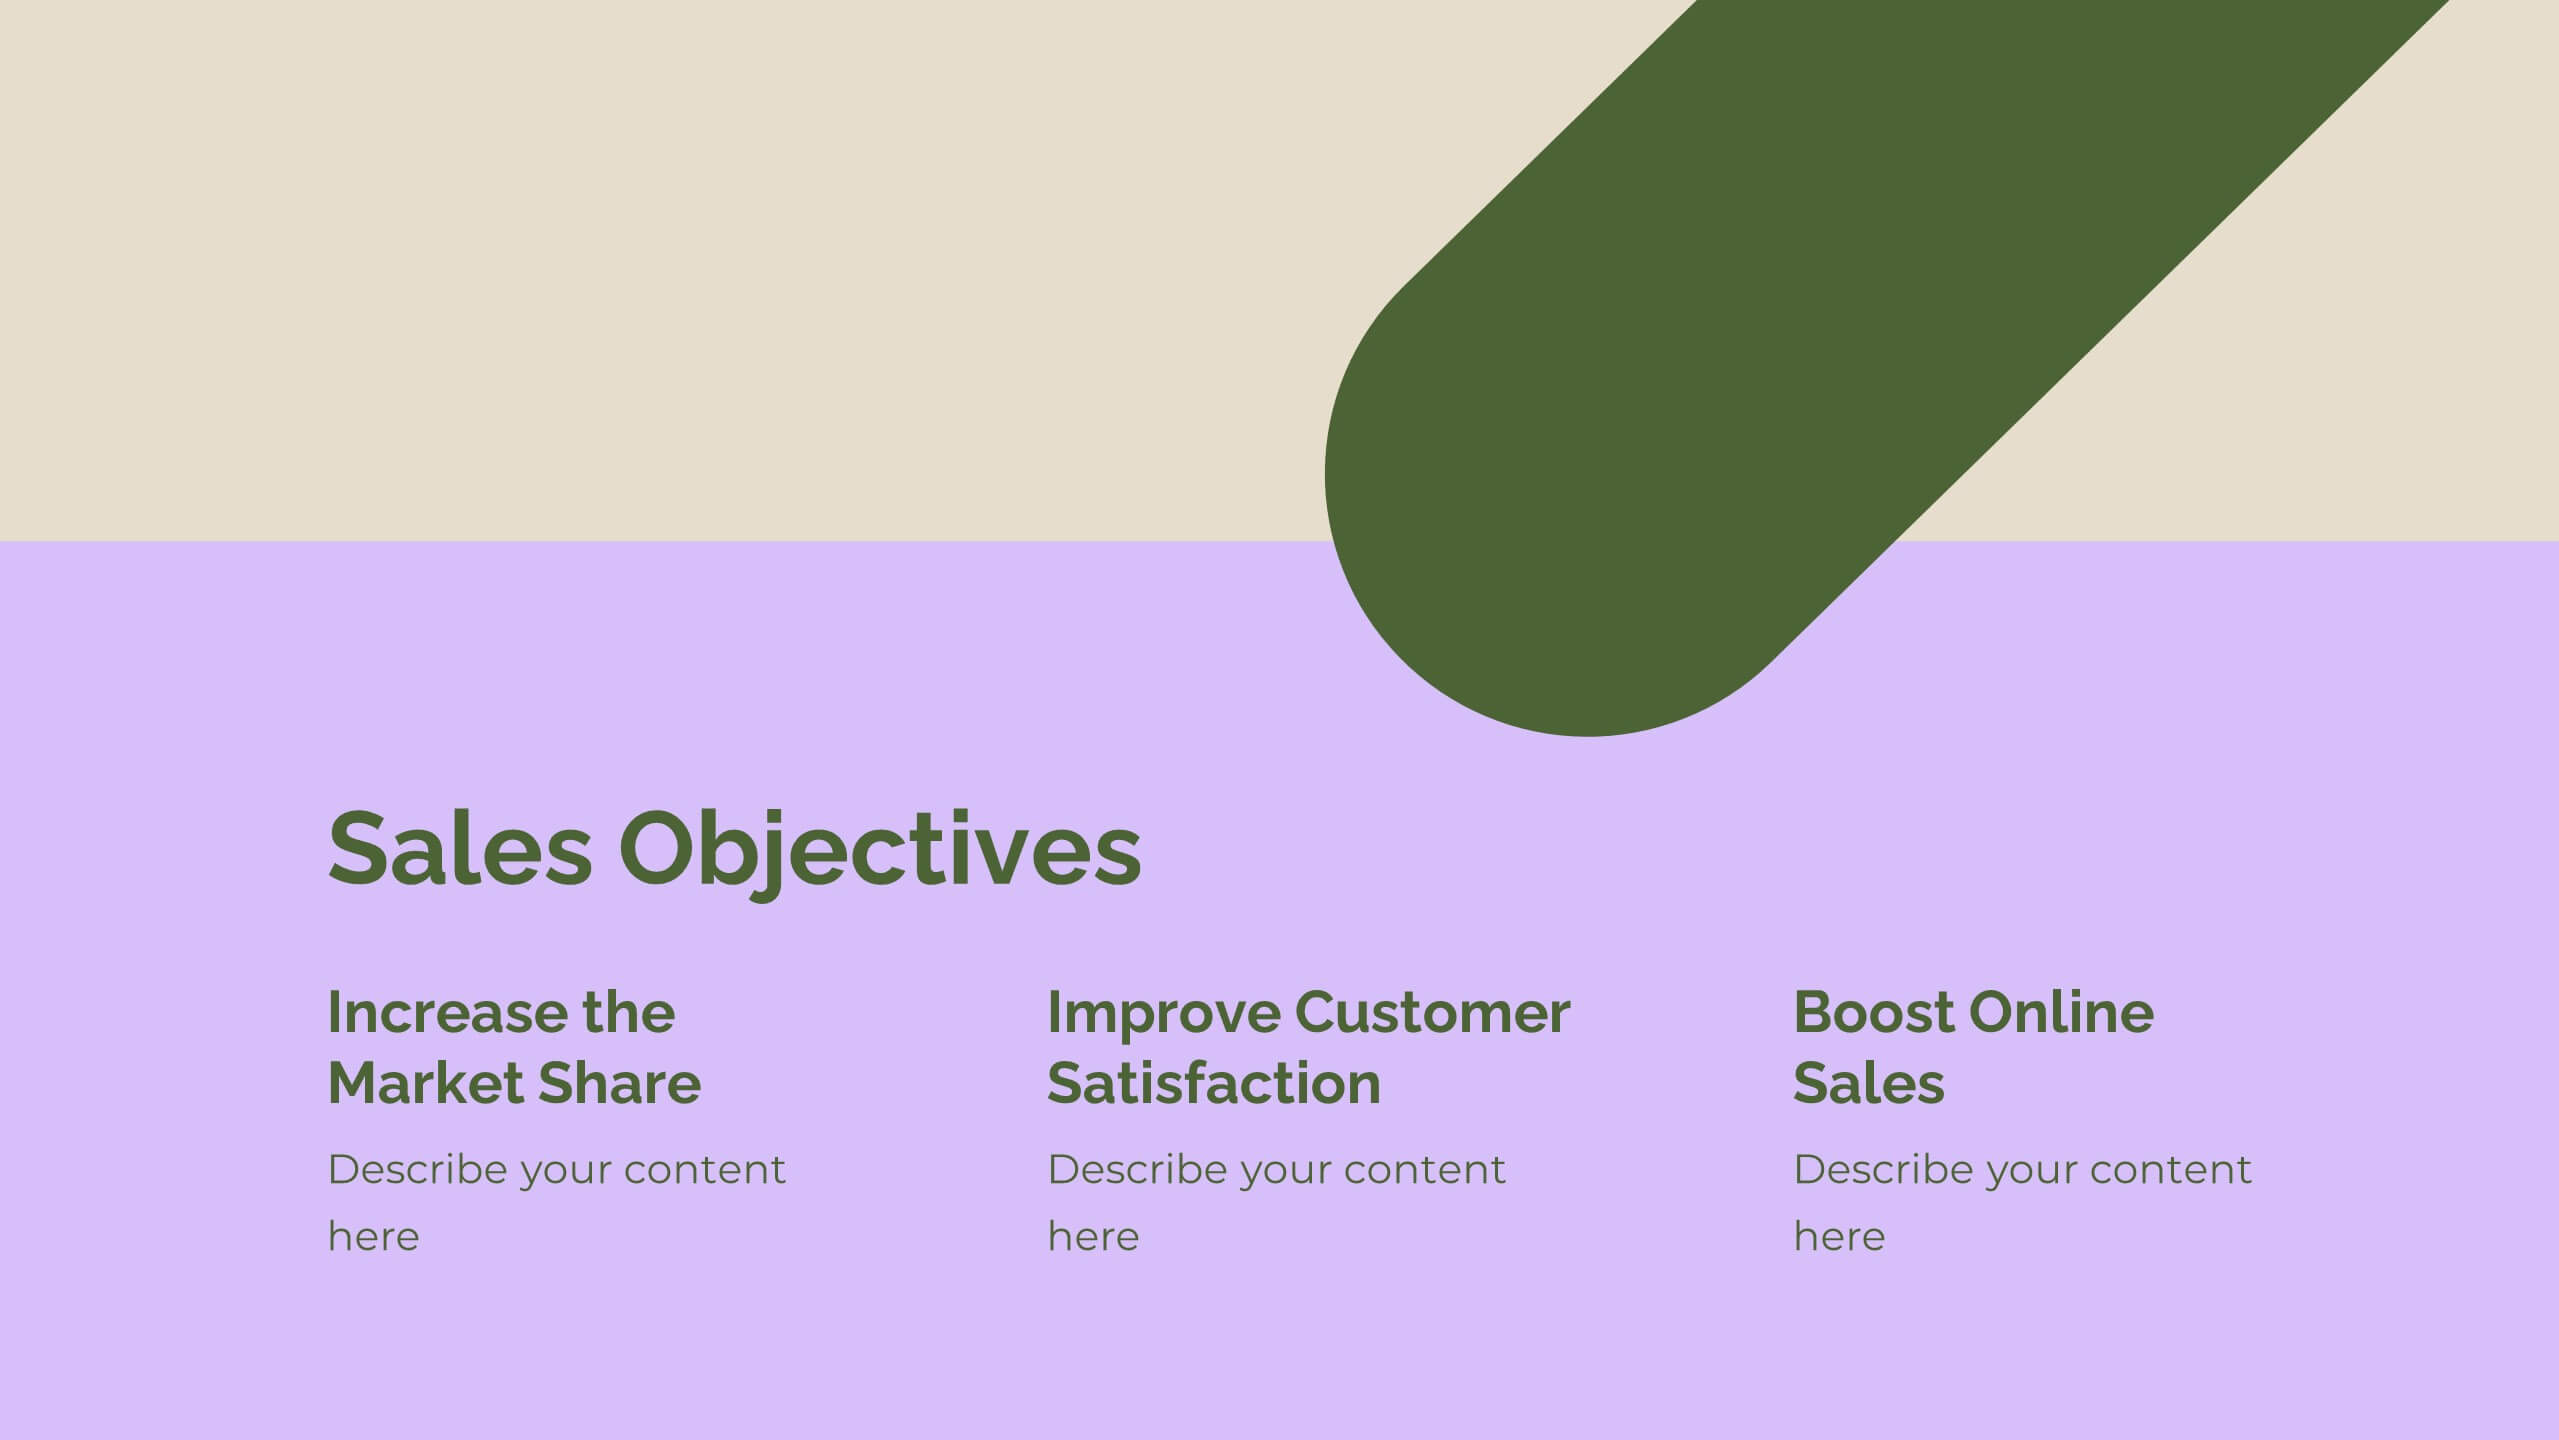
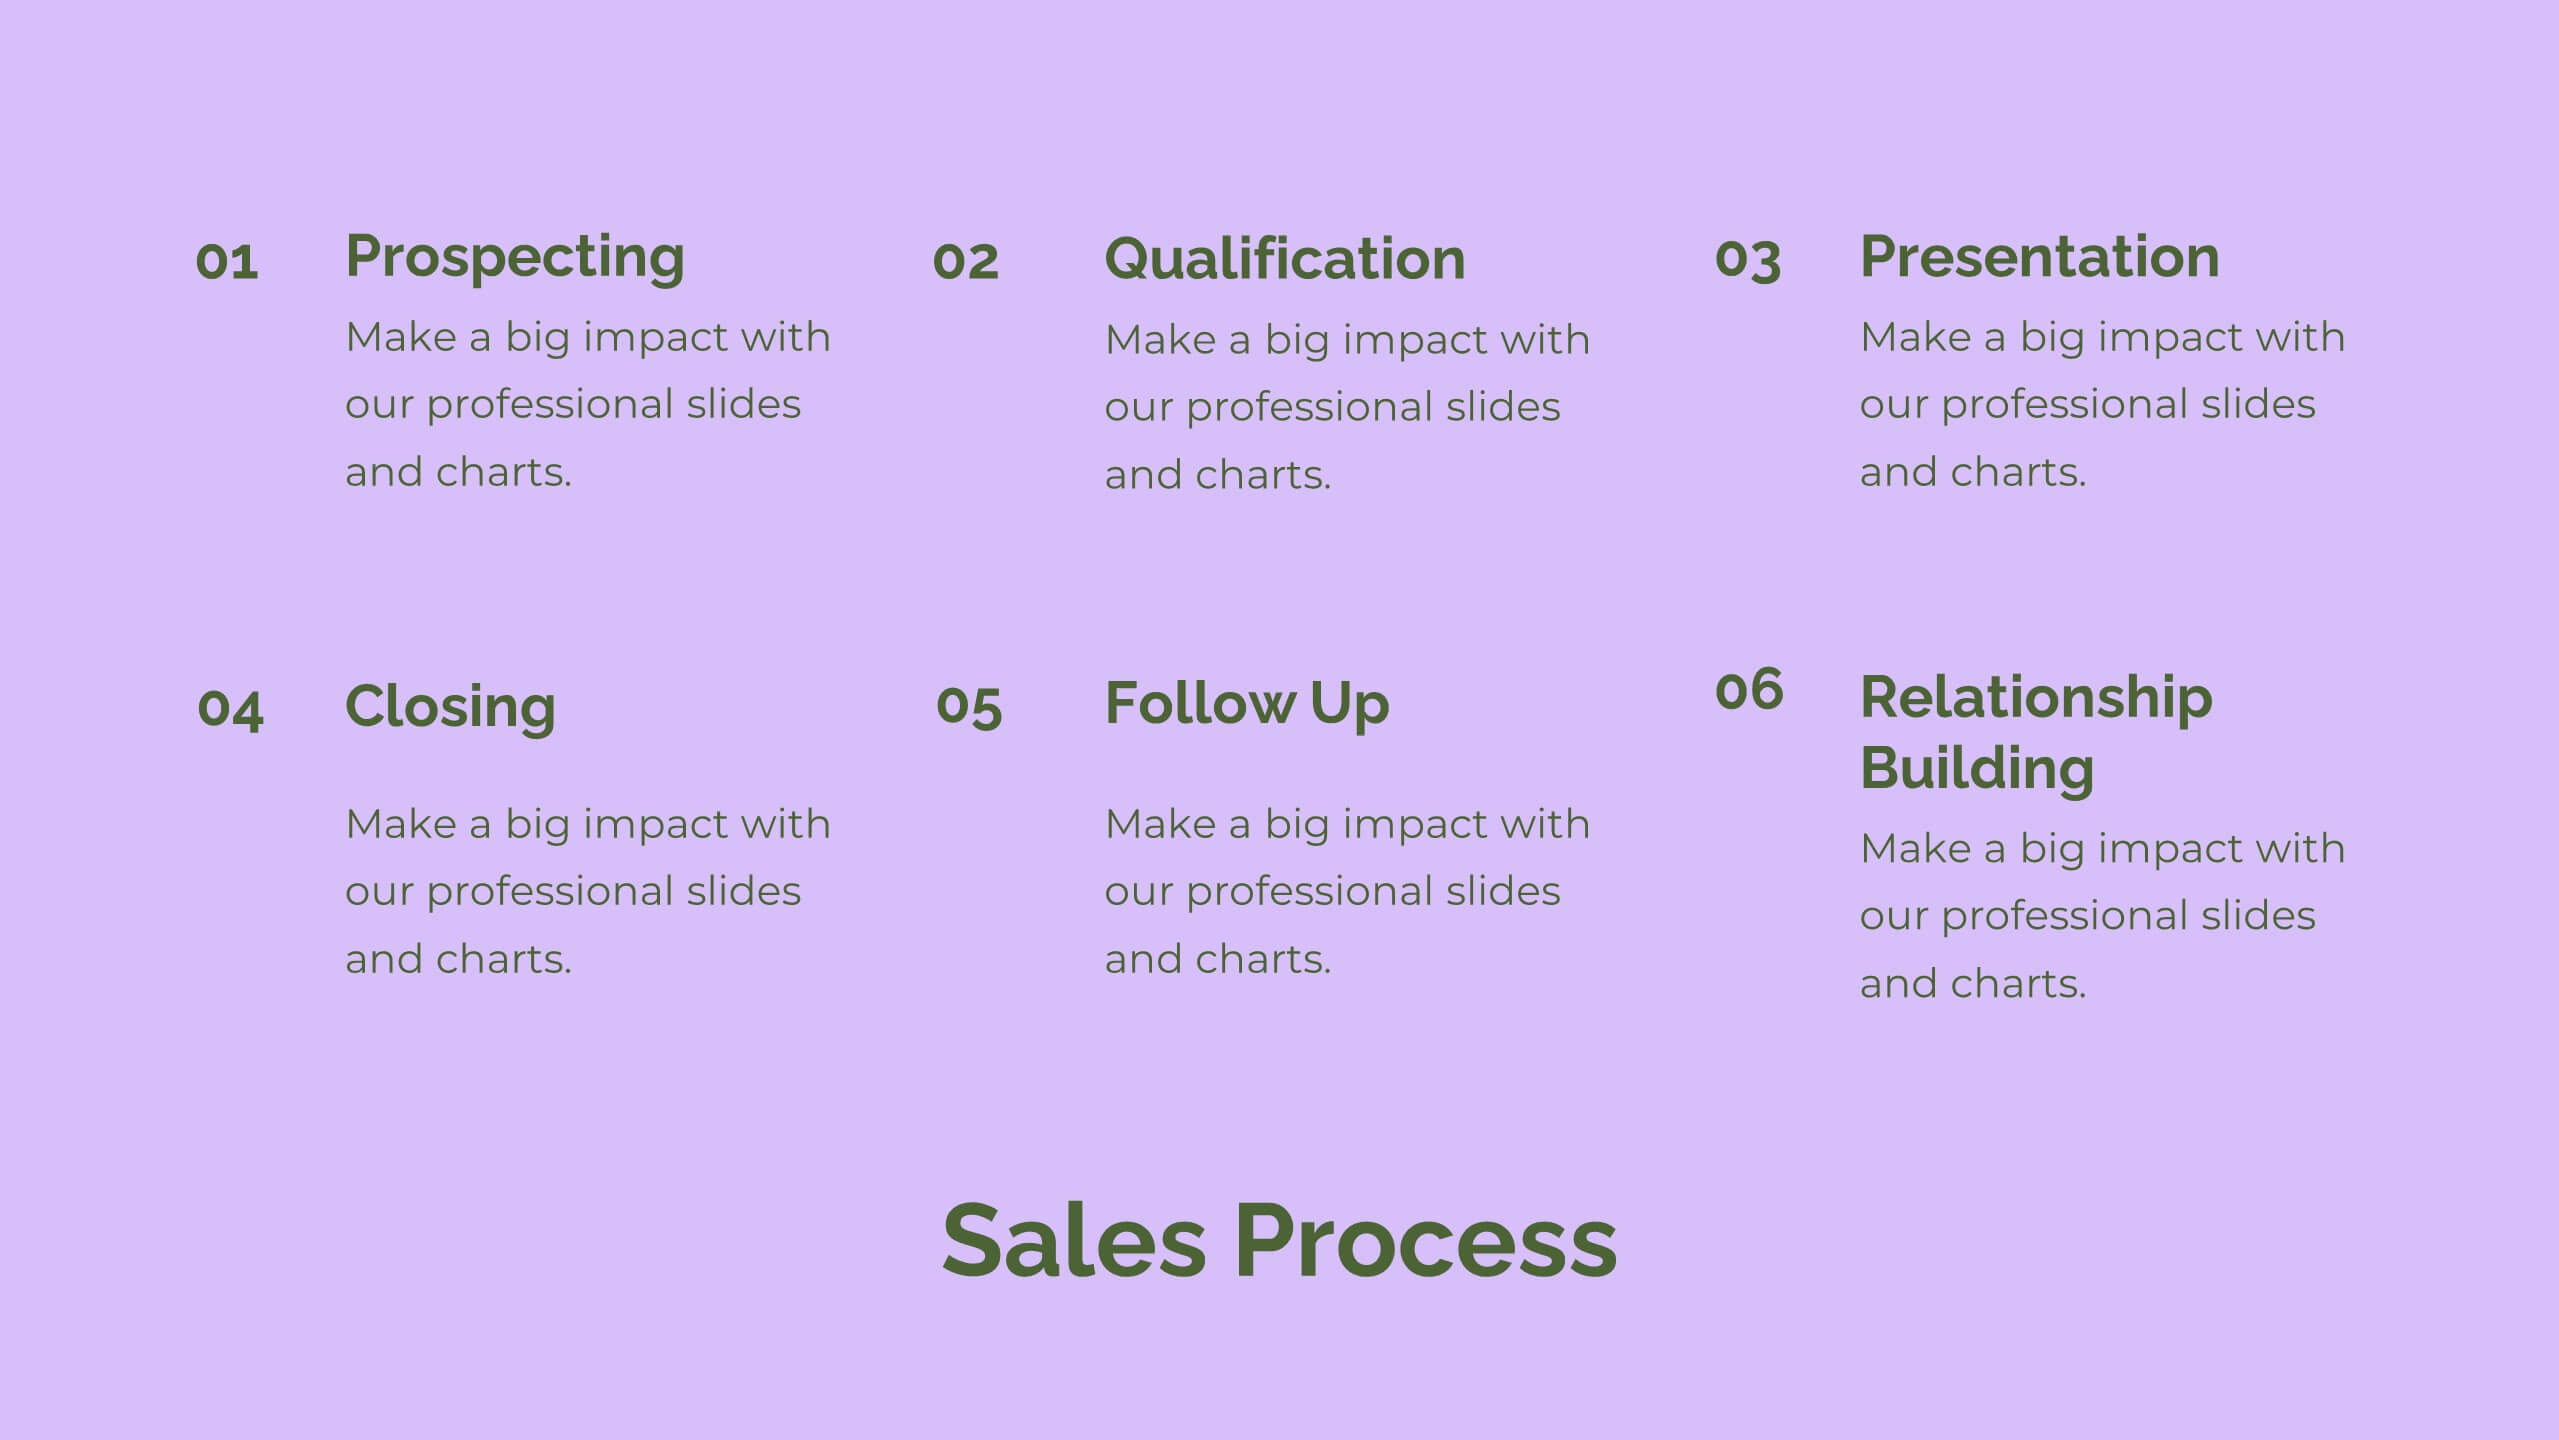
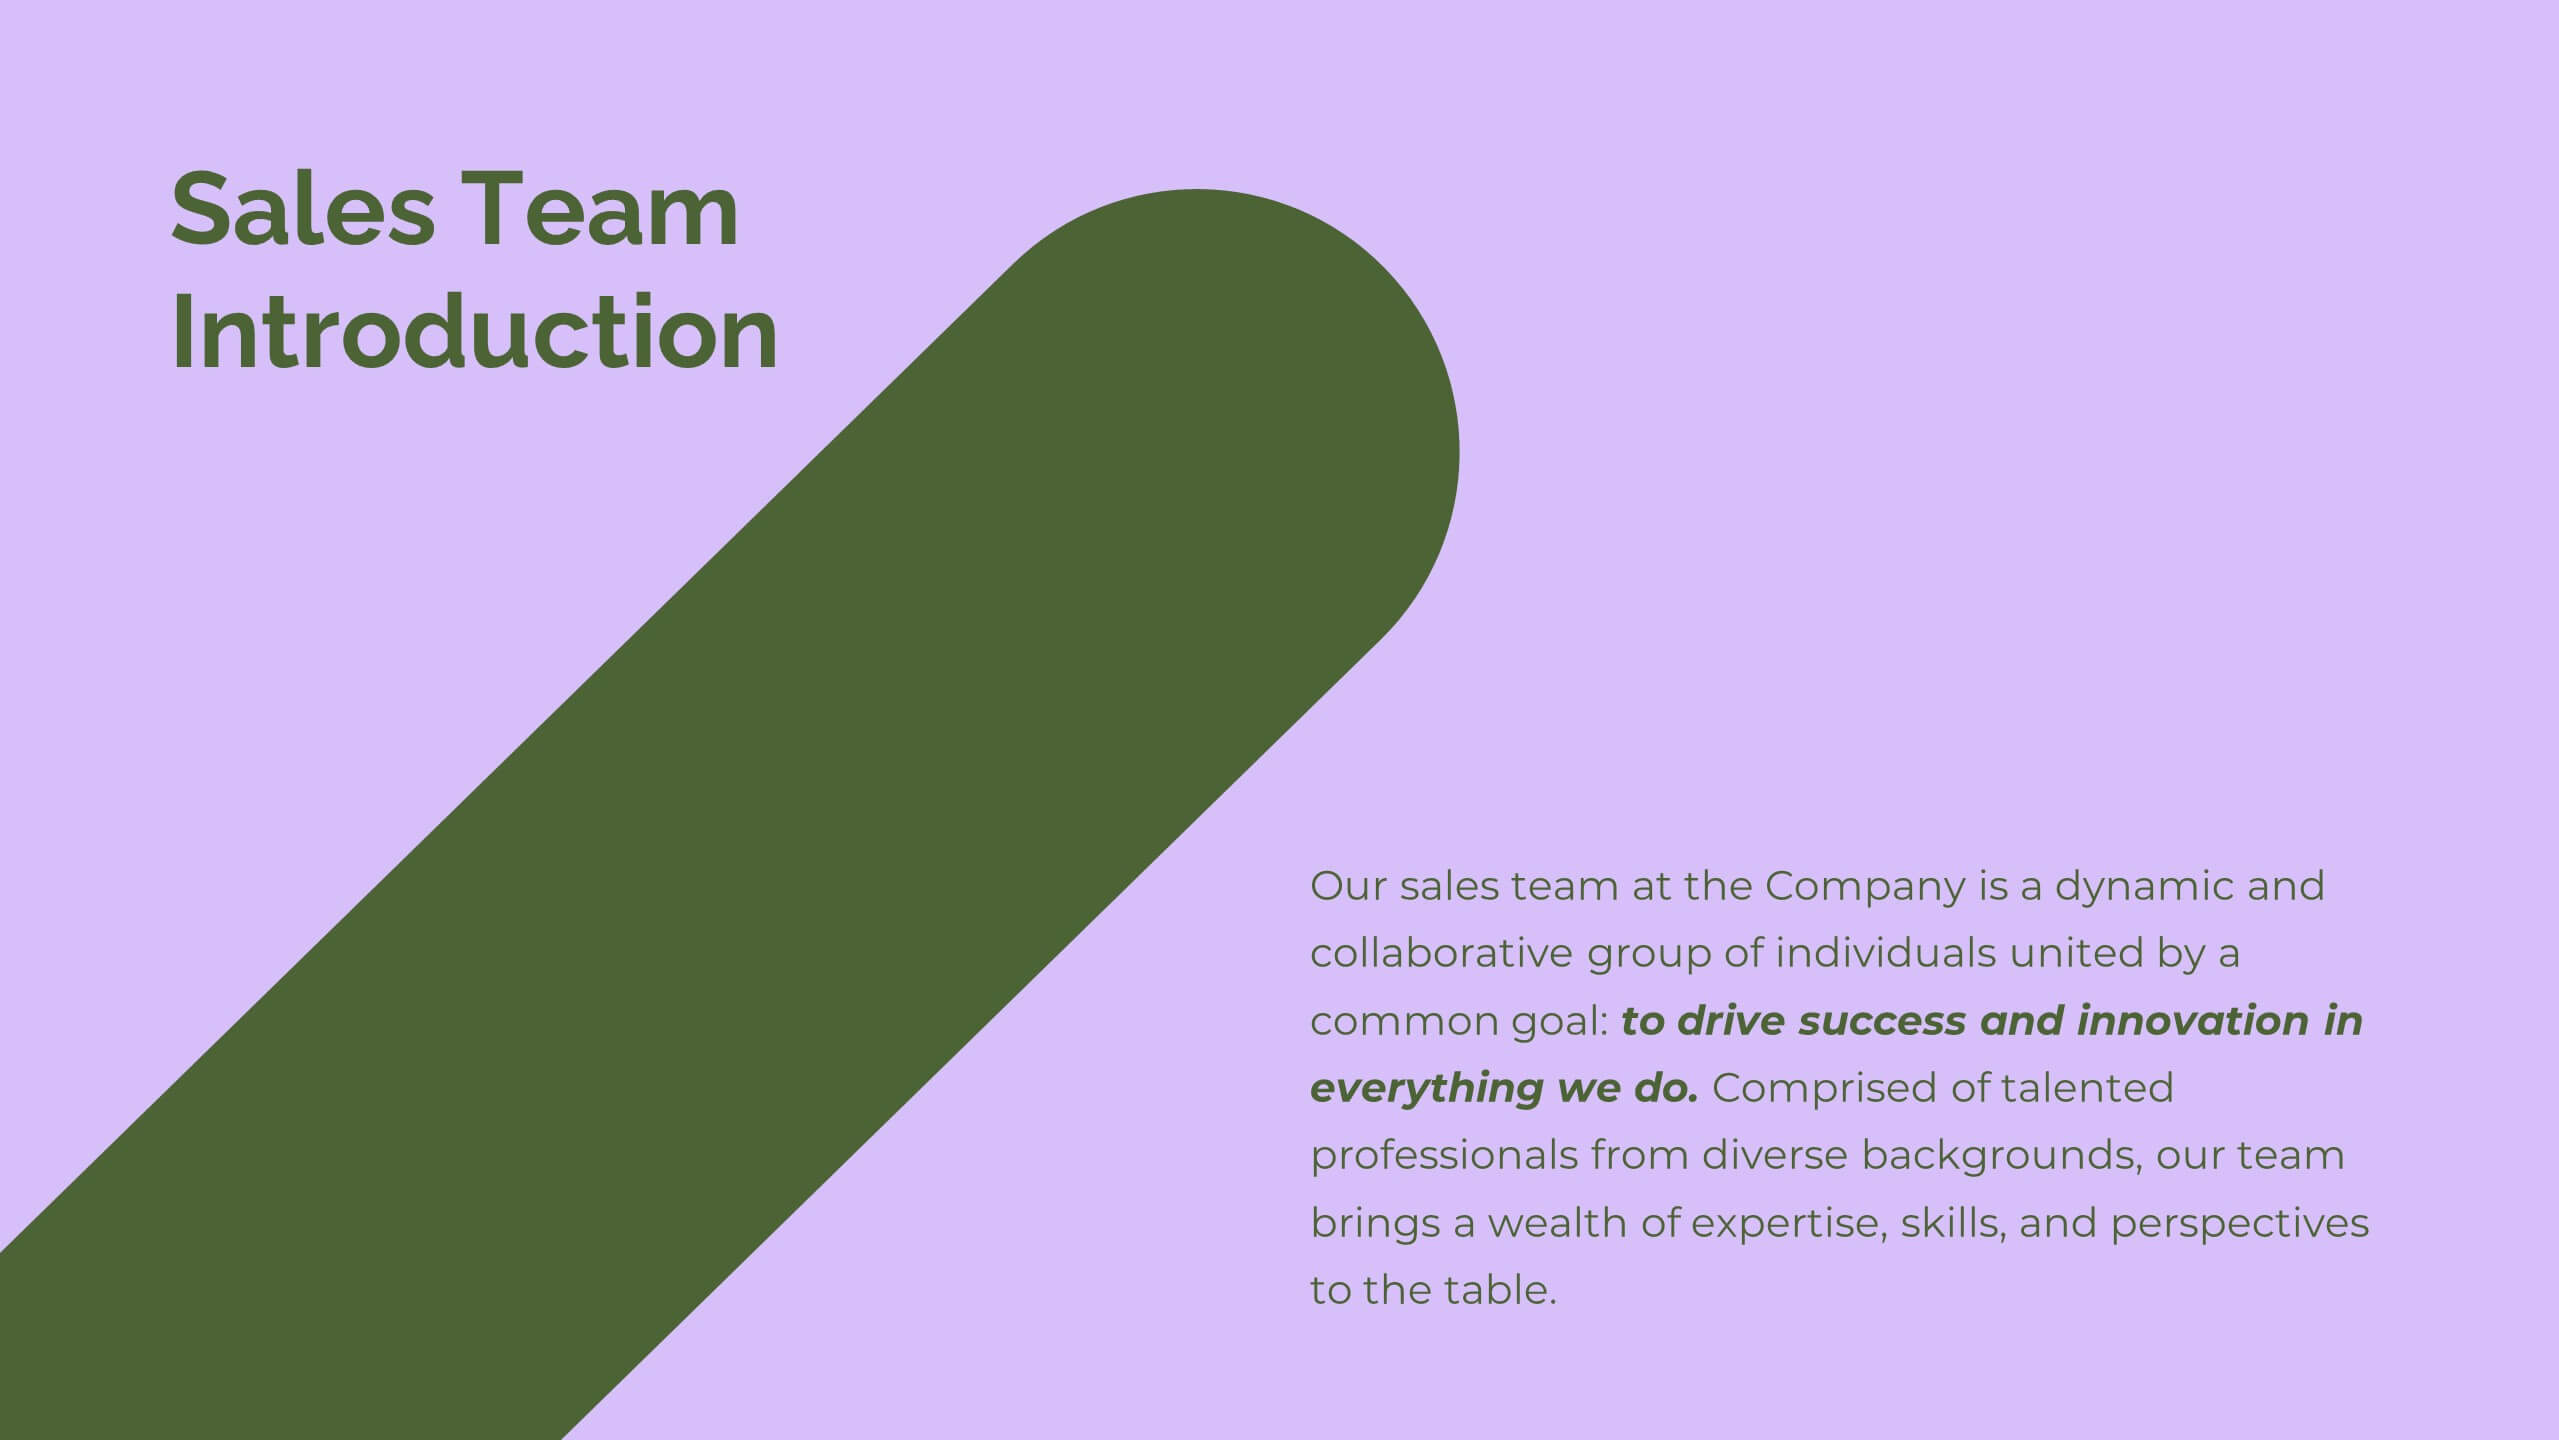
Glint Sales Strategy Presentation
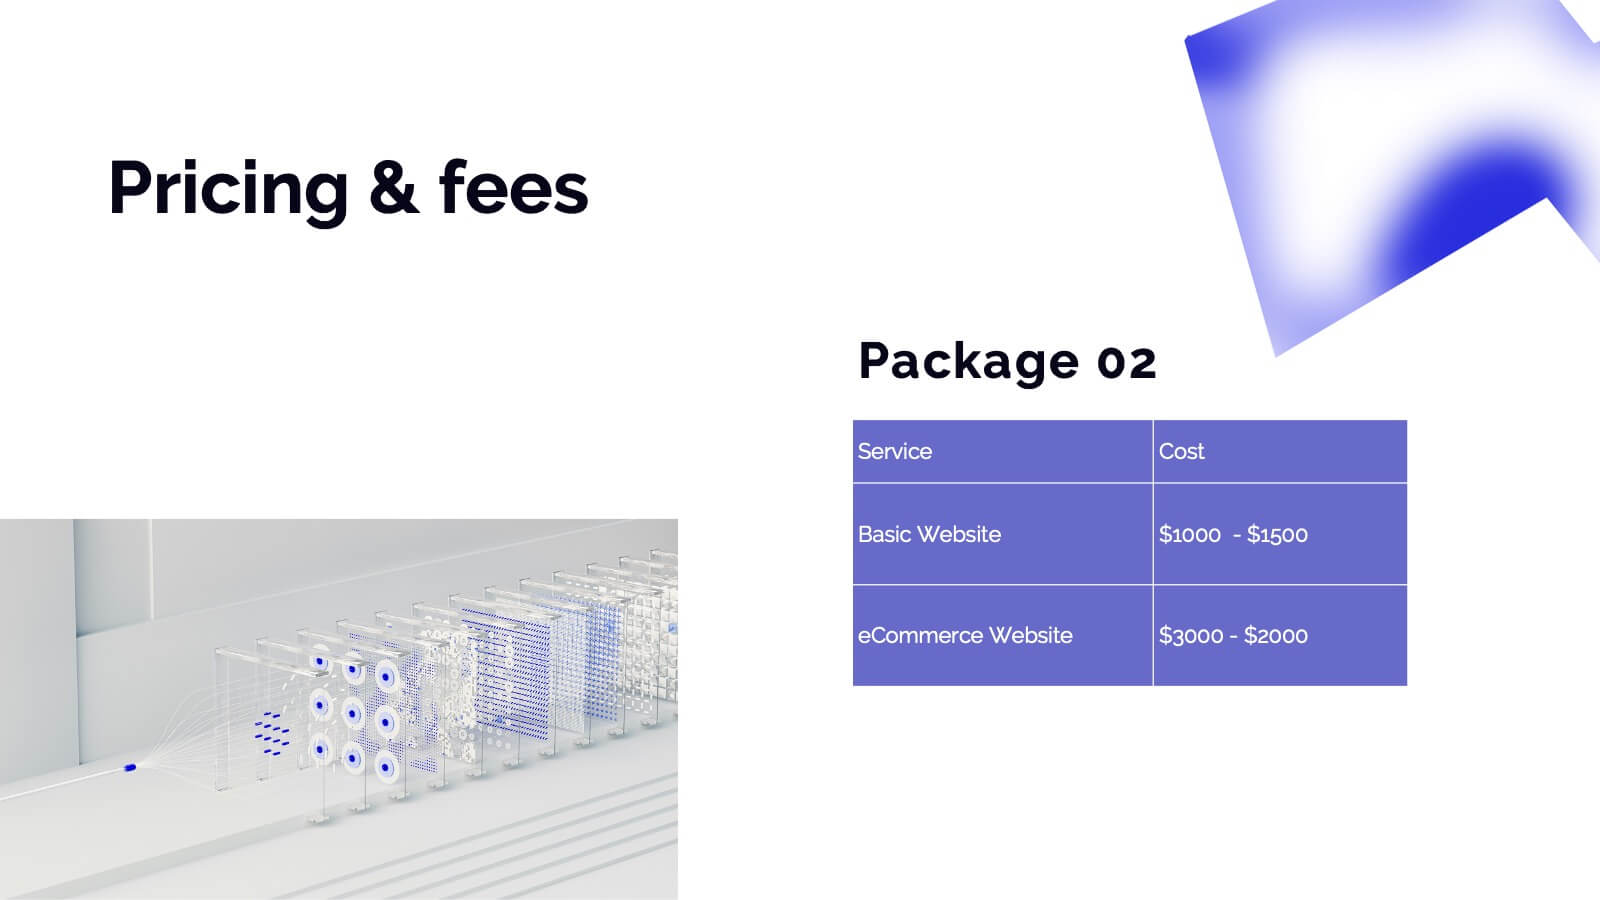
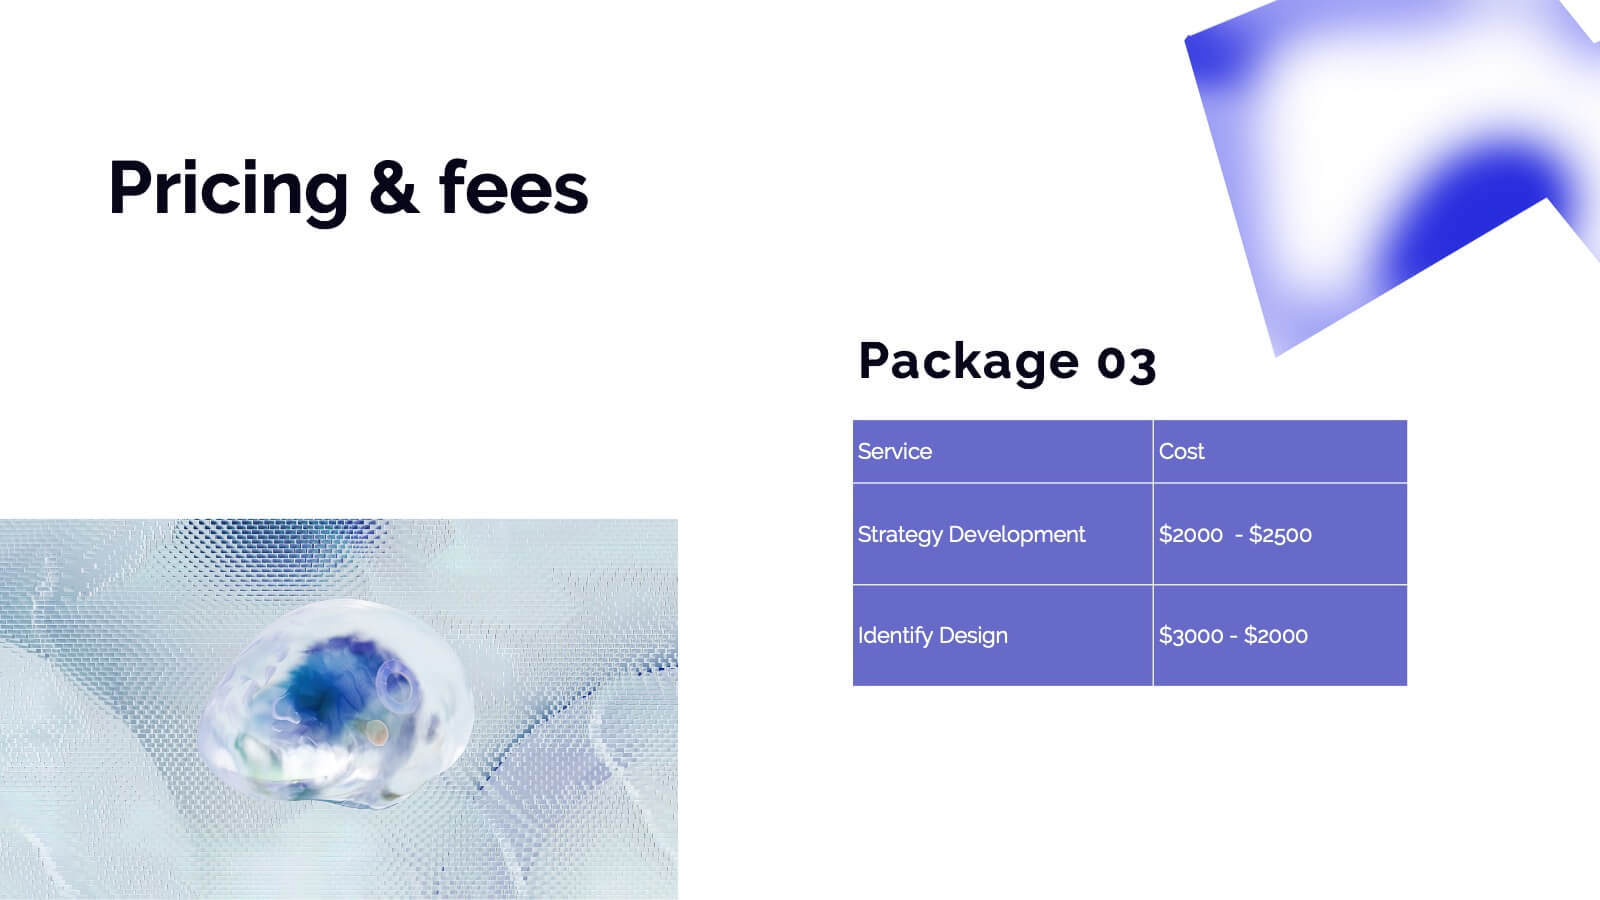
Boost your sales performance with this dynamic sales strategy template! Perfect for presenting your company overview, product details, and competitive analysis, it includes slides for sales objectives, pricing strategy, and performance metrics. Engage your team with vibrant visuals and clear, structured content. Compatible with PowerPoint, Keynote, and Google Slides for seamless presentations on any platform.


4 diapositivas
Artificial Intelligence Strategy Map Presentation
Step into the future with a clean, modern layout that makes complex technology easy to grasp and exciting to explore. This presentation helps you break down emerging innovations, real-world applications, and industry opportunities using clear visuals and structured sections. Fully customizable and compatible with PowerPoint, Keynote, and Google Slides.


6 diapositivas
Circular Business Wheel Model Presentation
Break down your strategy into dynamic segments with this Circular Business Wheel Model. This layout is ideal for showcasing interconnected business areas like sustainability, innovation, monetization, and market appeal. Perfect for strategy decks, business planning, and growth presentations. Compatible with PowerPoint, Keynote, and Google Slides—fully editable for your needs.


21 diapositivas
Whisperleaf Startup Strategy Presentation
This vibrant startup strategy template sets the stage for success with structured content and bold design. Highlight your mission, vision, product overview, and competitive landscape all in one place. Perfect for conveying business models, market insights, and growth strategies with clarity. Editable in PowerPoint, Keynote, and Google Slides for ultimate flexibility.


22 diapositivas
Nimbus Project Milestones Report Presentation
This project plan template offers a modern, vibrant design that clearly outlines key project components, including problem statements, objectives, deliverables, timelines, and risk management. It’s perfect for teams looking to present a comprehensive project overview. Compatible with PowerPoint, Keynote, and Google Slides for impactful presentations with a polished look!


19 diapositivas
Kinetic Sales Forecast Presentation
Forecast your sales with style using this vibrant template! Perfect for detailing company overview, sales process, team, and strategy. Includes sections for case studies, pricing, and future opportunities. Ideal for sales teams to impress stakeholders. Compatible with PowerPoint, Keynote, and Google Slides.


3 diapositivas
Customer Relationship Mapping Presentation
Visualize connections across your supply chain with the Customer Relationship Mapping Presentation. This slide helps illustrate how your group interacts with suppliers and customers, making it ideal for operational overviews, relationship management, or partner presentations. Fully editable in PowerPoint, Keynote, and Google Slides.


24 diapositivas
Zenith Investor Pitch Presentation
Impress your investors with this sleek, modern pitch deck presentation template. Perfect for detailing problem statements, solutions, business models, and revenue projections, it features a professional design with a cohesive color scheme. Highlight key elements like market opportunities, competitive landscapes, and financials to captivate your audience. Compatible with PowerPoint, Keynote, and Google Slides, it ensures seamless presentations on any platform.


6 diapositivas
Security Strategy and Risk Management Presentation
Keep your data safe and your strategy sharp with this modern, professional template built to explain protection frameworks, risk mitigation, and security planning. Its clean visuals make complex concepts easy to understand for teams and clients alike. Fully compatible with PowerPoint, Keynote, and Google Slides for effortless editing and presentation.


5 diapositivas
Home Investment and Property Value Presentation
Visualize key real estate insights with this skyline-themed slide, ideal for showcasing home investment data and market value trends. Designed for realtors, analysts, or housing consultants, it features a cityscape layout for clear comparison. Fully editable in PowerPoint, Keynote, and Google Slides for effortless customization and polished presentations.


26 diapositivas
Human Resources Colorful Vectors
Dive into the dynamic realm of human resources, where talent thrives and organizations find their heartbeat. Radiating with a playful palette of sunny yellow, refreshing green, blush pink, and crisp white, our template captures the vibrancy and diversity of the HR world. Adorned with colorful graphics, relatable icons, and insightful image placeholders, it's a testament to the human touch in every organization. Expertly tailored for Powerpoint, Keynote, or Google Slides. An invaluable tool for HR professionals, recruitment agencies, corporate trainers, or anyone focused on building and nurturing talent. Engage, empower, and elevate; let your HR endeavors shine.


6 diapositivas
Product Development Cycles Presentation
A great product starts with a clear, engaging story—this presentation brings that journey to life. It outlines each stage of the development cycle in a simple, visual flow that helps teams communicate progress, milestones, and next steps. Perfect for strategy, planning, and updates. Fully compatible with PowerPoint, Keynote, and Google Slides.