


Características


¿Tienes alguna pregunta?
Recomendar


4 diapositivas
Social Media Analytics Dashboard Presentation
Easily monitor and report on your content performance with the Social Media Analytics Dashboard Presentation. This sleek, modular layout combines key metrics like items, uploads, comments, and feeds with a vertical bar chart to visualize insights across platforms. Ideal for campaign reviews, stakeholder updates, or team reporting. Fully customizable in PowerPoint, Keynote, and Google Slides.


2 diapositivas
Modern Business Title Slide Presentation
Step into the future of presentations with the "Modern Business Slide," designed to make your corporate message shine. This template features a sleek, minimalist layout with bold typography and a striking visual of a stylish office setting, perfect for making a professional impact. Ideal for any business presentation, it's compatible with PowerPoint, Keynote, and Google Slides, ensuring versatility across different platforms.


7 diapositivas
Alphabet Letters Infographic
An alphabet infographic is a visual representation or graphic that presents information related to the alphabet, often used for educational purposes or to convey information in a creative and engaging manner. Get ready to embark on a joyful journey through the wonderland of letters and words with our alphabet letters infographic. This infographic template includes various elements like letters, words, examples, pronunciation guides, or related images. This is more than just an infographic—it's a vibrant celebration of language, learning, and pure happiness. Dive into the kaleidoscope of alphabets and spread the cheer!


5 diapositivas
Customer Survey Results Presentation
Gain valuable insights with this Customer Survey Results Presentation. Featuring a clean and data-driven layout, this template allows you to visualize customer feedback, satisfaction scores, and key performance metrics using interactive charts, graphs, and tables. Fully customizable in PowerPoint, Keynote, and Google Slides, you can adjust colors, edit labels, and modify content to fit your survey needs.


21 diapositivas
Literati Research Proposal Presentation
Present your research proposal with confidence using this professionally crafted template, designed to streamline complex ideas into a cohesive, engaging narrative. With a modern design and dynamic visuals, it ensures your research objectives and findings are communicated effectively. The template includes sections for your introduction, background, methodology, data collection, analysis, and key findings, giving your proposal a logical structure. Use the literature review and data visualization slides to back up your arguments with credible sources and compelling graphics. Dedicated slides for conclusions, recommendations, and implications allow you to outline the impact of your research clearly. Fully editable in PowerPoint, Google Slides, and Keynote, this template adapts effortlessly to your needs. Perfect for academic, corporate, or professional research presentations, it combines sleek design with functionality to ensure your proposal resonates with your audience. Take your research to the next level with a template that reflects your dedication to excellence.


4 diapositivas
Green Initiative Report Deck Presentation
Show your sustainability story with a modern, eco-inspired presentation built to highlight green initiatives, progress reports, and environmental goals. Its clean layout makes data and insights easy to follow while maintaining a professional tone. Fully customizable and compatible with PowerPoint, Keynote, and Google Slides for effortless presentation design.


7 diapositivas
Company Profile Structure Infographic
This series of templates is meticulously crafted to represent a company’s structure in a detailed and organized manner. Each template varies in design and layout, ensuring that there is a style to suit different business needs and preferences. From straightforward, clean layouts to more dynamic, visually engaging designs, these templates provide an excellent basis for companies to present their organizational structure, core team members, departmental divisions, and key business areas effectively. Key information such as company values, mission statements, and strategic objectives can be clearly highlighted, allowing companies to communicate their business essence and operational ethos to stakeholders. Each template also accommodates data visualization through charts, graphs, and infographics, which are instrumental in depicting growth trajectories, performance metrics, or demographic breakdowns. With customization options, these templates can be tailored to reflect a company's unique brand identity, including color schemes, typography, and corporate logos, making each presentation not only informative but also reflective of the company's image. This collection is ideal for corporate introductions, stakeholder meetings, and internal presentations aimed at fostering a clear understanding of the company’s operational framework and strategic direction.


12 diapositivas
Banking Offers and Card Perks Overview Presentation
Showcase financial benefits clearly with this Banking Offers and Card Perks Overview Presentation. Designed with a bold payment terminal and card visual, this layout helps you highlight key rewards, cashback deals, and special cardholder perks. Ideal for banks, fintechs, and retail loyalty programs. Fully editable in PowerPoint, Keynote, and Google Slides.


5 diapositivas
Business Plan Infographics
Elevate your strategic approach with the business plan infographics template. Cast in the motivational hues of orange, purple, and green, this template breathes life into your business strategy, illustrating your plan's potential. Entrepreneurs and corporate strategists will find this creative, vertical-style infographic an invaluable ally in conveying complex business plans with simplicity and visual flair. Compatible with Powerpoint, Keynote, and Google Slides. This dynamic template comes complete with innovative graphics, thematic icons, and designated image placeholders, all fashioned to articulate your business journey. Utilize this tool to captivate your audience.


7 diapositivas
Time Management Strategies Infographic Presentation
Time management is the process of planning, organizing, and allocating time effectively to achieve specific goals and objectives. This simple and professional template shows you the basics of time management. It uses a combination of bullet points, tables and illustrations to give you the information you need in a practical form. Use this presentation as a step-by-step guide on how you can become more efficient at managing daily business tasks. This infographic template is designed to help you manage your time and prioritize your actions by highlighting the different aspects of a task.


21 diapositivas
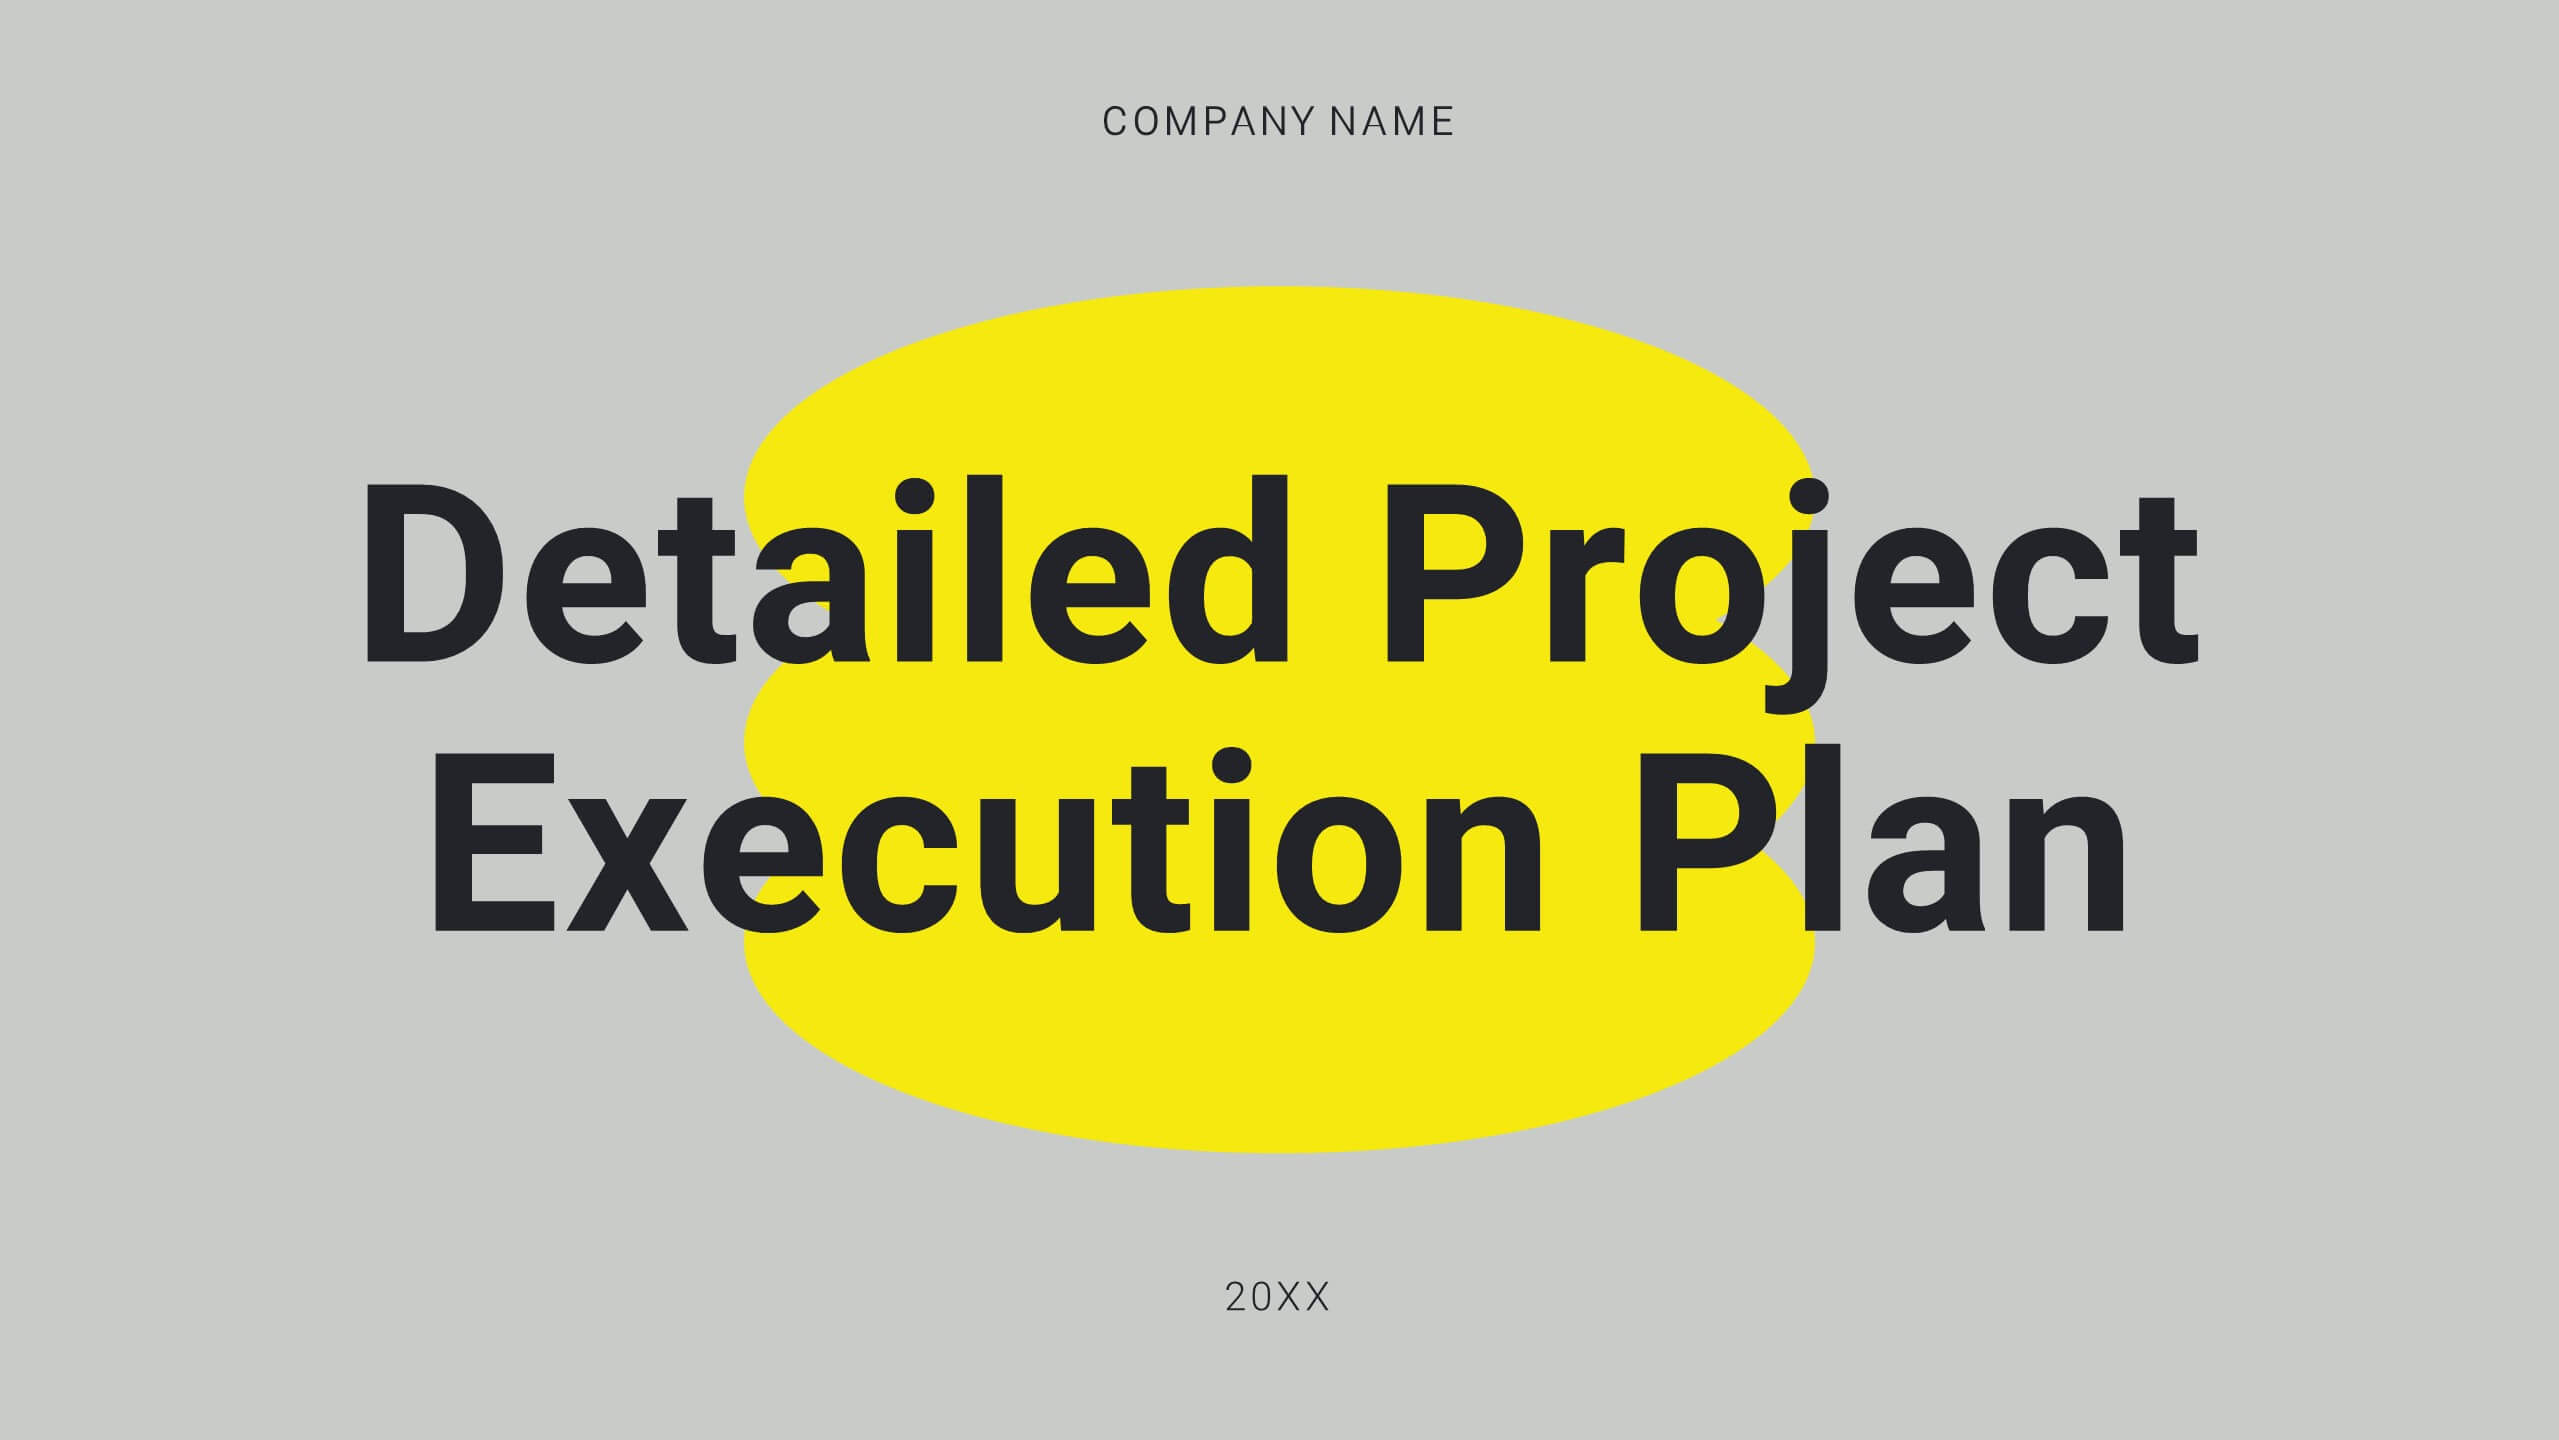
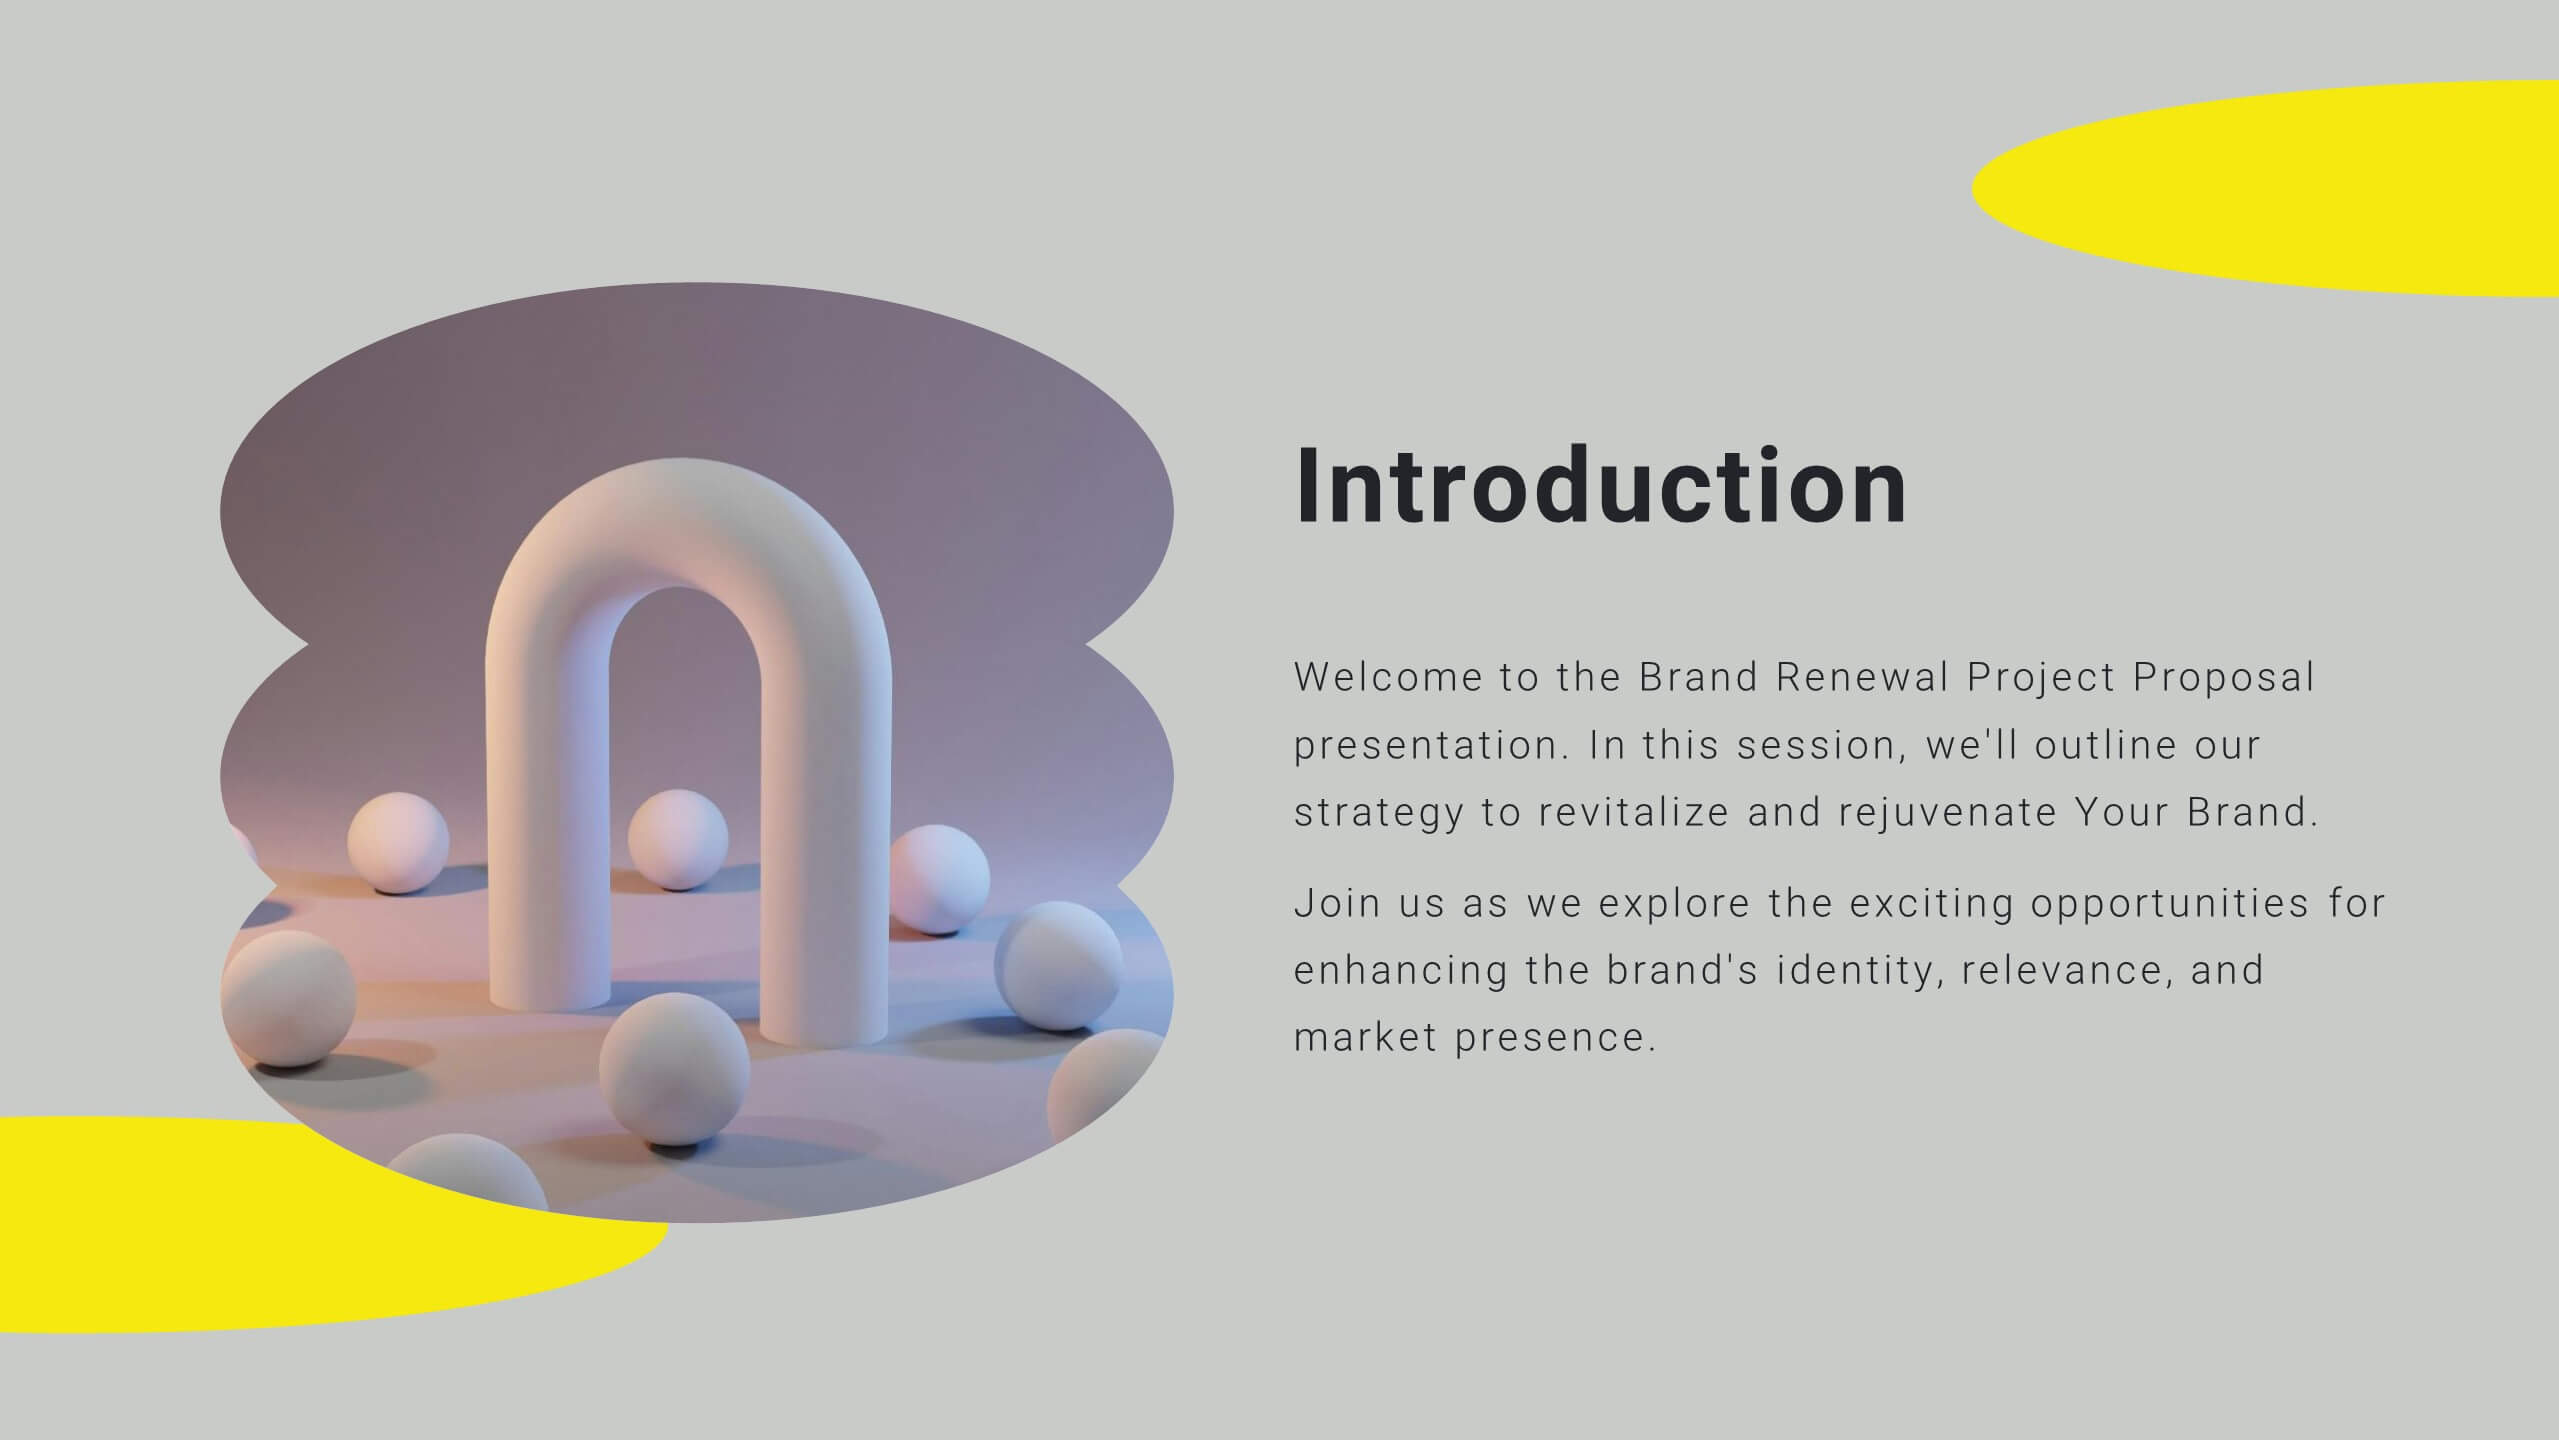
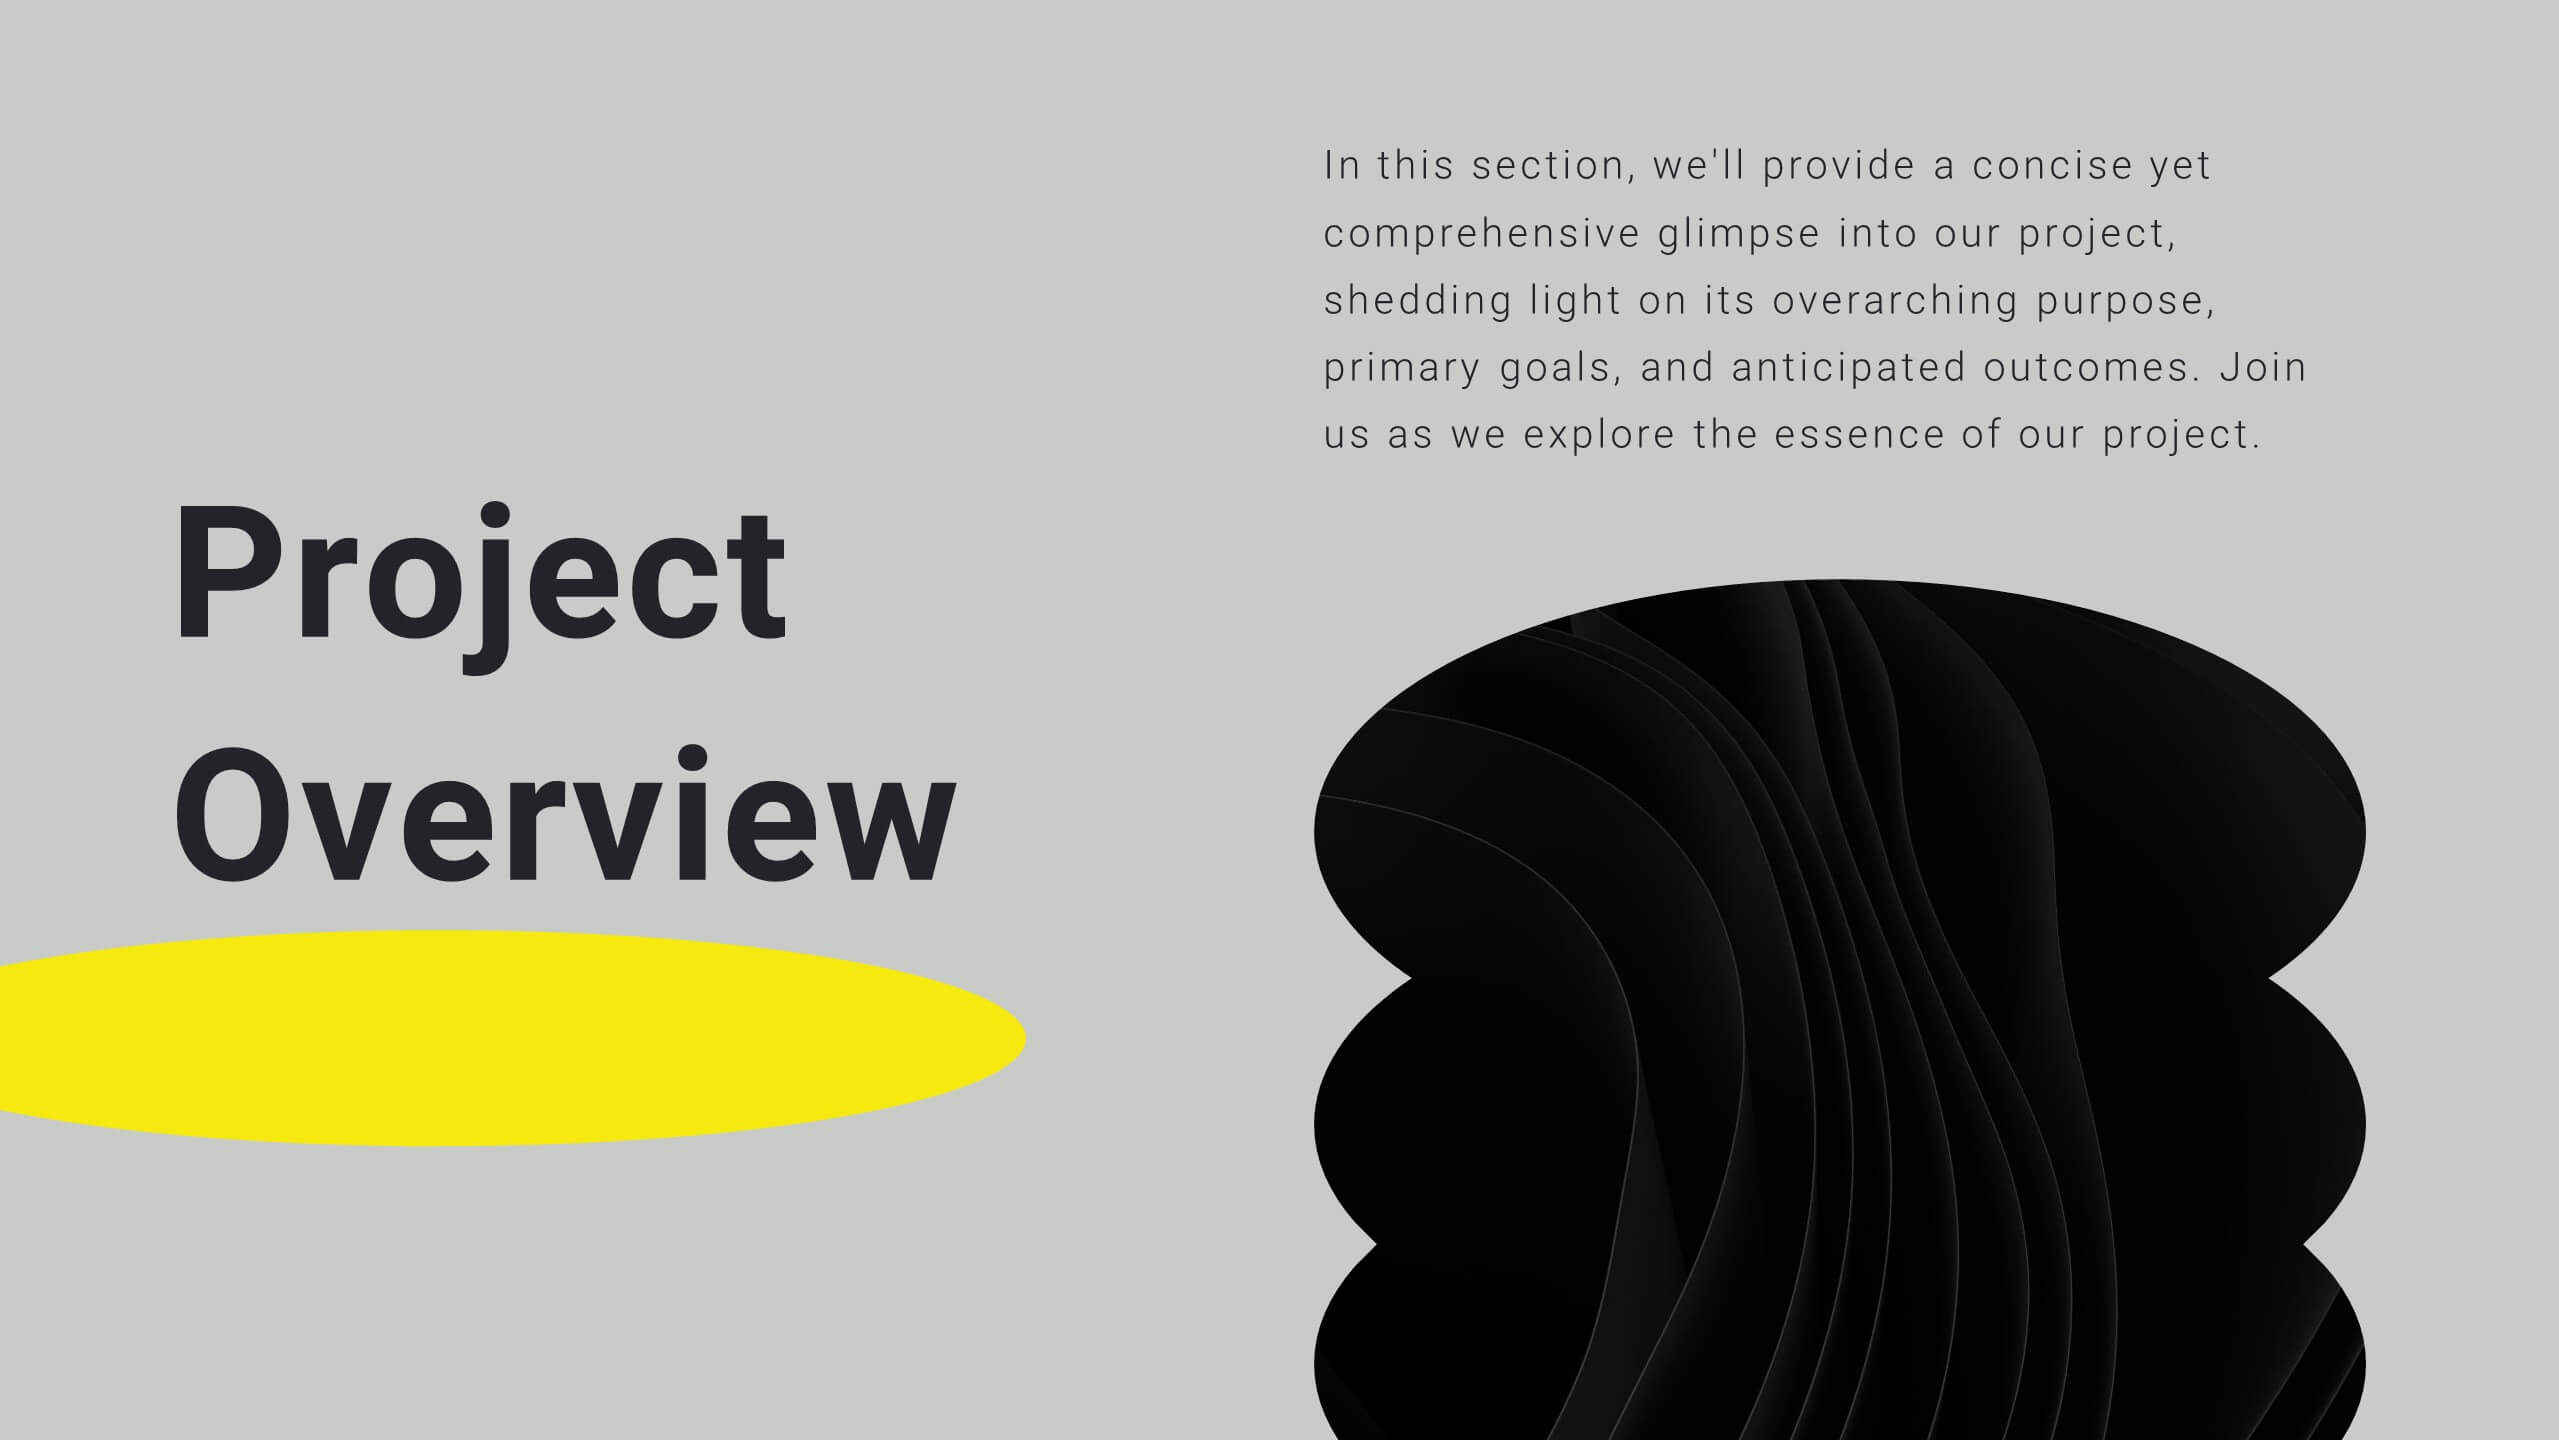
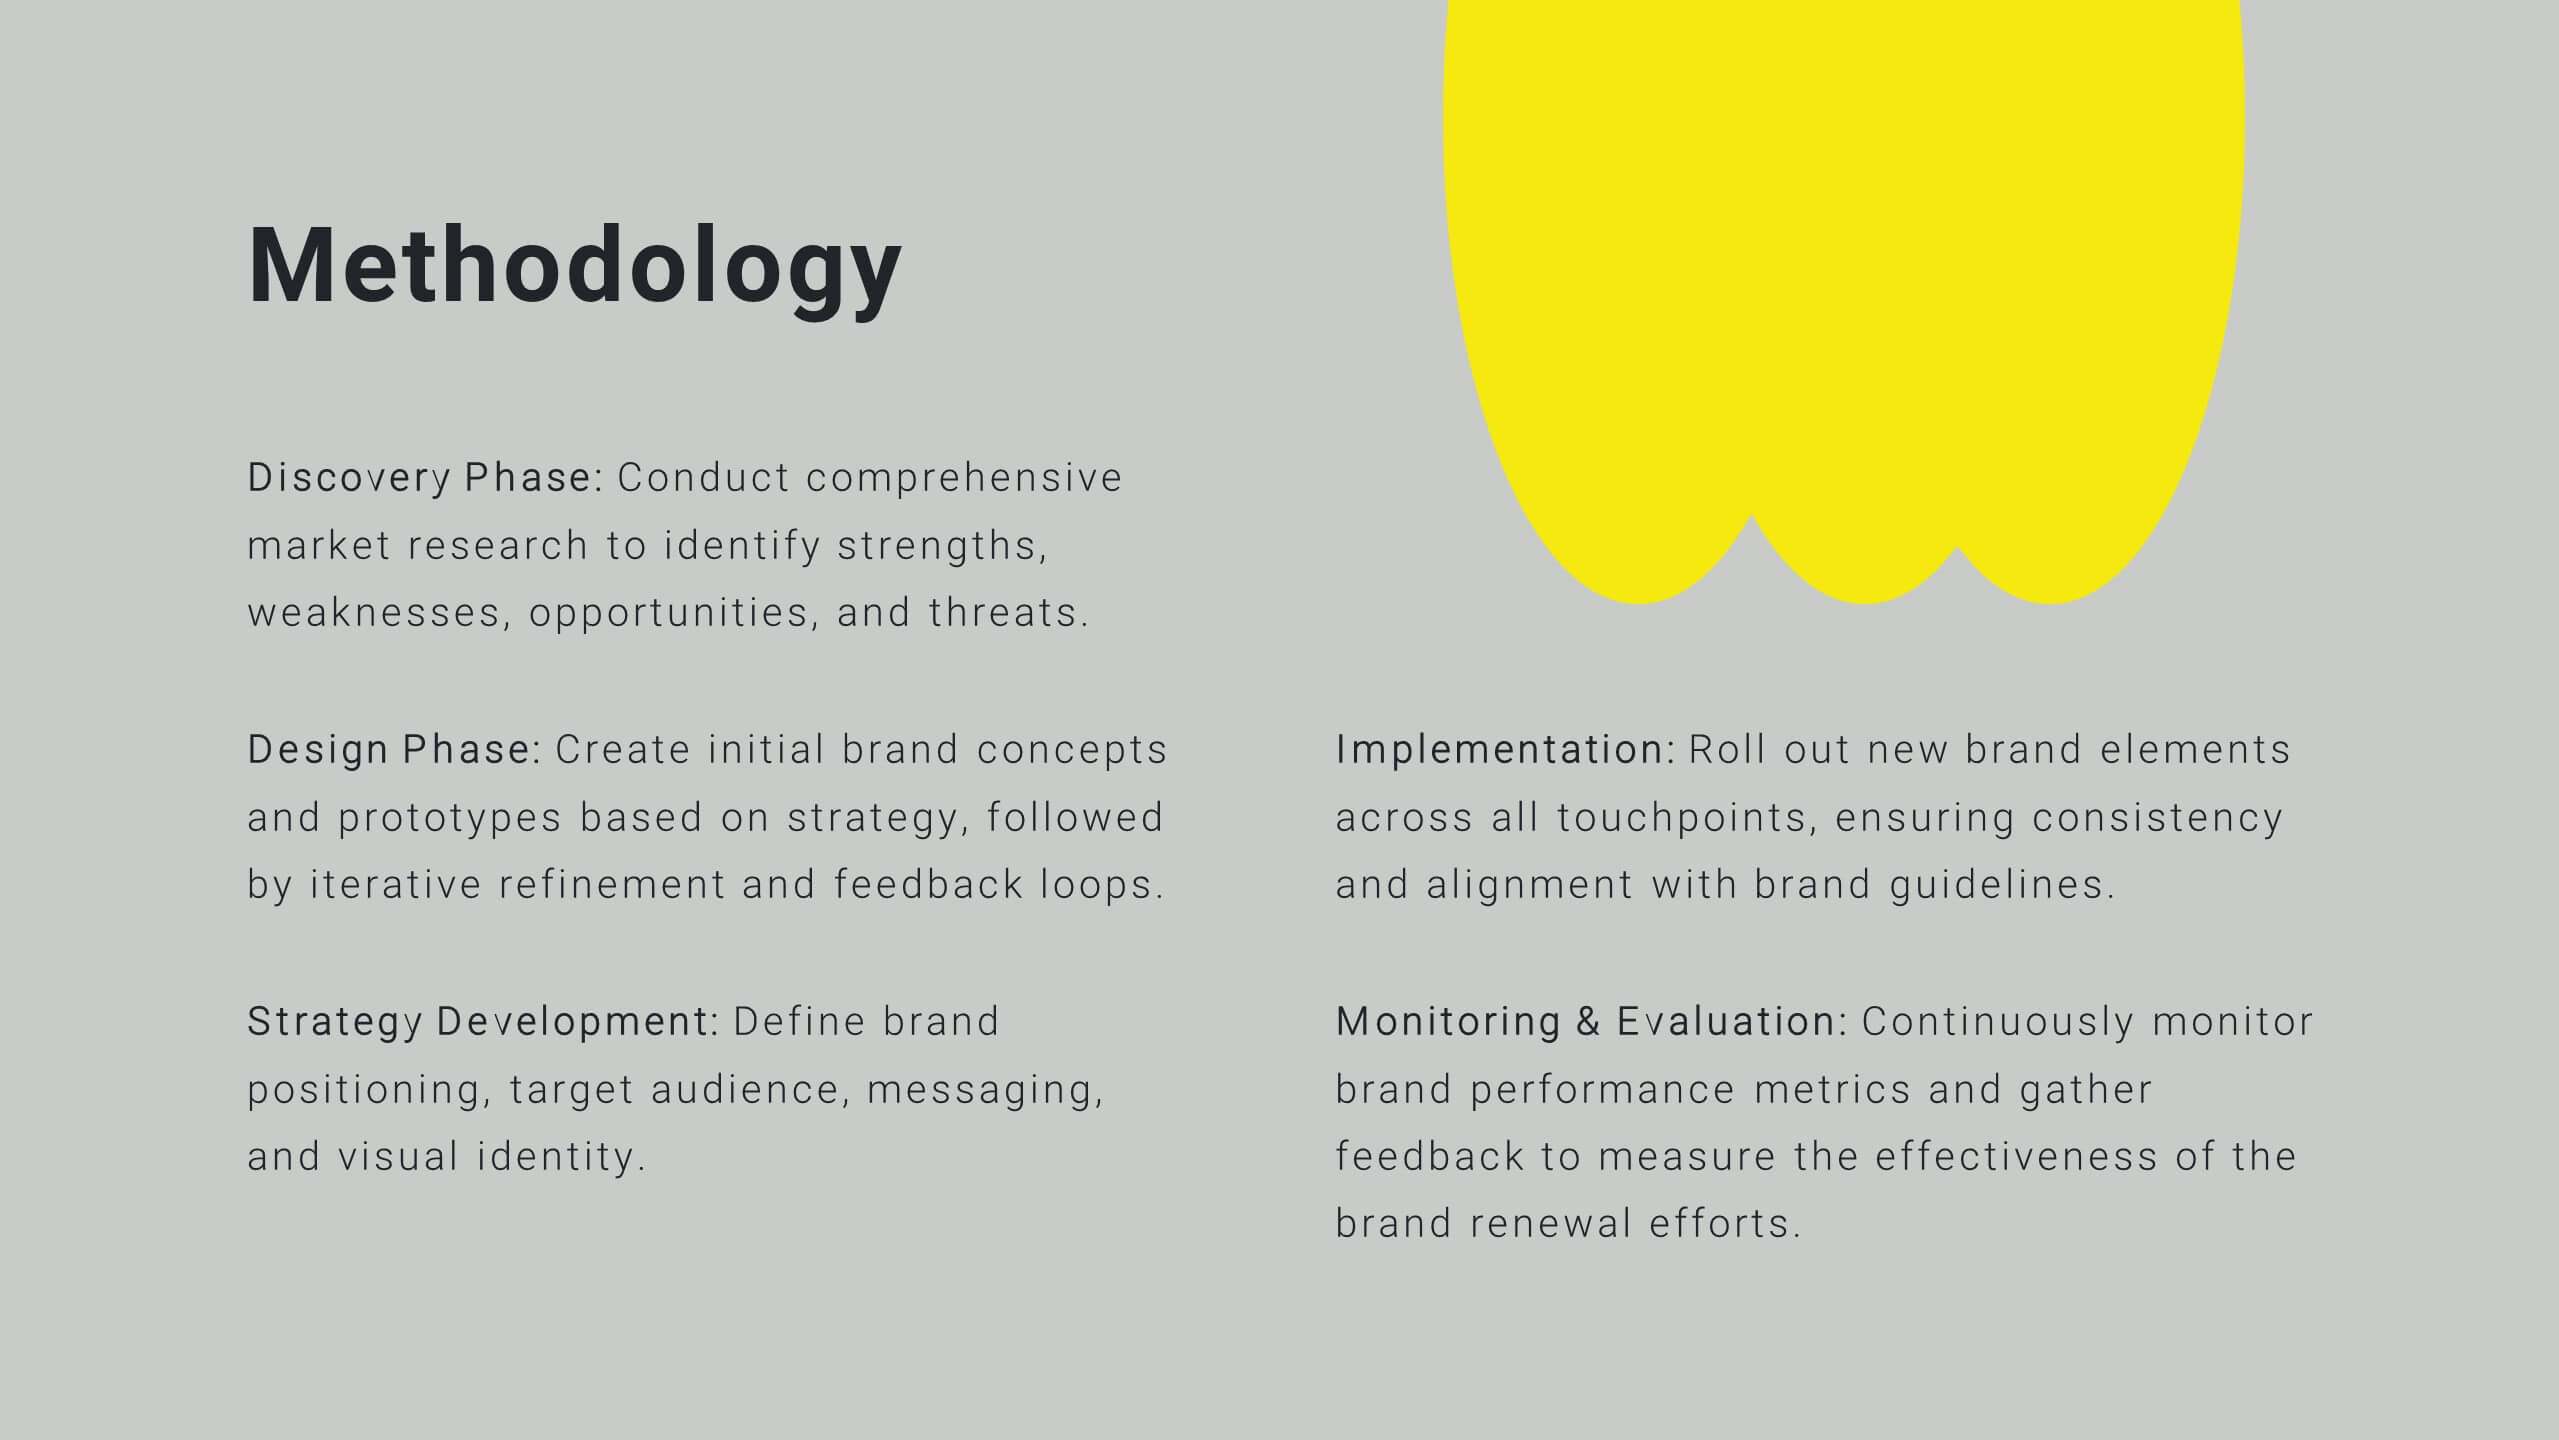
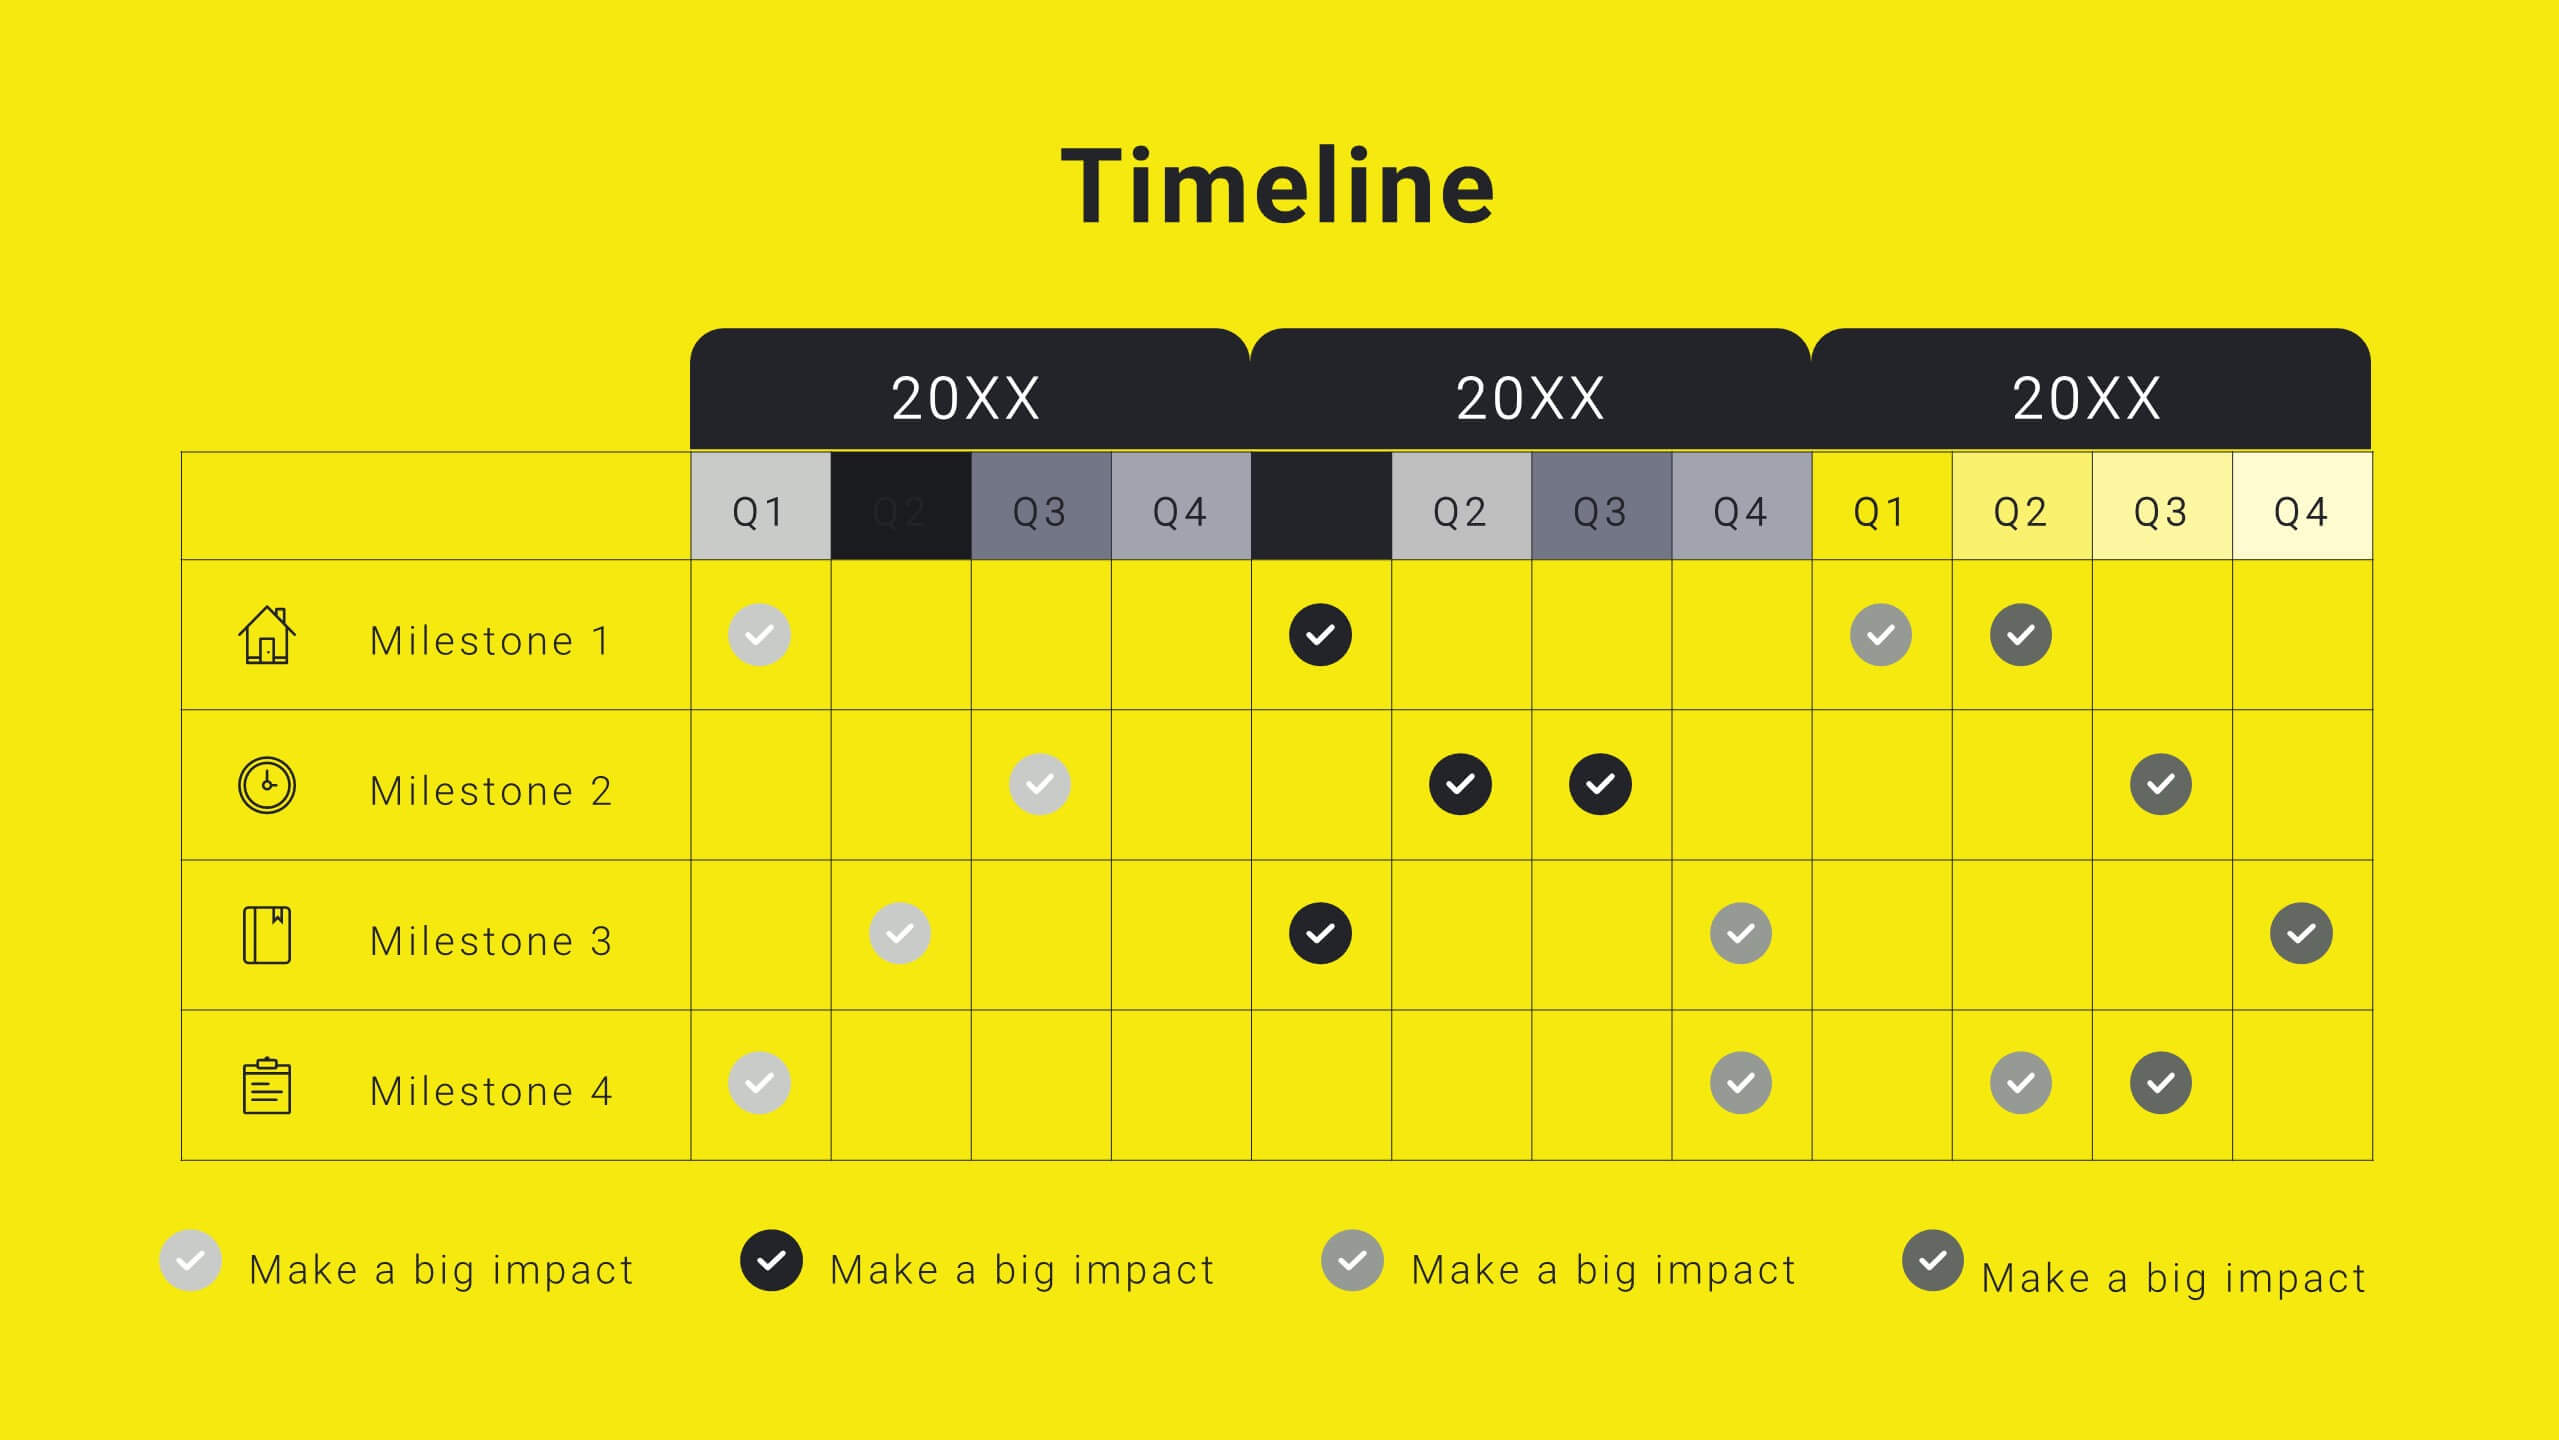
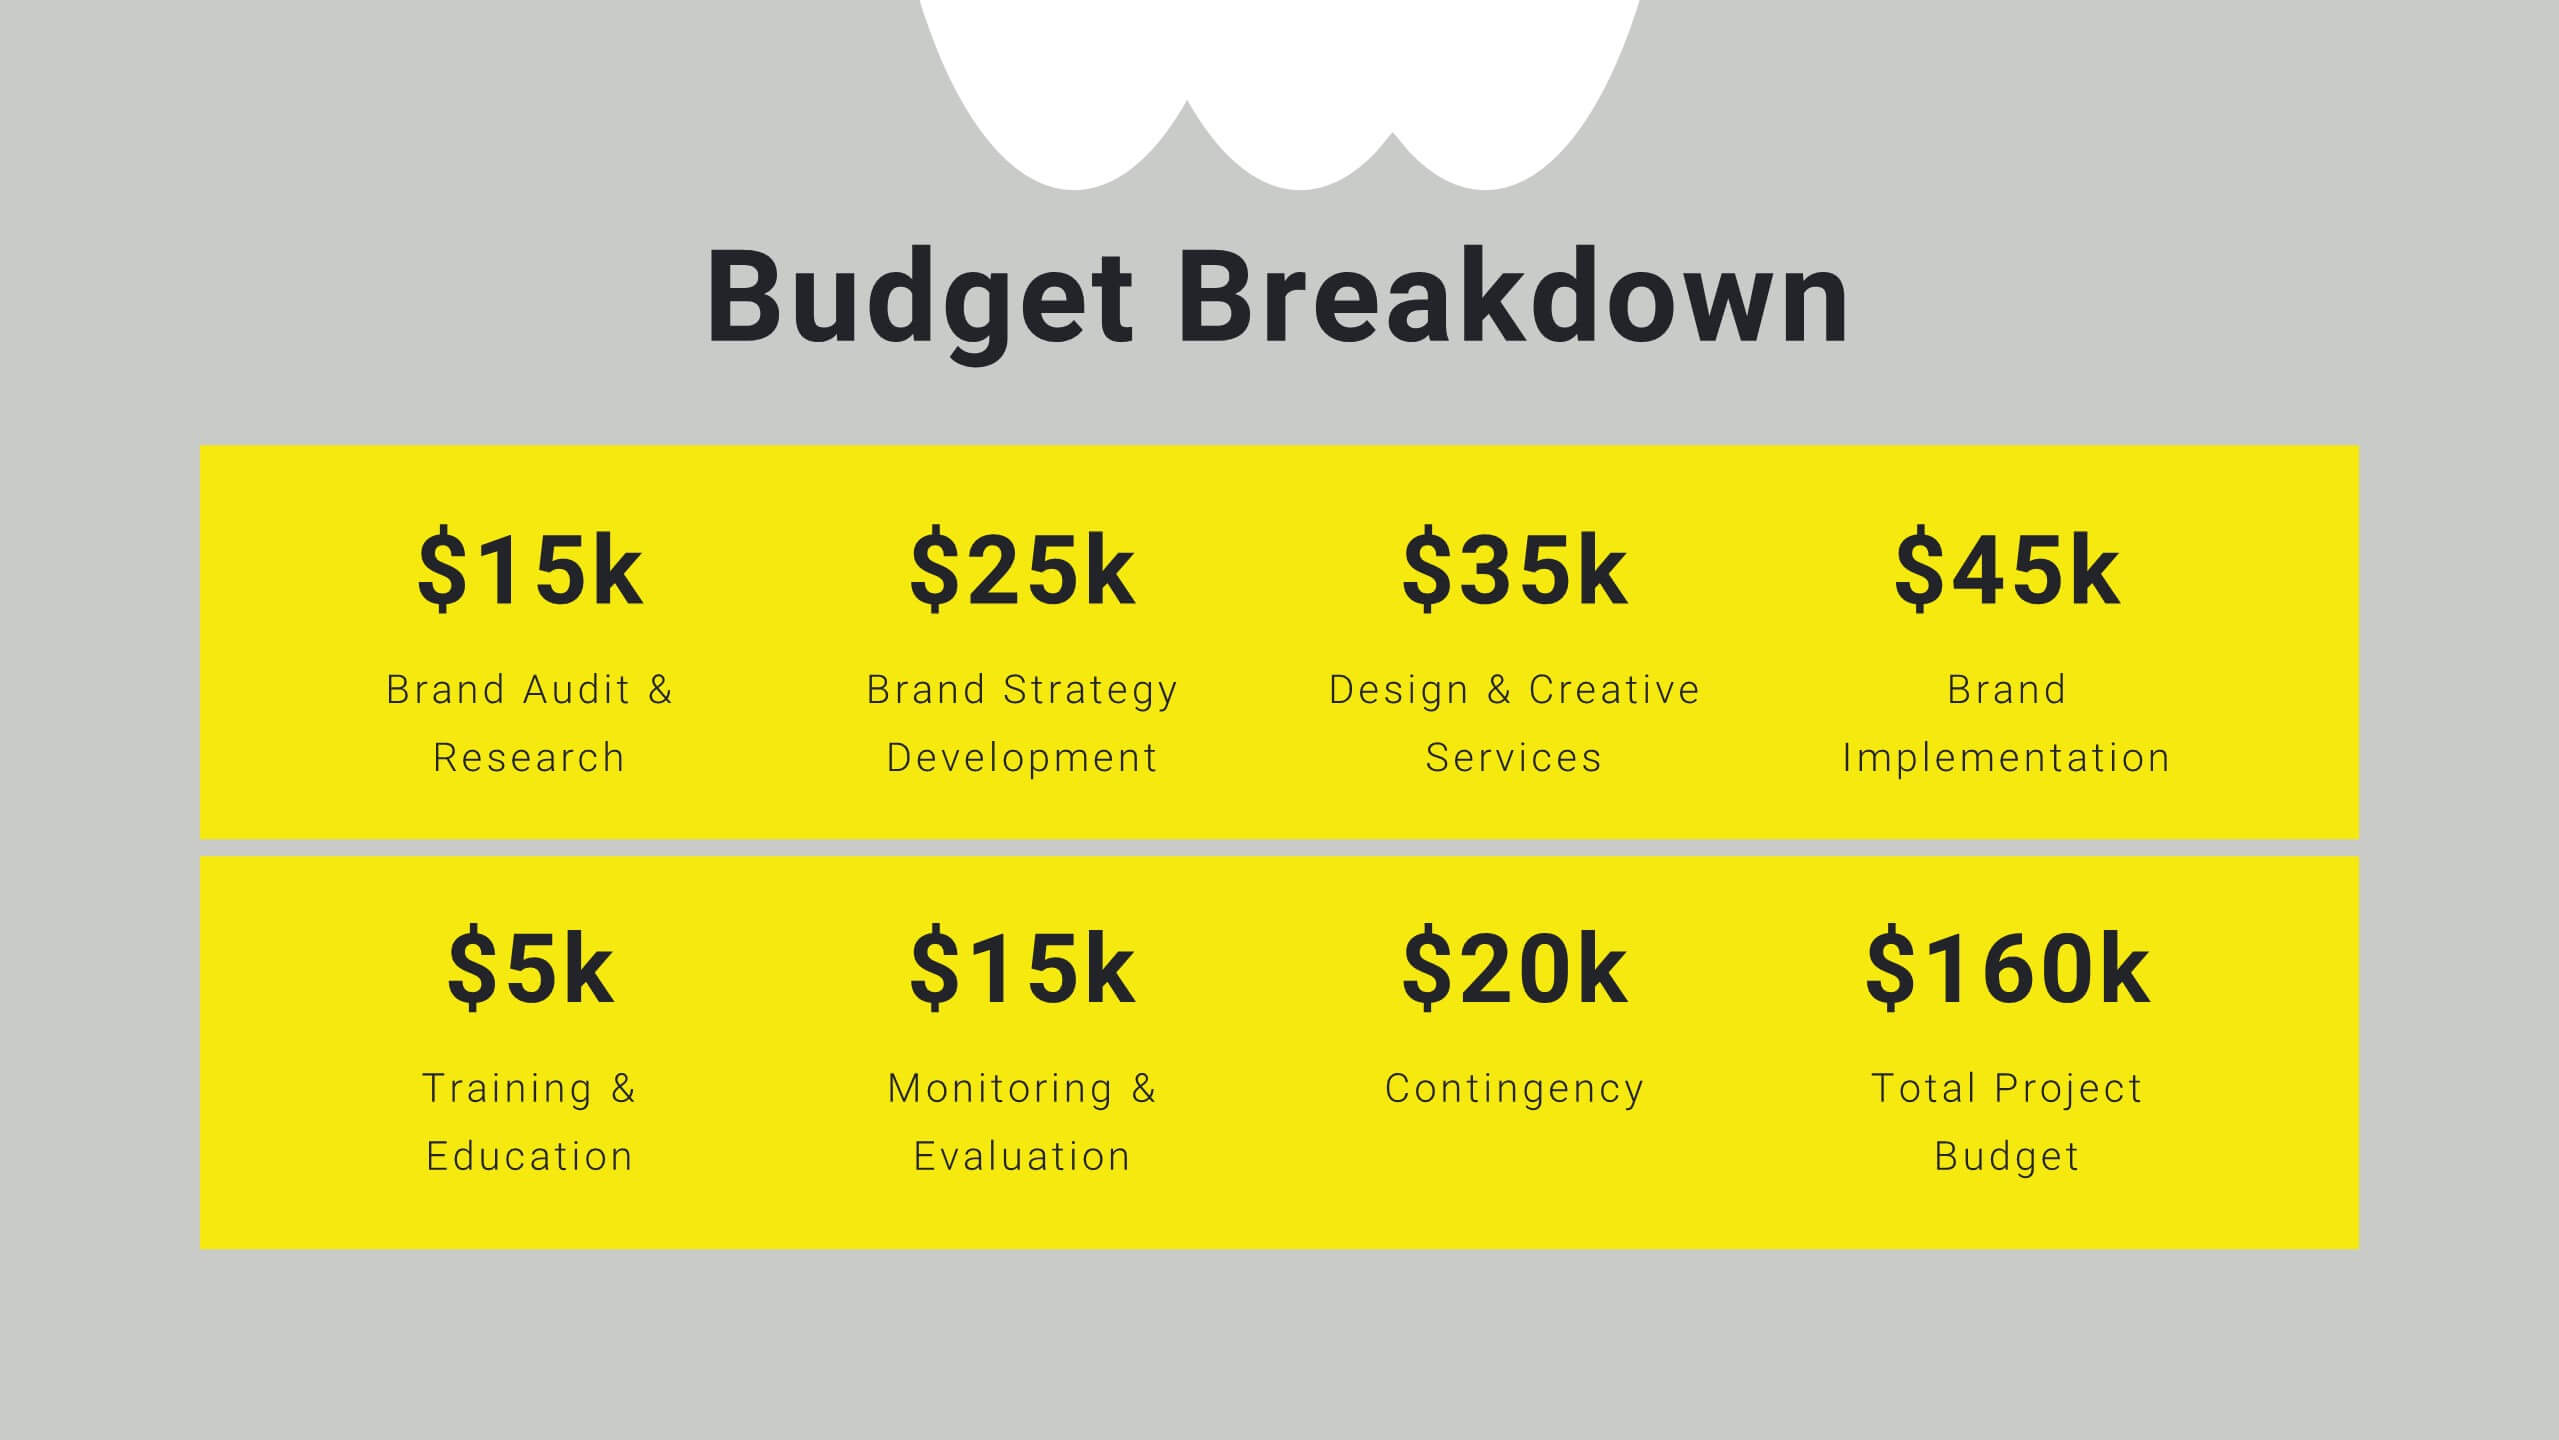
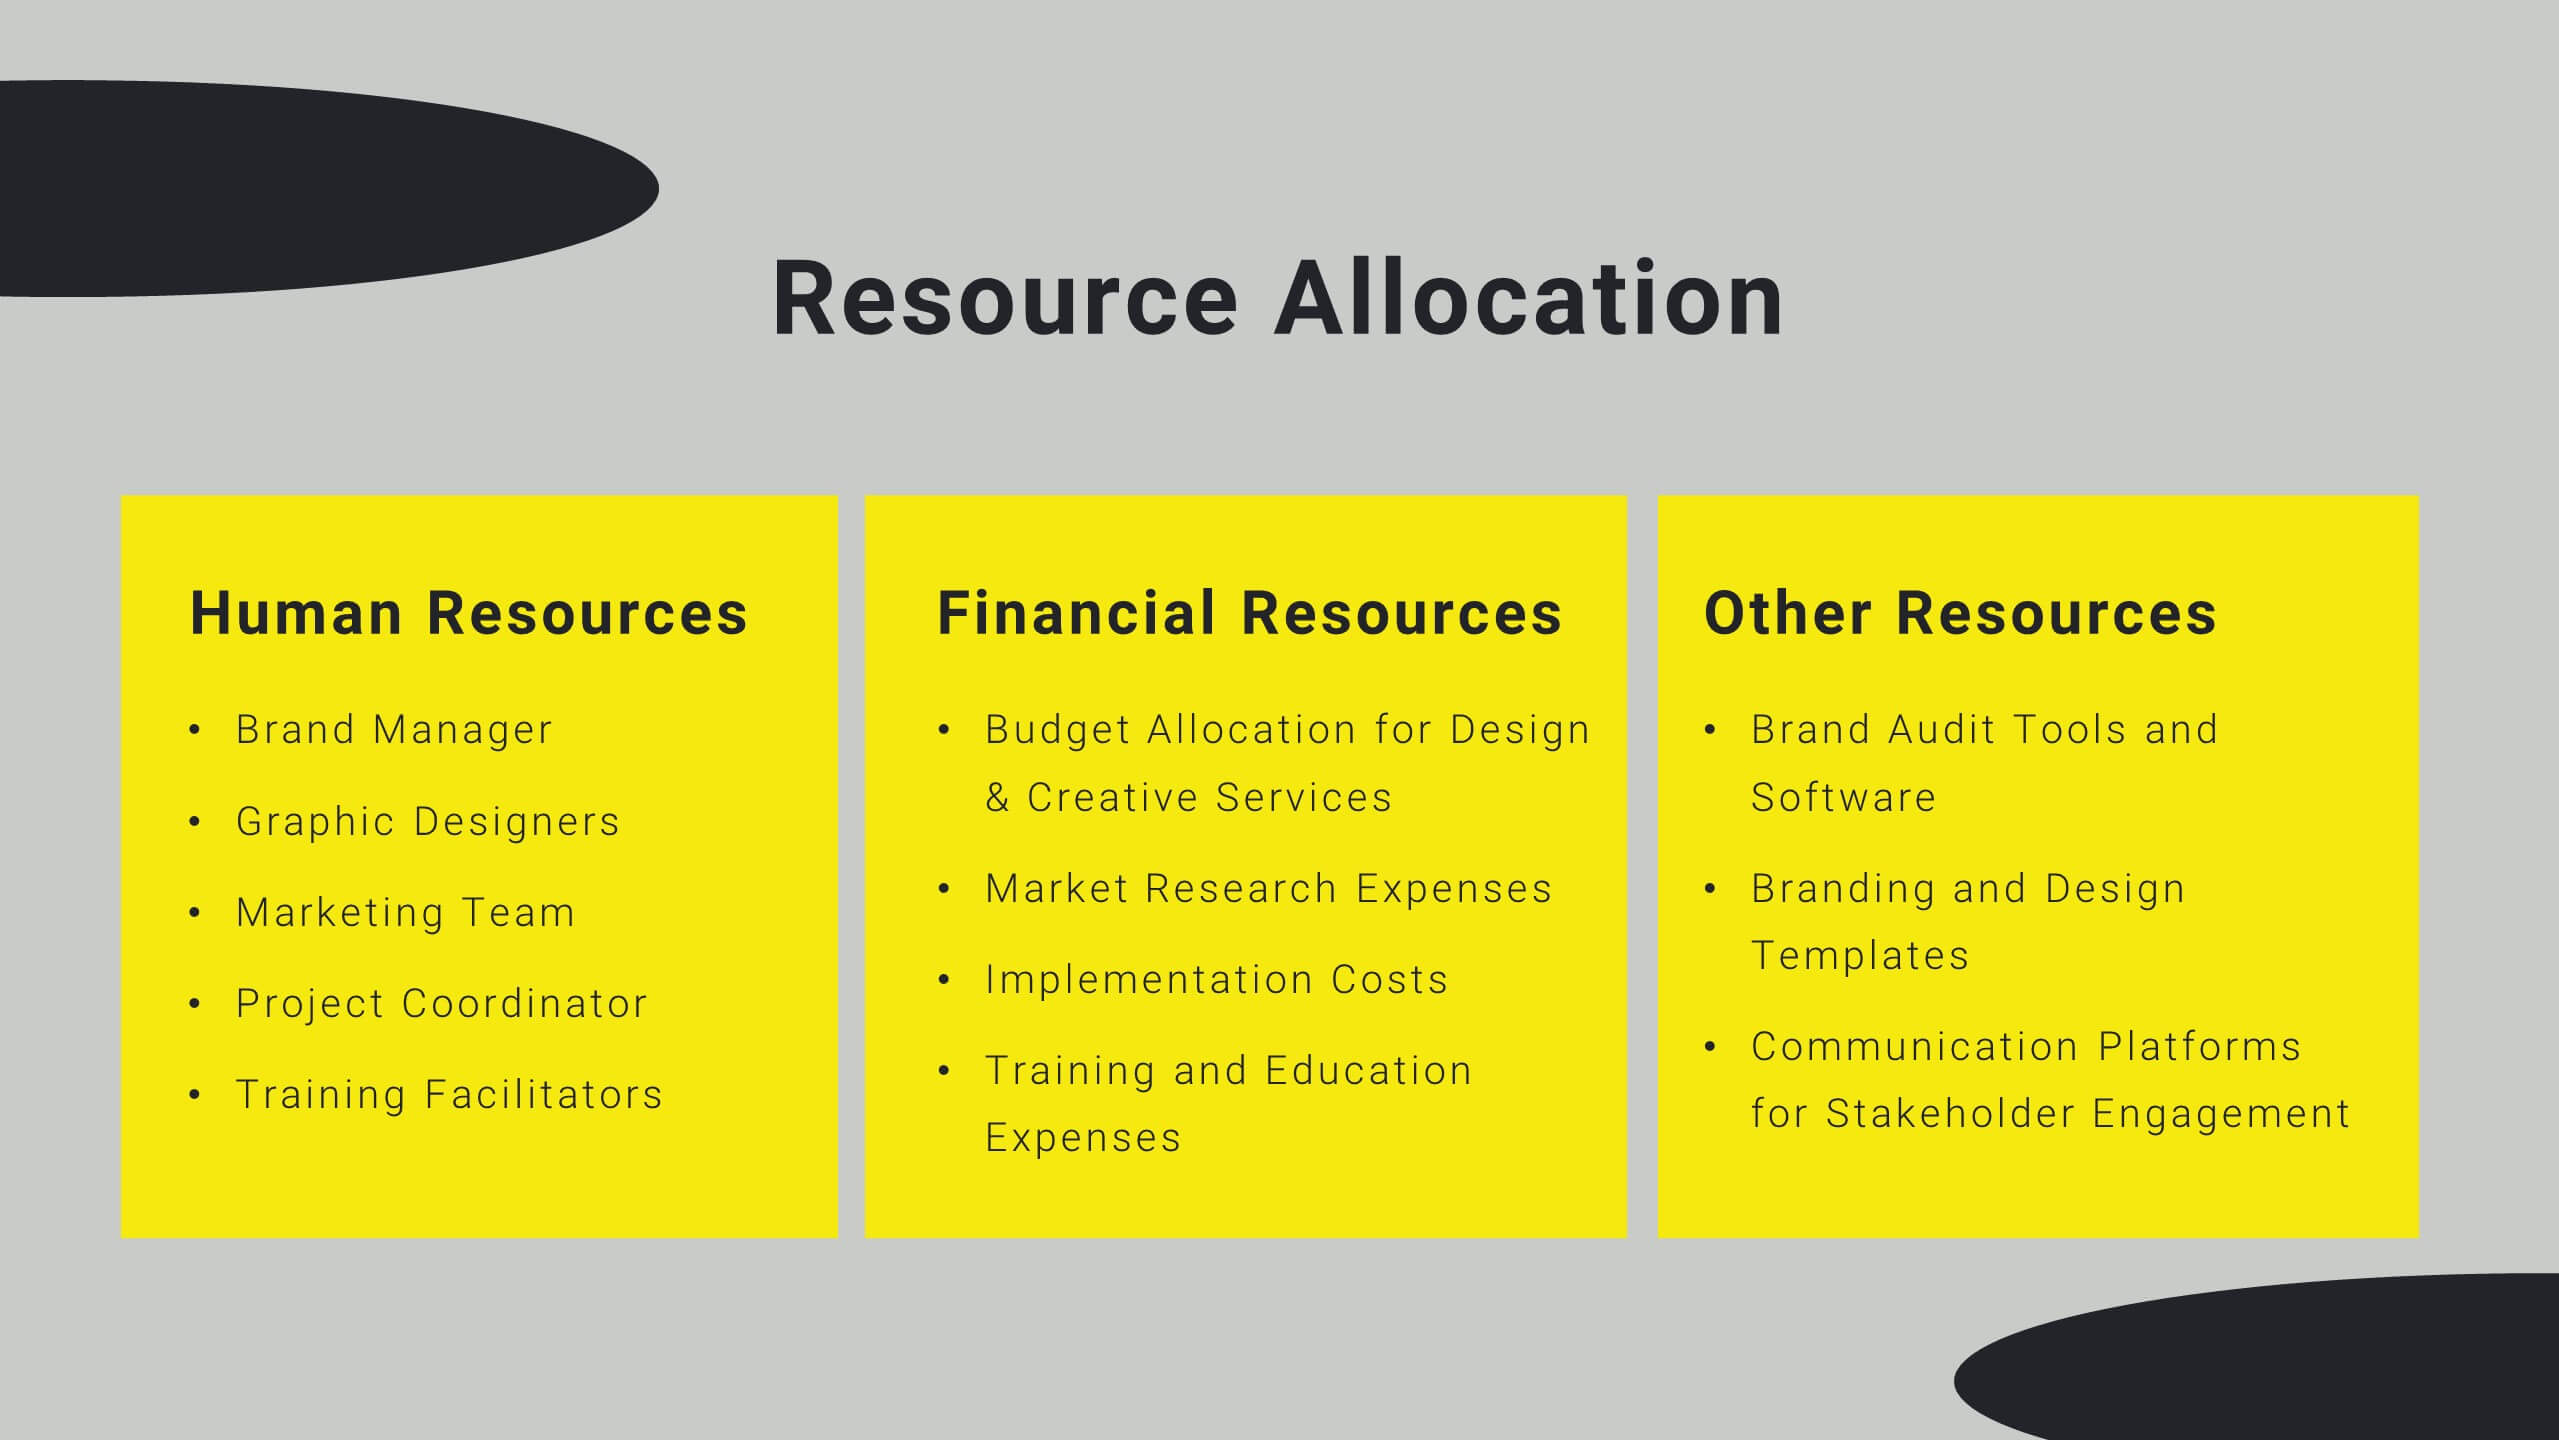
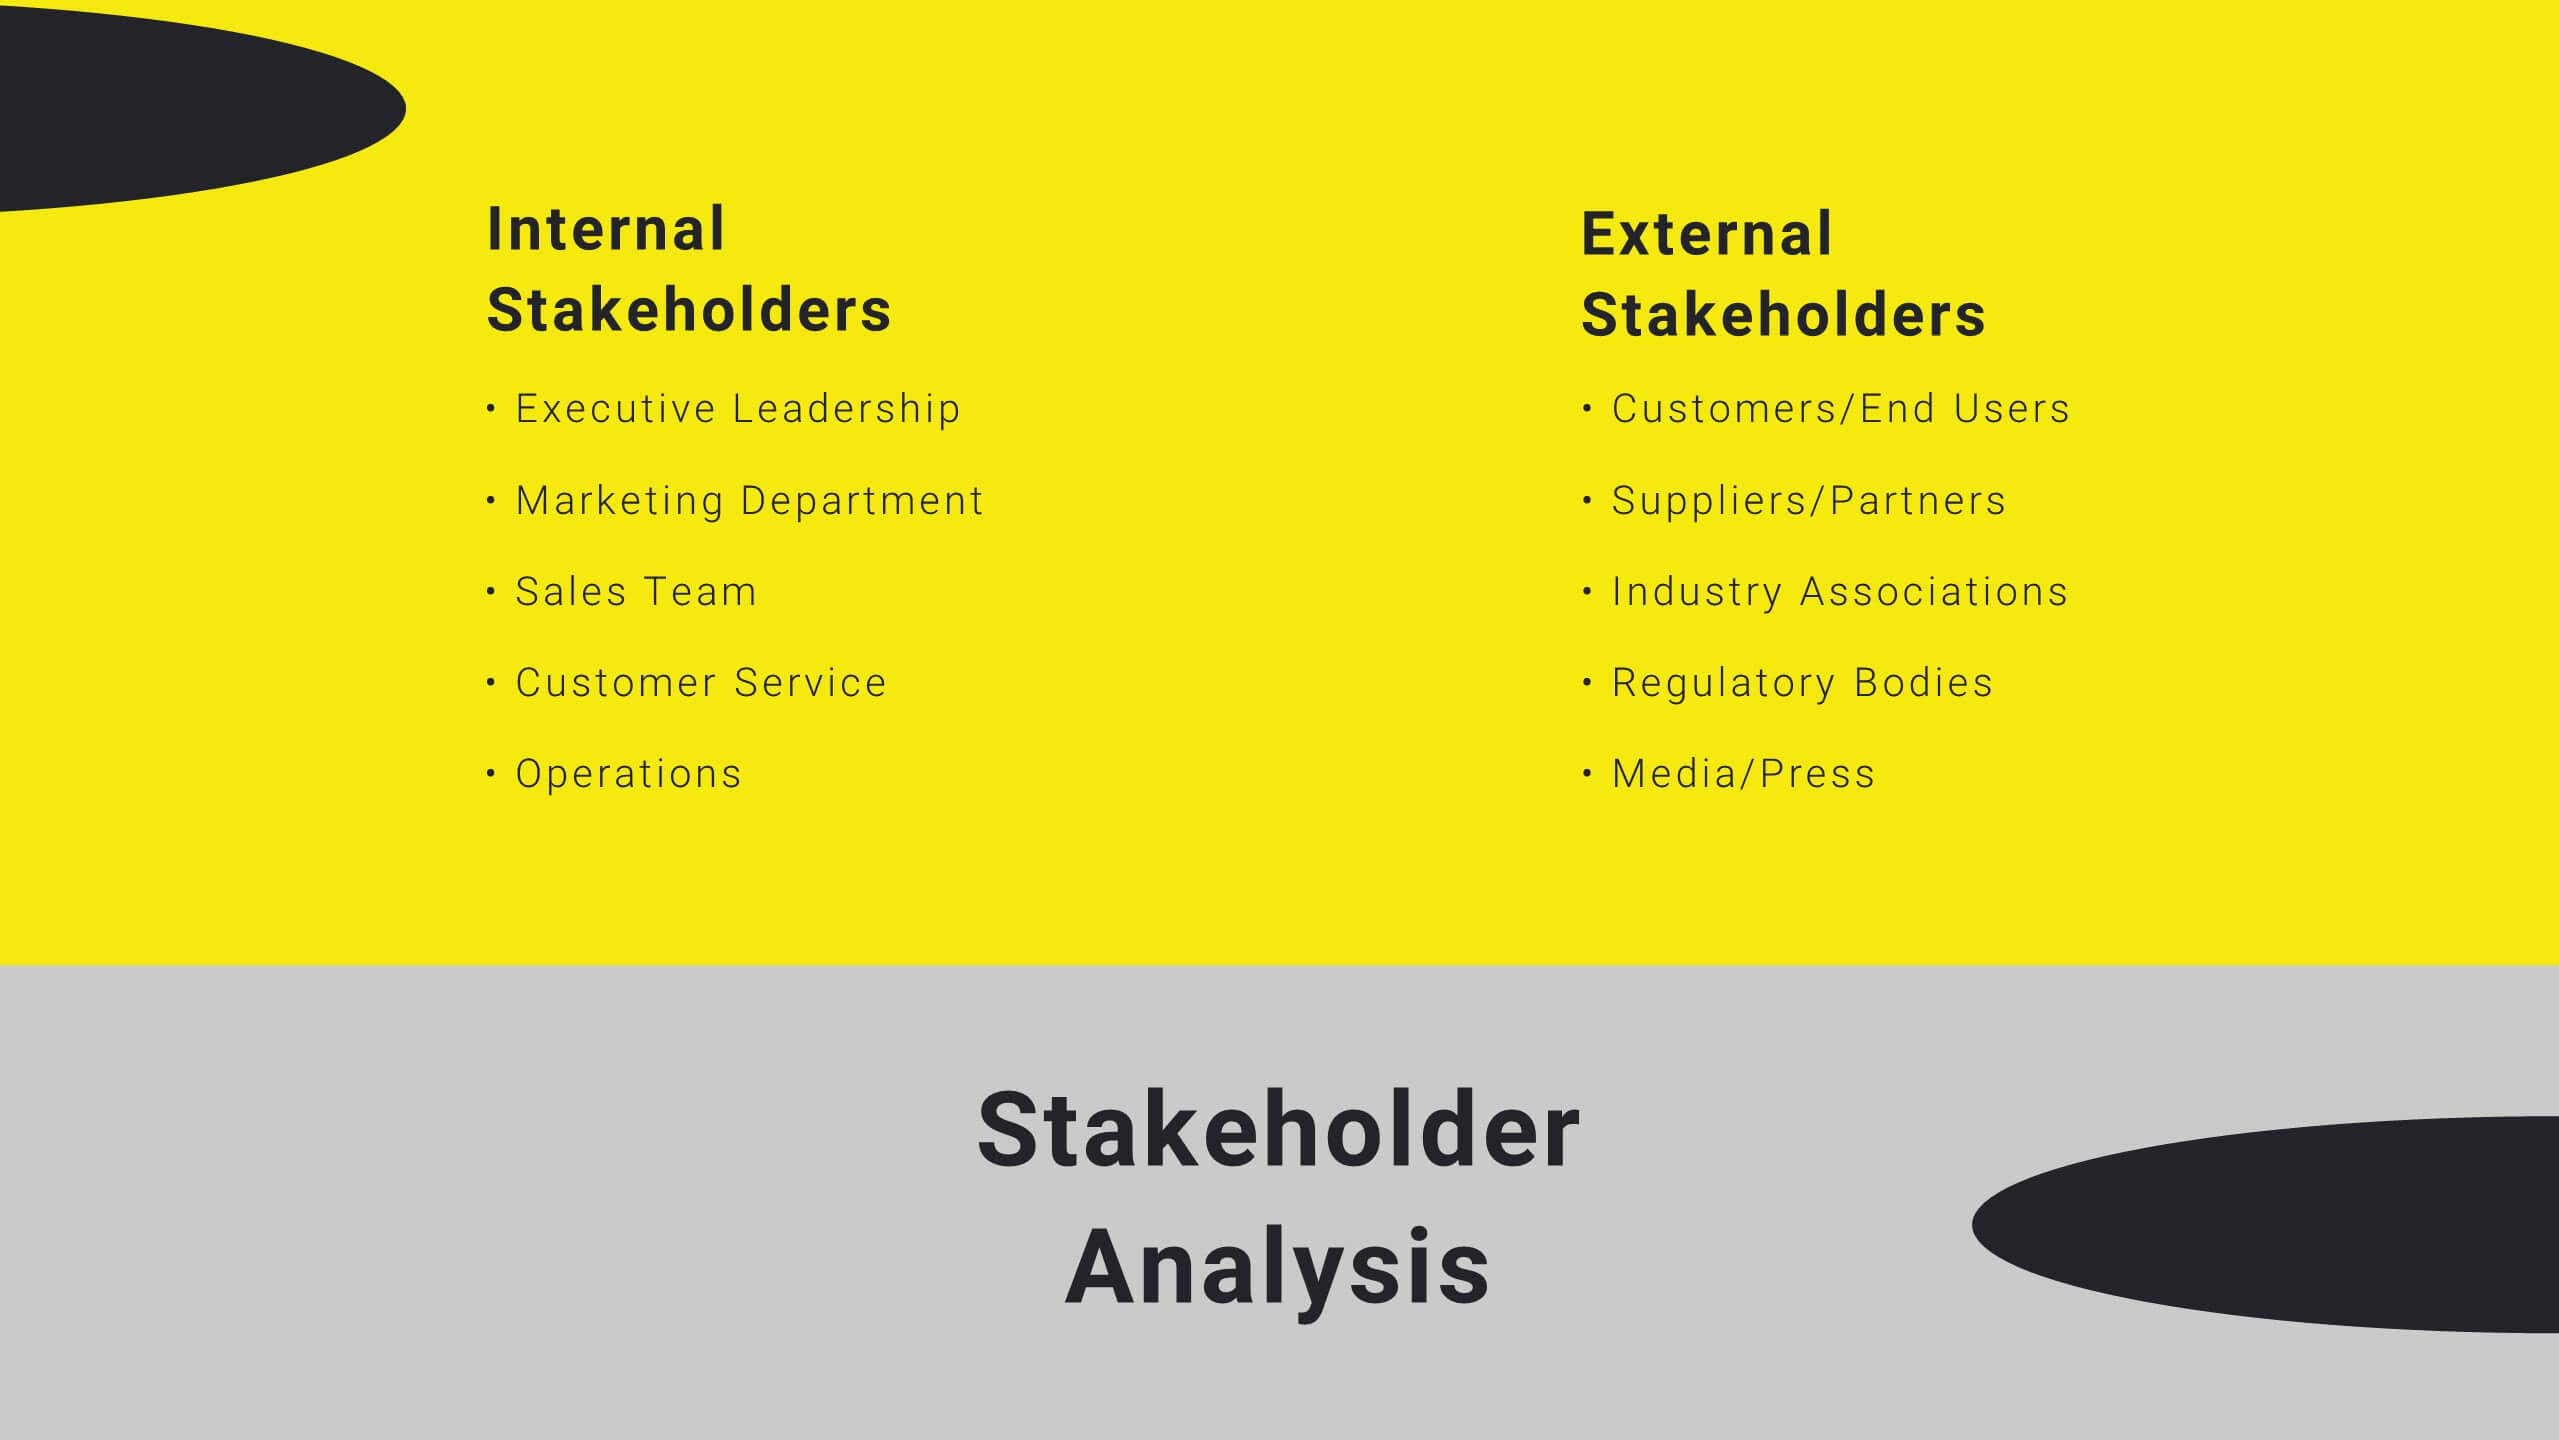
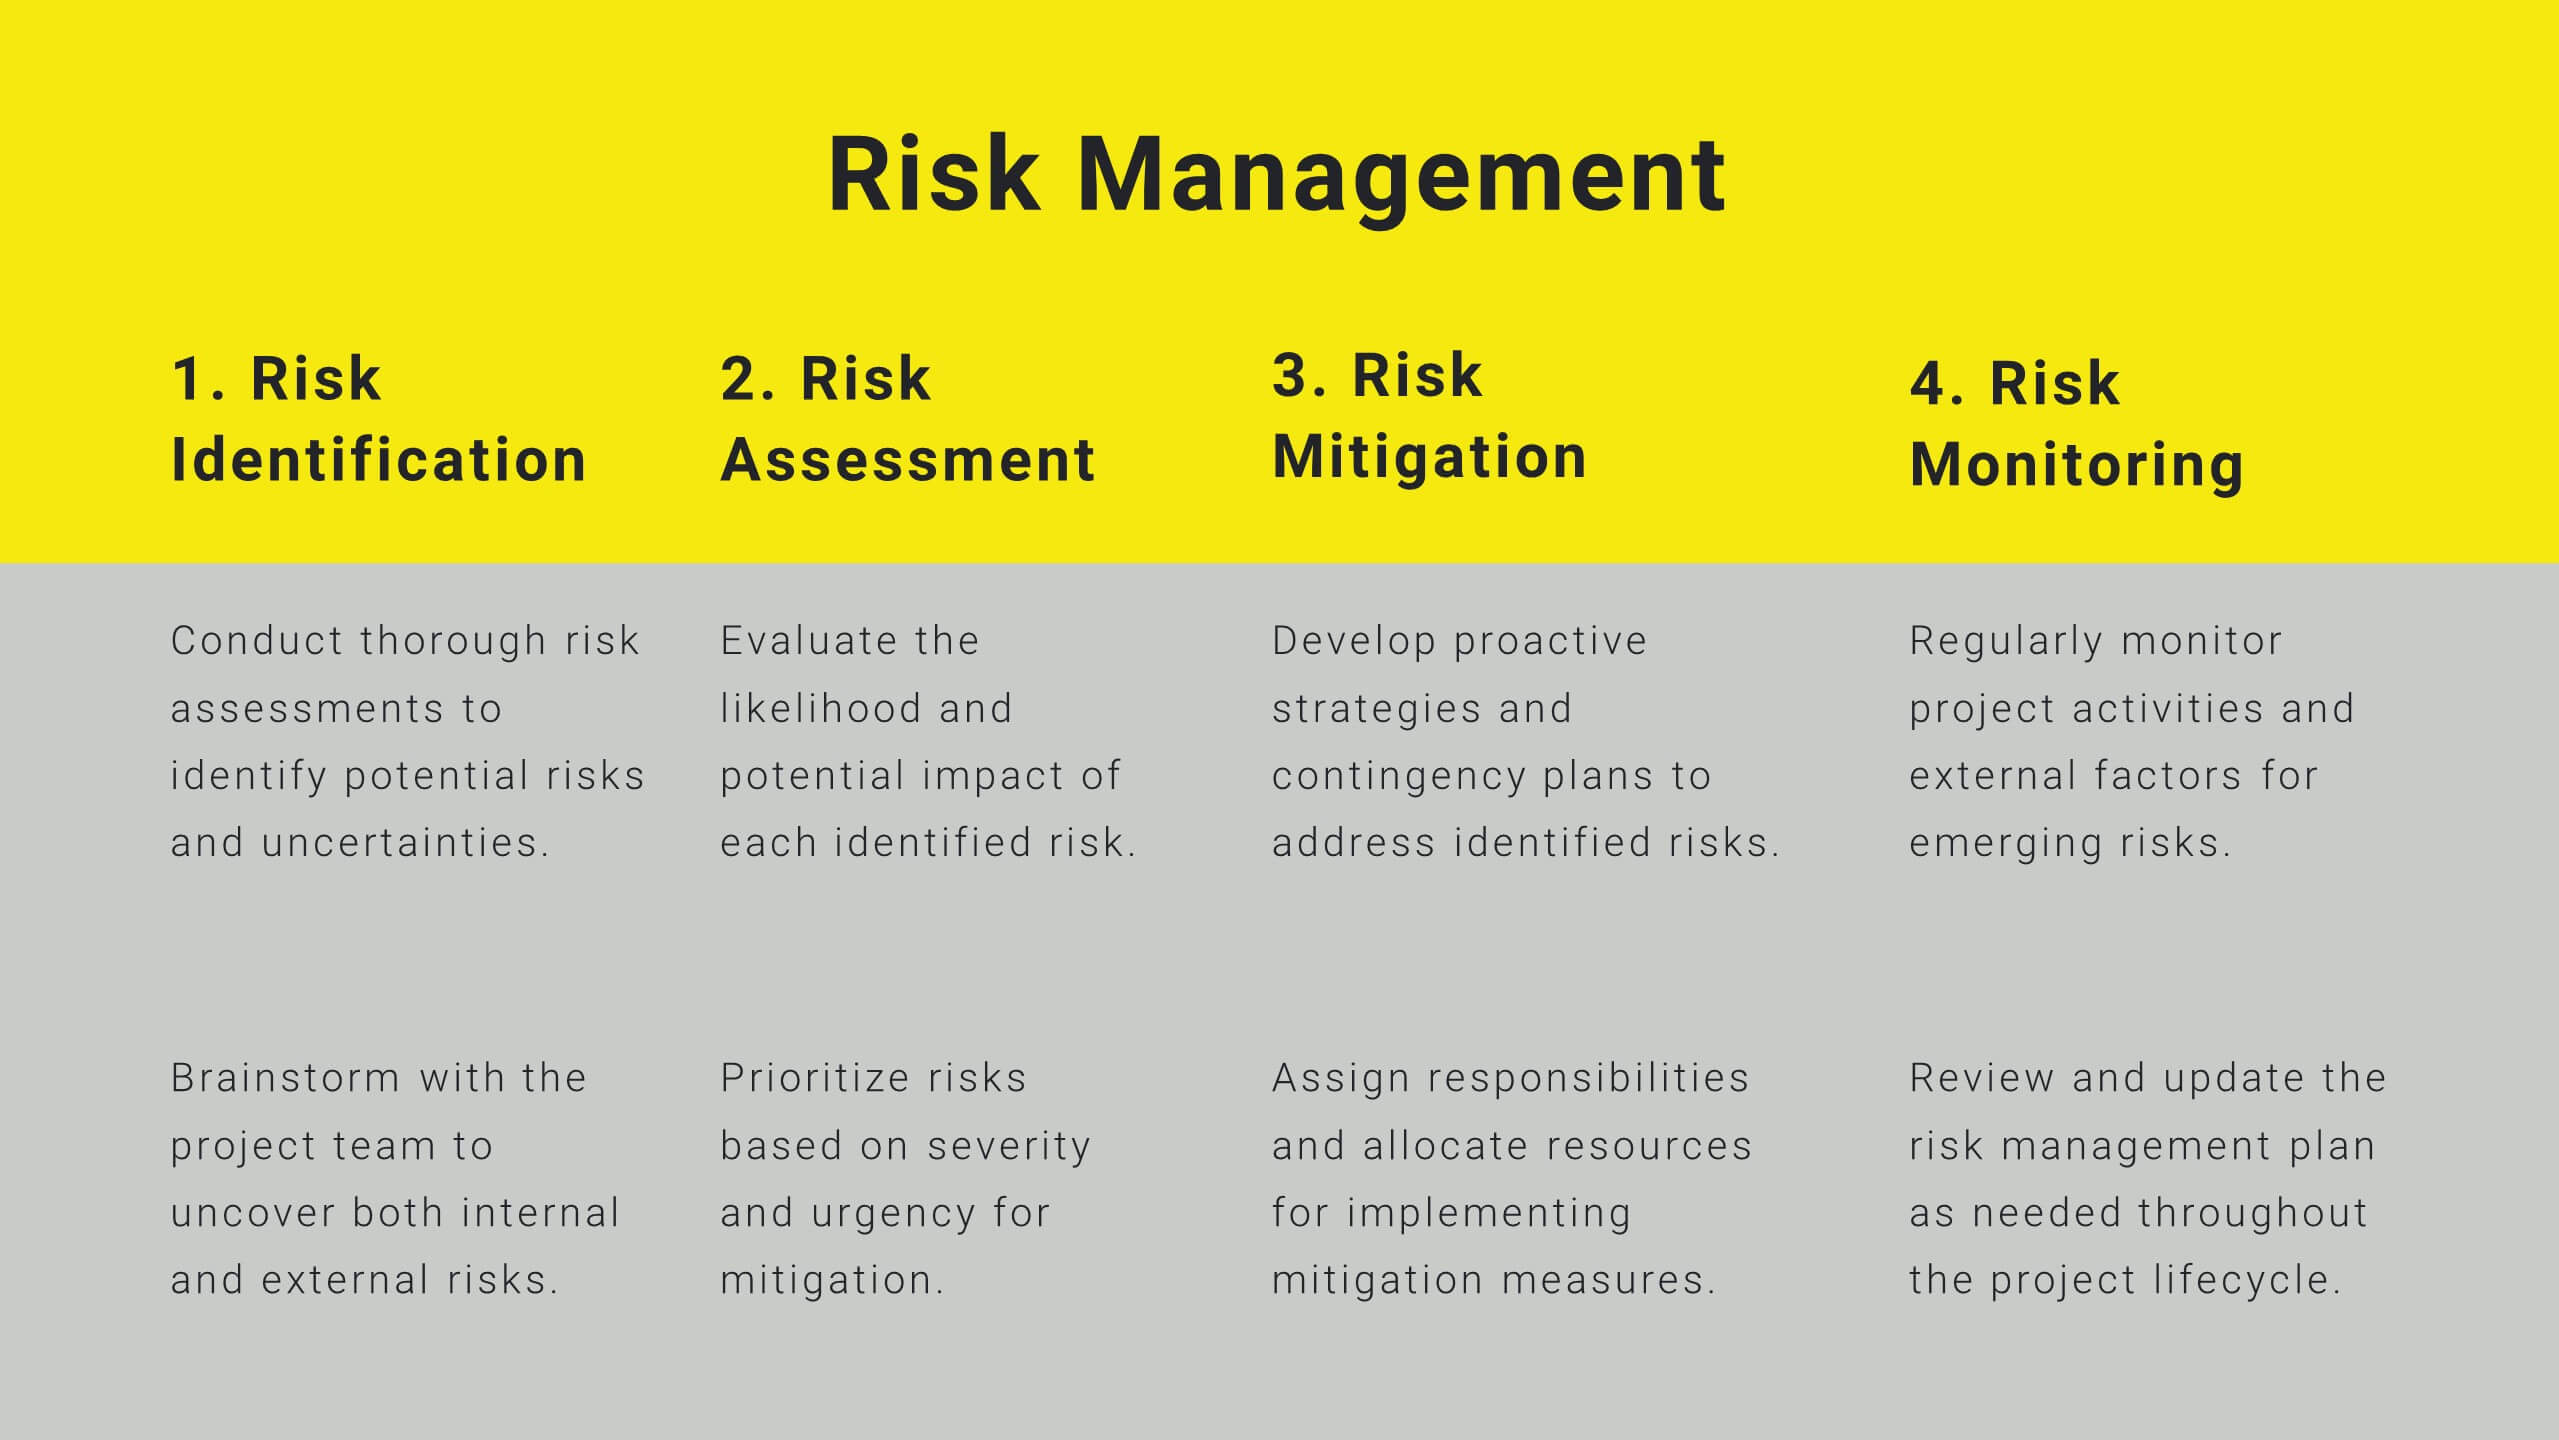
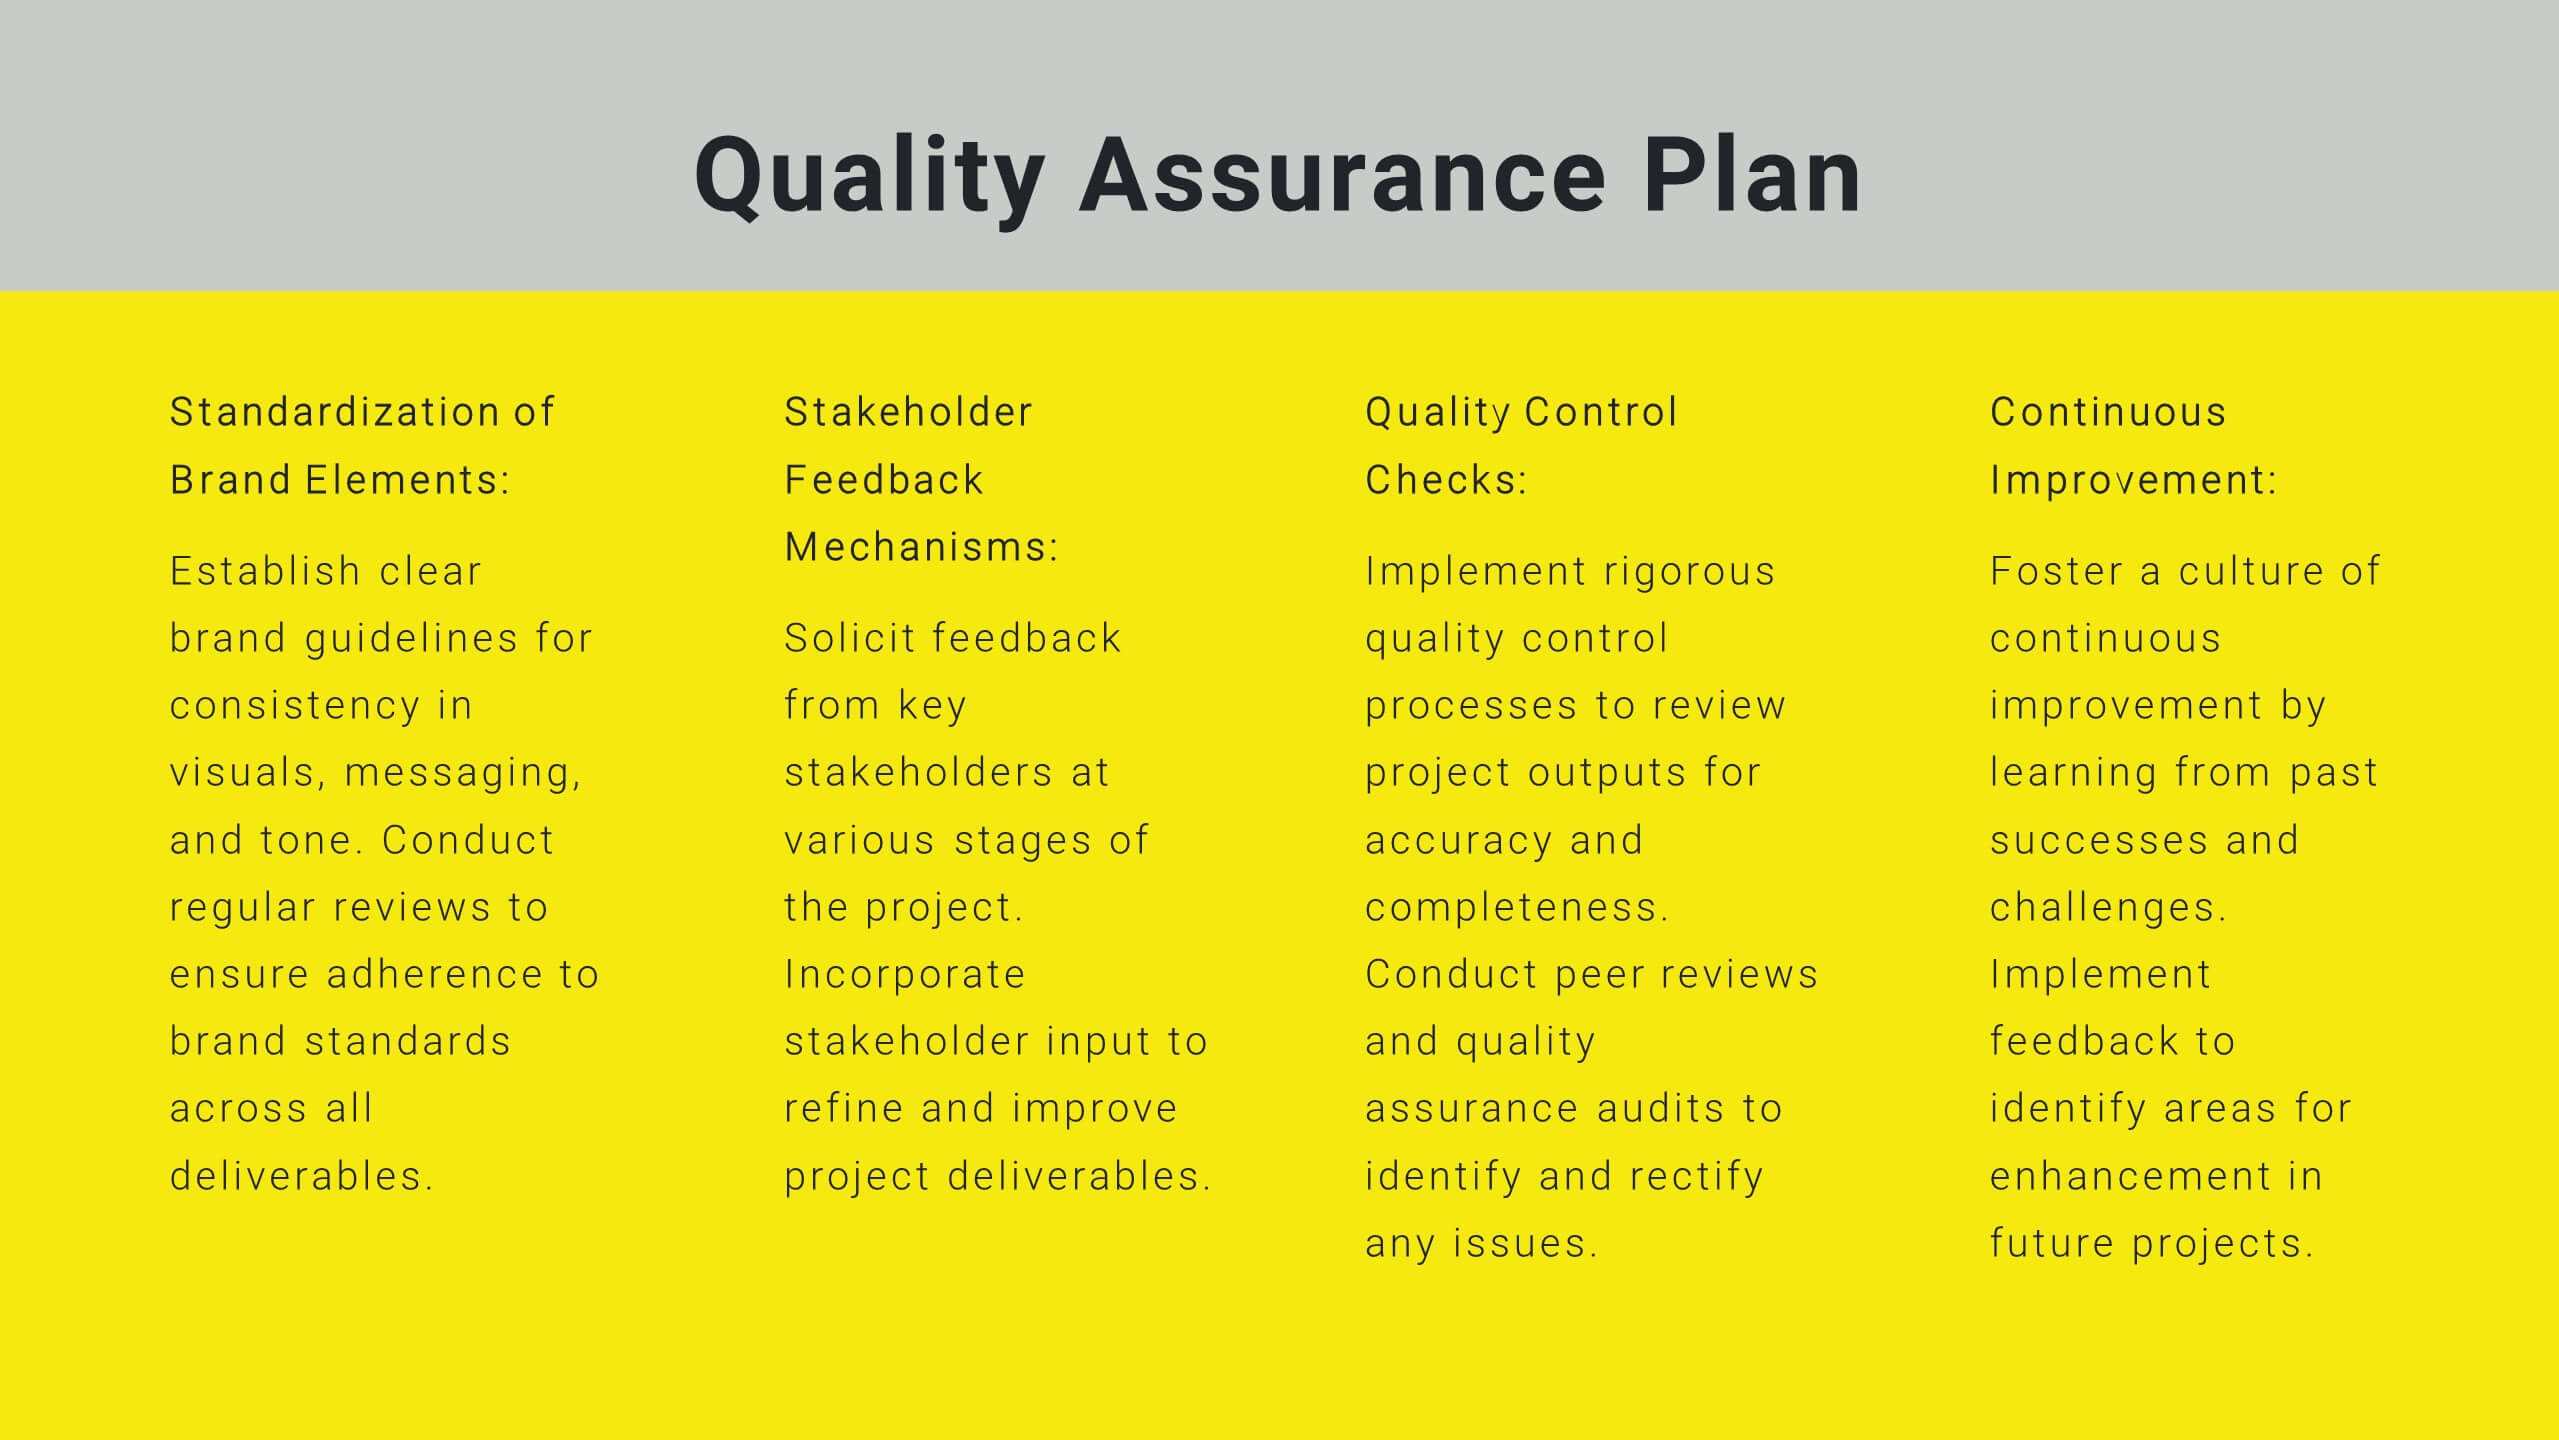
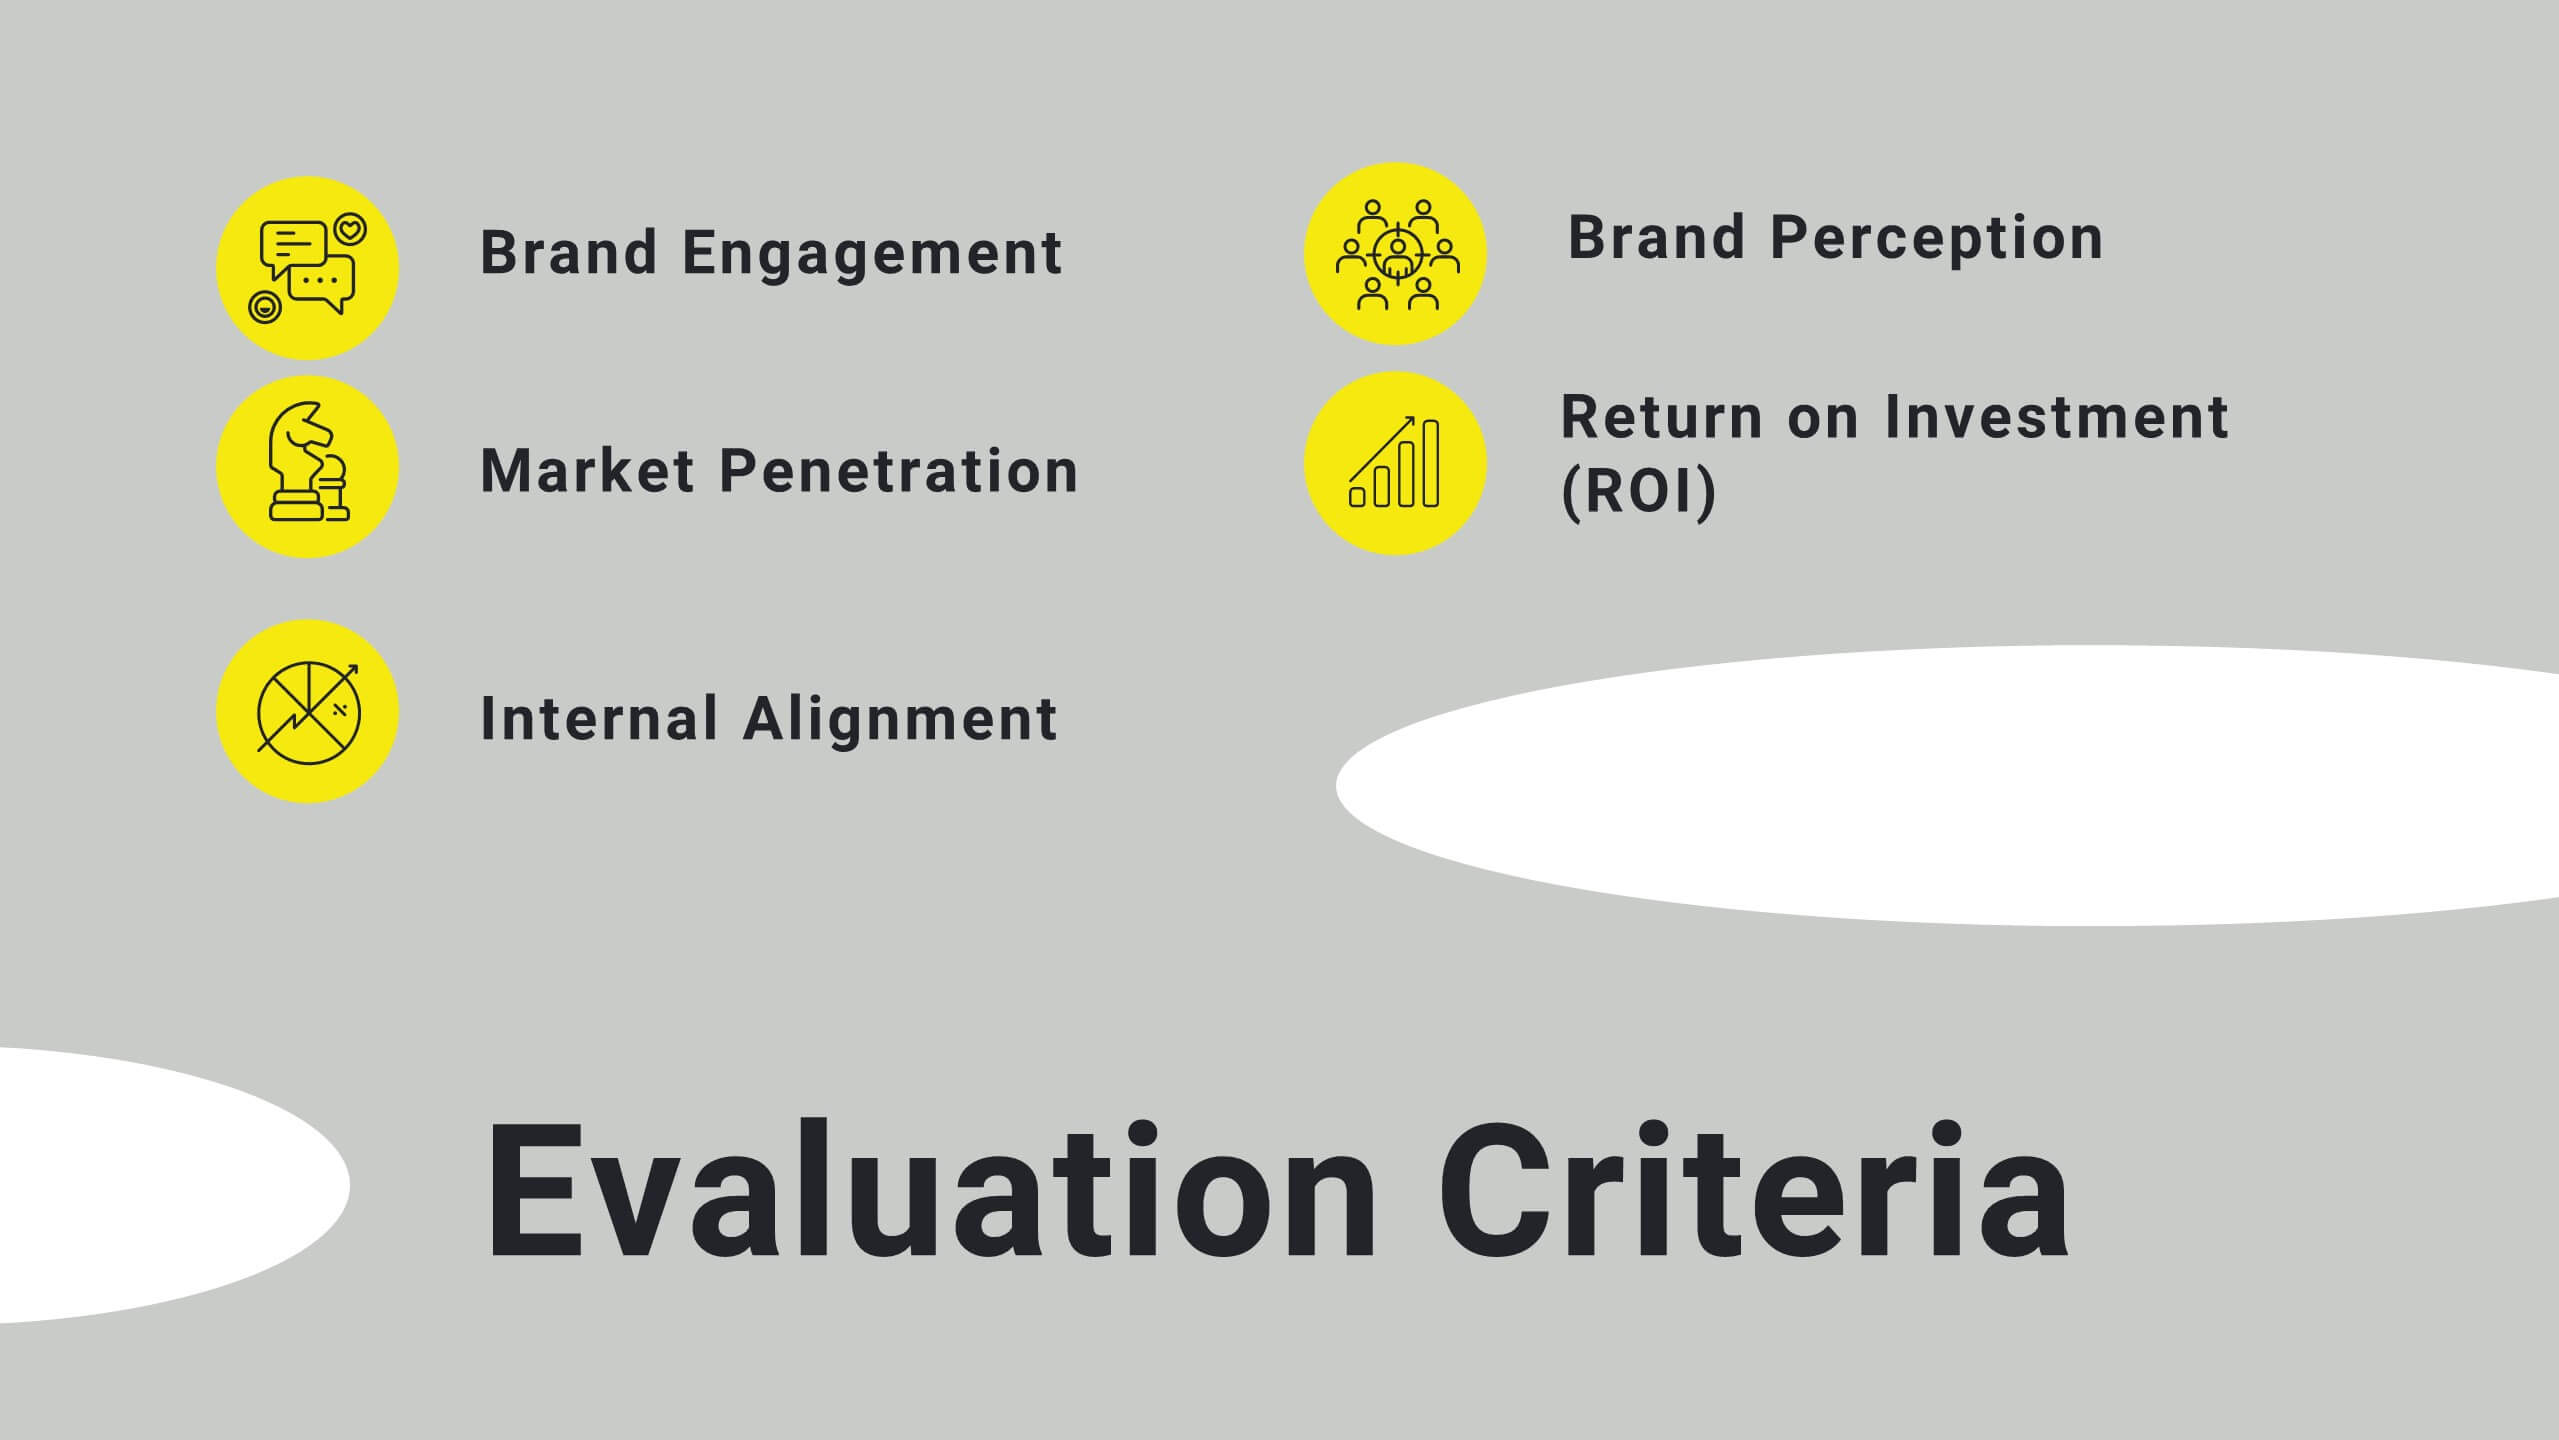
Sable Detailed Project Execution Plan Presentation
Master your project planning with this comprehensive execution plan template! Perfect for detailing project overviews, objectives, and timelines, it includes slides for budget breakdowns, resource allocation, and risk management. Ensure every detail is covered with structured content and clear visuals. Compatible with PowerPoint, Keynote, and Google Slides for seamless presentations on any platform.


10 diapositivas
Financial Money Management Strategies Presentation
Break down your key financial strategies with this clear, wheel-style diagram. Perfect for outlining budgeting principles, savings goals, or investment methods, each segment includes space for titles and concise text. Ideal for financial advisors, consultants, or internal team planning. Fully customizable in PowerPoint, Keynote, and Google Slides.


7 diapositivas
Aviation Terms Infographic
Take flight with our aviation terms infographic, designed with a serene palette of white, blue, and hints of orange that echo the hues of the sky. This meticulously crafted infographic decodes the intricate jargon of the aviation world, making it a breeze for enthusiasts, trainees, and even seasoned aviators to grasp. Ideal for flight schools, airline training programs, and aviation seminars, this infographic simplifies complex terminologies with ease. With full compatibility across PowerPoint, Keynote, and Google Slides, sharing your knowledge of the skies has never been more accessible or visually appealing.


7 diapositivas
Aviation Management Infographic
Aviation management encompasses the effective and efficient operation of various facets within the aviation industry. This vibrant and informative infographic is designed to take you through the skies of efficient aviation operations and successful management strategies. Compatible with Powerpoint, Keynote, and Google Slides. This template involves planning, organizing, directing, and coordinating the activities of airlines, airports, and other organizations related to aviation and aerospace. The featured jet visuals symbolizes the aviation industry's movement and efficiency, setting the tone for the informative adventure.


4 diapositivas
Visual Decision-Making with Harvey Balls
Make smart decisions faster with this clean and strategic Harvey Balls layout. Ideal for comparing key business factors or project options, this slide helps illustrate progress and priorities through four percentage-based visuals. Fully customizable in PowerPoint, Keynote, and Google Slides.


4 diapositivas
Economic Impact on Stock Market
Visualize financial cause and effect with this step-by-step economic impact infographic. Ideal for explaining market trends, policy changes, or fiscal outcomes, this slide uses a four-part arrow path starting with a money bag icon. Each stage—A to D—can be customized with data and analysis. Fully editable in PowerPoint, Keynote, and Google Slides.


7 diapositivas
Business Model Canvas Segments Infographic Presentation
The Business Model Canvas is a strategic management and entrepreneurial tool that helps businesses to visualize, analyze, and develop their business models. This template gives you the ability to create a visually attractive infographic while presenting your business model in a professional format. This eye-catching template is made to help your audience visualize the business model you are presenting and easily follow it with the instructive text slides. Customize this template in just a couple of minutes. Simple and easy to use, ready to be edited with colors and graphics of your choice.