


Características


¿Tienes alguna pregunta?
Recomendar


5 diapositivas
Buyer Journey Infographic Presentation
Understanding how buyers move from awareness to action becomes effortless with this clean, visual presentation. It guides you through each stage, helping you explain behaviors, insights, and touchpoints with clarity. Easy to customize and fully compatible with PowerPoint, Keynote, and Google Slides.


5 diapositivas
Customer Relationship Strategy Presentation
Refine your approach to customer interactions with the "Customer Relationship Strategy" presentation templates. Perfect for delineating clear, actionable strategies to enhance client engagement and satisfaction, these templates are a must-have for businesses focused on building lasting customer relationships. Compatible with PowerPoint, Keynote, and Google Slides, they provide the tools to effectively communicate your customer relationship policies and goals.


21 diapositivas
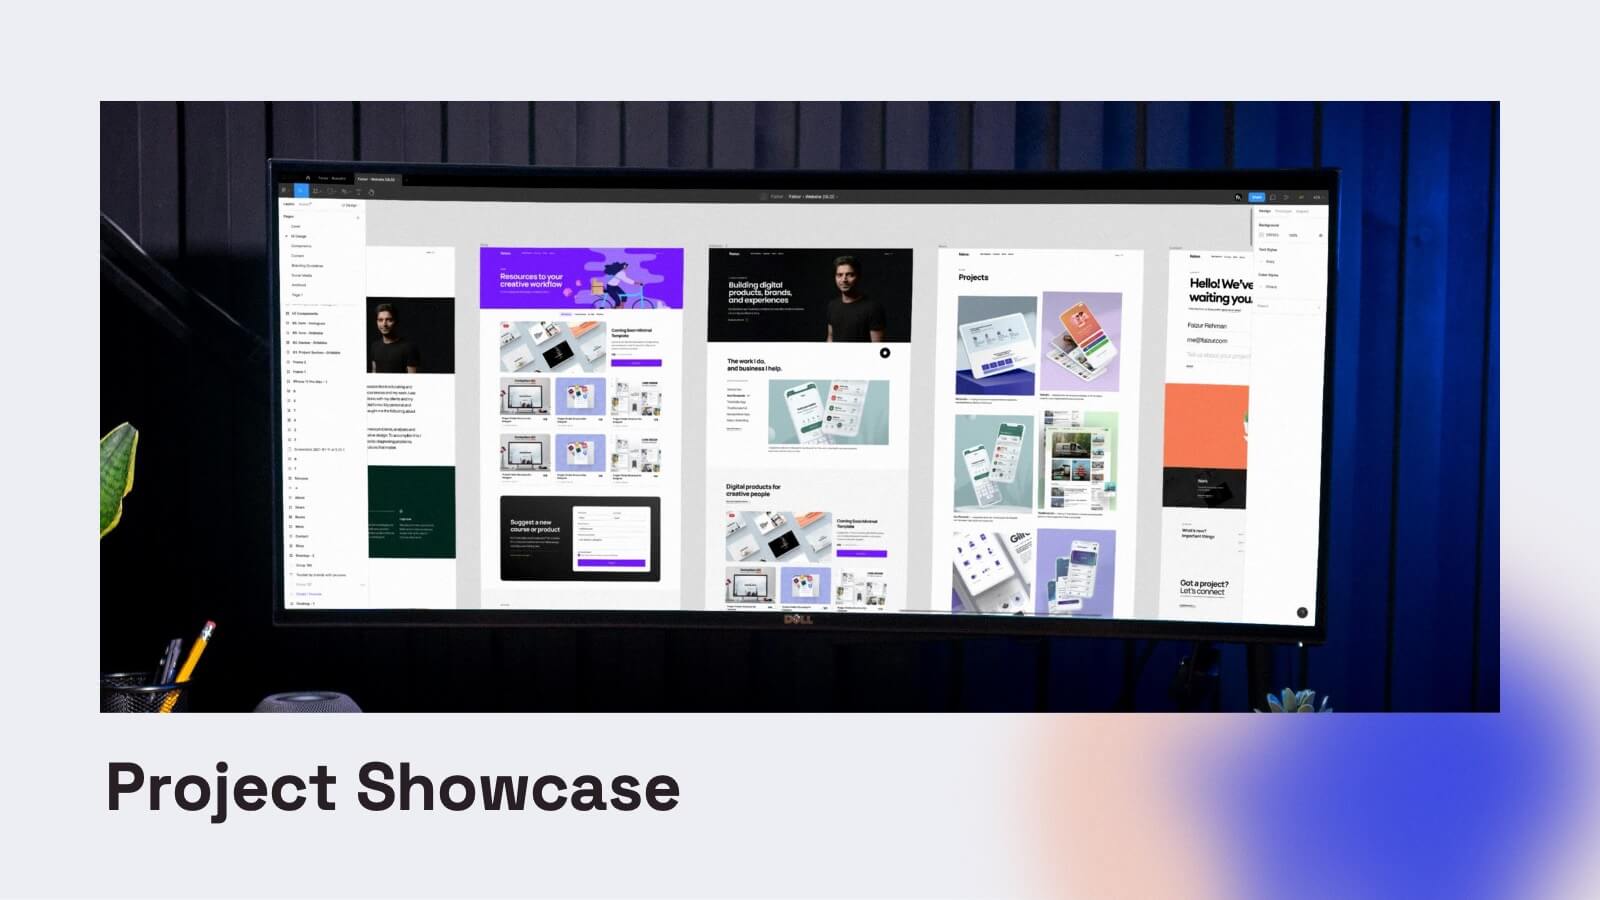
Chimerae Design Portfolio Presentation
Elevate your design portfolio with this modern and visually dynamic template, crafted to showcase your creative process and expertise. This layout includes slides for introduction, concept development, and design elements, allowing you to present your unique approach and attention to detail. Highlight your design process, including research insights, prototypes, and final designs, to demonstrate your workflow and results. Showcase your brand identity with dedicated slides for typography, color palettes, and textures, ensuring a cohesive and professional presentation. This fully customizable template is compatible with PowerPoint, Google Slides, and Keynote, offering versatility for designers, freelancers, and agencies aiming to leave a lasting impression. Tailor the design to match your brand and confidently present your portfolio in style.


22 diapositivas
Zephyr Product Launch Pitch Deck Presentation
Step into the spotlight with this modern and captivating product launch pitch deck! Designed to showcase your ideas with clarity, it covers every key aspect from market opportunities to financials. Impress investors with strategic insights and sleek visuals that guide them through your business plan. Perfect for PowerPoint, Keynote, and Google Slides!


4 diapositivas
Left and Right Brain Diagram Presentation
Unlock the perfect blend of logic and creativity with a visual layout that highlights how analytical thinking and imaginative ideas work together. This presentation makes it easy to compare concepts, explain processes, and illustrate dual perspectives with clarity and color. Fully compatible with PowerPoint, Keynote, and Google Slides.


23 diapositivas
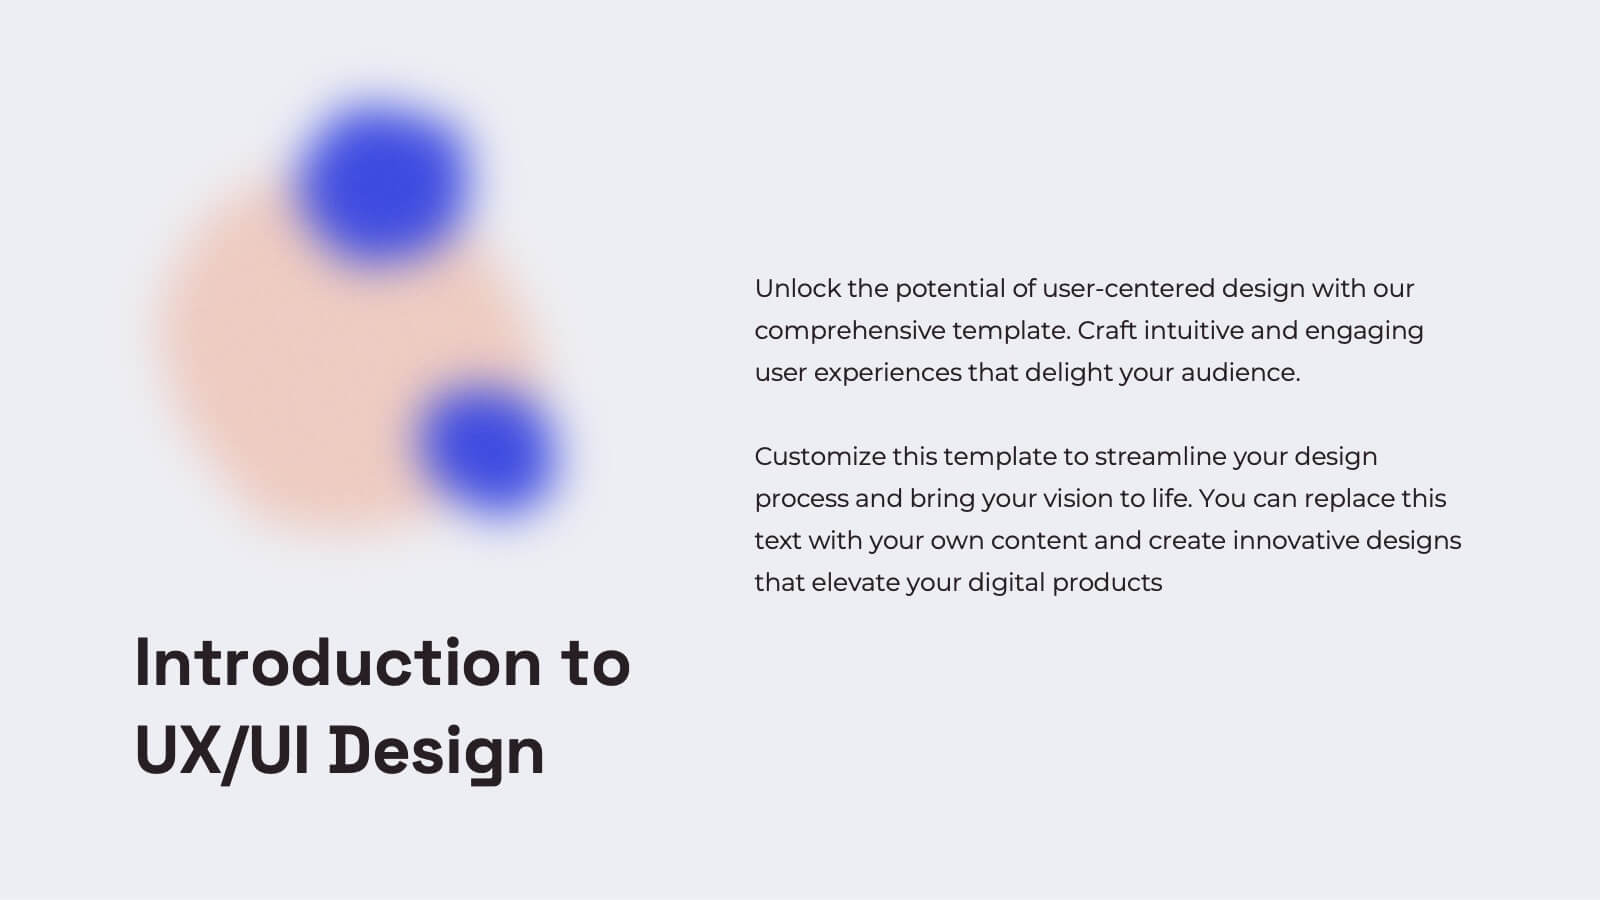
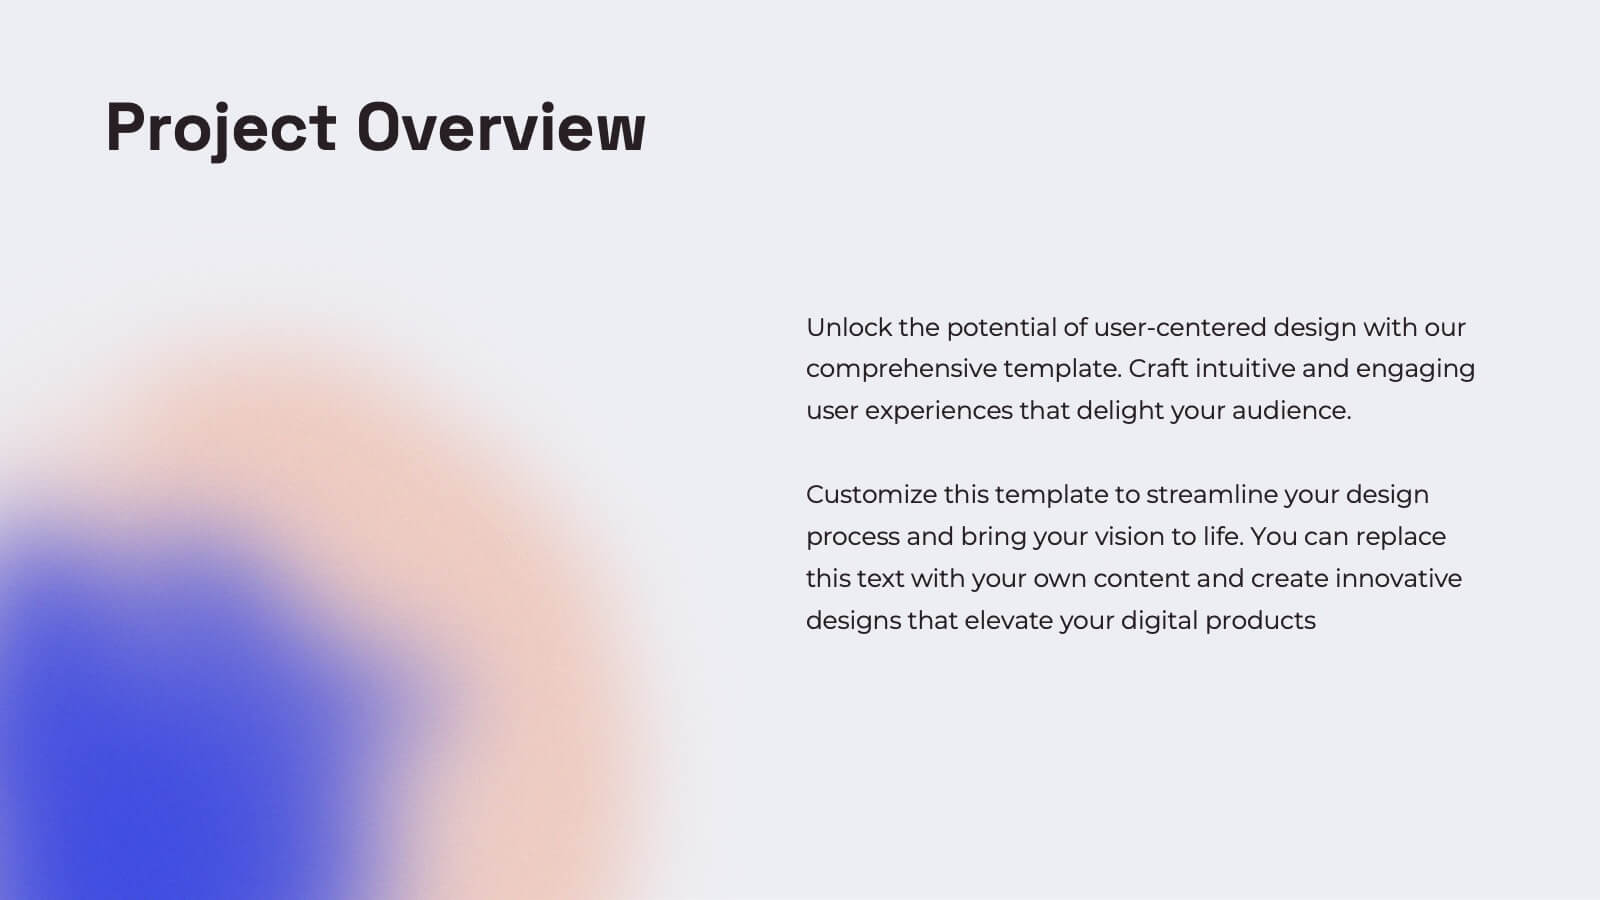
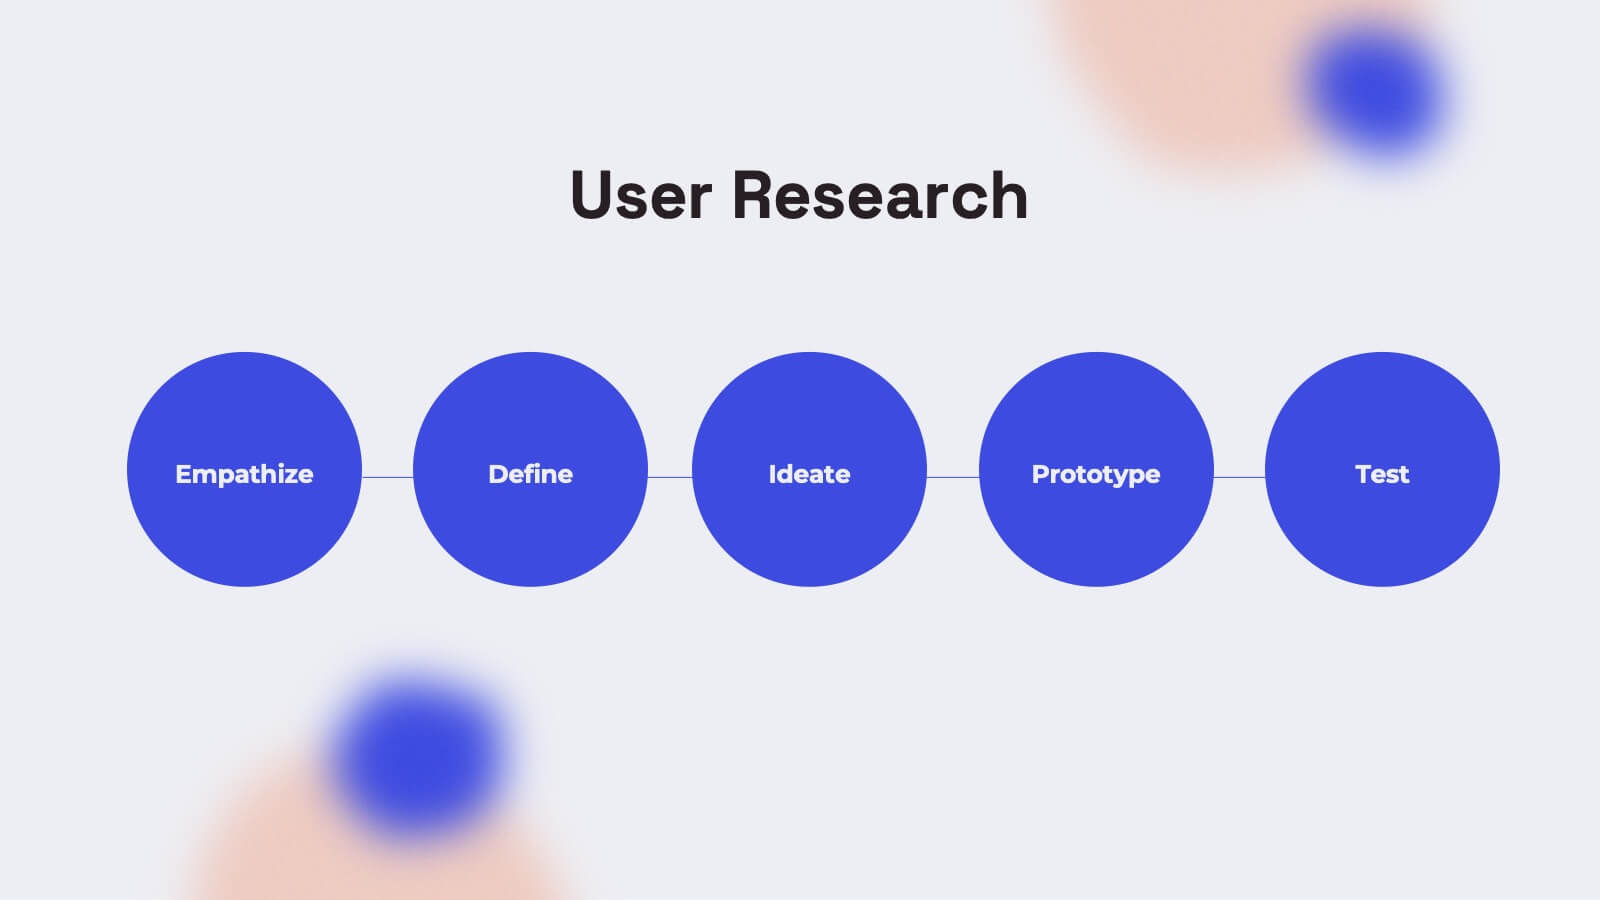
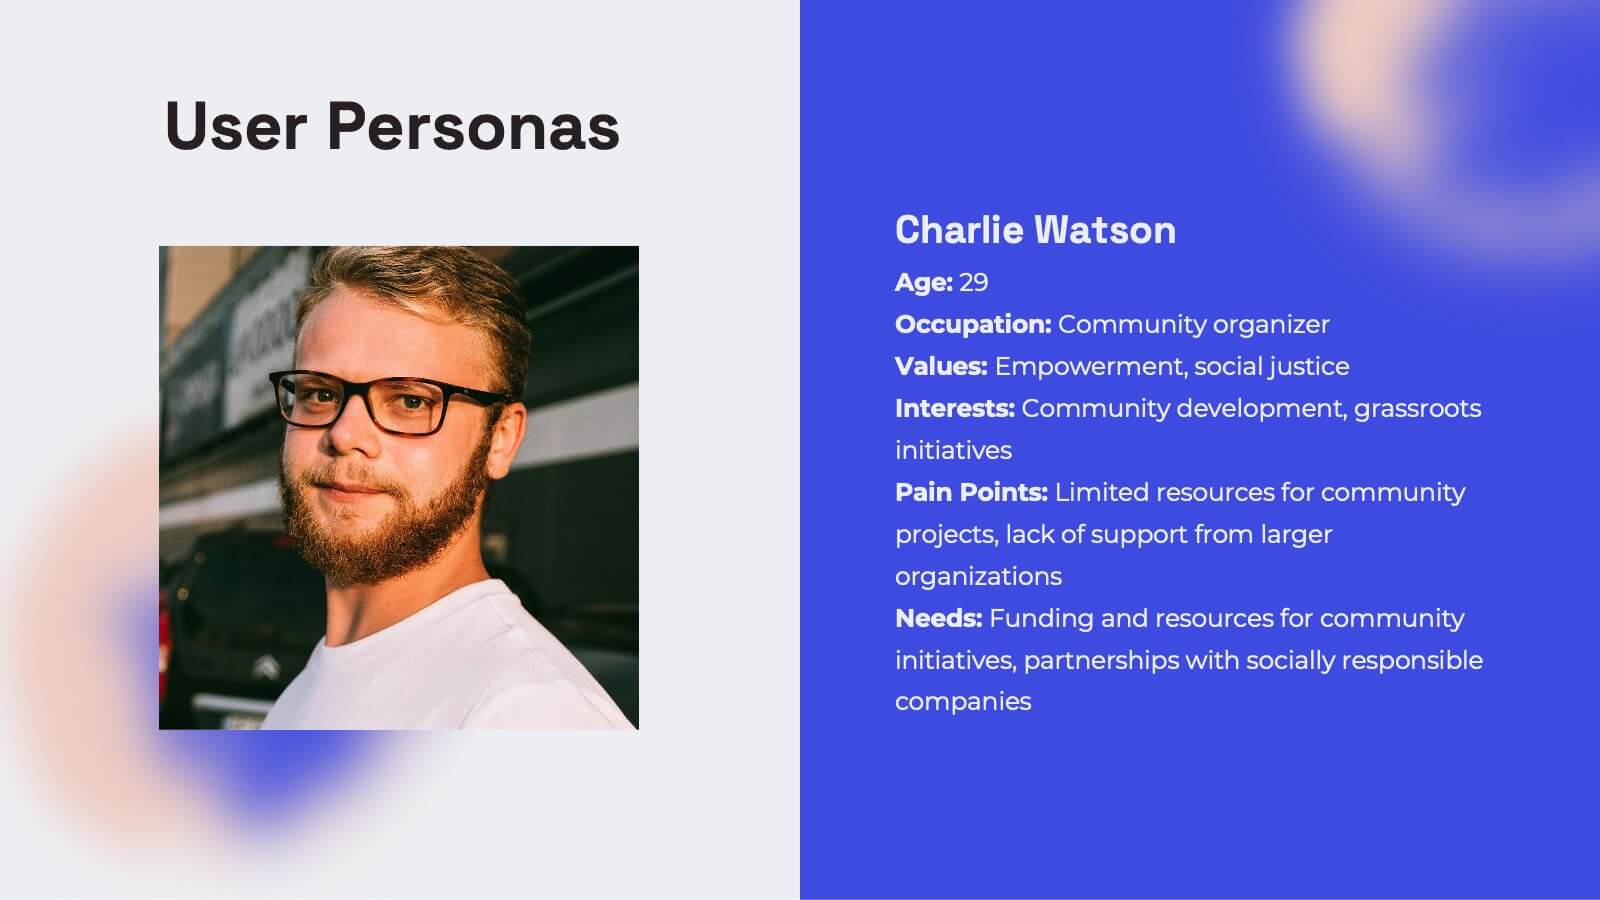
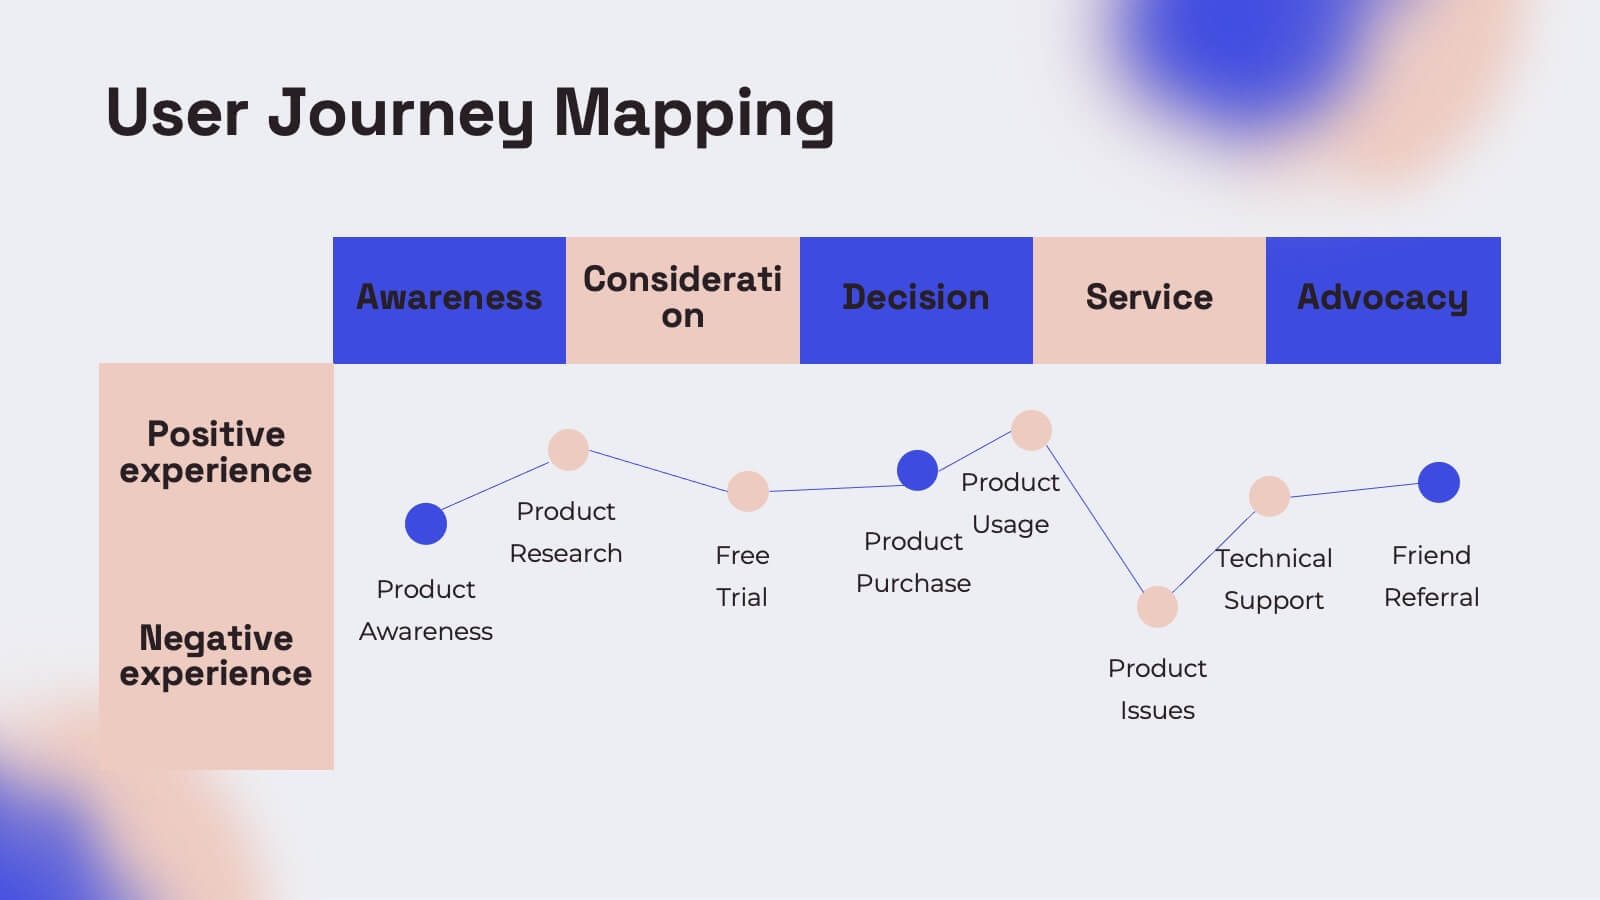
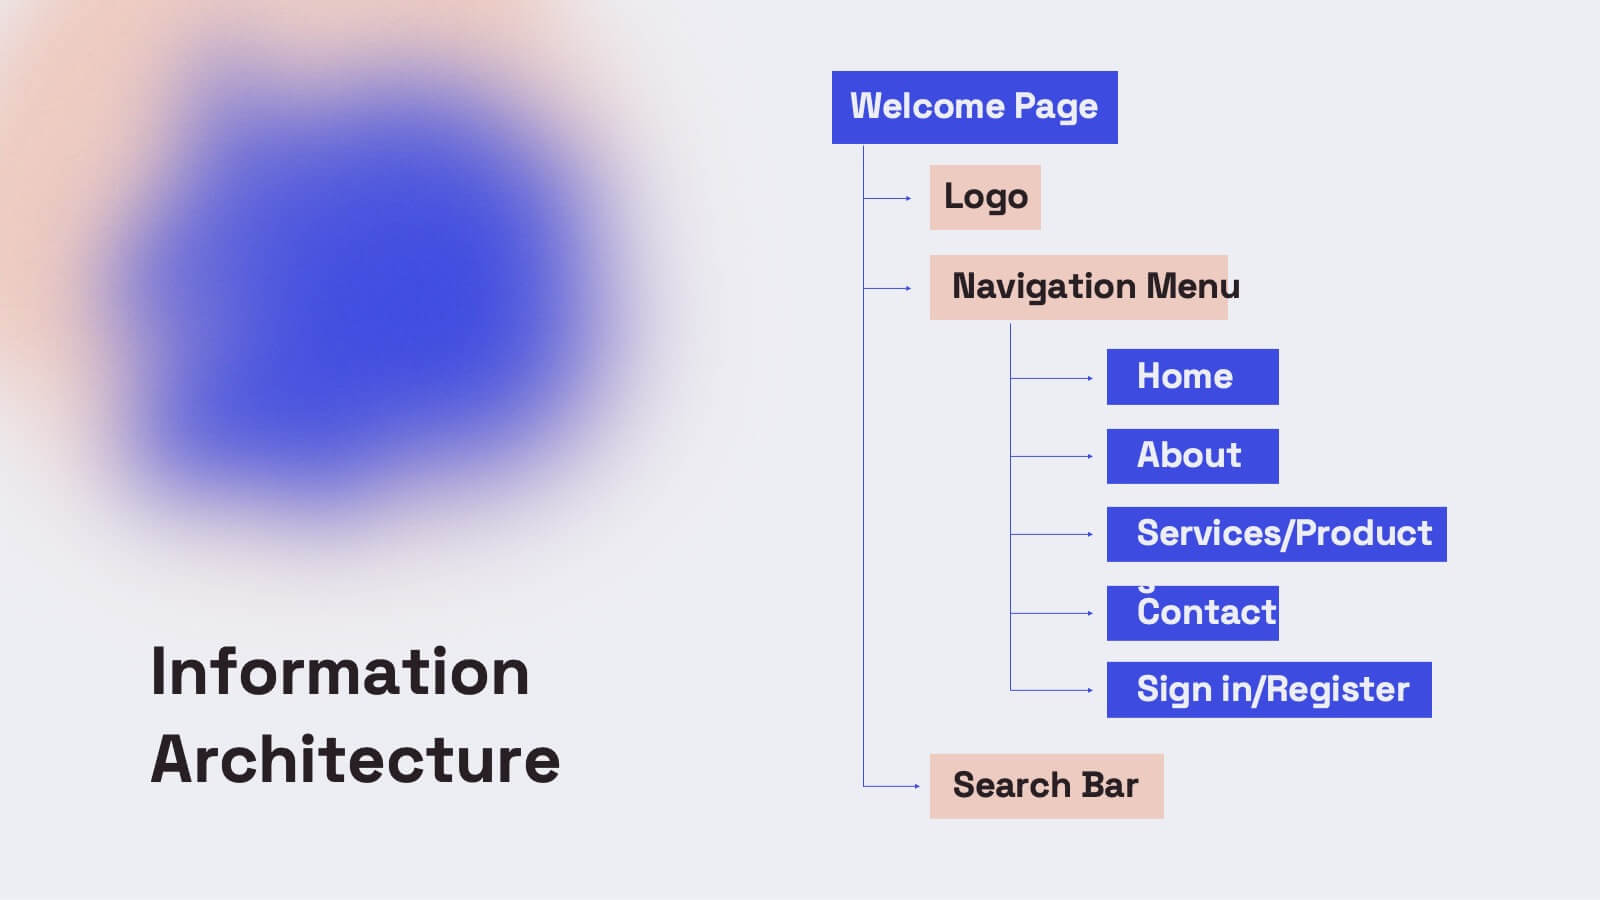
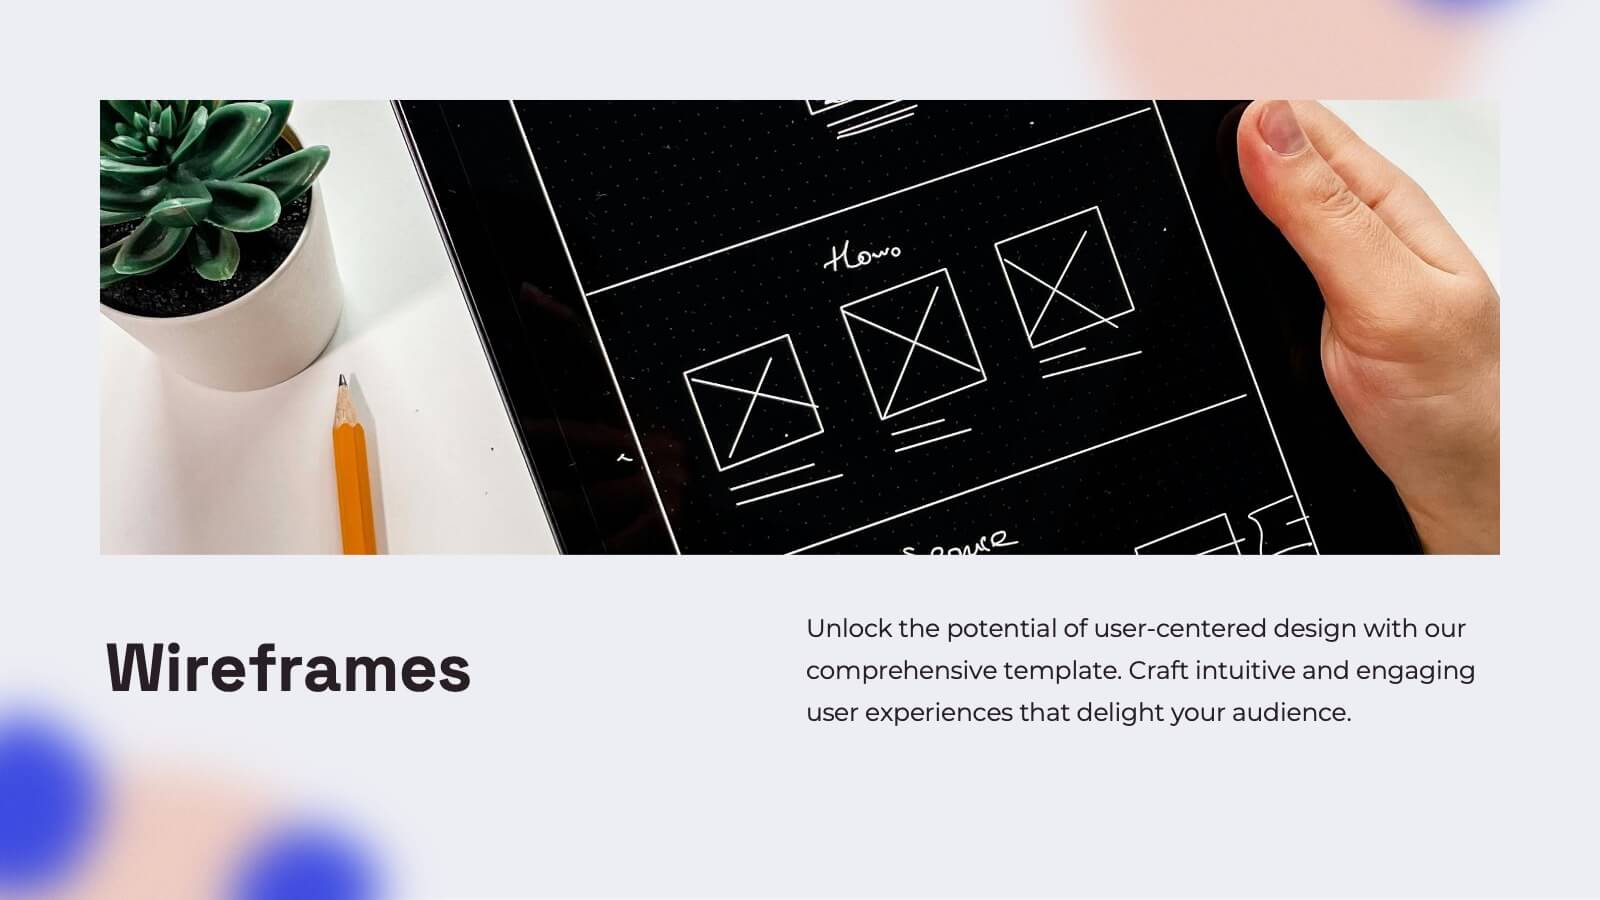
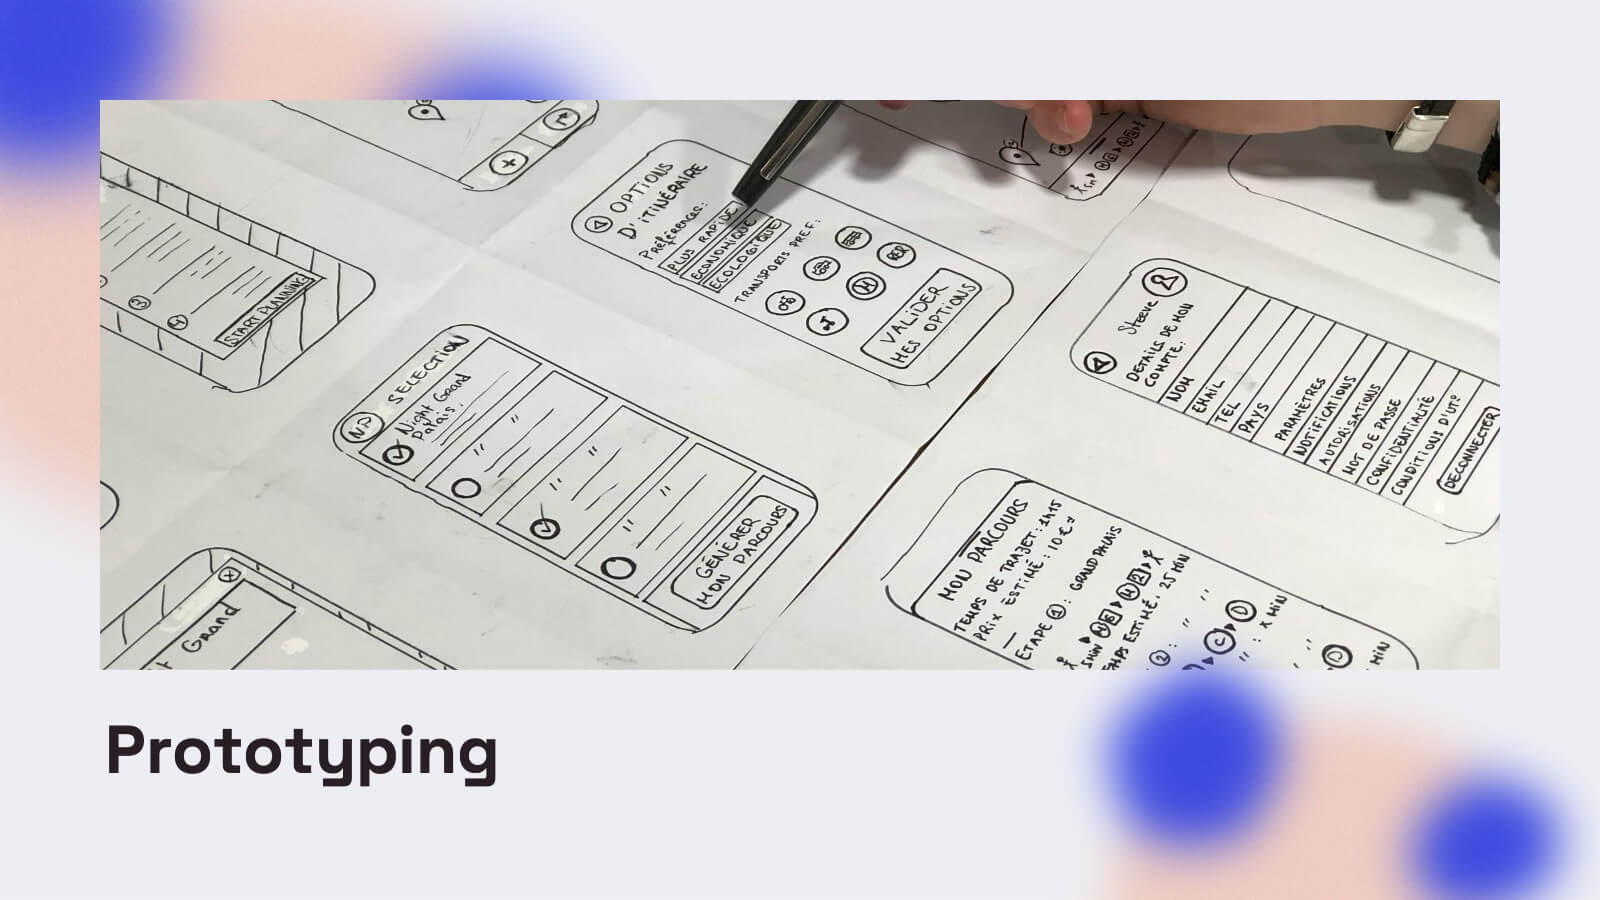
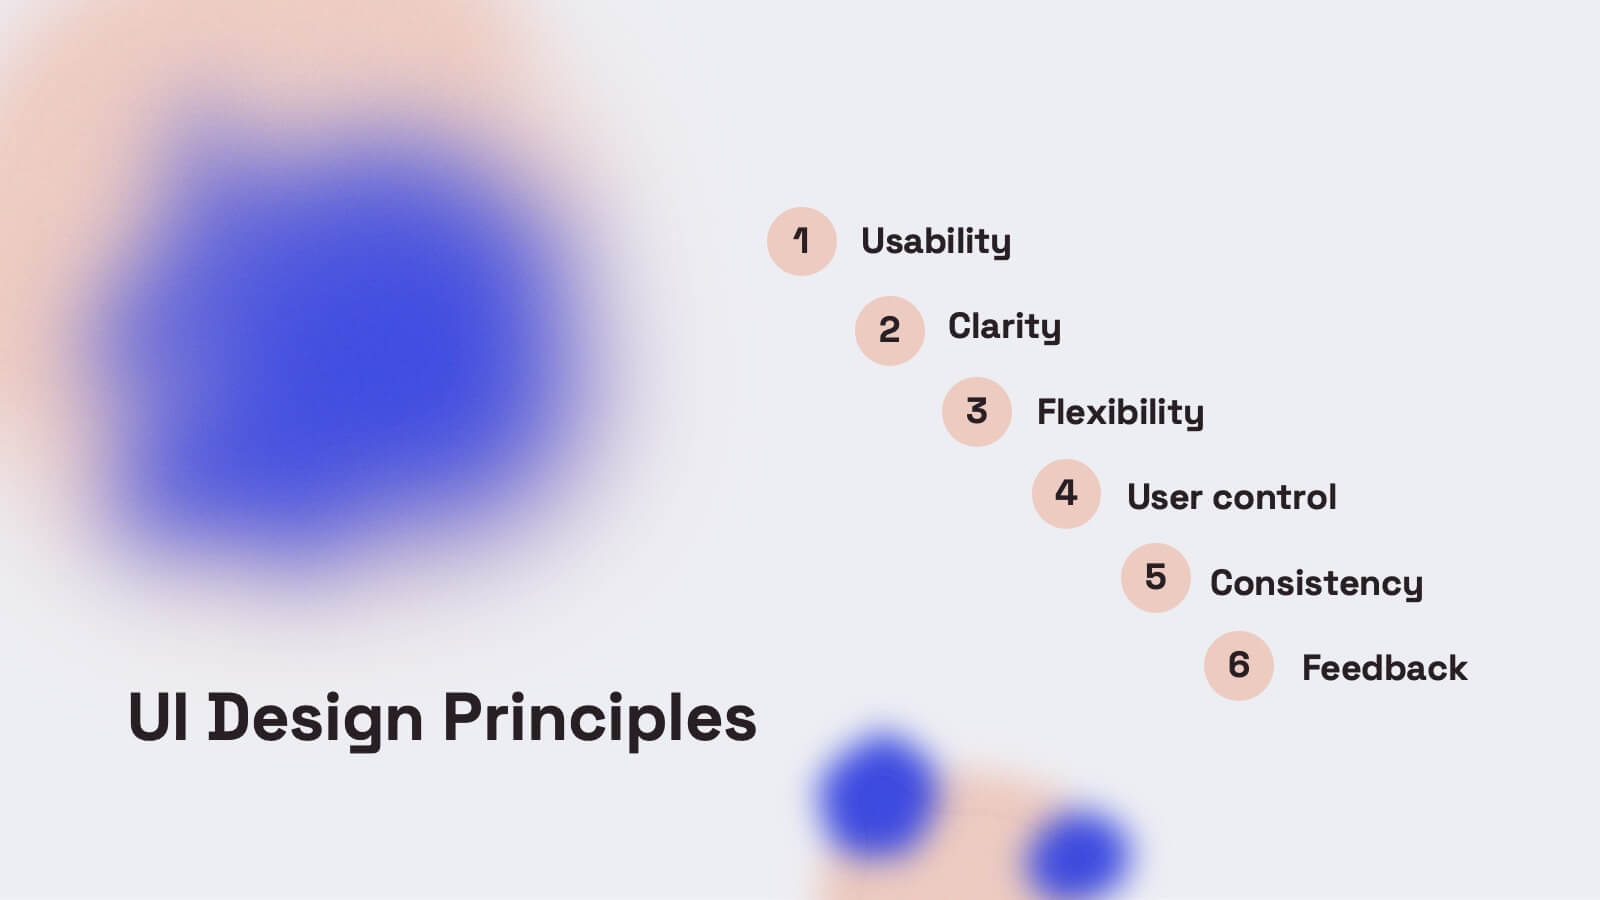
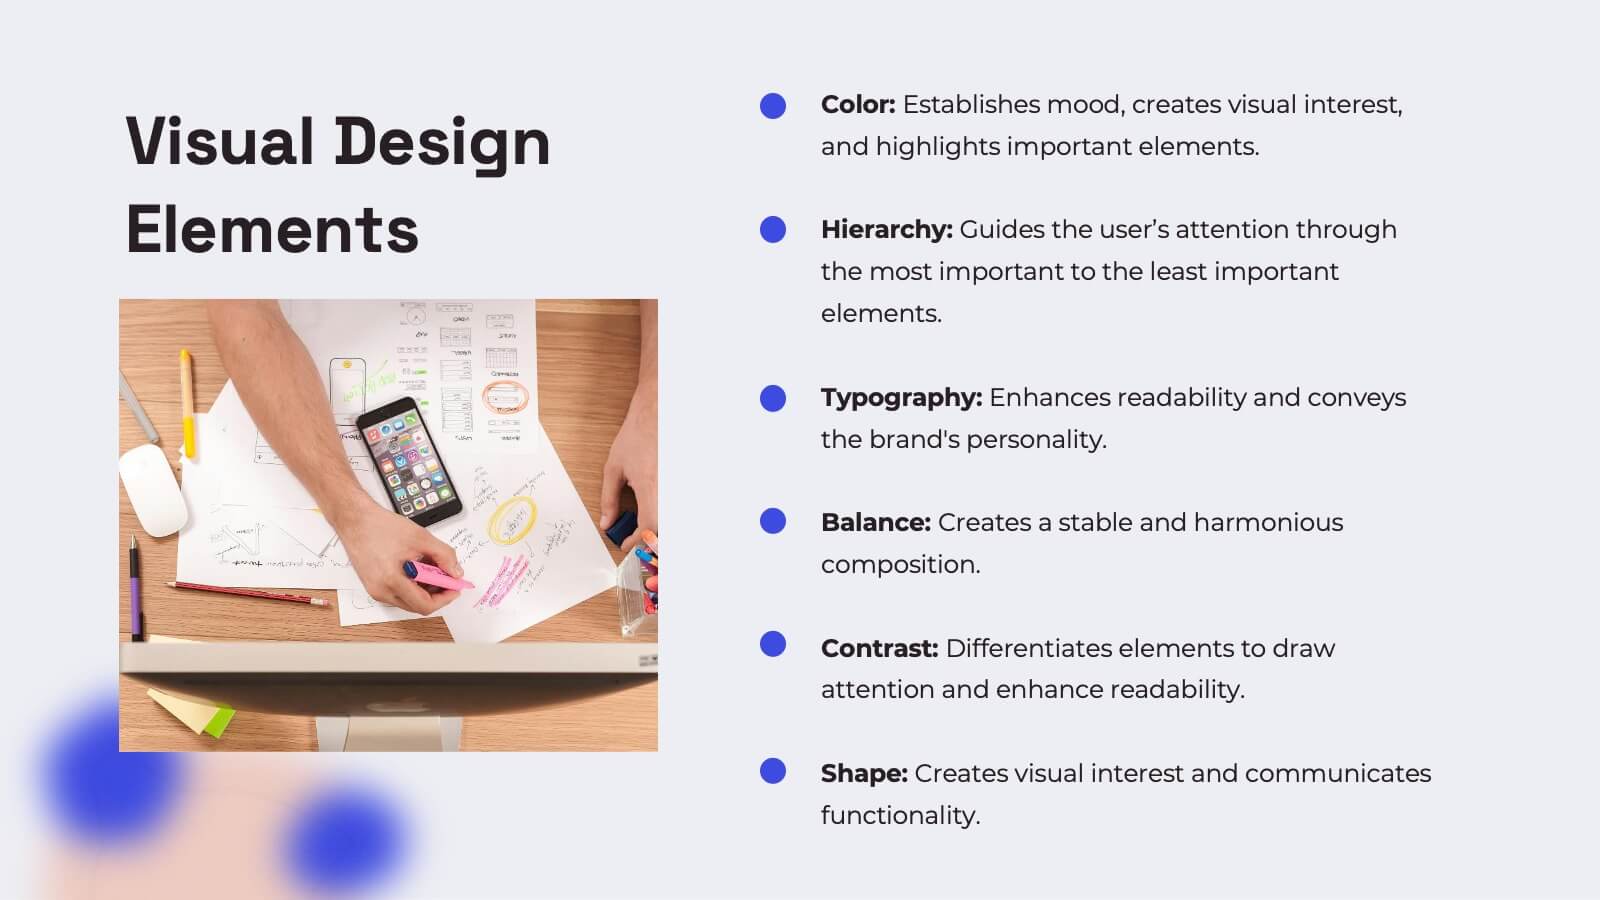
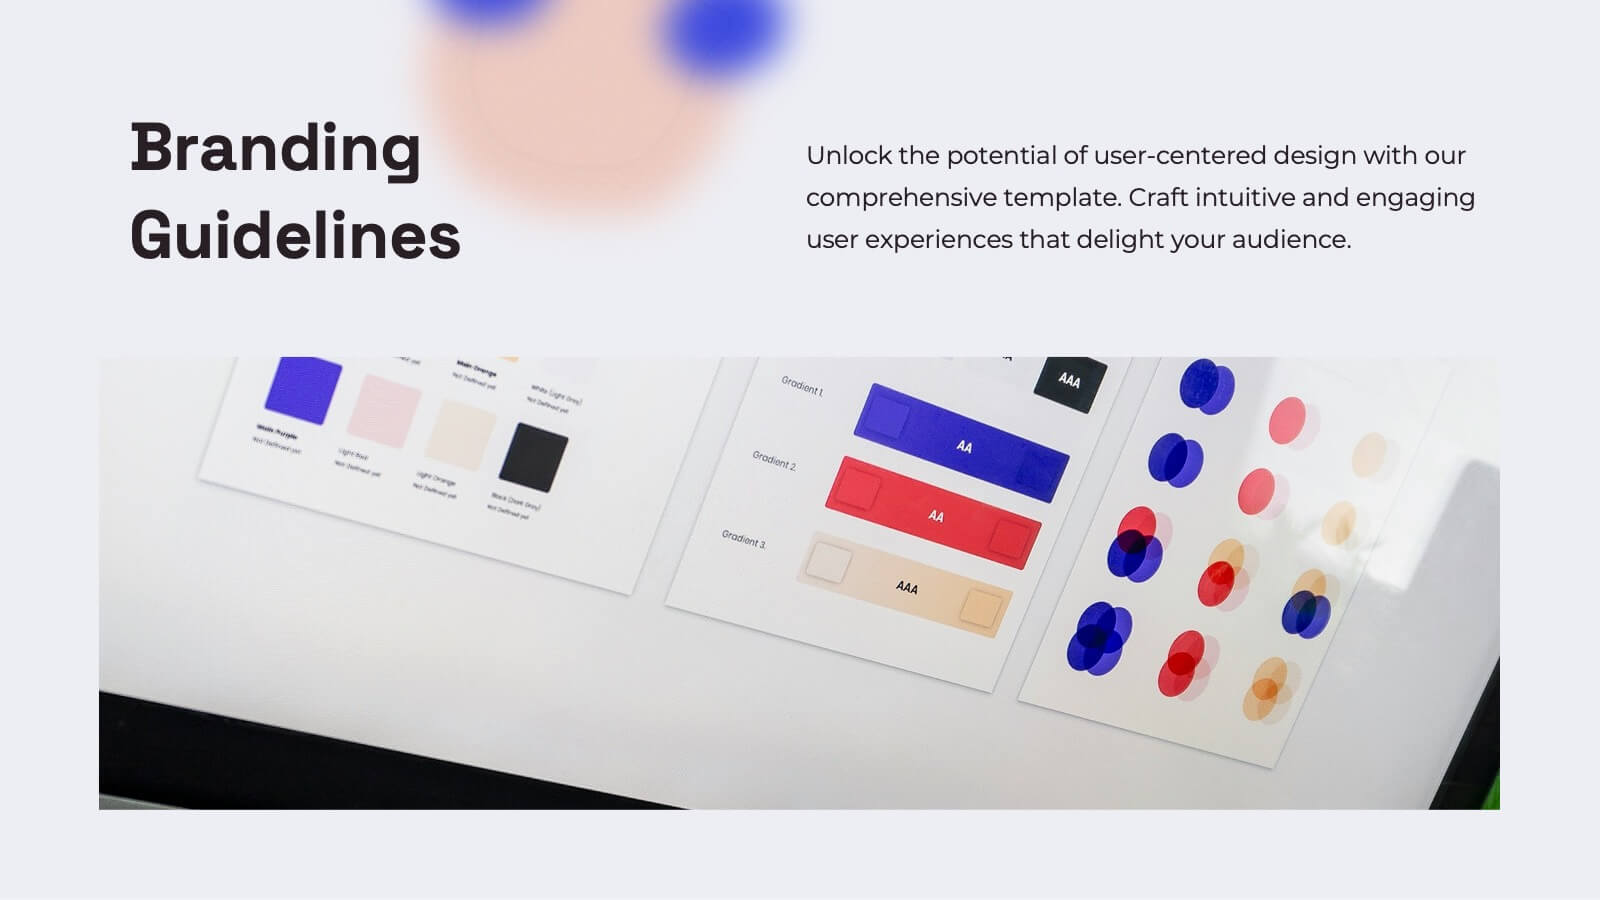
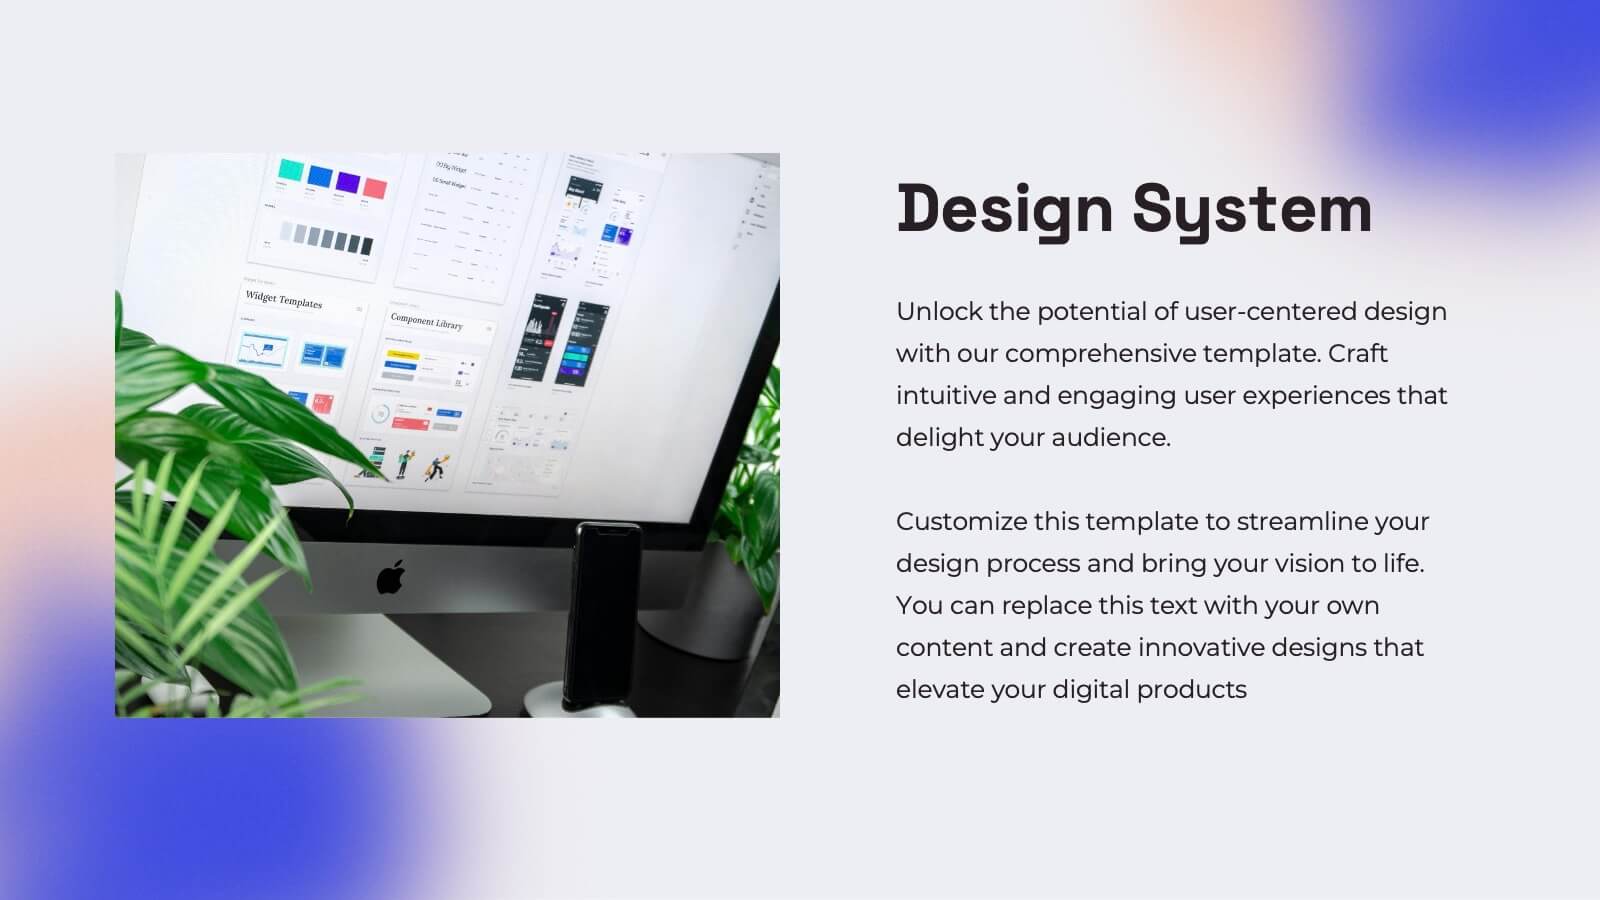
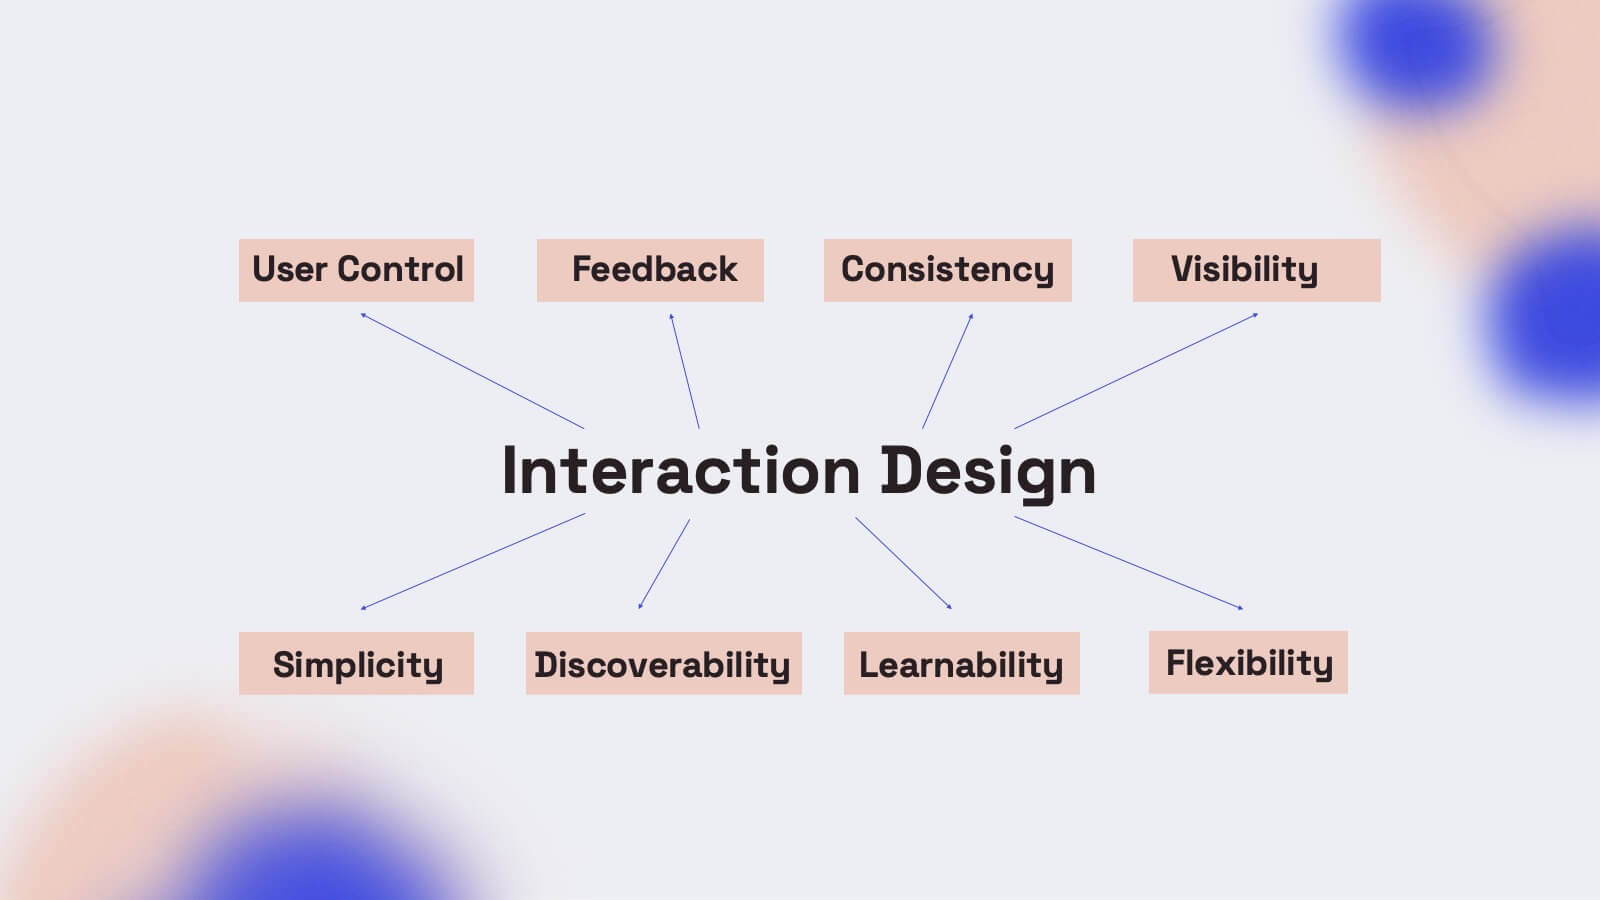
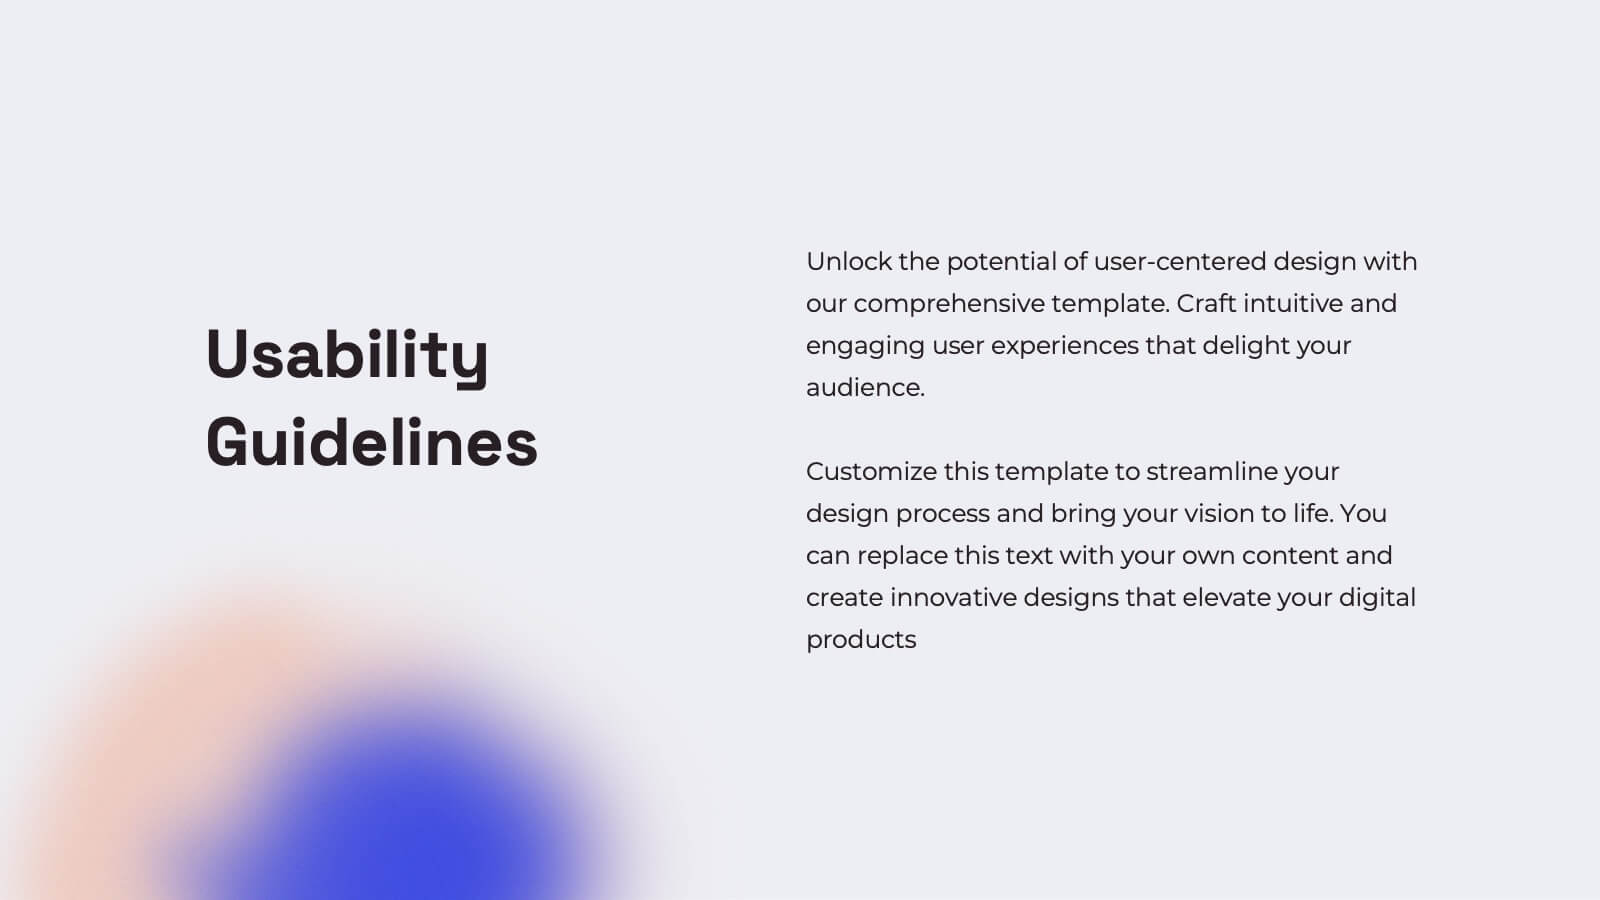
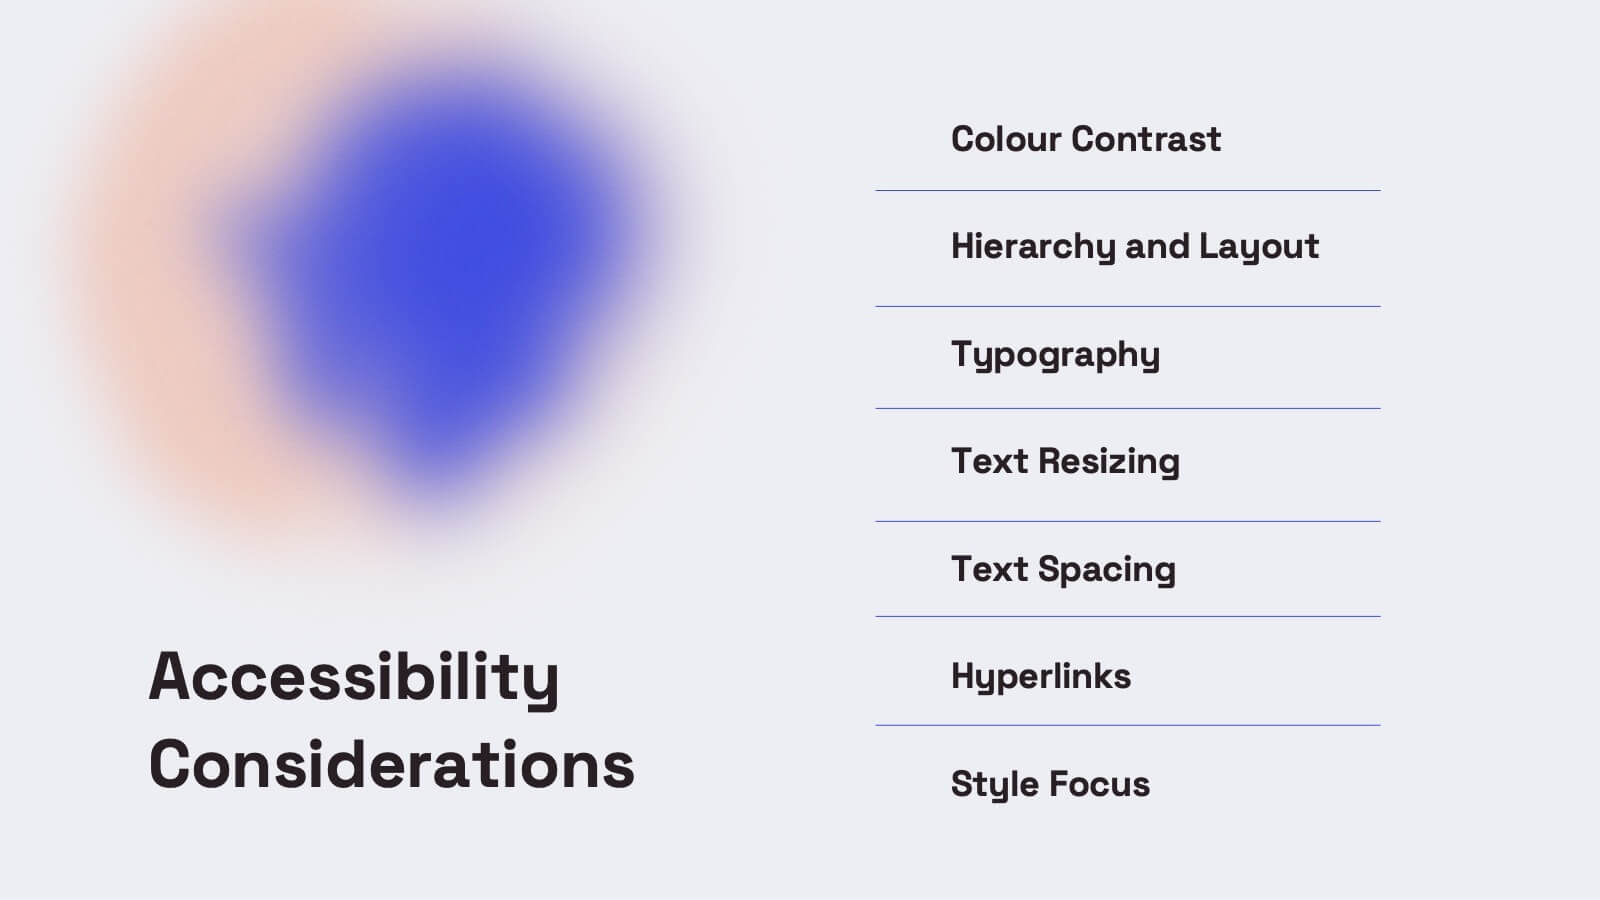
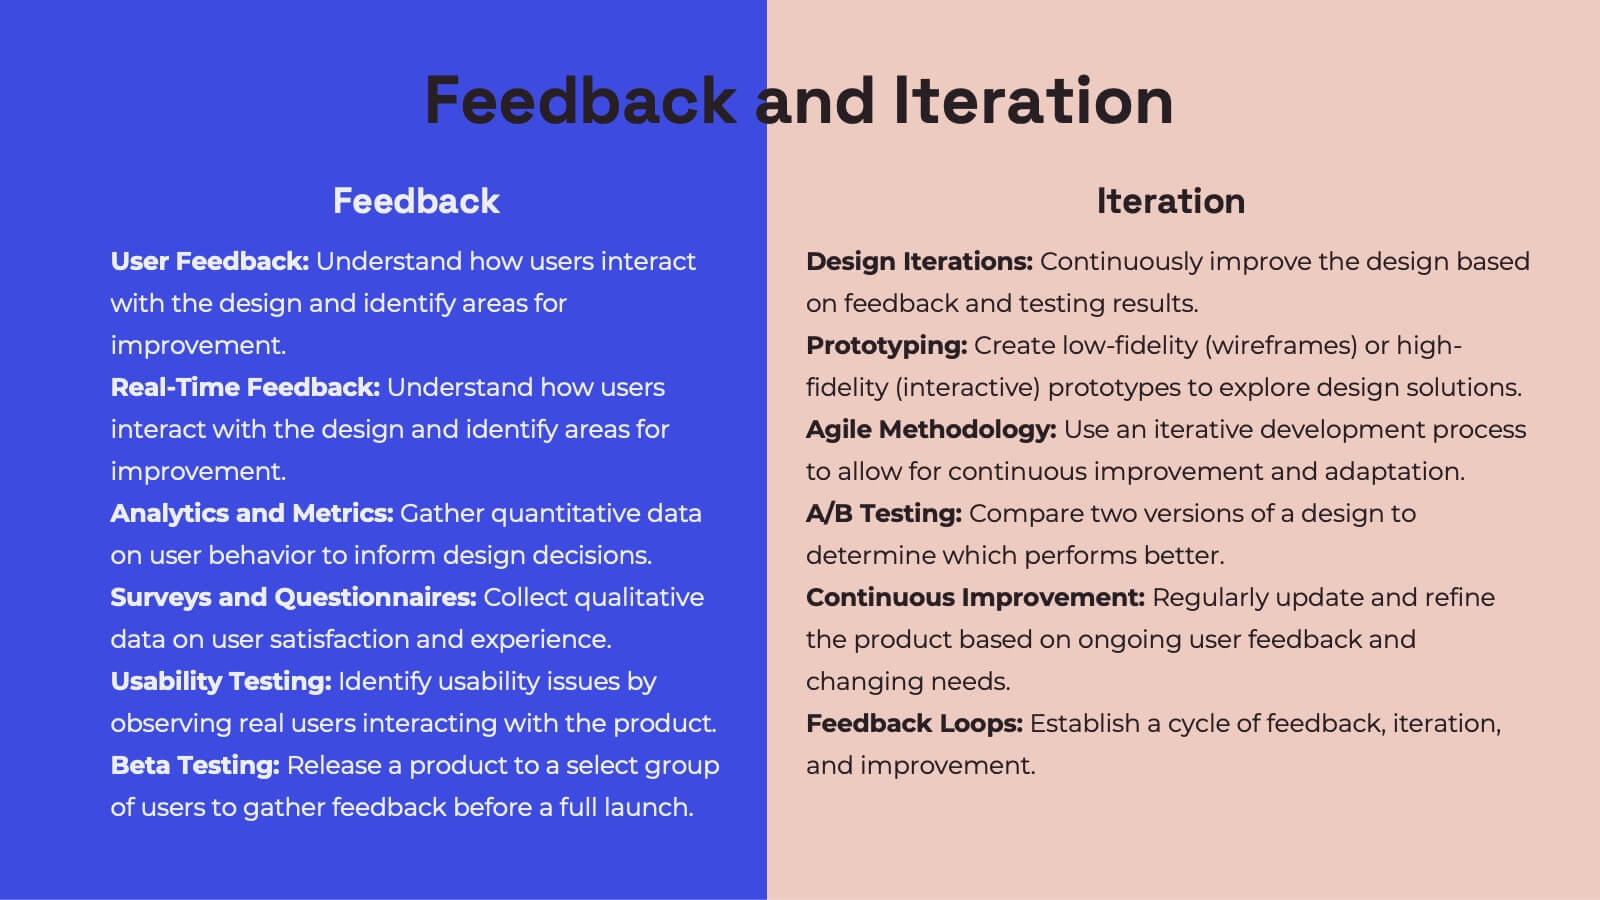
Gemini UX Design Presentation
Enhance your UX presentations with this vibrant and user-friendly template. Designed to cover every aspect of UX design, from user research and personas to wireframes and prototyping, this template ensures a comprehensive and engaging delivery. Its modern design and structured layout make your insights clear and impactful. Compatible with PowerPoint, Keynote, and Google Slides, it's perfect for any platform.


5 diapositivas
IT Service Operations Strategy Presentation
Streamline your IT presentations with the IT Service Operations Strategy Presentation template. This structured layout is designed to showcase key service operation metrics, strategies, and performance indicators in a visually engaging format. Ideal for IT teams, service managers, and business analysts, this slide helps simplify complex IT processes with clear data points and percentages. Fully customizable in PowerPoint, Keynote, and Google Slides for effortless adaptation to your needs.


6 diapositivas
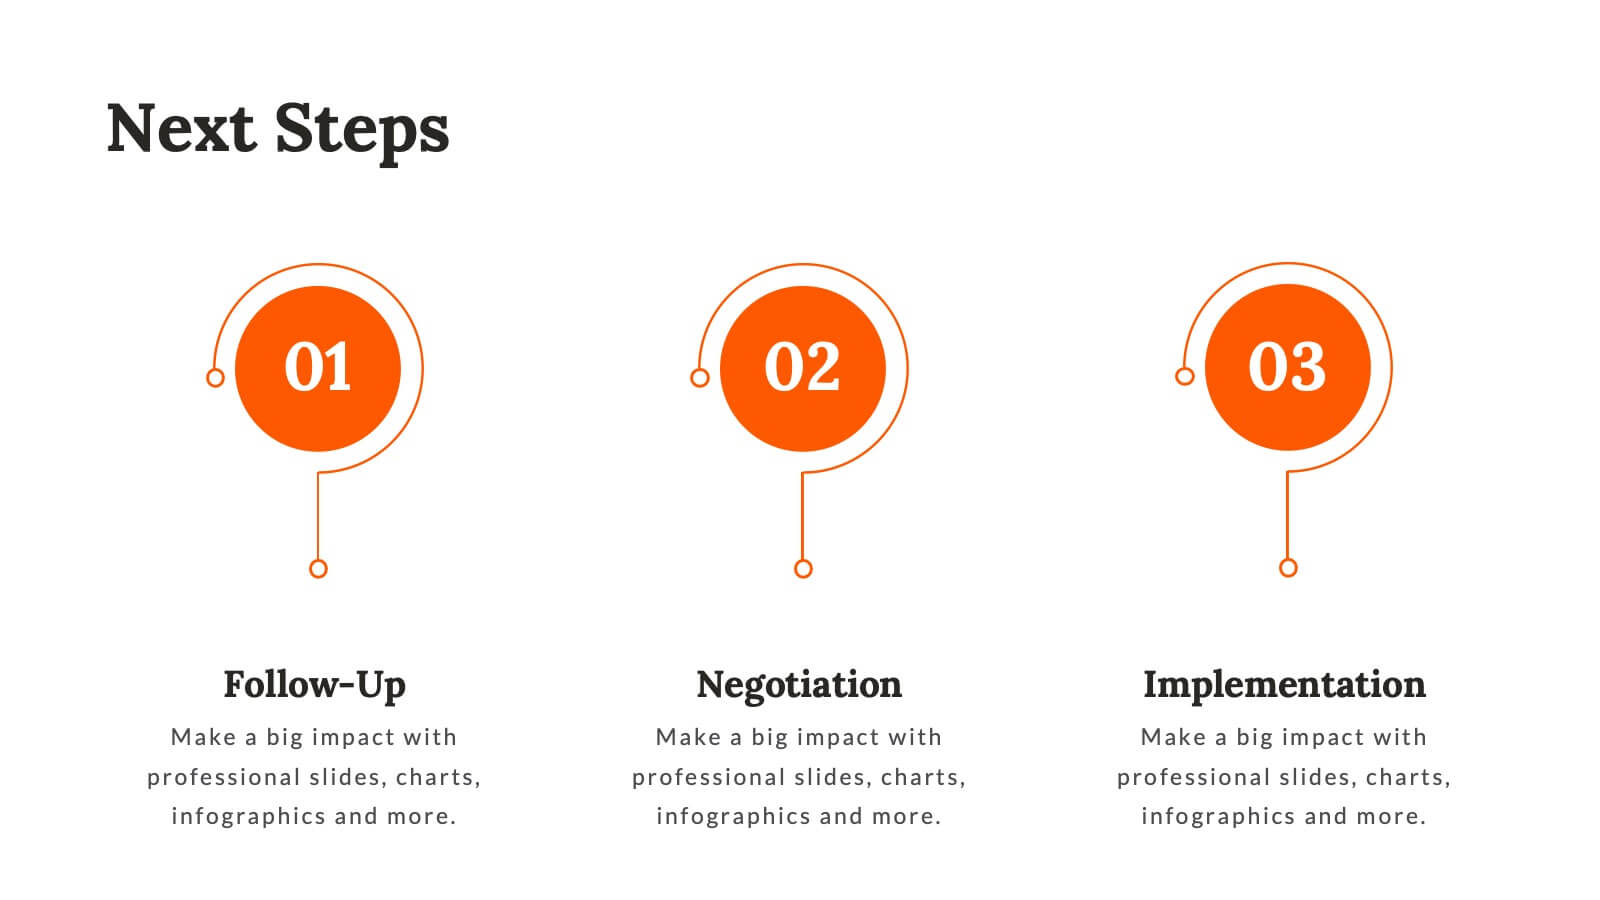
Change Management Plan and Timeline Presentation
Bring your strategy to life with a clean, visual roadmap that connects goals to real timelines. A team performance improvement plan helps identify areas needing support, establish measurable targets, and align team efforts across months. This editable presentation template works seamlessly in PowerPoint, Keynote, and Google Slides for flexible collaboration.


20 diapositivas
Lullabyne Design Portfolio Presentation
Showcase your creative work with this modern and professional design portfolio presentation. Covering essential elements like design briefs, mood boards, prototypes, and implementation plans, this template helps you present your work with clarity and style. Fully customizable and available for PowerPoint, Keynote, and Google Slides.


5 diapositivas
African Continent Map Slide Presentation
Visualize your data across Africa with a modern, easy-to-read map design that highlights regional trends and insights. Perfect for showcasing demographics, market distribution, or project reach, this template combines clarity and impact. Fully compatible with PowerPoint, Keynote, and Google Slides for smooth customization and presentation flexibility.


8 diapositivas
Employee Training and Development Presentation
Optimize your team's growth with the 'Employee Training and Development' presentation template. This layout strategically organizes training modules, showcasing clear pathways for skills enhancement and career progression. Compatible with PowerPoint, Keynote, and Google Slides, it's ideal for delivering engaging and instructional corporate training sessions.


21 diapositivas
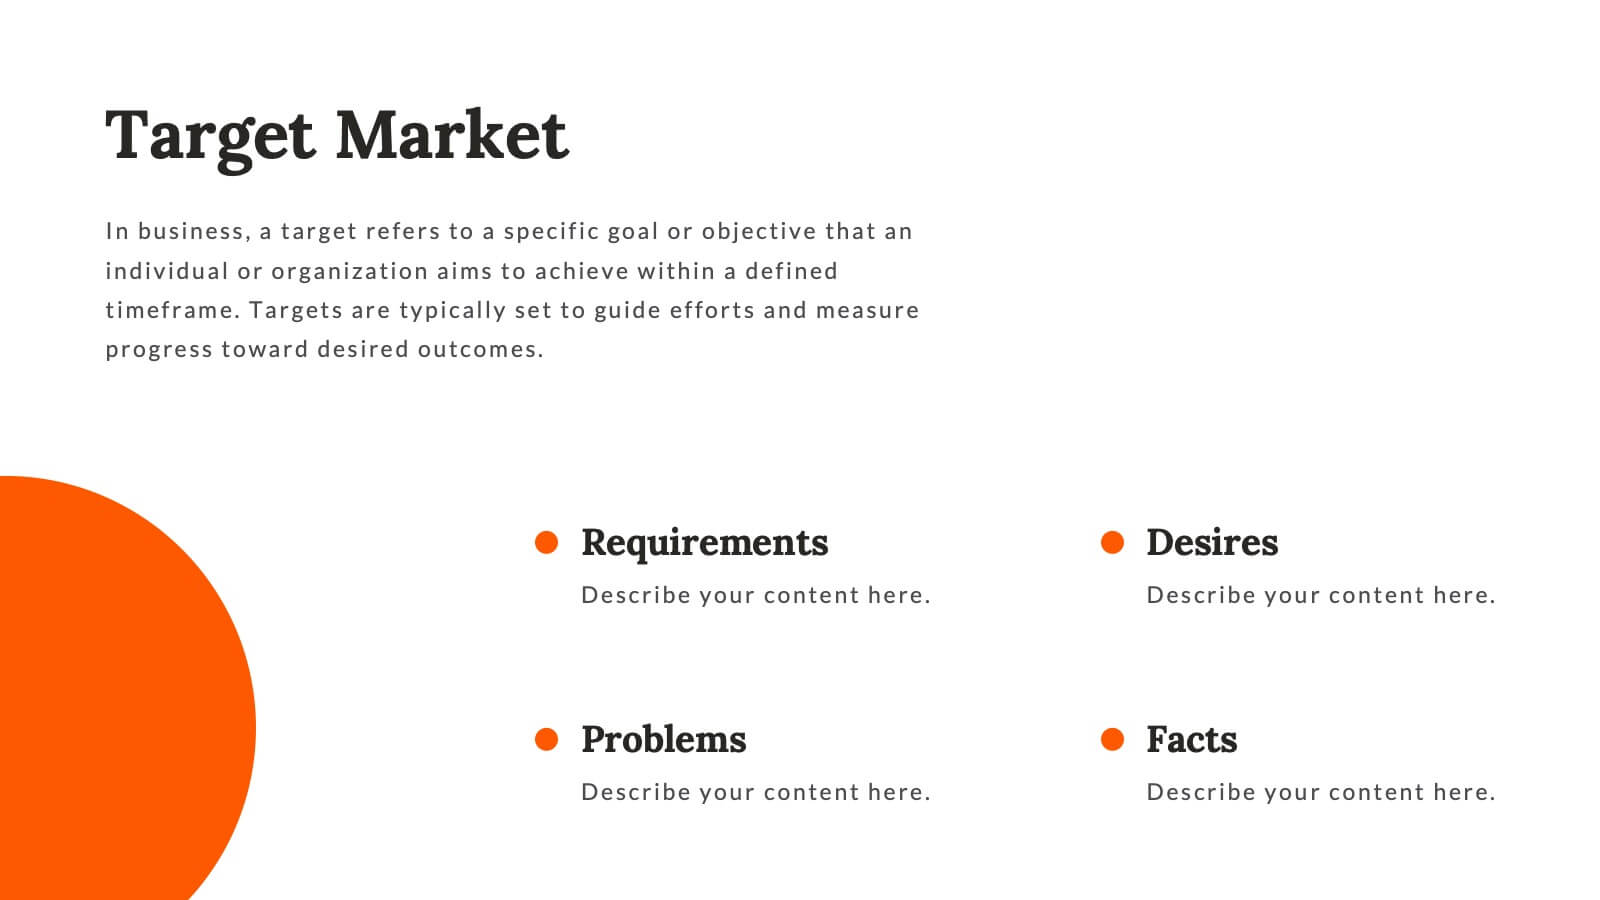
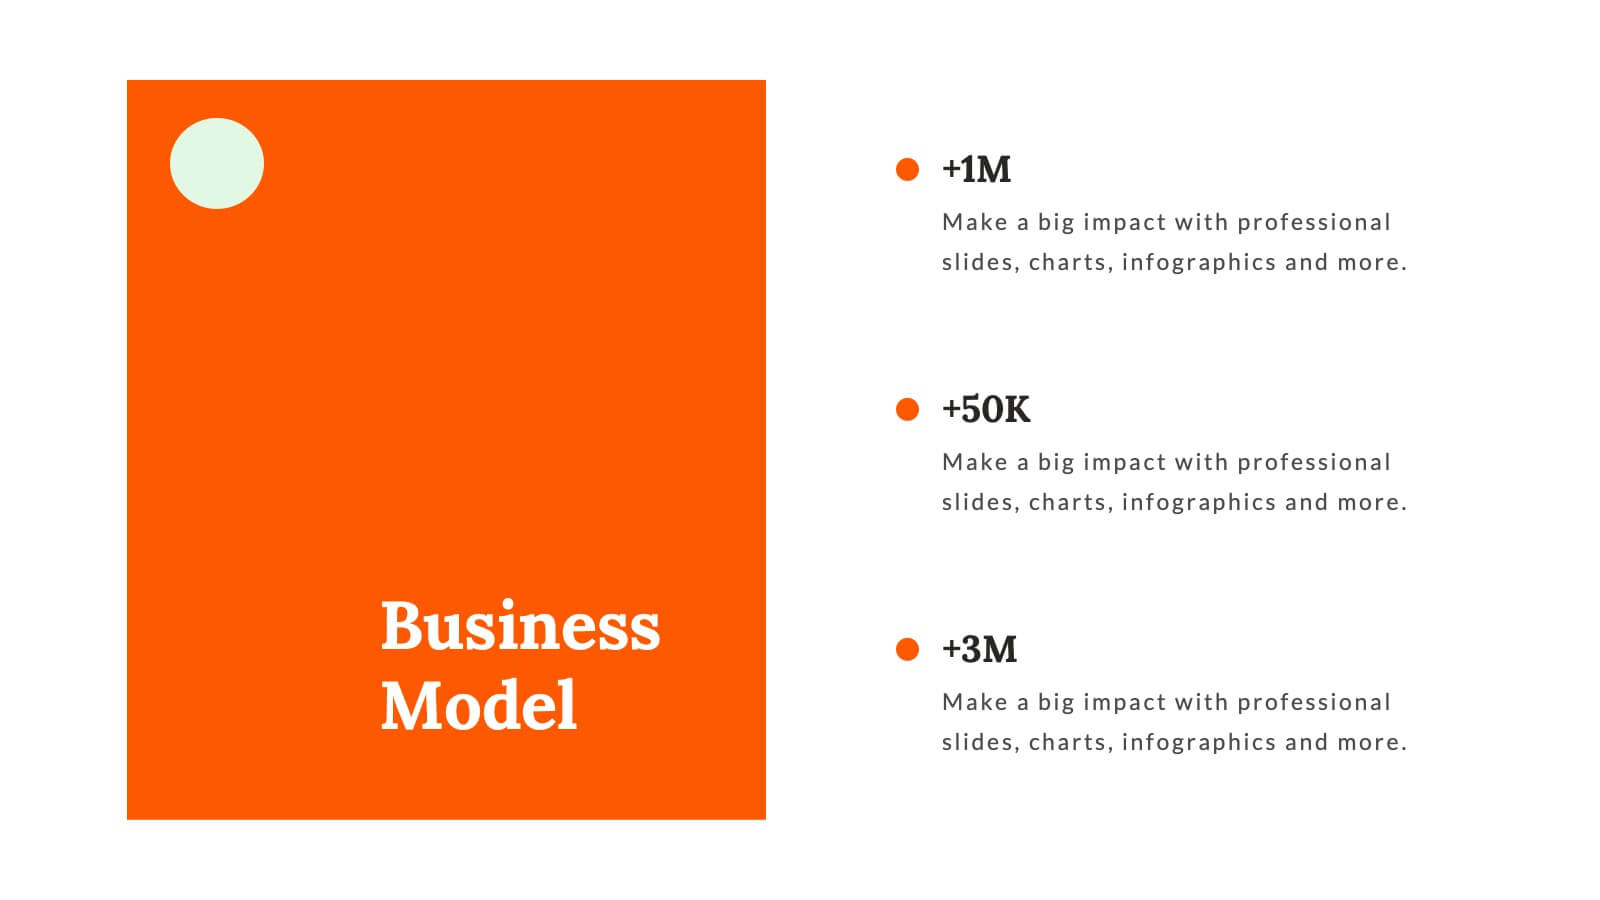
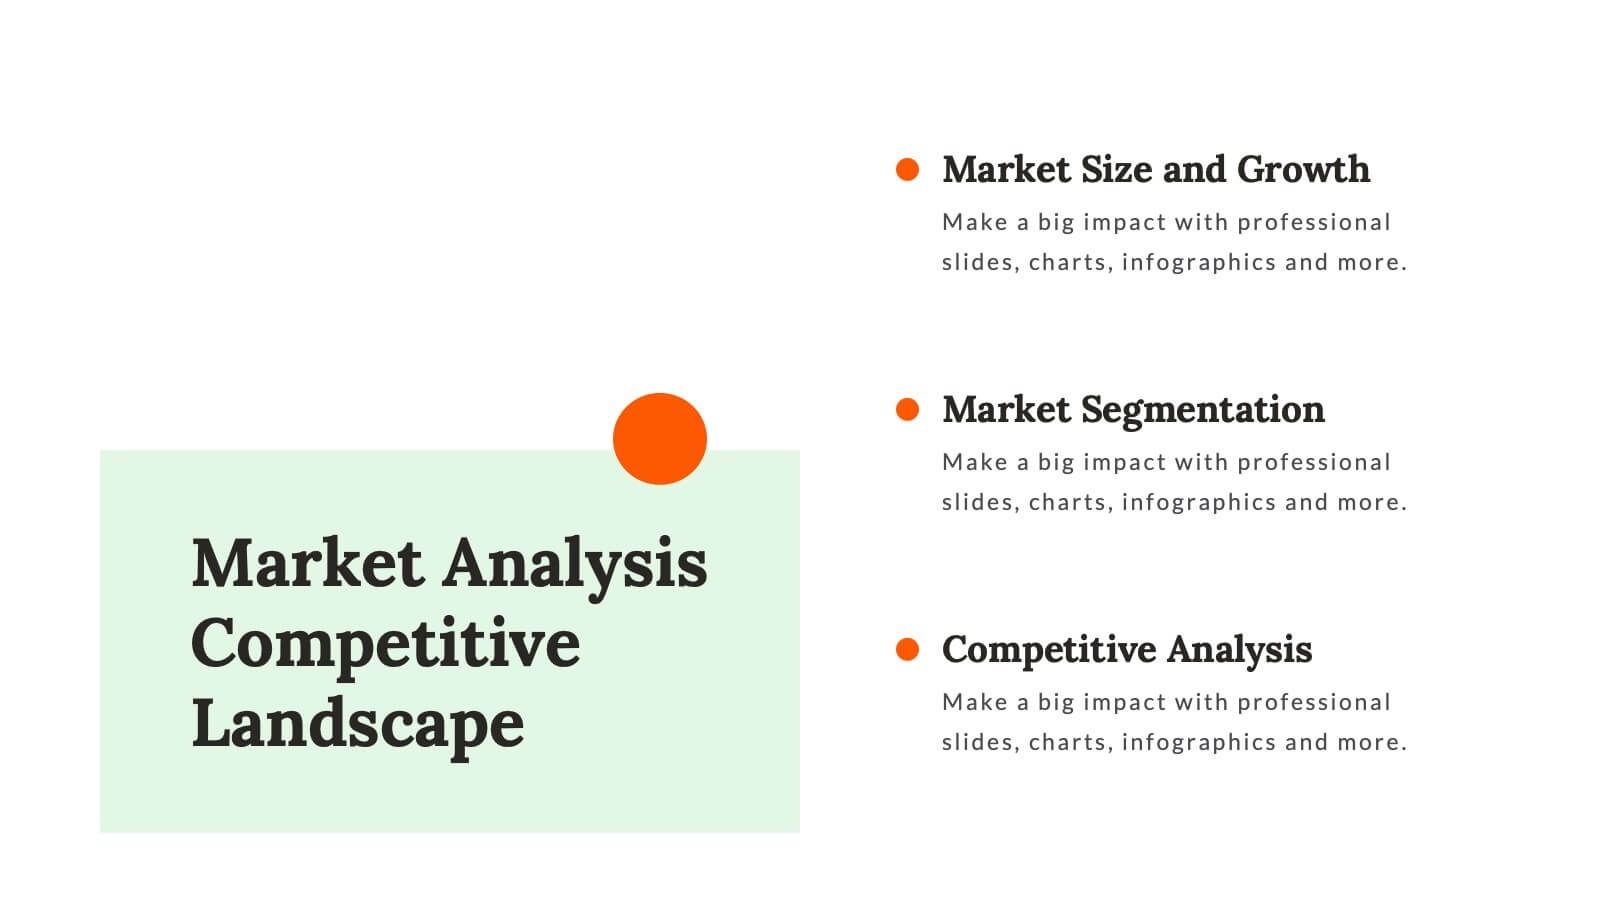
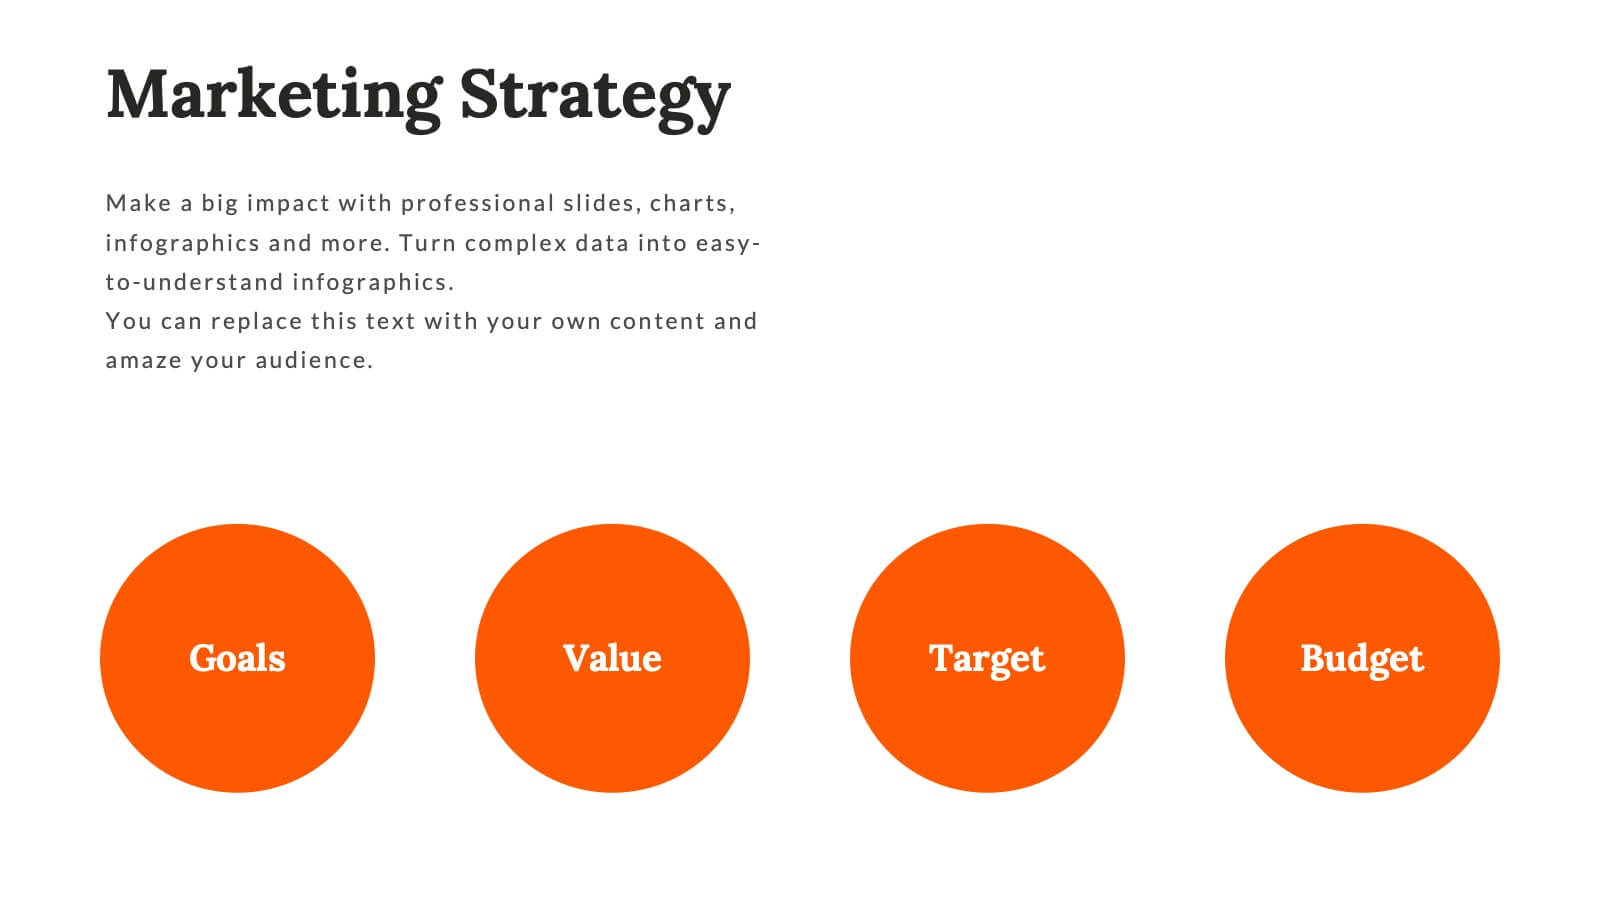
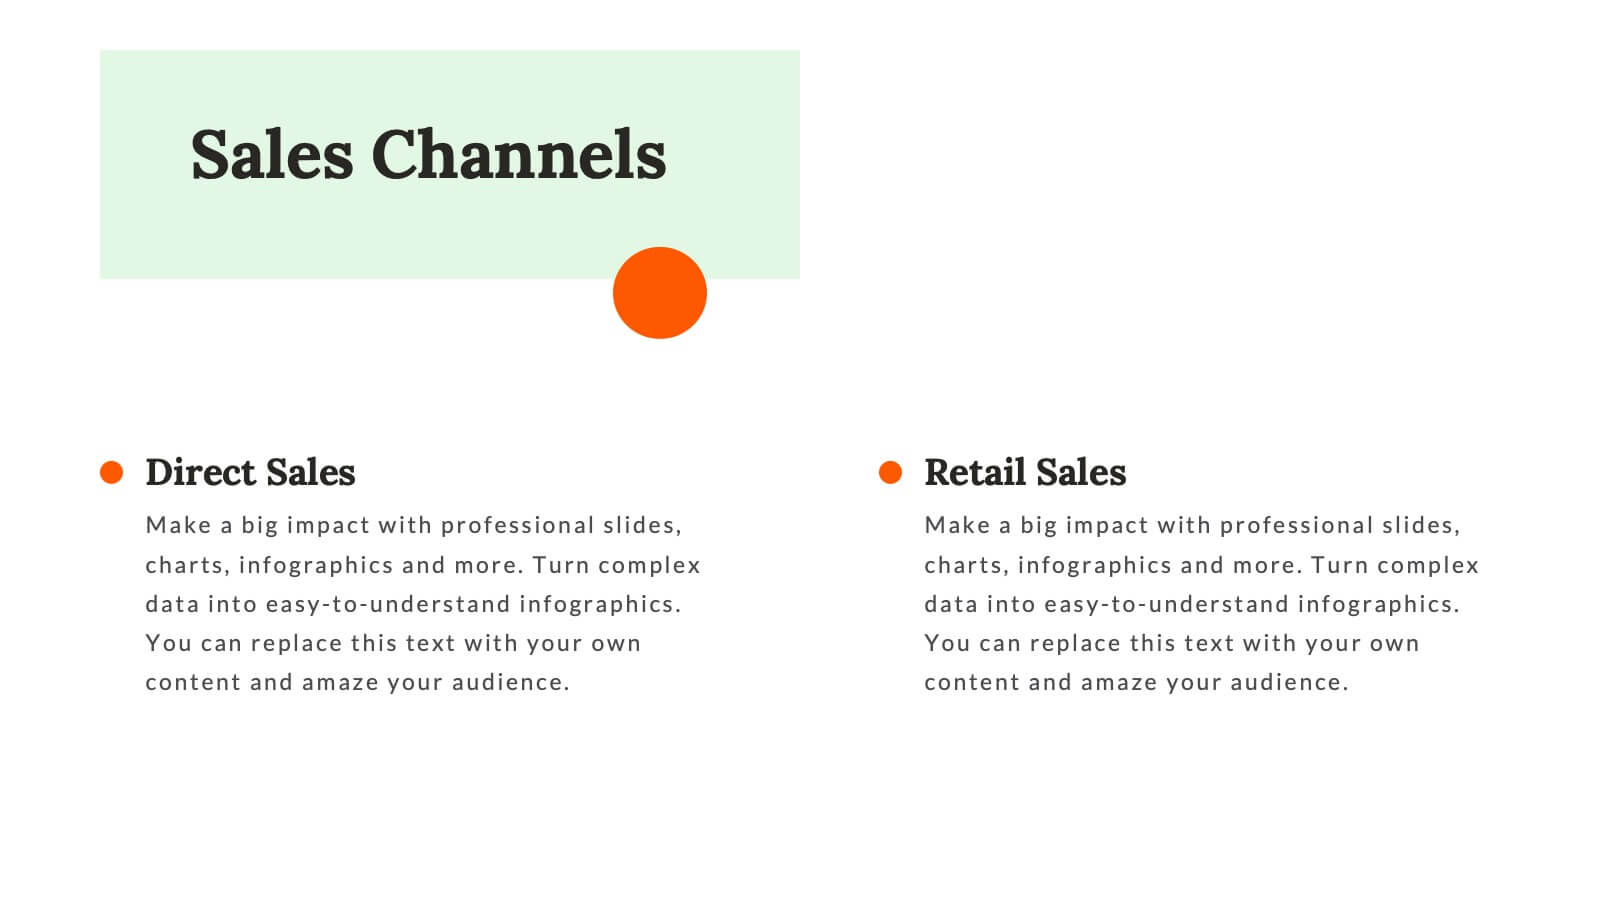
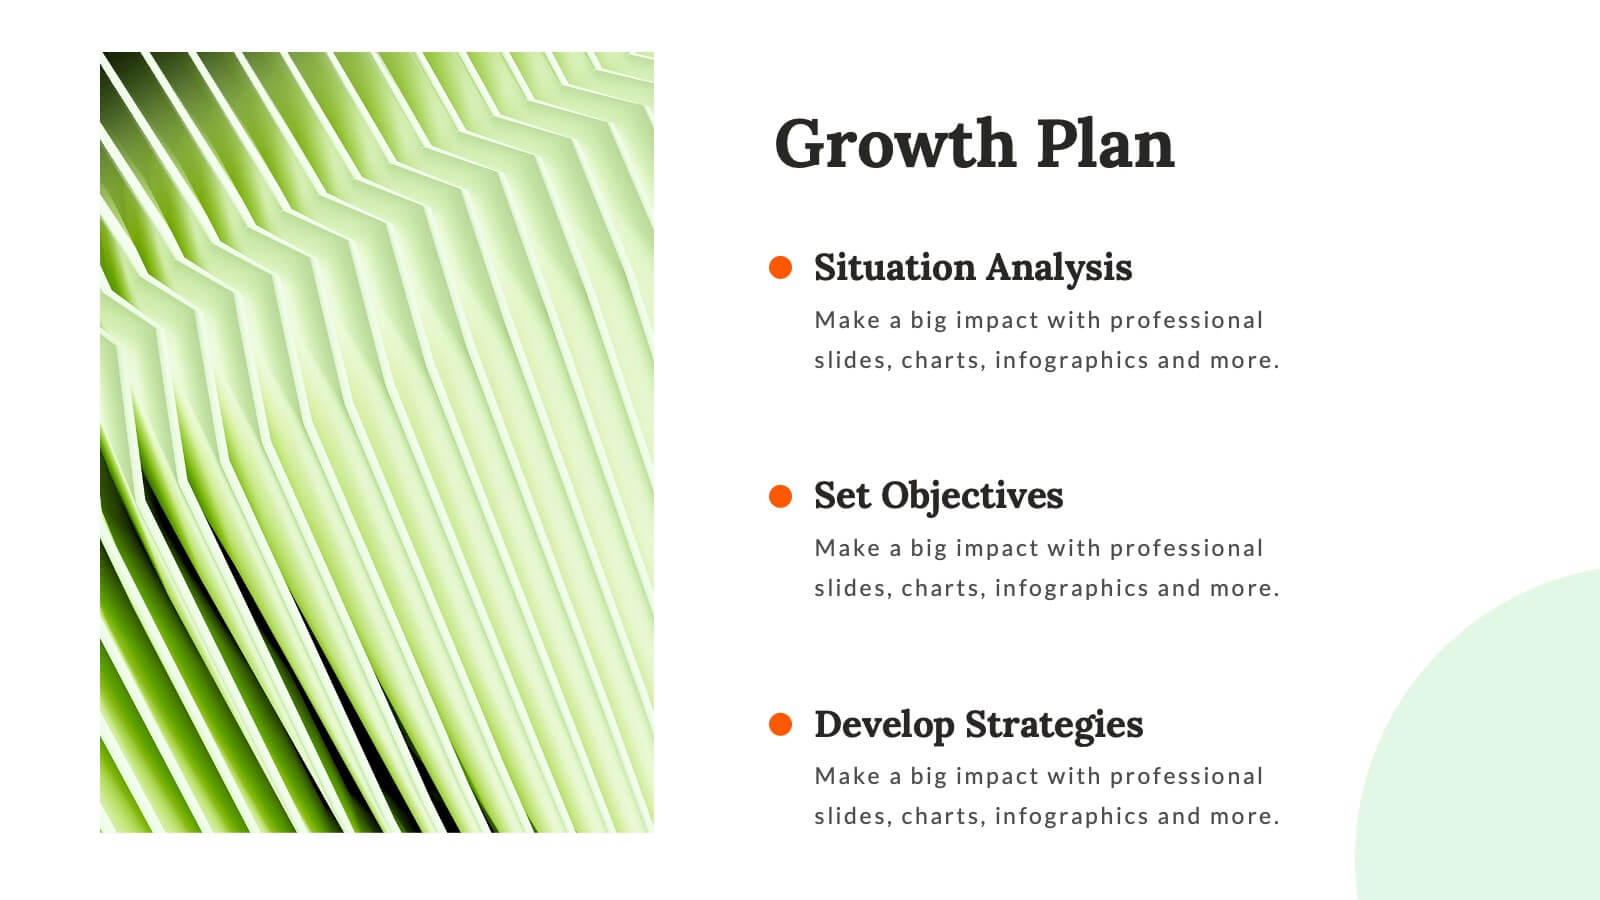
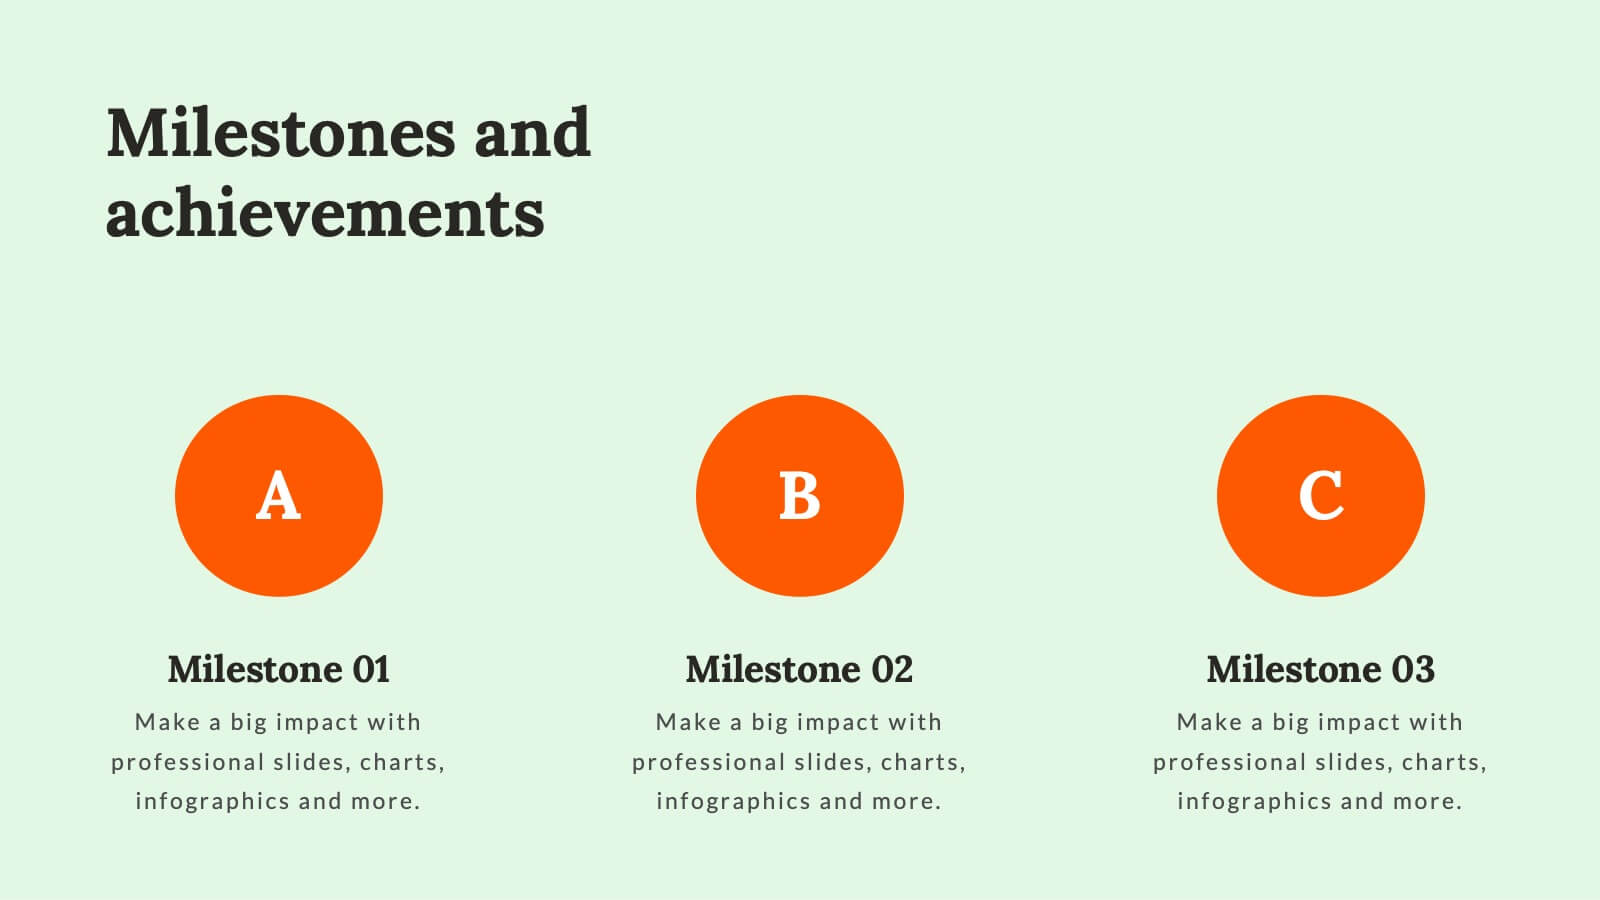
Polaris Startup Strategy Presentation
Set your startup on a path to success with this bold and dynamic strategy presentation template. Featuring key sections like mission and vision, market analysis, business model, and growth plans, it’s perfect for entrepreneurs and teams. Fully compatible with PowerPoint, Keynote, and Google Slides for a seamless presentation experience.


5 diapositivas
Market Improvement Trends and Expansion in Oceania Map Presentation
Present your market insights with clarity using this Oceania-focused expansion map. Highlight four key regions with callouts and data pointers, ideal for tracking growth trends, regional strategies, or entry points. Fully editable and compatible with PowerPoint, Keynote, and Google Slides—perfect for strategic planning, investor decks, and regional market analysis.

20 diapositivas
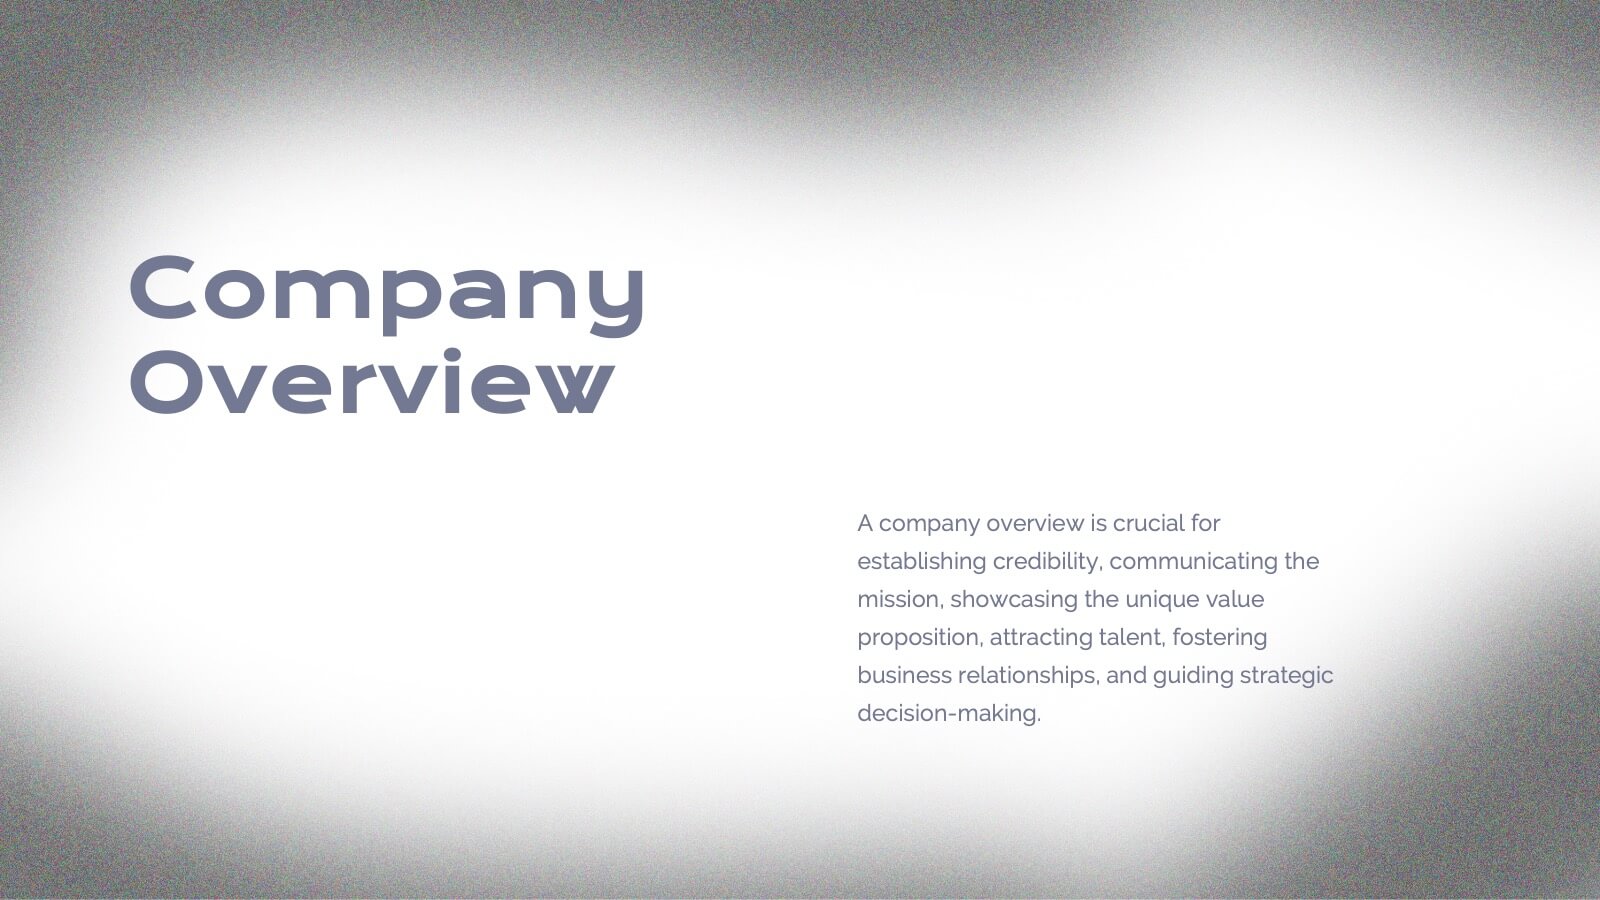
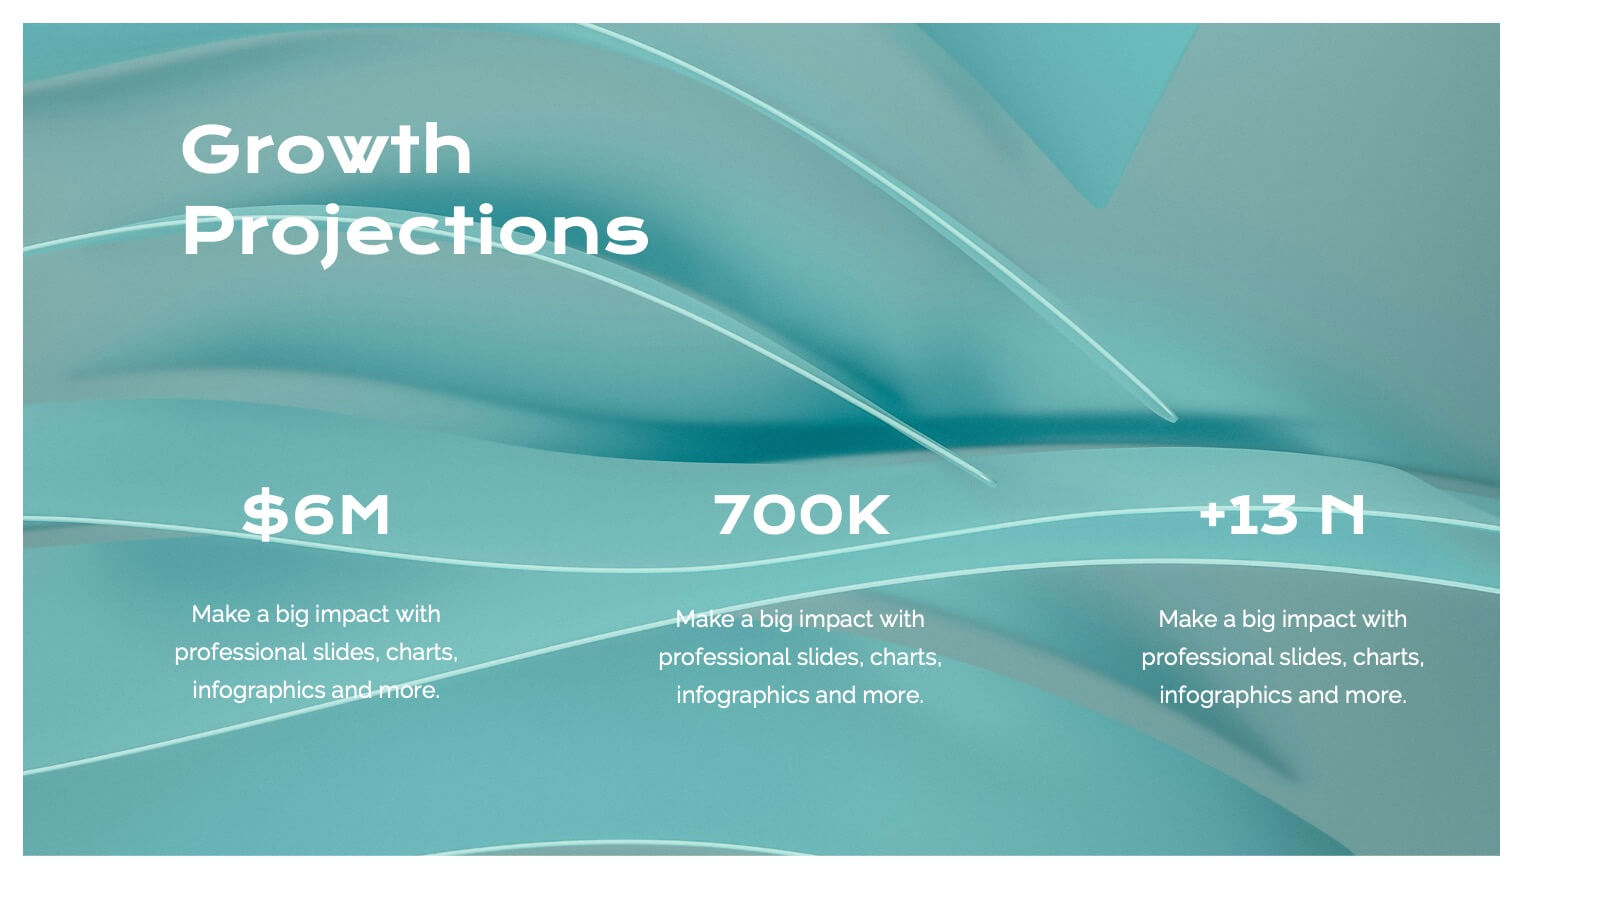
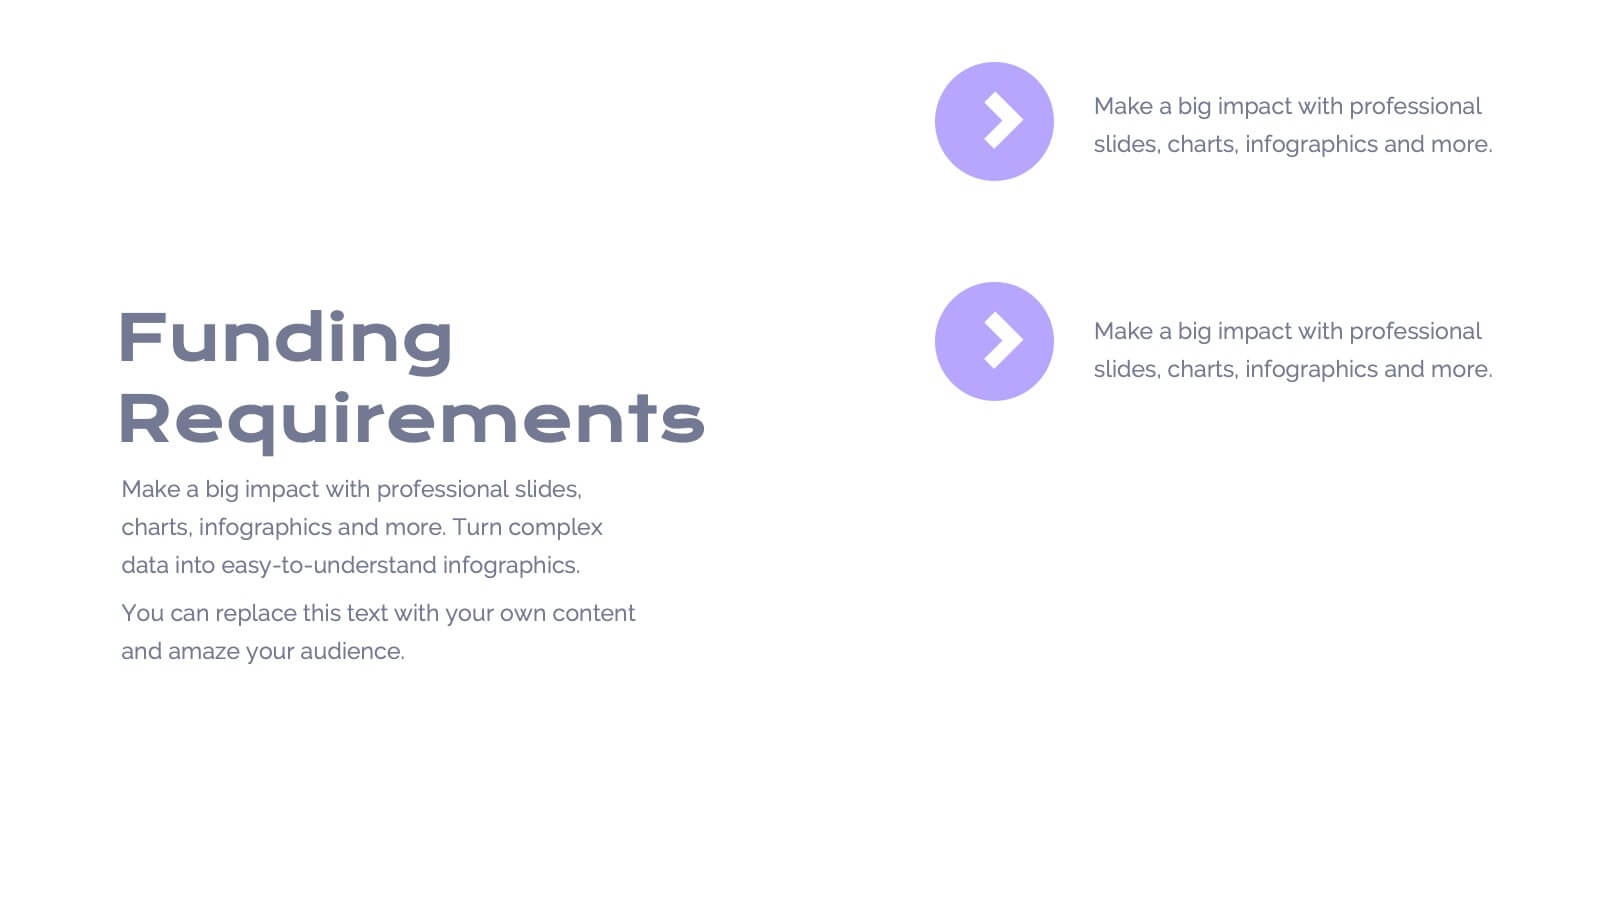
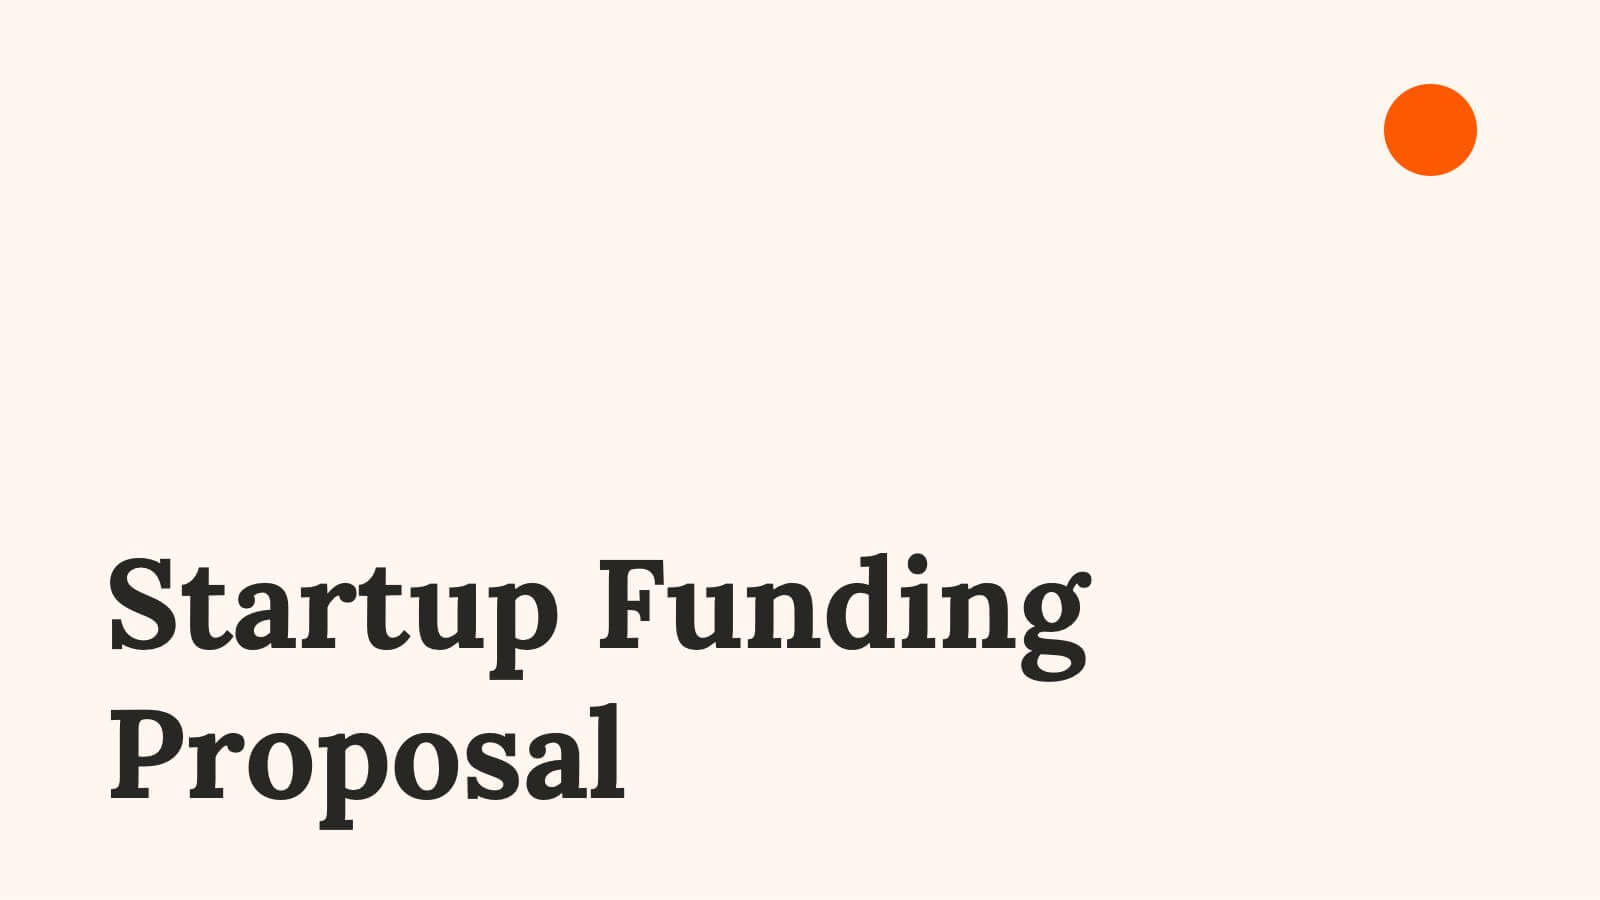
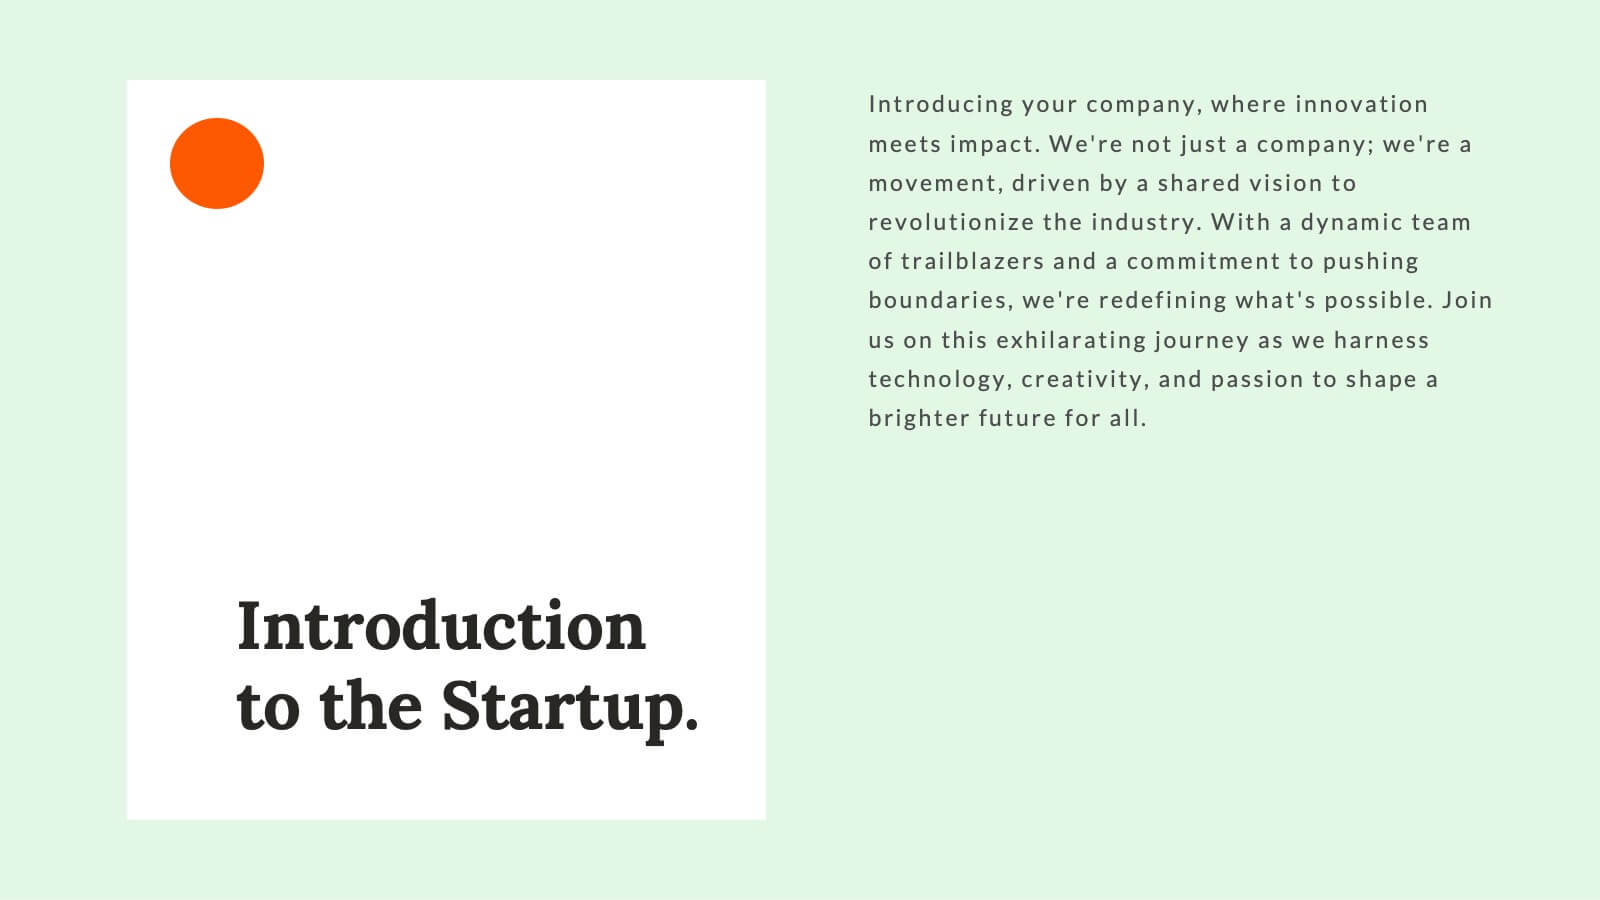
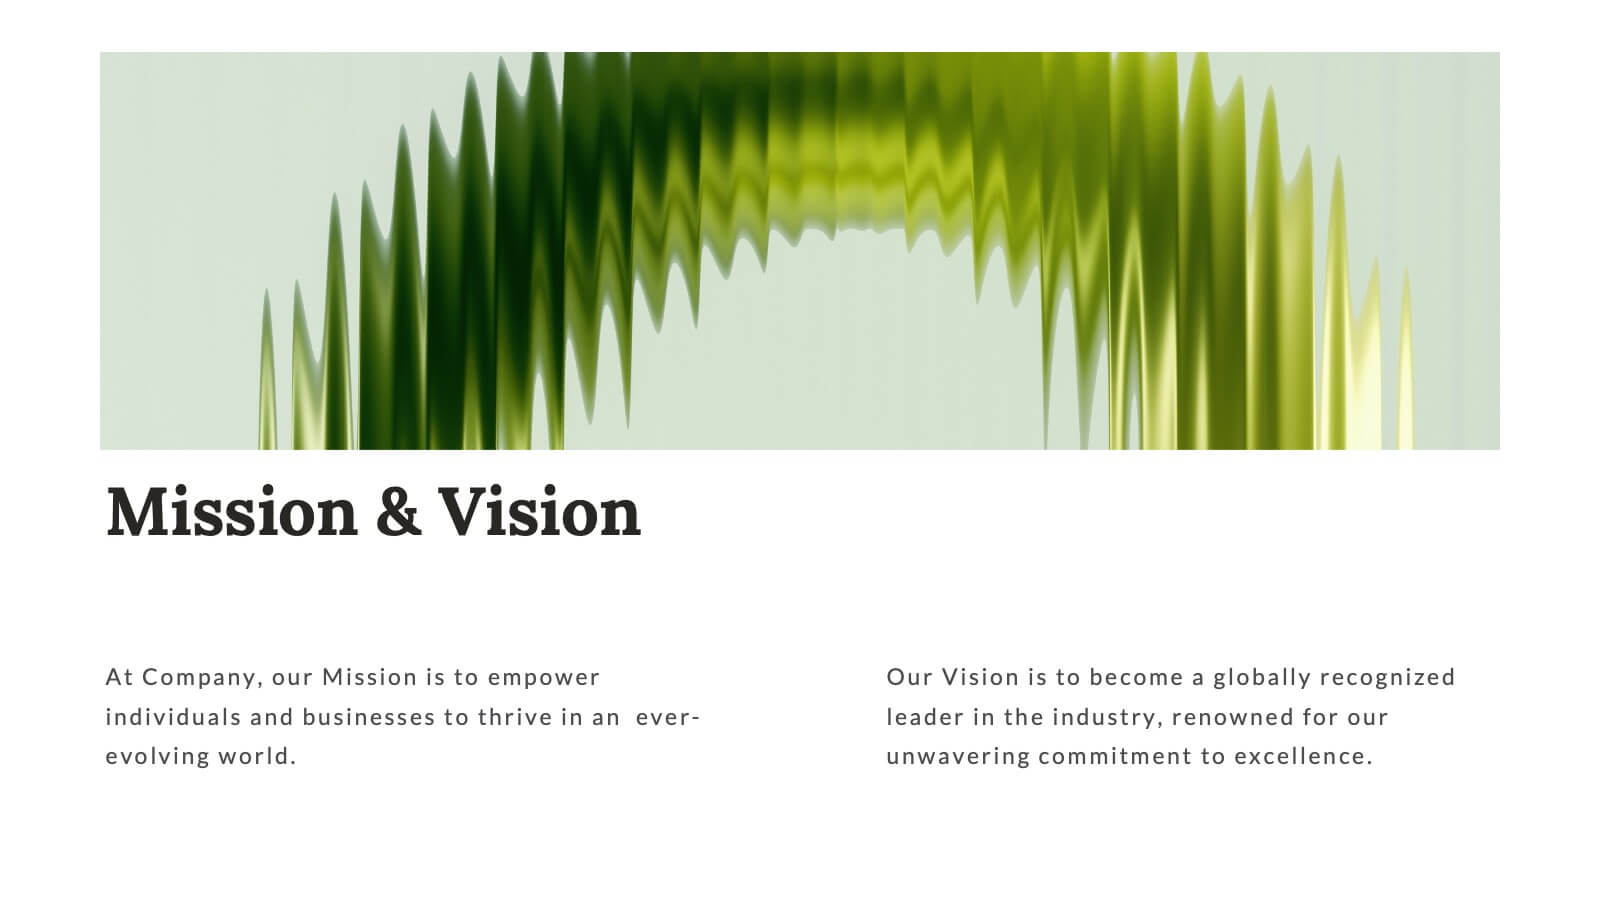
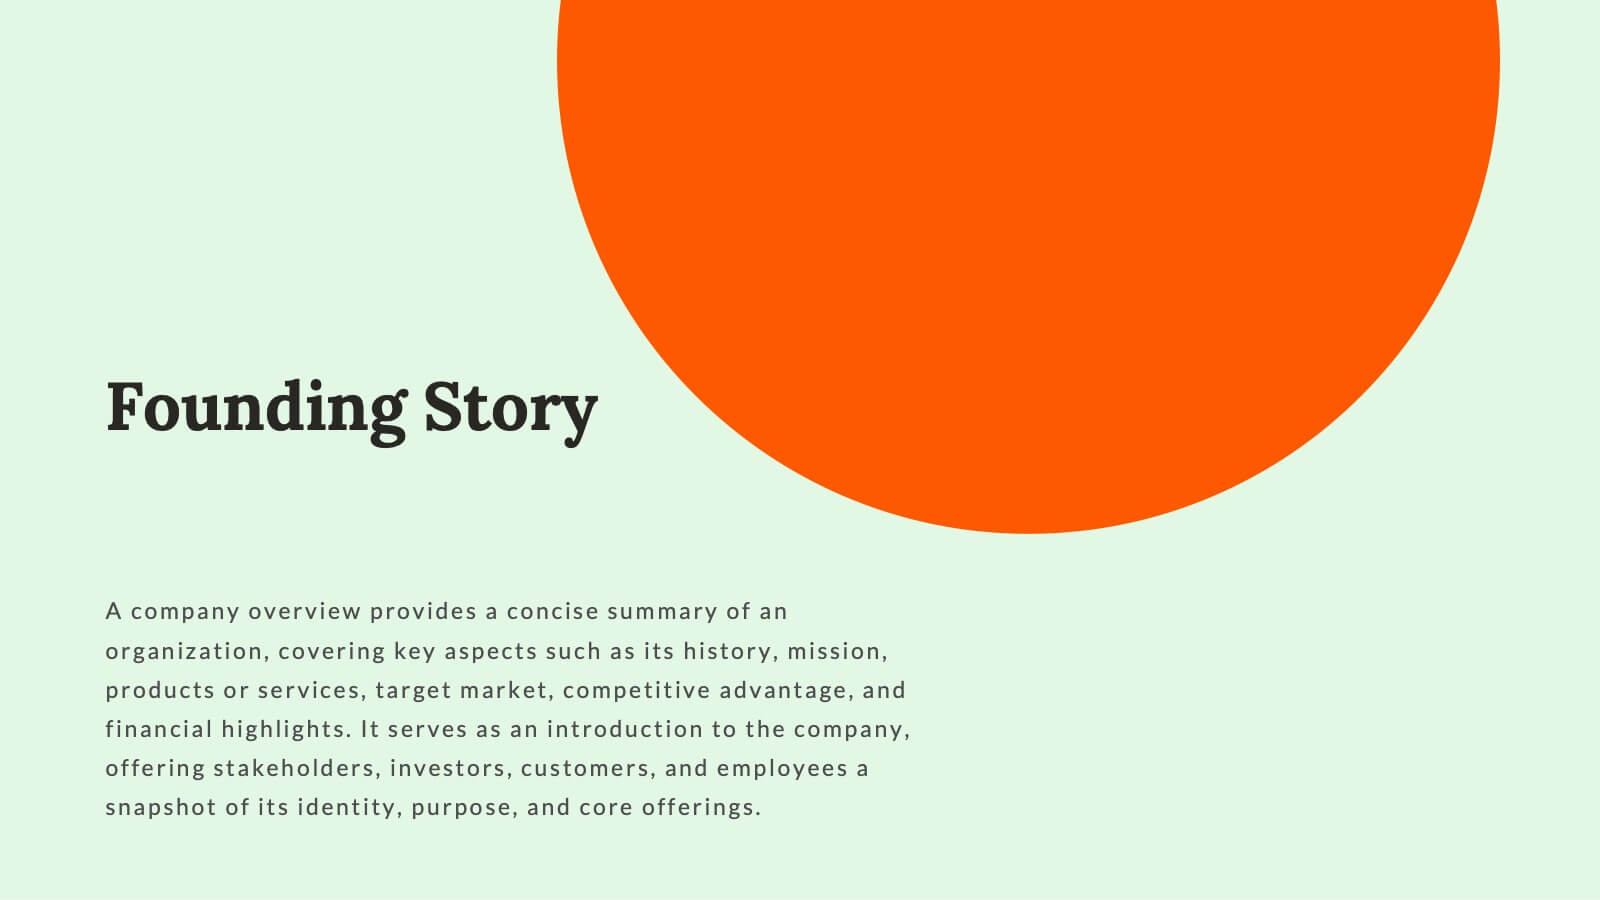
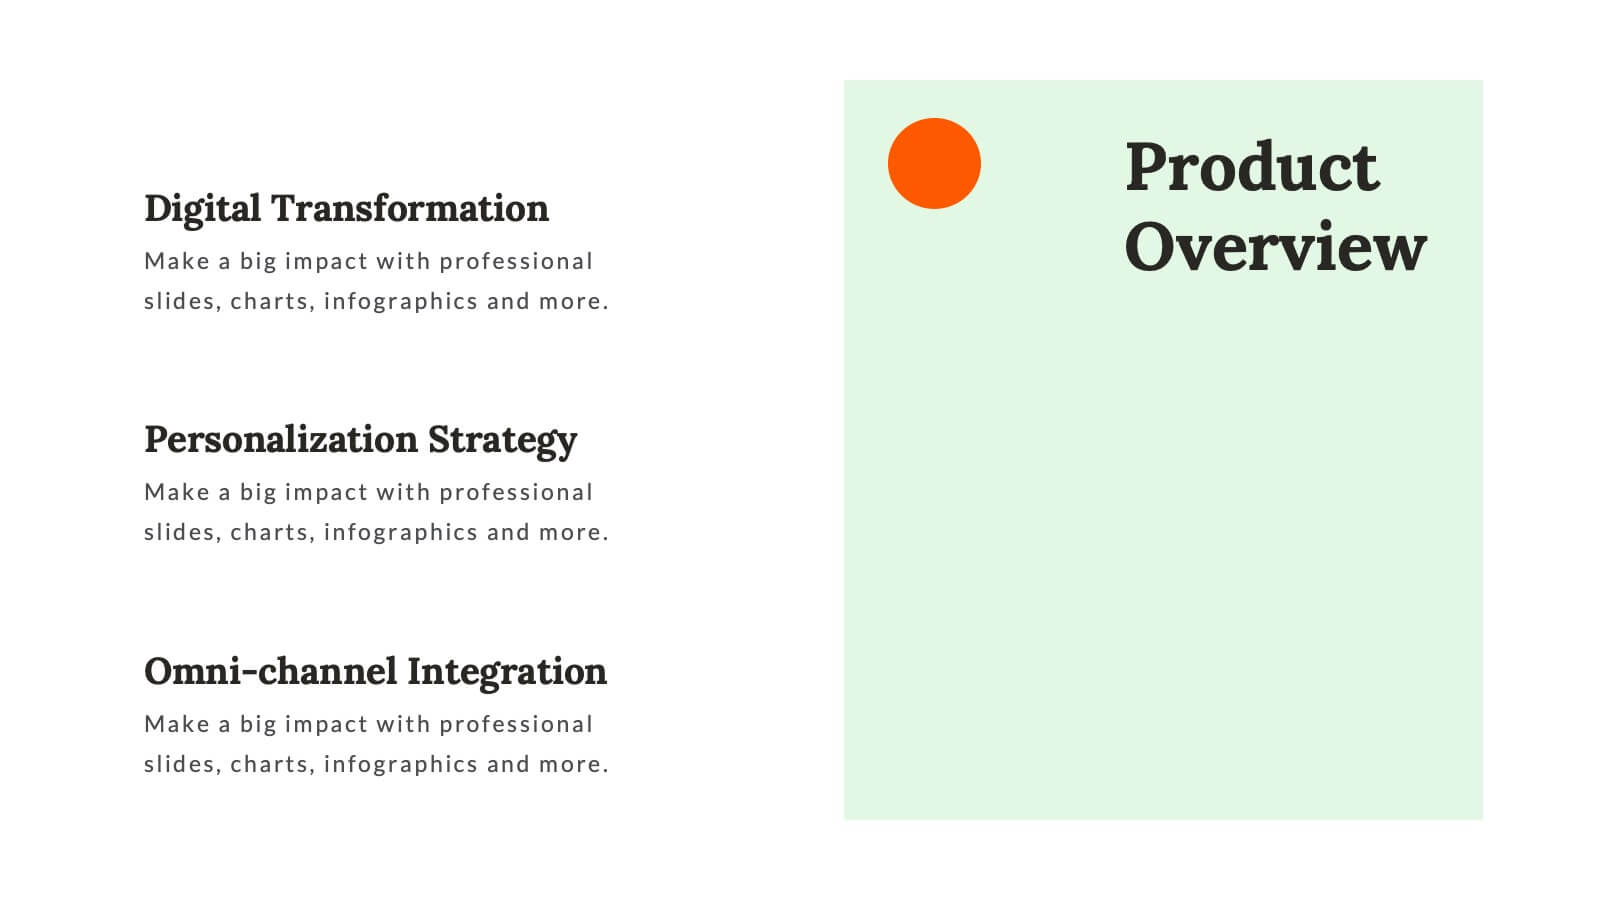
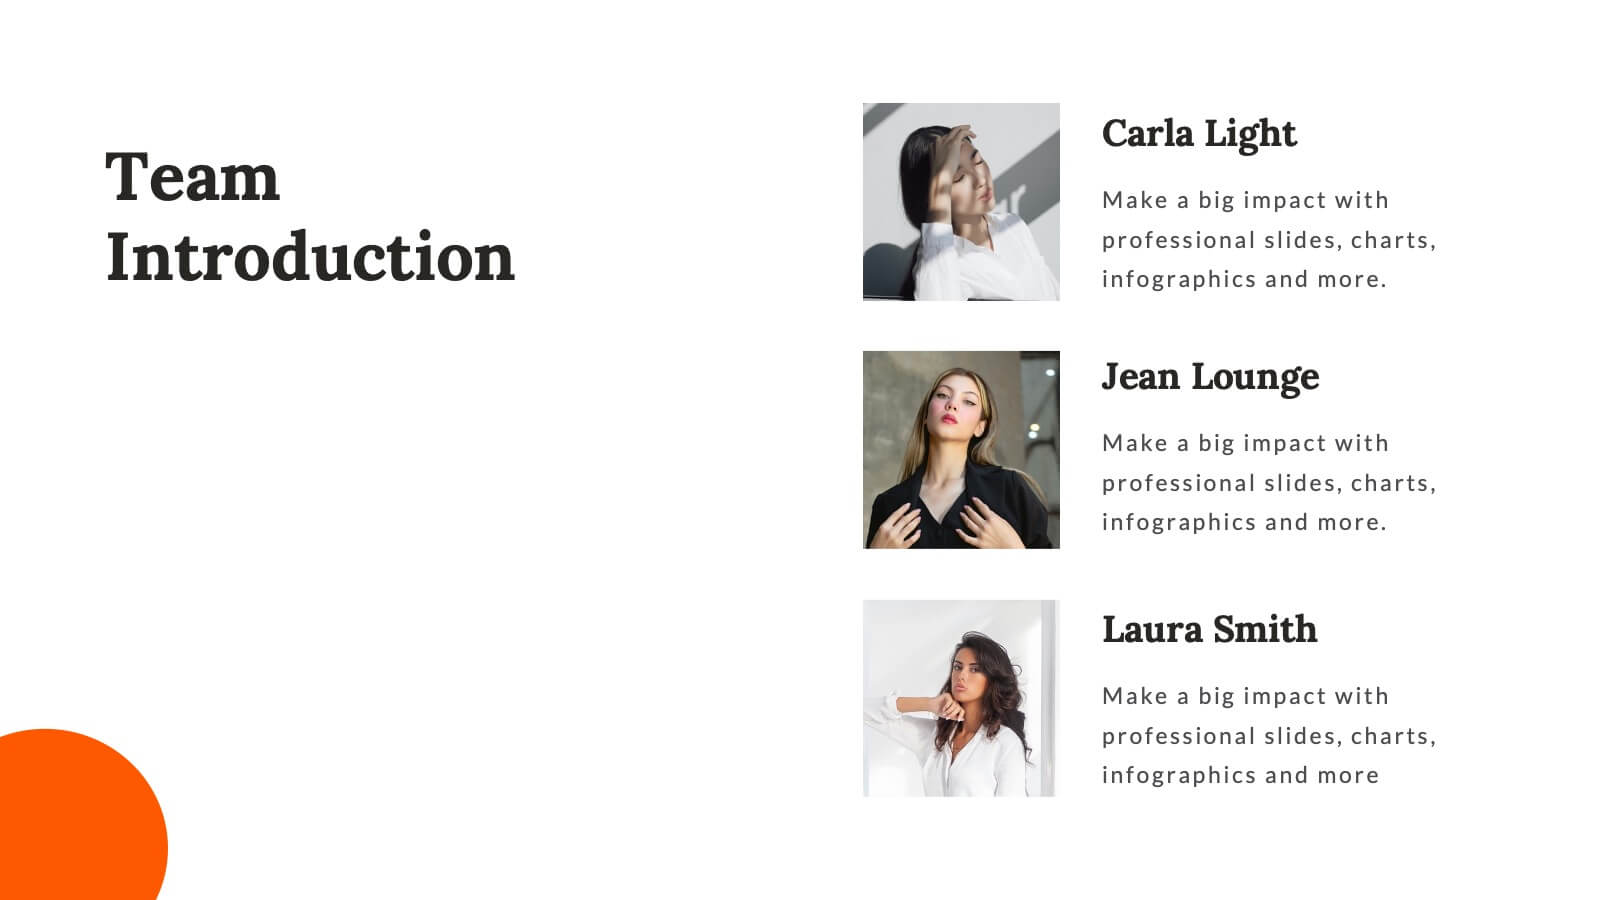
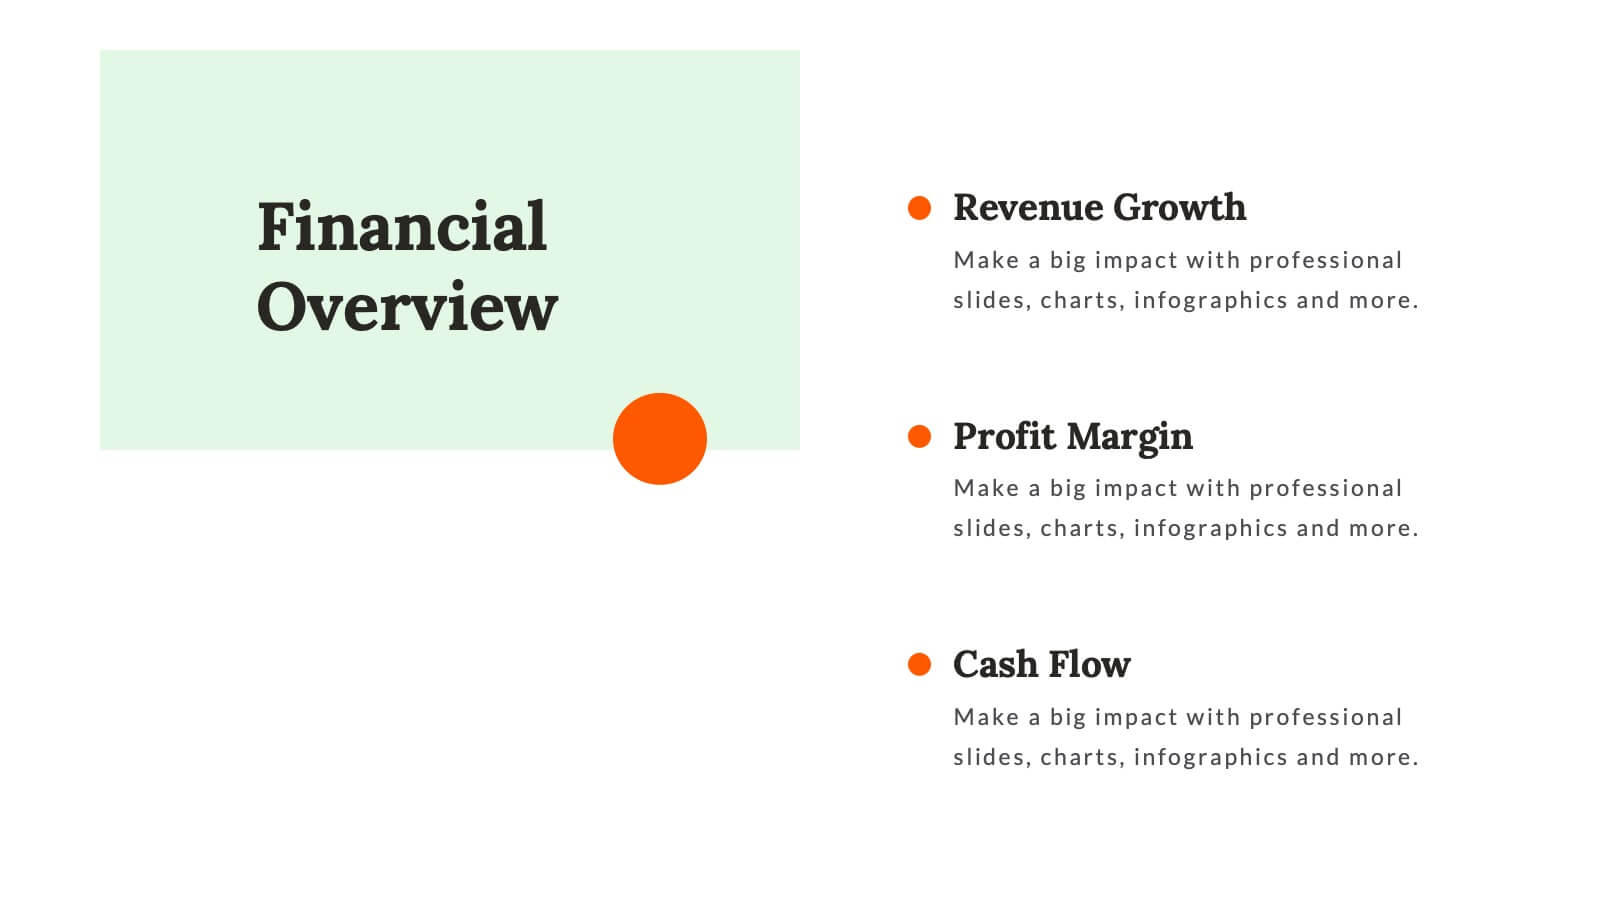
Whirlwind Startup Funding Proposal Presentation
Transform your startup funding proposals with this vibrant and professional template. Designed to impress potential investors, it features sections for mission & vision, founding story, market analysis, and financial overview. Highlight your unique value proposition and business model with clarity and style. This template is compatible with PowerPoint, Keynote, and Google Slides, ensuring seamless presentations on any platform. Perfect for conveying your innovative ideas and growth plans effectively.


6 diapositivas
Effective Communication in Meetings Presentation
Communicate with impact using this circular diagram template designed to visualize six key elements or steps for better meeting communication. With centered speech bubble icons and balanced layout, it's ideal for sharing best practices, communication roles, or team feedback loops. Fully customizable in PowerPoint, Keynote, and Google Slides.


4 diapositivas
Business Operations Office Theme Presentation
Make your workflow feel effortless with this sleek, illustrated office layout designed to simplify complex business operations. Ideal for presenting processes, responsibilities, or resource planning, the clean visuals and structured format help communicate your message clearly. Fully editable and compatible with PowerPoint, Keynote, and Google Slides for seamless customization.


23 diapositivas
Glimmer Sales Pitch Deck Presentation
Get ready to wow investors with this dynamic pitch deck! Perfect for startups and entrepreneurs, it covers company overview, market opportunity, revenue models, and more. Designed to highlight your business potential and secure funding. Compatible with PowerPoint, Keynote, and Google Slides, it’s your ultimate tool for impactful presentations.