


Características


¿Tienes alguna pregunta?
Recomendar


21 diapositivas
Mystara Project Status Report Presentation
Keep stakeholders informed with this clean and professional project status report template. Cover key areas such as performance metrics, financial summaries, team productivity, and future priorities. Perfect for tracking progress and making data-driven decisions. Fully customizable for PowerPoint, Keynote, and Google Slides.


7 diapositivas
Roadmap Guide Infographic
A roadmap guide is a visual representation of the steps you need to take in order to reach your destination. A roadmap infographic is a great way to show your clients what the future will look like. Use this template to create an infographic that's high-energy, enthusiastic, and engaging. This infographic is designed to help guide you by showing where you are now, what direction you're going, and where you need to go next. This template is fully customizable and compatible with Powerpoint, Keynote, and Google Slides. Break down complex plans into easily digestible visual elements.


2 diapositivas
Professional Proposal for Project Approval Presentation
Impress stakeholders and decision-makers with the Professional Proposal for Project Approval Presentation. Designed to guide your audience through key objectives and visual justifications, this clean, image-rich layout is ideal for startups, teams, and consultants. Fully customizable in PowerPoint, Keynote, and Google Slides.


5 diapositivas
Scientific Research Presentation
Break down complex processes with clarity using this Scientific Research Presentation Template. Featuring a modern lab flask visual segmented into four stages, it’s perfect for illustrating experimental phases, research progress, or scientific data. Ideal for educators, researchers, and science-based companies. Fully compatible with PowerPoint, Keynote, and Google Slides for effortless editing.


5 diapositivas
Cryptocurrency Scams Infographics
Navigate the intricate world of digital currency with our cryptocurrency scams infographics template. This essential tool, designed with an informative and vertical style, serves as a beacon for investors, financial advisors, and digital currency enthusiasts, providing safeguarding strategies against the rising tide of cryptocurrency scams. Set against a bold palette of purple, yellow, and green, the template employs crisp graphics, decipherable icons, and strategic image placeholders to break down complex scam methodologies and preventive measures. Compatible with Powerpoint, Keynote, and Google Slides. Promote informed decision-making in the volatile cryptocurrency market.


6 diapositivas
Financial Report and Charts Presentation
Deliver financial insights with impact using this Financial Report and Charts Presentation Template. Featuring a clean layout with a money bag visual and percentage breakdowns, it’s perfect for showcasing profit distribution, investment categories, or budget summaries. Fully customizable in PowerPoint, Keynote, and Google Slides.


21 diapositivas
Utopia Marketing Proposal Template Presentation
Unleash your marketing potential with this vibrant, modern presentation template. Perfect for presenting marketing proposals, industry overviews, and consumer behavior analysis, it features a colorful design that captures attention. Highlight key strategies like social media, influencer marketing, and SEO trends to engage your audience. Compatible with PowerPoint, Keynote, and Google Slides, it ensures seamless presentations on any platform.


6 diapositivas
Market Differentiation with Blue Ocean Strategy Presentation
Set your brand apart with our Market Differentiation with Blue Ocean Strategy template. This visually compelling tool helps you chart a course through uncharted business waters, emphasizing innovation in cost management, value creation, and buyer engagement. Compatible with PowerPoint, Keynote, and Google Slides, it’s perfect for presenting strategic insights that escape the competitive red ocean into the clear, blue waters of uncontested market space.


22 diapositivas
Shield Digital Agency Strategy Plan Presentation
Embark on a journey to elevate your digital agency with this comprehensive and sleek presentation template! Perfect for showcasing your agency’s strengths, strategies, and successes, this template covers everything from market analysis to client testimonials. It’s designed to make your agency’s strategy plan stand out. Compatible with PowerPoint, Keynote, and Google Slides for seamless use.


5 diapositivas
Cognitive Psychology Framework Presentation
Unlock insights in the most visual way possible with this bold, brain-powered slide! This presentation template helps simplify complex ideas behind how we think, reason, and remember—perfect for research, education, or team workshops. Fully customizable and compatible with PowerPoint, Keynote, and Google Slides for seamless editing across platforms.


5 diapositivas
Conference Agenda Slide Presentation
Keep your sessions structured and engaging with the Conference Agenda Slide Presentation. Designed with a visual screen-style format, it showcases a 4-part schedule using color-coded blocks for clarity. Perfect for corporate events, speaker lineups, or workshops. Fully editable in PowerPoint, Keynote, and Google Slides.


6 diapositivas
Economic Pyramid Infographic
Showcase economic structures with our Economic Pyramid Infographic, compatible with Powerpoint, Google Slides, and Keynote. This template is designed for economists, educators, and business professionals, providing a visual hierarchy of economic indicators or demographics. Each level of the pyramid represents a different segment, such as income brackets, consumer classes, or resource distribution. It's an ideal tool for presentations that require a clear depiction of economic stratification or market segmentation. Customizable and easy to understand, this infographic helps simplify complex economic data into digestible visual tiers for any audience.

22 diapositivas
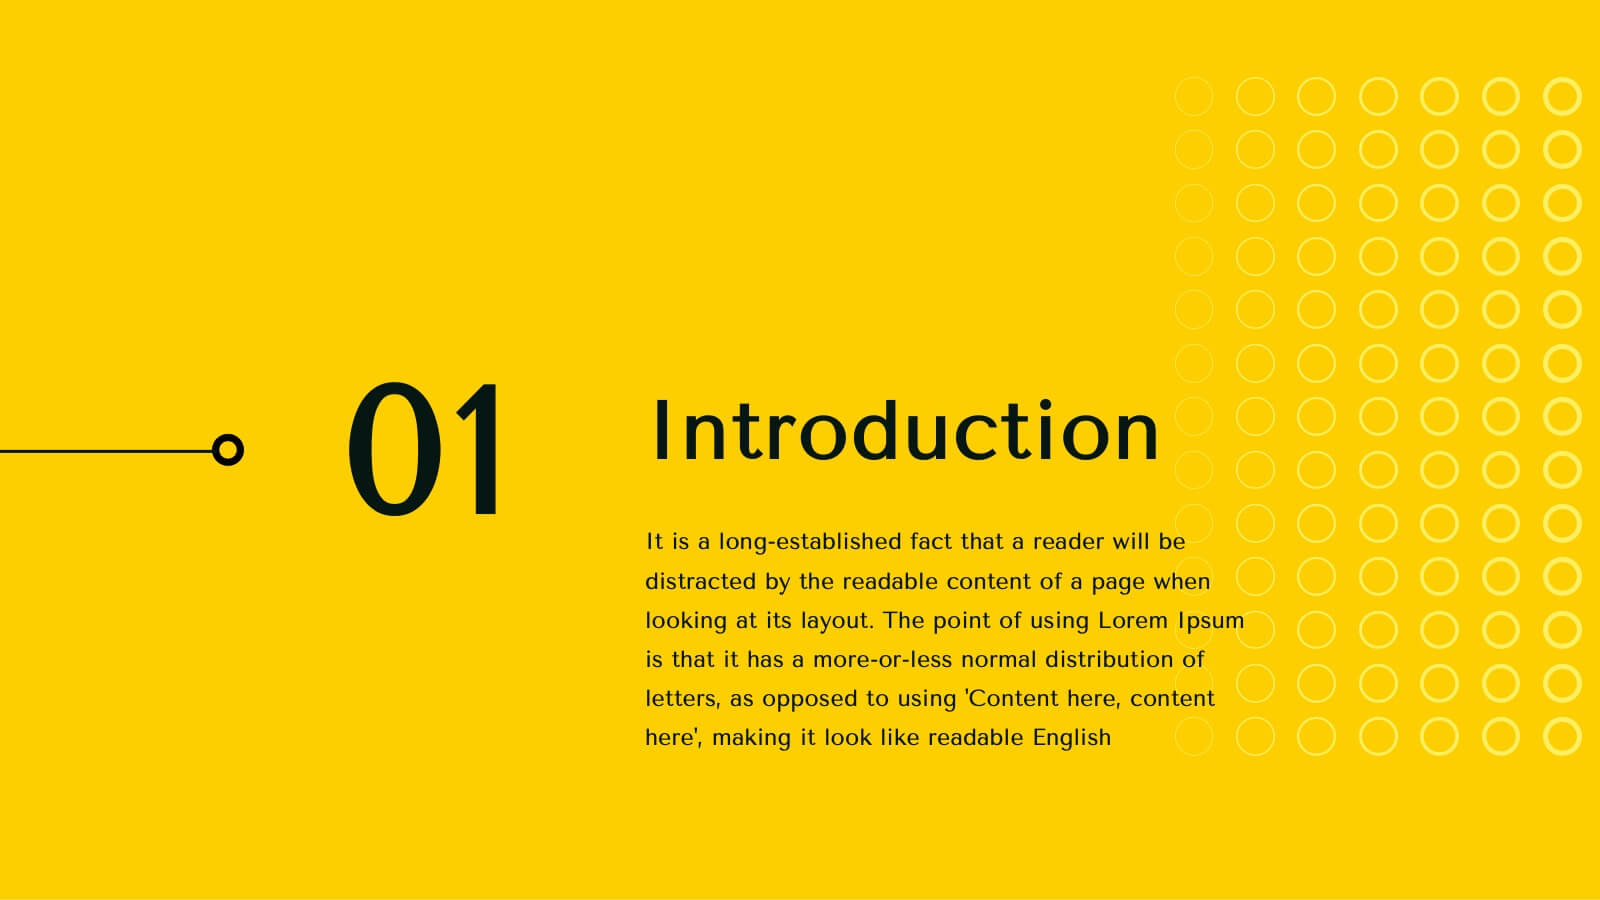
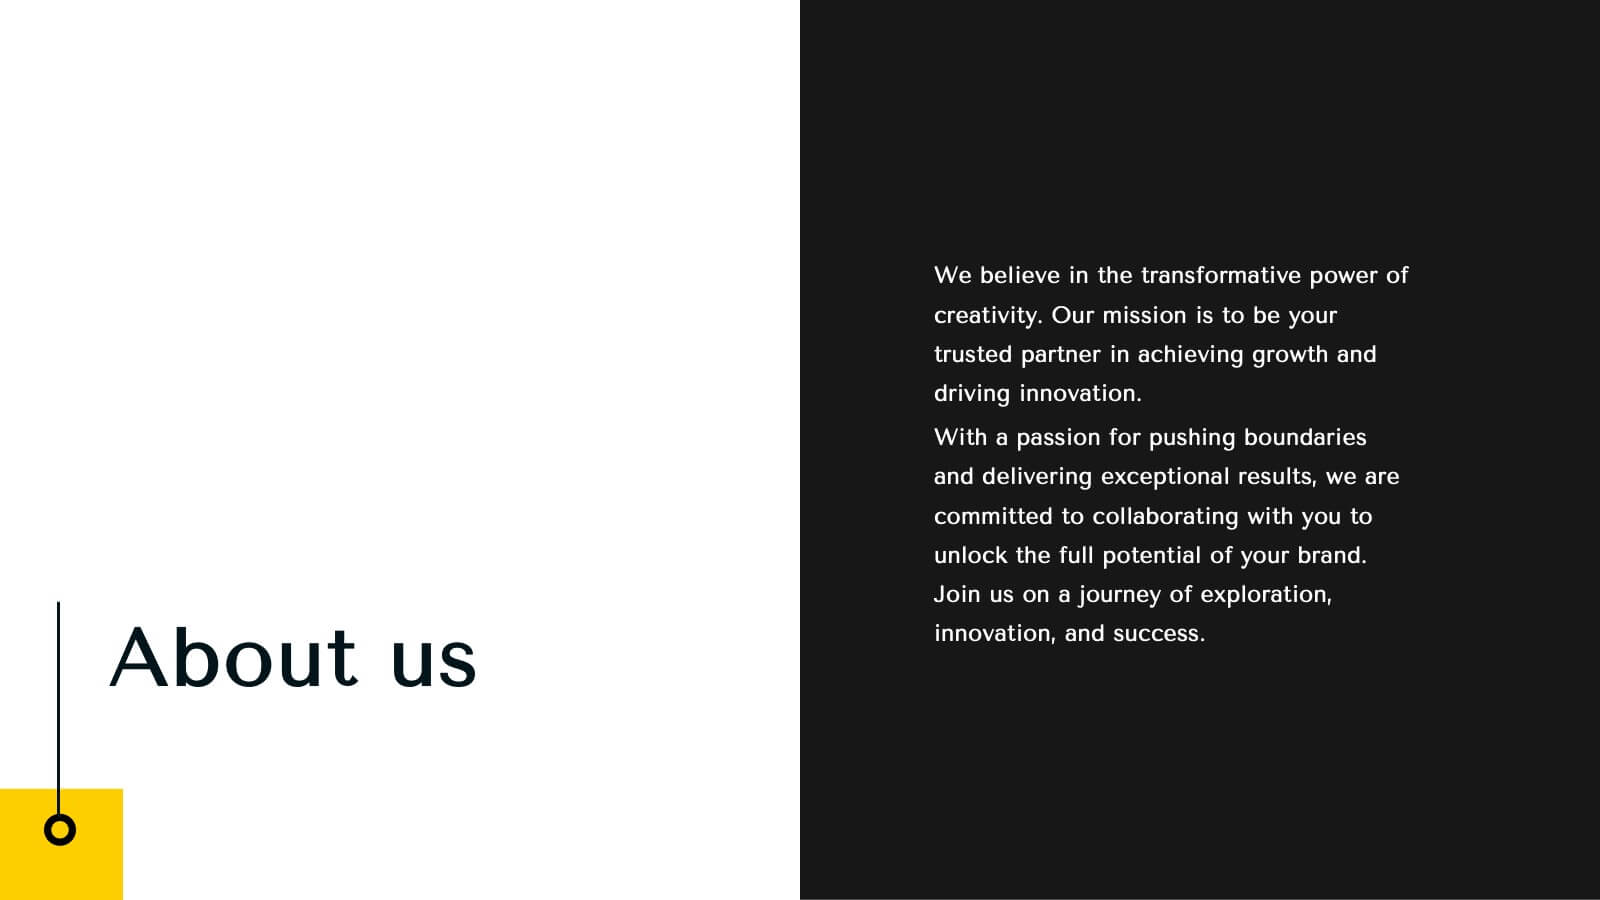
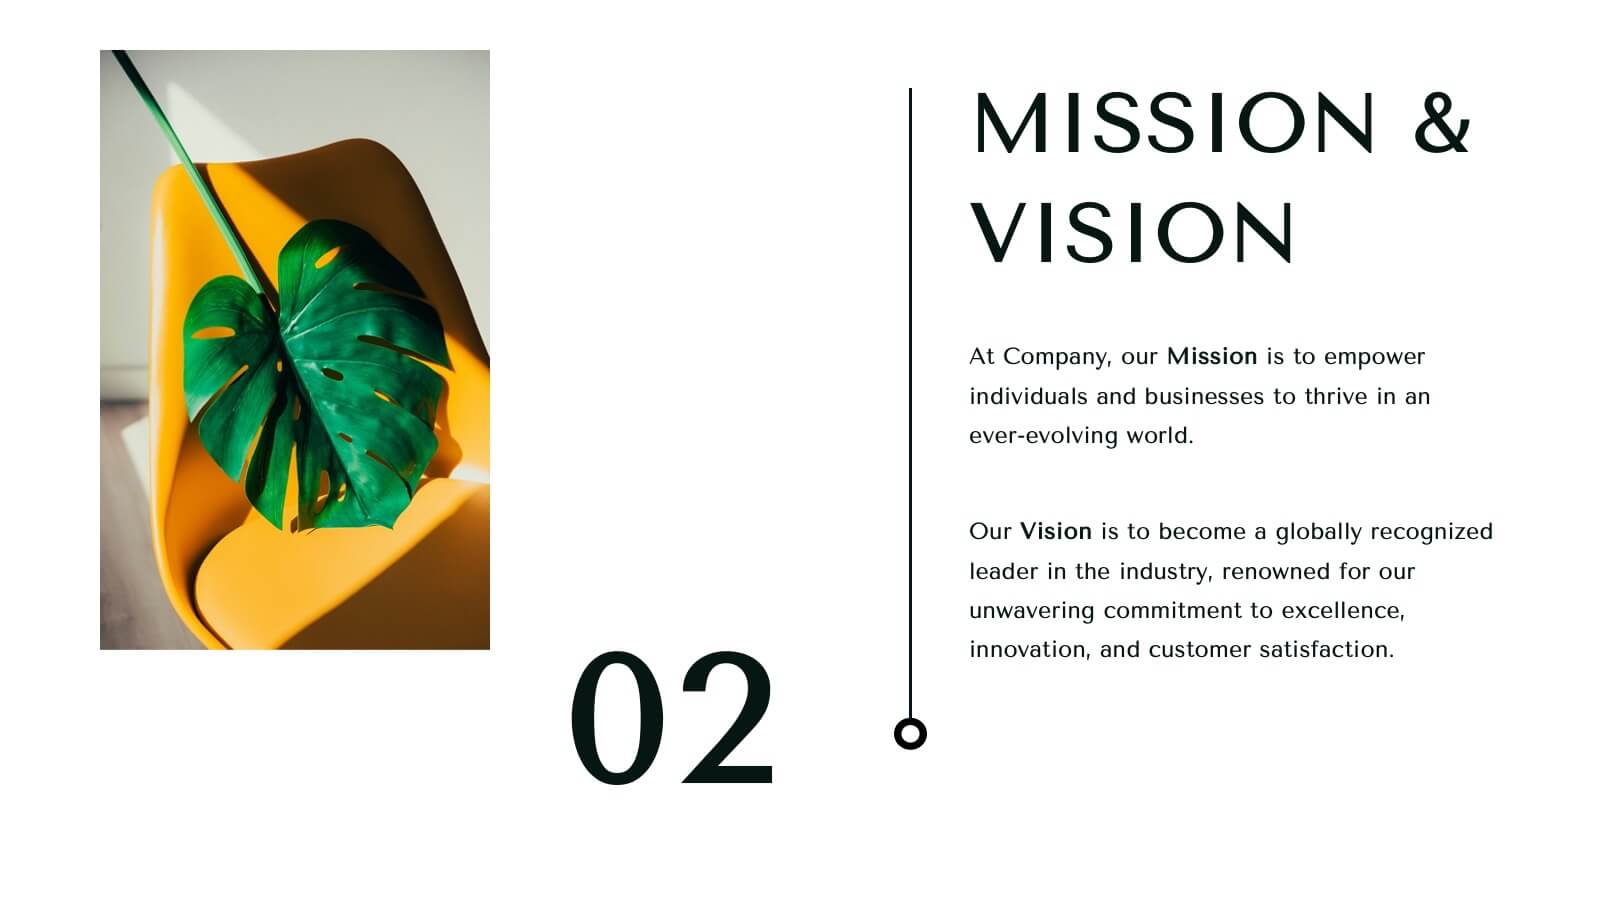
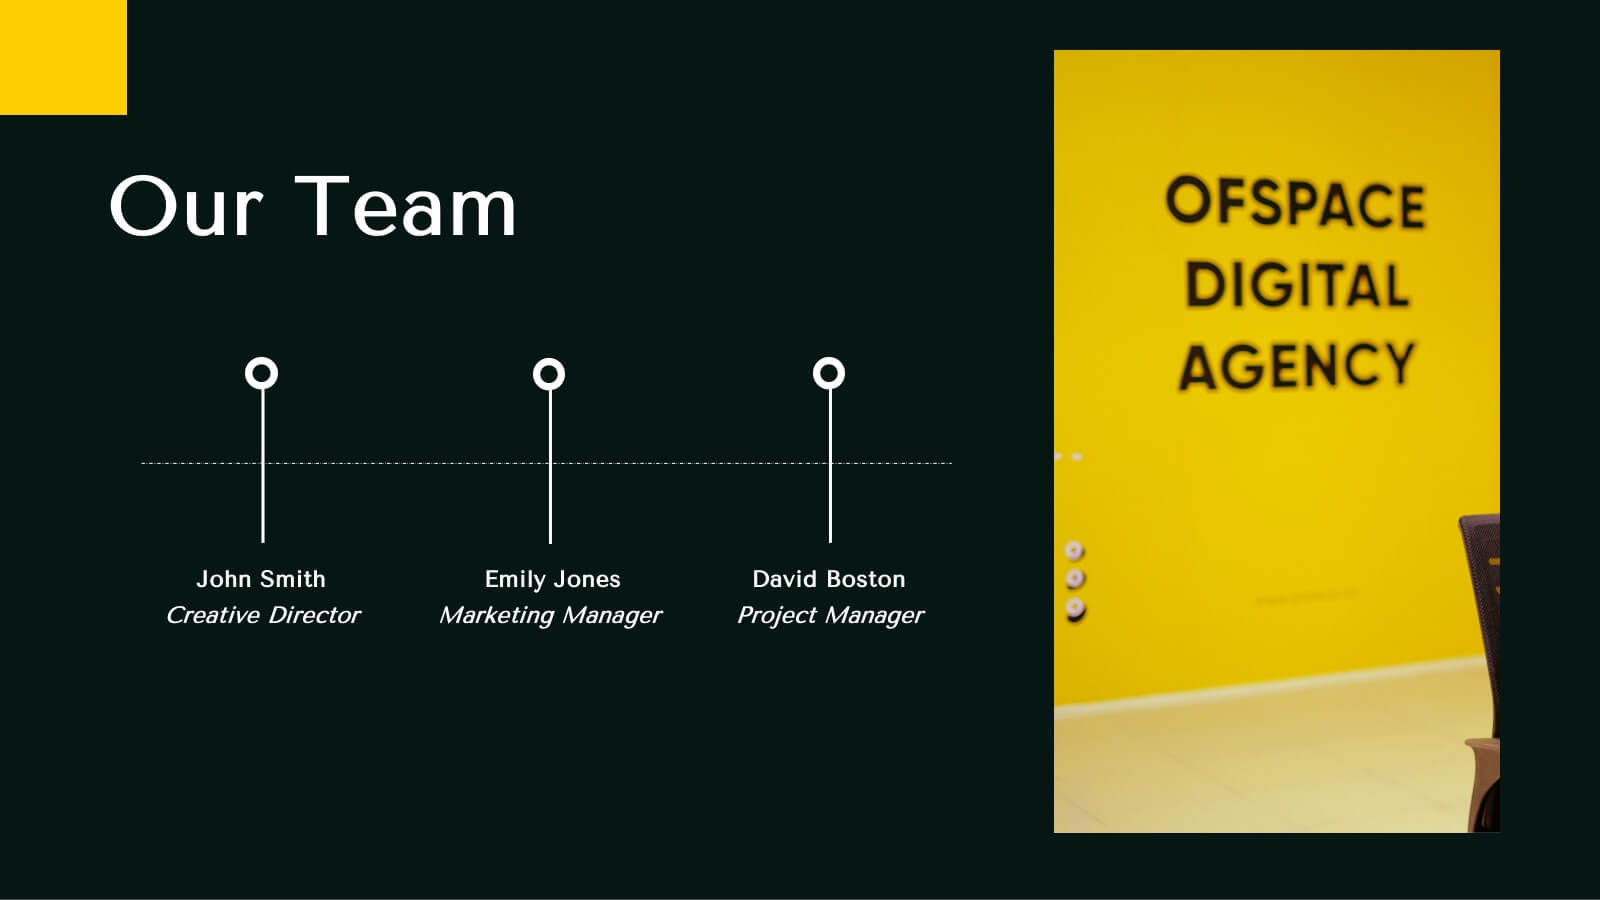
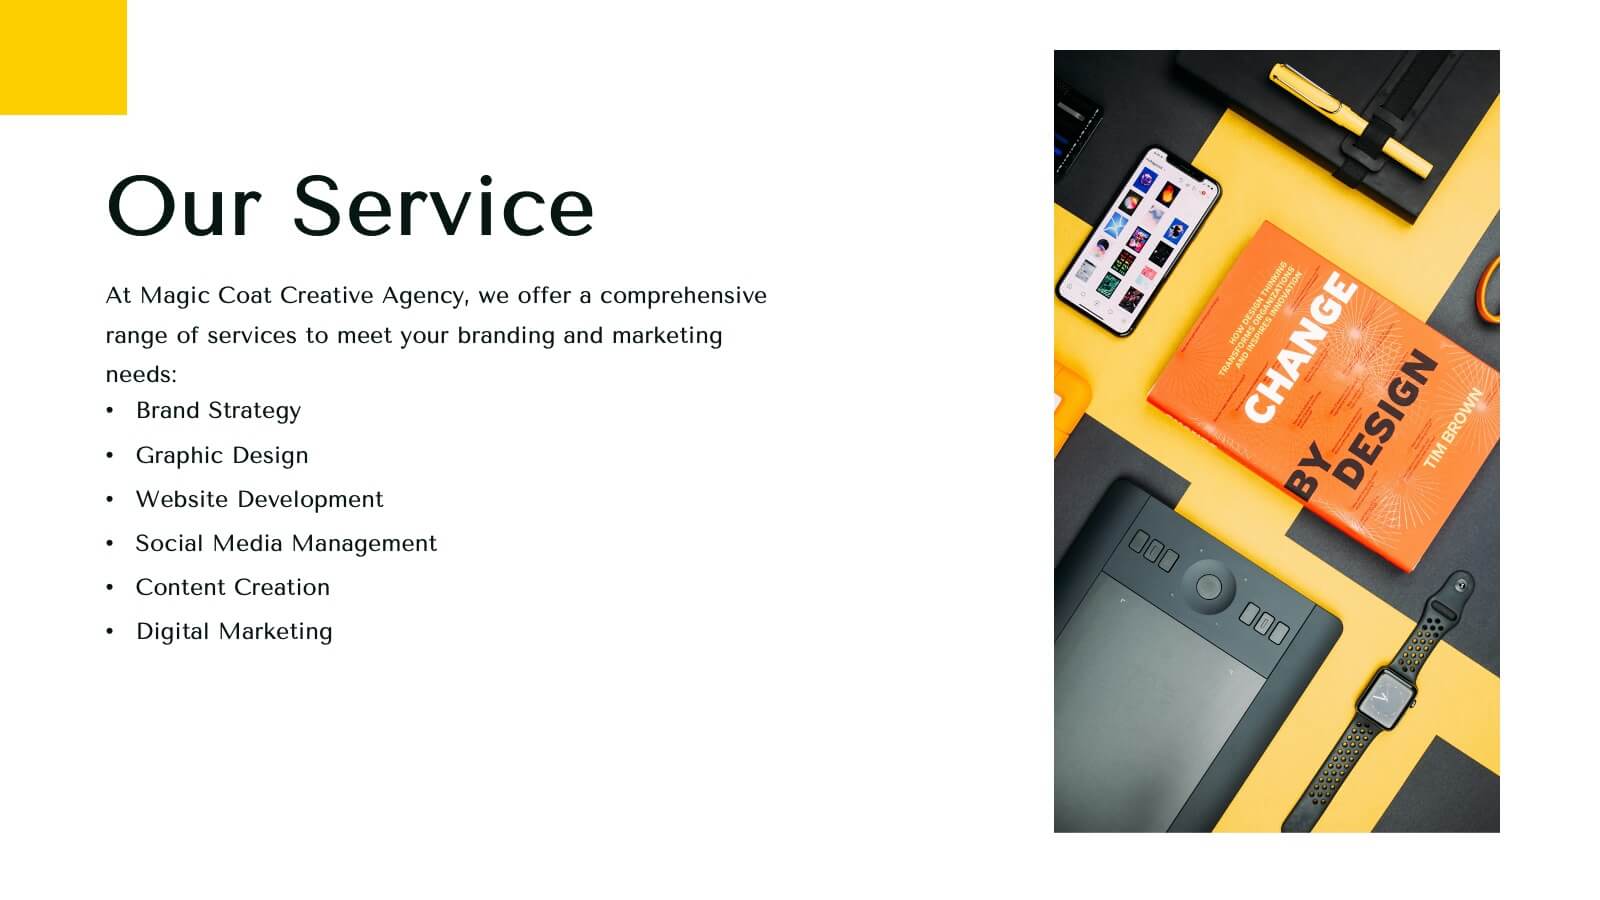
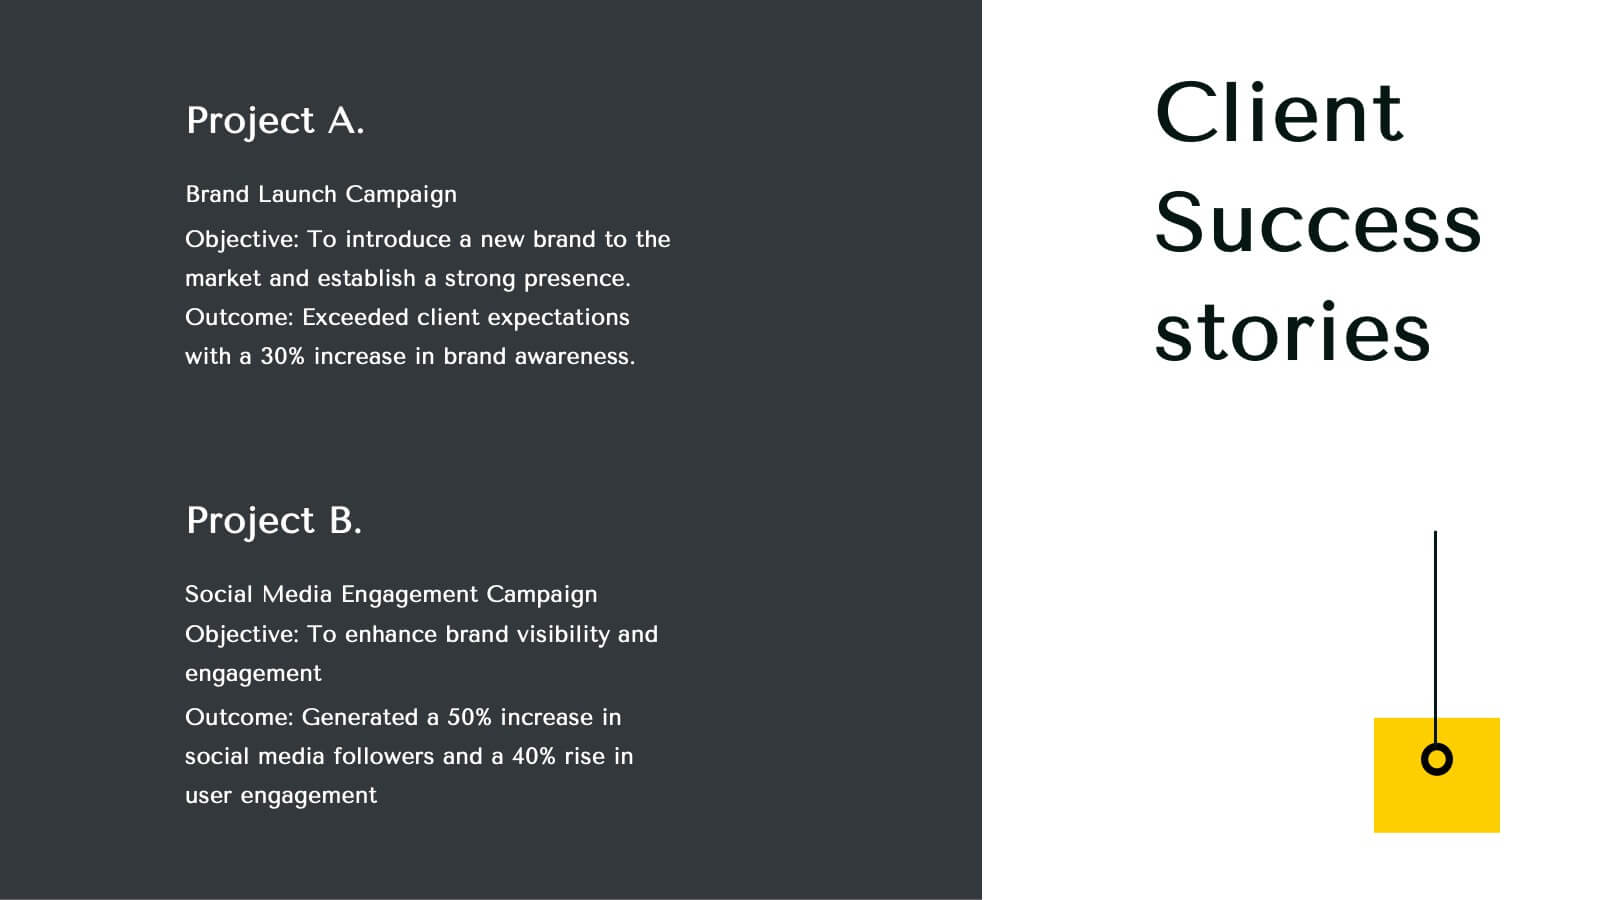
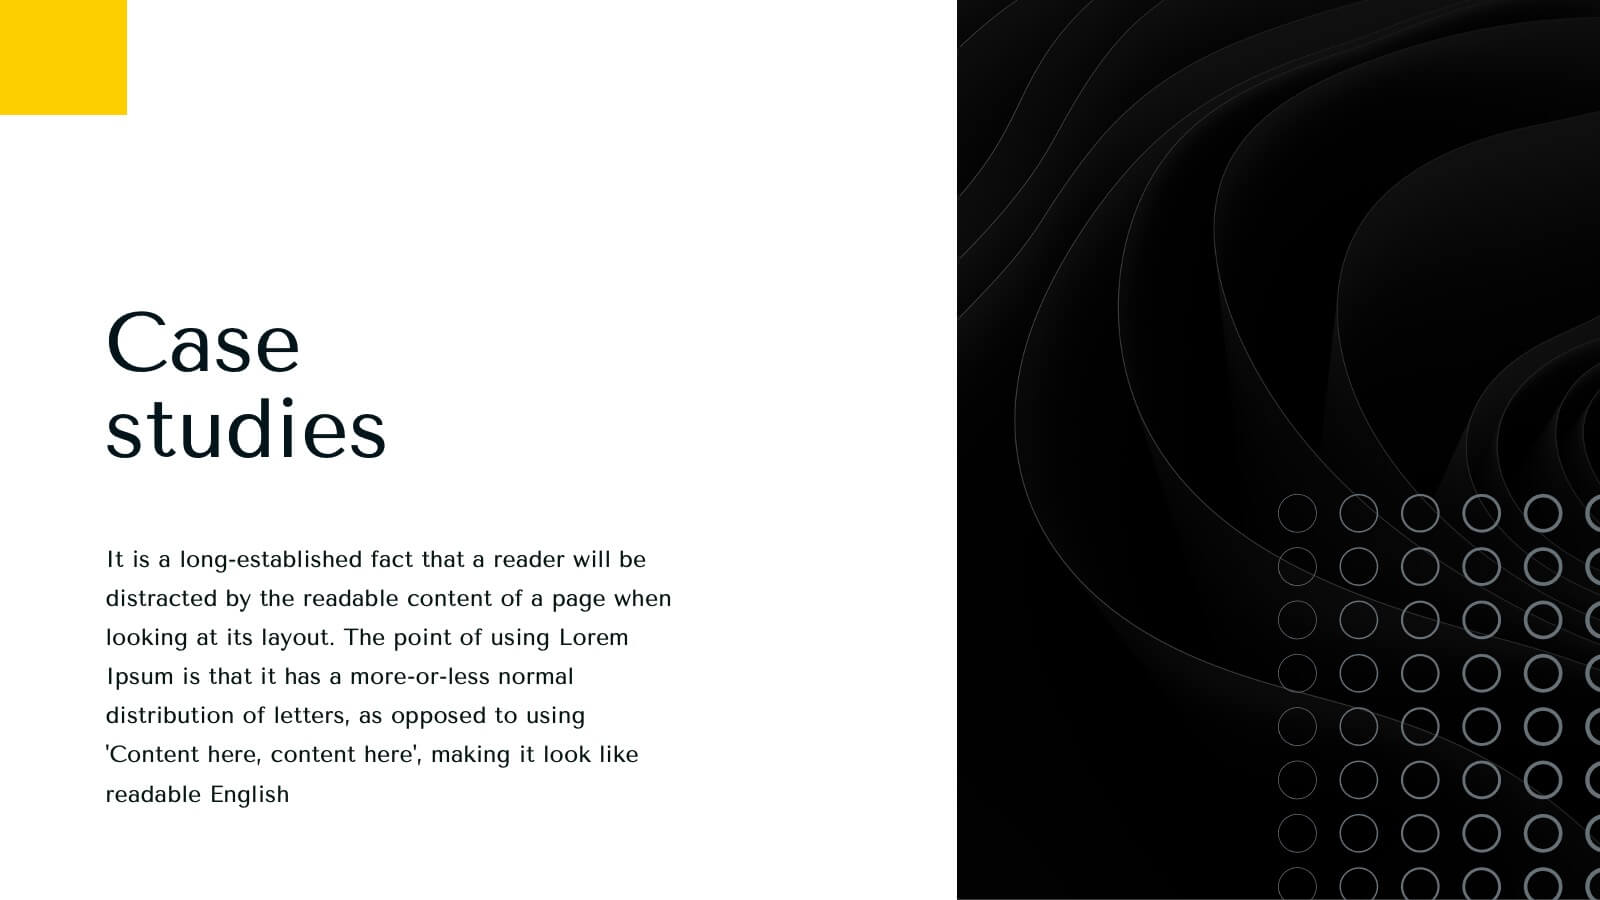
Infinity Agency Portfolio Presentation
Showcase your agency's excellence with this dynamic and modern presentation template. Ideal for presenting market analysis, client success stories, and strategic development plans, it features a bold design with a vibrant yellow and black theme. Highlight your unique approach and creative process to captivate your audience. Compatible with PowerPoint, Keynote, and Google Slides, it's perfect for any platform.


21 diapositivas
Quaver Annual Report Presentation
Deliver impactful annual reports with this professional presentation template, designed to showcase your company's progress and achievements with precision and clarity. This template is ideal for presenting financial summaries, performance metrics, strategic goals, and operational updates. The layout includes customizable slides for key highlights, risk assessments, project progress, and customer feedback summaries. Infographic elements and visual aids ensure complex data is easily understood, while dedicated sections for challenges, solutions, and recommendations facilitate meaningful discussions. Engage your audience with a clean design and logical structure that reflects professionalism. Compatible with PowerPoint, Google Slides, and Keynote, this template offers full customization to adapt to your branding and specific needs. Whether you're addressing stakeholders, team members, or external audiences, this presentation helps you communicate your accomplishments effectively. Save time and make a lasting impression with a polished and versatile design that aligns with your company’s vision.


6 diapositivas
Bubble Diagram for Idea Development Presentation
Visualize your creative process with this Bubble Diagram for Idea Development template. Ideal for brainstorming sessions, project planning, and innovation strategies, this slide uses color-coded lightbulbs and numbered bubbles to illustrate key ideas and their relationships. Perfect for entrepreneurs, teams, and educators, it simplifies complex concepts into a clear, engaging format. Fully editable and compatible with PowerPoint, Keynote, and Google Slides for seamless customization.


6 diapositivas
Sales Team Infographic
The series presented showcases various slide templates tailored for enhancing sales team strategies and communication. Each slide is crafted to assist sales professionals in detailing team structures, sales goals, performance metrics, and strategic initiatives effectively. Utilizing vibrant color blocks and streamlined design elements, these templates make complex sales data approachable and engaging, facilitating clear and impactful presentations. The collection is designed with adaptability in mind, incorporating elements that can be easily customized to fit different team needs and company branding. These include comparative layouts for benchmarking, timeline formats for showcasing sales cycles, and diagrammatic representations for visualizing sales processes and results. Perfect for internal meetings, sales training sessions, and stakeholder presentations, these templates serve as essential tools for sales leaders to convey their team’s progress, celebrate wins, and strategize for future sales endeavors.


5 diapositivas
Risk Management Bowtie Diagram Layout Presentation
Visualize risk pathways with clarity using the Risk Management Bowtie Diagram Layout Presentation. This design helps illustrate cause-and-effect relationships around a central risk event, making it ideal for identifying threats, controls, and consequences. Fully editable and easy to adapt in Canva, PowerPoint, Google Slides, and Keynote.