


Características


¿Tienes alguna pregunta?
Recomendar


4 diapositivas
Digital Funnel and Lead Generation Presentation
Visualize your customer journey clearly with the Digital Funnel and Lead Generation Presentation. This template uses stacked 3D-style funnel layers to illustrate each step—from awareness to conversion—making it perfect for marketing strategy, sales pipelines, or automation flows. Clean layout, customizable text, and icons included. Compatible with PowerPoint, Keynote, and Google Slides.


6 diapositivas
Organized Table of Content Layout Presentation
Introduce your presentation with structure and flow using this Organized Table of Content Layout. With six clearly numbered sections, connected through a dynamic flowchart design, this slide helps guide your audience through your key topics. Each section includes a title and space for a short description. This layout is ideal for reports, proposals, workshops, or strategy decks. Fully editable in PowerPoint, Keynote, and Google Slides.


23 diapositivas
Zenith Product Launch Pitch Deck Presentation
Launch your product successfully with this compelling pitch deck! Perfect for presenting company overview, problem statements, and market opportunities. Ideal for startups and entrepreneurs aiming to attract investors and stakeholders. Compatible with PowerPoint, Keynote, and Google Slides, this template ensures your pitch is clear, persuasive, and professional. Secure your product's success today!


7 diapositivas
Performance Cycle Infographic Presentation
A Cycle Infographic is a process-oriented model that describes an ongoing activity or a repeating task. The cycle diagrams are used to show the flow of a process as a series of steps and decisions, each with its own terminations and branches. This template is perfect for motivating, organizing and presenting tasks and projects. It can be used to highlight processes, collaboration, statistics and more. This is a colorful, creative template design for explaining key business ideas, processes or theories in a dynamic and easily digestible way. It's perfect for teaching, students and businesses.


5 diapositivas
Suicide Prevention & Awareness Infographics
Suicide Awareness plays a vital role in addressing the global public health issue of suicide. These vertical infographics are powerful and informative designs that aim to raise awareness about suicide prevention, promote mental health, and provide essential information to help individuals recognize the signs and support those in need. With its thoughtful and sensitive design, the template communicates important statistics, facts, and resources. The template is fully customizable, allowing you to personalize the infographics with your own content, including local helpline numbers, support services, or specific awareness campaigns.


7 diapositivas
Stock Market Sectors Infographic
Dive deep into the intricacies of stock market sectors with our comprehensive infographic. Utilizing a palette of white, green, and red, this visual tool breaks down the vast expanse of the stock market into distinct sectors, making it easier to comprehend and analyze. Ideal for investors, stock market enthusiasts, financial educators, and students alike, this infographic provides a clear snapshot of the financial landscape. With its effortless integration into PowerPoint, Keynote, and Google Slides, sharing and presenting this crucial market information becomes seamless and engaging.


10 diapositivas
Risk Management in Insurance
Visualize your insurance risk strategies with this engaging umbrella-themed presentation. Designed to illustrate layered risk coverage or multi-step assessments, this slide set is ideal for analysts, agents, or consultants. Each section is clearly numbered and color-coded for easy understanding. Fully editable in PowerPoint, Keynote, and Google Slides.


7 diapositivas
TAM SAM SOM Research Infographic
TAM, SAM, and SOM are acronyms often used in business and marketing to analyze and understand the potential market for a product or service. This infographic template acts as a compass, guiding you through the seas of Total Available Market (TAM), Served Available Market (SAM), and Share of Market (SOM). Compatible with Powerpoint, Keynote, and Google Slides. This showcases creative visualization methods to represent TAM, SAM, and SOM effectively, ensuring clarity and engagement. Use this template to discuss how insights from TAM SAM SOM analysis can shape business strategies, drive growth, and enhance competitiveness.


5 diapositivas
Division List Infographics
A Division List is a list of items or numbers that have been divided or categorized based on a certain criterion or set of criteria. These Infographics are visual representation of data that allows you to divide and categorize information into smaller groups or categories. These can be used to display any kind of data that requires grouping, such as military ranks, airlines, religion or virus symptoms. This template is designed using bold colors, various shapes, and icons to make the data more engaging and visually appealing. These are perfect for business presentations, marketing campaigns, and educational materials.


6 diapositivas
Project Timeline Infographic Presentation
Streamline your workflow with this Project Timeline Infographic template. Perfect for visualizing milestones, tracking progress, and organizing tasks, this design is fully editable to suit any project needs. Adjust colors, icons, and text effortlessly. Compatible with PowerPoint, Keynote, and Google Slides for smooth presentations and collaboration.


22 diapositivas
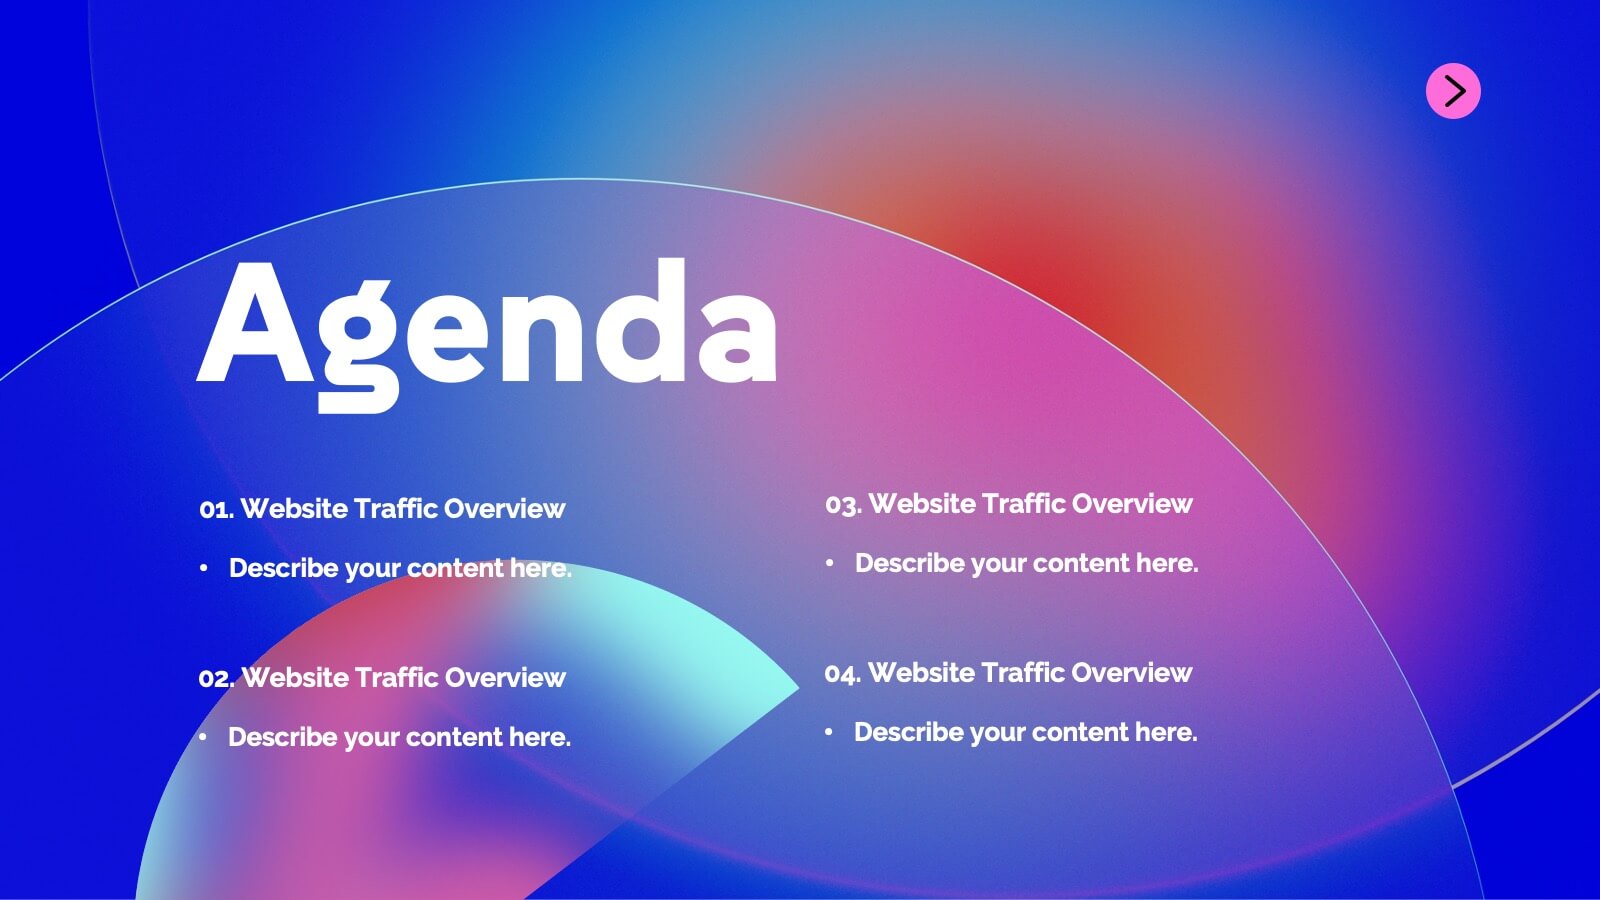
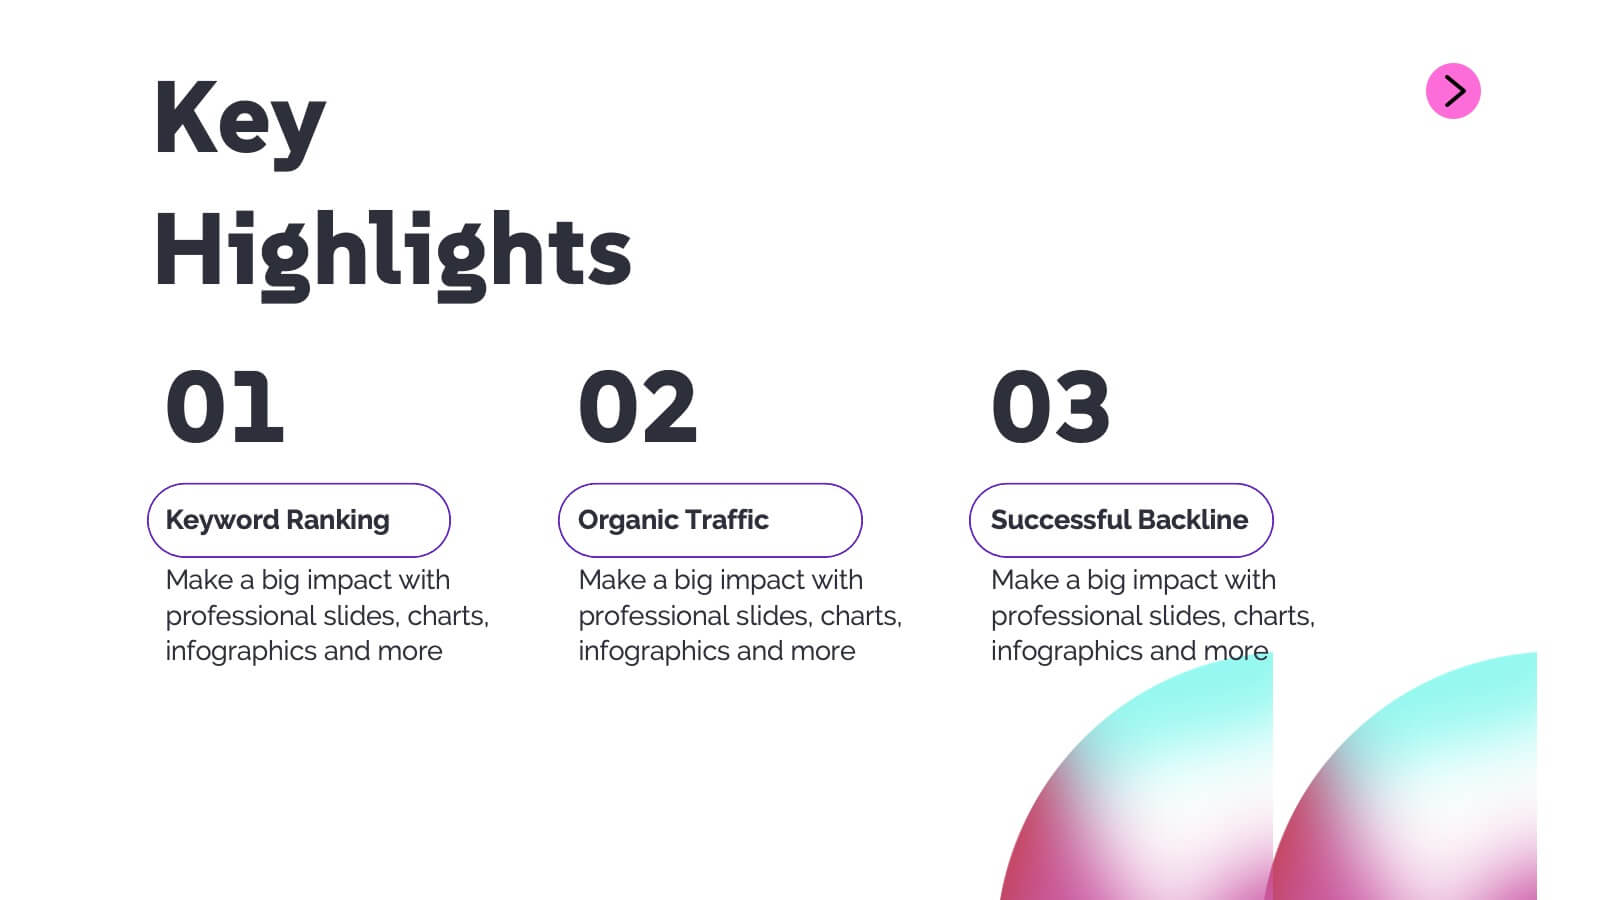
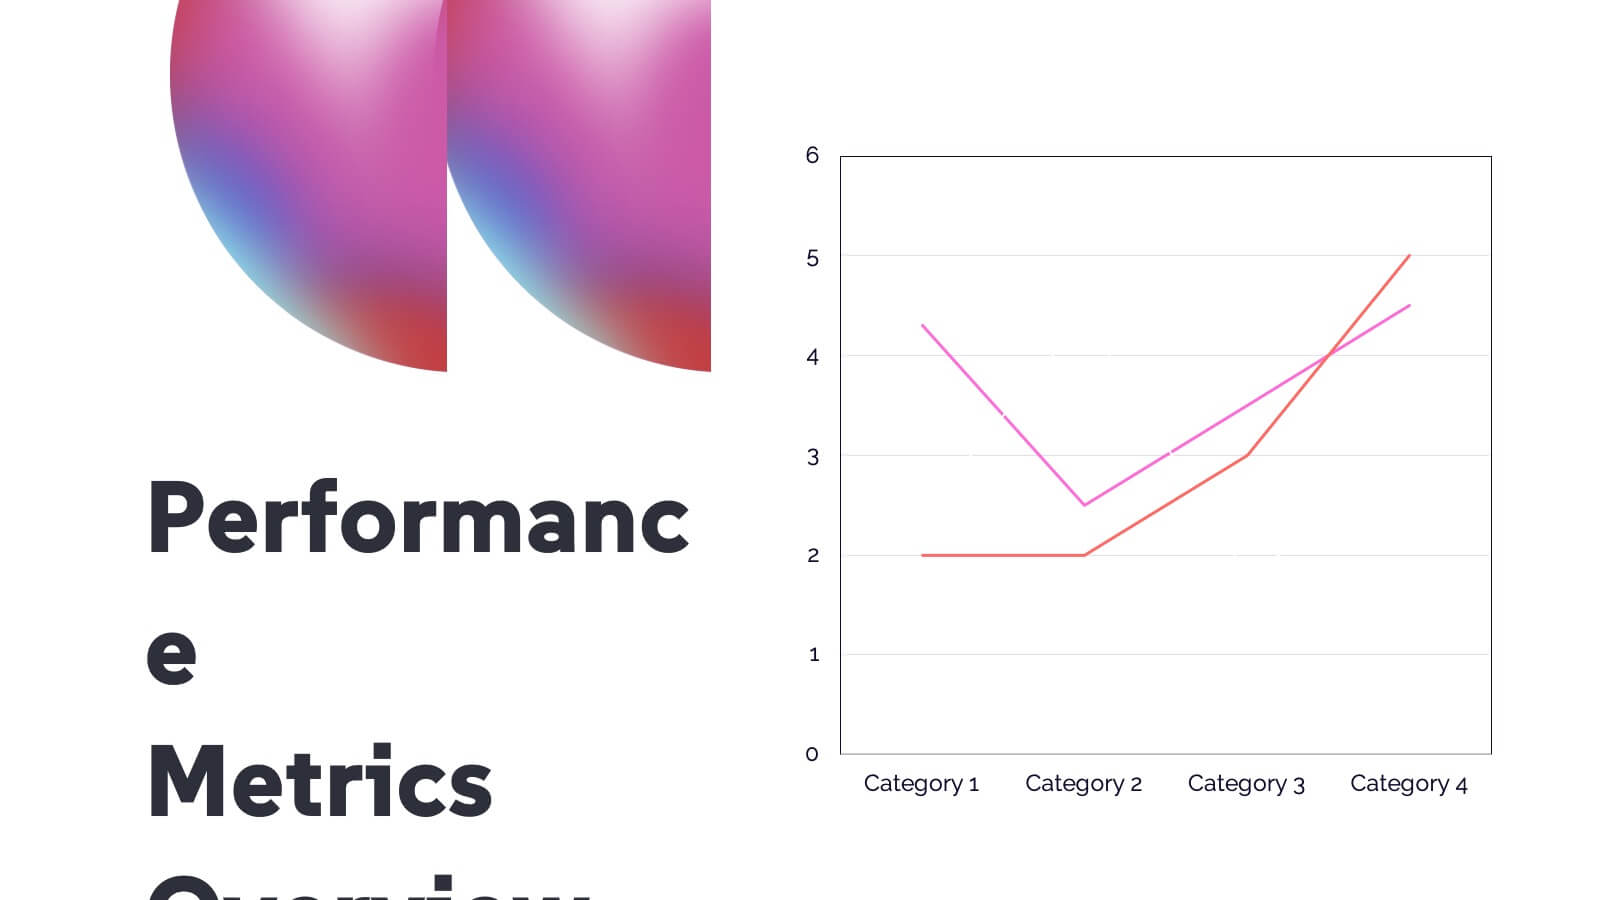
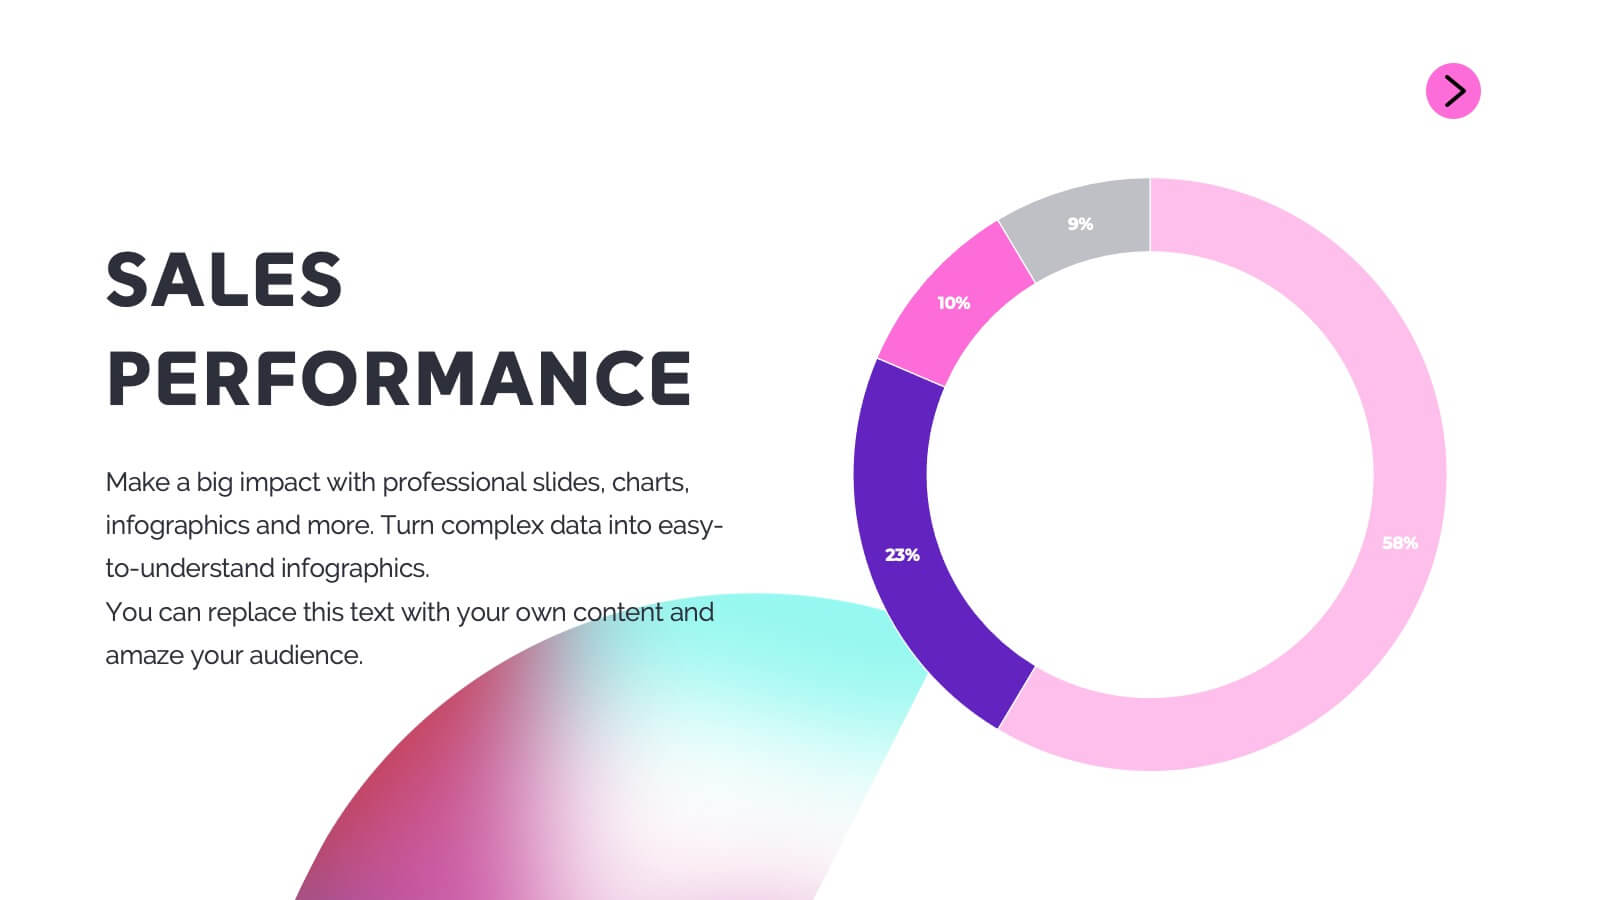
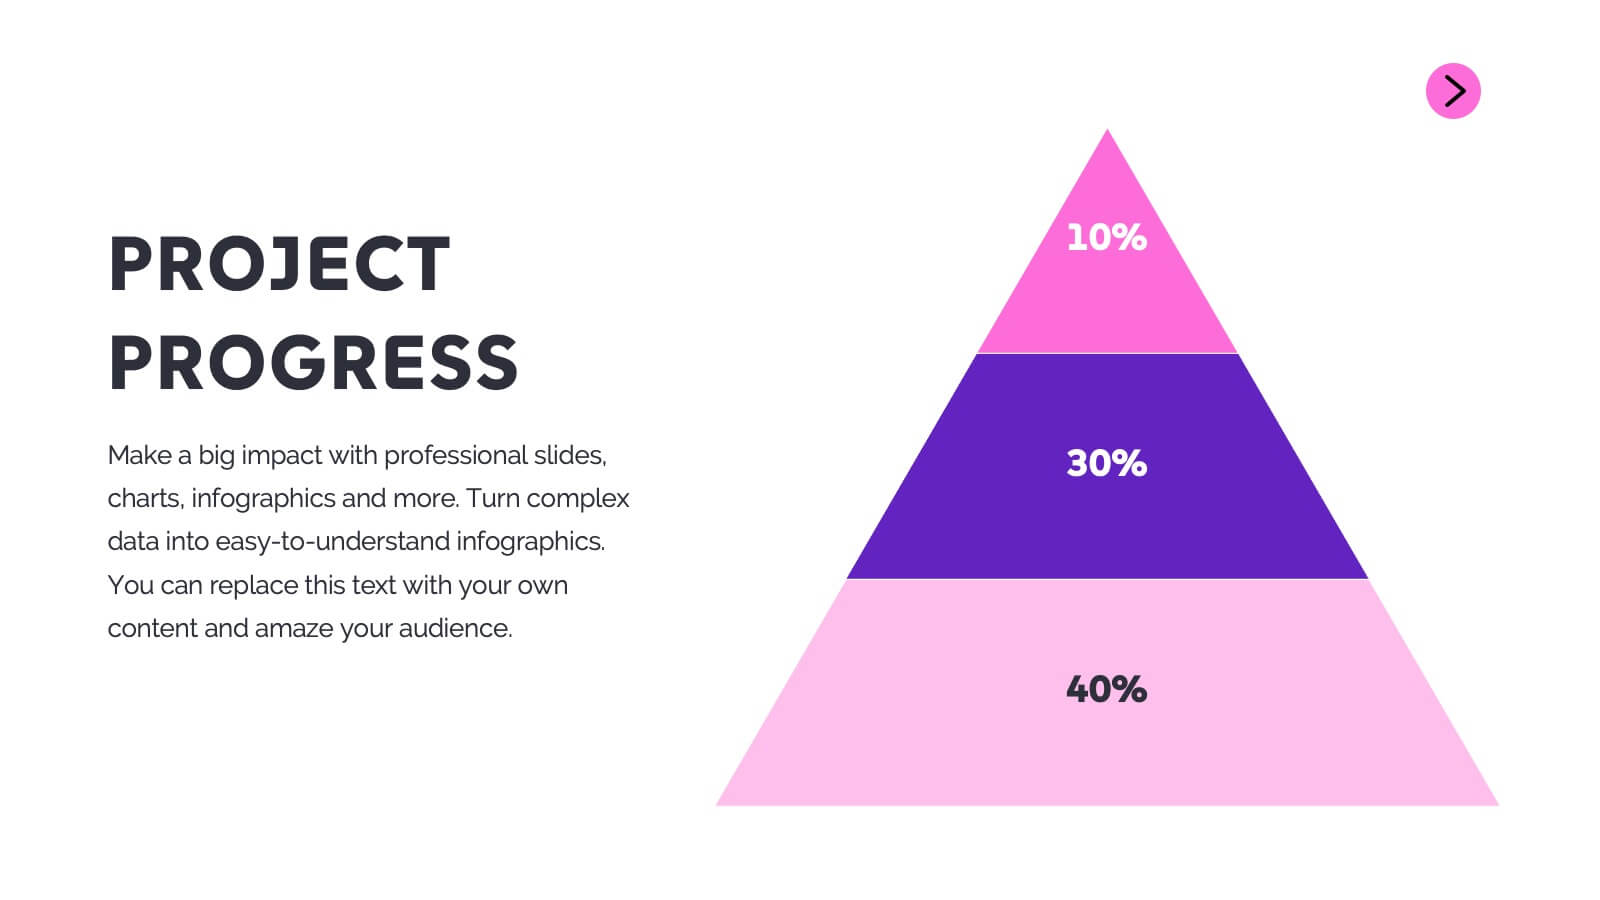
Sphinx Project Status Report Presentation
This modern project status report template is perfect for tracking progress and highlighting key achievements. It includes sections for performance metrics, financial summaries, challenges, and strategic initiatives. Keep stakeholders informed with clear, concise updates. Compatible with PowerPoint, Keynote, and Google Slides for easy customization and presentation.


6 diapositivas
Meeting and Event Planning Schedule Presentation
Plan smarter and meet deadlines with the Meeting and Event Planning Schedule Presentation. This organized layout helps teams visualize phases, dates, and key activities at a glance—perfect for scheduling workshops, meetings, or launch events. Fully customizable in PowerPoint, Keynote, and Google Slides.


7 diapositivas
Customer Empathy Map Infographic Presentation
An Empathy Map infographic is a visual tool used to help understand the needs, wants, and behaviors of a particular customer. This template is a perfect way to gather and organize information about a person's experience and perspective, in order to better understand their motivations and desires. This empathy map infographic consists of a diagram that is divided into four quadrants: what the user thinks and feels, what they hear, what they see, and what they do. In each quadrant, information is gathered about the user's thoughts, feelings, and actions related to a particular product or service.


6 diapositivas
Strategy for Effective Solutions Presentation
Unlock strategic clarity with the Strategy for Effective Solutions template, which effectively organizes complex strategies into six interconnected segments, ideal for sequentially showcasing business insights. Its clear, systematic design supports concise communication and is compatible with PowerPoint, Keynote, and Google Slides, making it a versatile tool for professional presentations.


10 diapositivas
Six Sigma Process Improvement
Visualize each stage of the Six Sigma DMAIC methodology—Define, Measure, Analyze, Improve, and Control—with this circular diagram layout. Perfect for quality control meetings, workflow optimization, and training sessions. Fully customizable in PowerPoint, Keynote, and Google Slides.


7 diapositivas
Enterprise Sales Infographic
Enterprise sales, often referred to as B2B (business-to-business) sales, involves selling products or services to larger organizations and enterprises. Prepare for an exhilarating journey through our sales infographic - a high-energy presentation designed to fuel your enterprise sales like never before. Illuminate the path to a seamless customer experience, leading to a galaxy of satisfaction. This infographic is fully customizable and compatible with Powerpoint, Keynote, and Google Slides. This template isn't just a sales roadmap; it's a launchpad to your unparalleled success!


5 diapositivas
Easy Asian Recipes Infographics
Asian cuisine is incredibly diverse and offers a wide range of delicious and flavorful recipes from various countries and regions. These vertical infographics are designed in a user-friendly design that showcase a collection of simple and delicious Asian recipes. These are perfect for home cooks, food bloggers, and anyone interested in exploring the flavors of Asian cuisine. These infographics include beautifully designed recipes for a variety of popular Asian dishes, such as ramen, teriyaki chicken, and more. Each recipe provides a list of ingredients needed and step-by-step instructions to guide users through the cooking process.