


Características


¿Tienes alguna pregunta?
Recomendar


6 diapositivas
Historical Events Timeline Presentation
Chronicle significant moments with the Historical Events Timeline Diagram. This visually engaging template allows you to map key milestones, highlight crucial dates, and present historical progressions with clarity. Ideal for educators, researchers, and business professionals, this timeline ensures a structured and impactful storytelling experience. Fully customizable and compatible with PowerPoint, Keynote, and Google Slides.


8 diapositivas
Asia Geographics and Business Analysis Map Presentation
Visualize regional insights with this Asia map template. Highlight business data, performance indicators, or strategic regions using callouts and color-coded zones. Perfect for market analysis, logistics, or geographic reporting. Fully customizable in PowerPoint, Keynote, or Google Slides to match your branding and presentation goals with clear, location-based storytelling.


5 diapositivas
Restaurant Regulations Infographics
Restaurant Regulations are crucial for ensuring food safety and hygiene. This infographic is designed in vertical format, allowing for easy display on digital platforms such as social media or the restaurant's website. This is designed to help restaurants communicate regulations to their staff and customers. The use of visually appealing graphics and colors help make the information more engaging and easier to understand. It can also be customized with the restaurant's branding and logo to create a cohesive look and feel. The infographic is divided into sections, each for covering different areas of your regulations.


7 diapositivas
Credit Card Services Infographic Presentation
Credit Cards help build your credit, they can be extremely convenient, and they can even earn awesome rewards. This Template can be used to highlight the various benefits of owning a credit card to the public. You can also use this to represent the different types of cards, product descriptions, and facts about credit cards. You can present your information through customizable icons, charts and graphs. This template is designed to illustrate Information about credit cards in an attractive way. Use this to develop creative presentations that will be interesting and promising for your audience.


21 diapositivas
Tourmaline Project Proposal Presentation
This sleek design proposal template covers all essential sections like project summary, objectives, goals, and deliverables. With a modern and professional layout, it's perfect for presenting solutions and methodologies. Compatible with PowerPoint, Keynote, and Google Slides, it’s designed to impress clients and stakeholders with clear, structured information.


5 diapositivas
SEO Optimization Infographics
The goal of SEO optimization is to attract more organic traffic to a website by improving its search engine ranking for relevant keywords and phrases. These Infographics are visual representations that show the steps, techniques, and best practices for improving a website's ranking in search engine results pages. These allow you to provide a quick and easy-to-understand overview of SEO concepts and strategies, including keyword research, on-page optimization, link building, and technical SEO. These are valuable resources for anyone looking to improve their website's search engine ranking and increase organic traffic.


6 diapositivas
Real Estate and Building Development Presentation
Present key insights into the real estate market with the Real Estate and Building Development template. Designed for property investors and urban planners, this visual framework highlights financial trends, project phases, and market analysis. Fully customizable and compatible with PowerPoint, Keynote, and Google Slides for seamless presentation delivery.


6 diapositivas
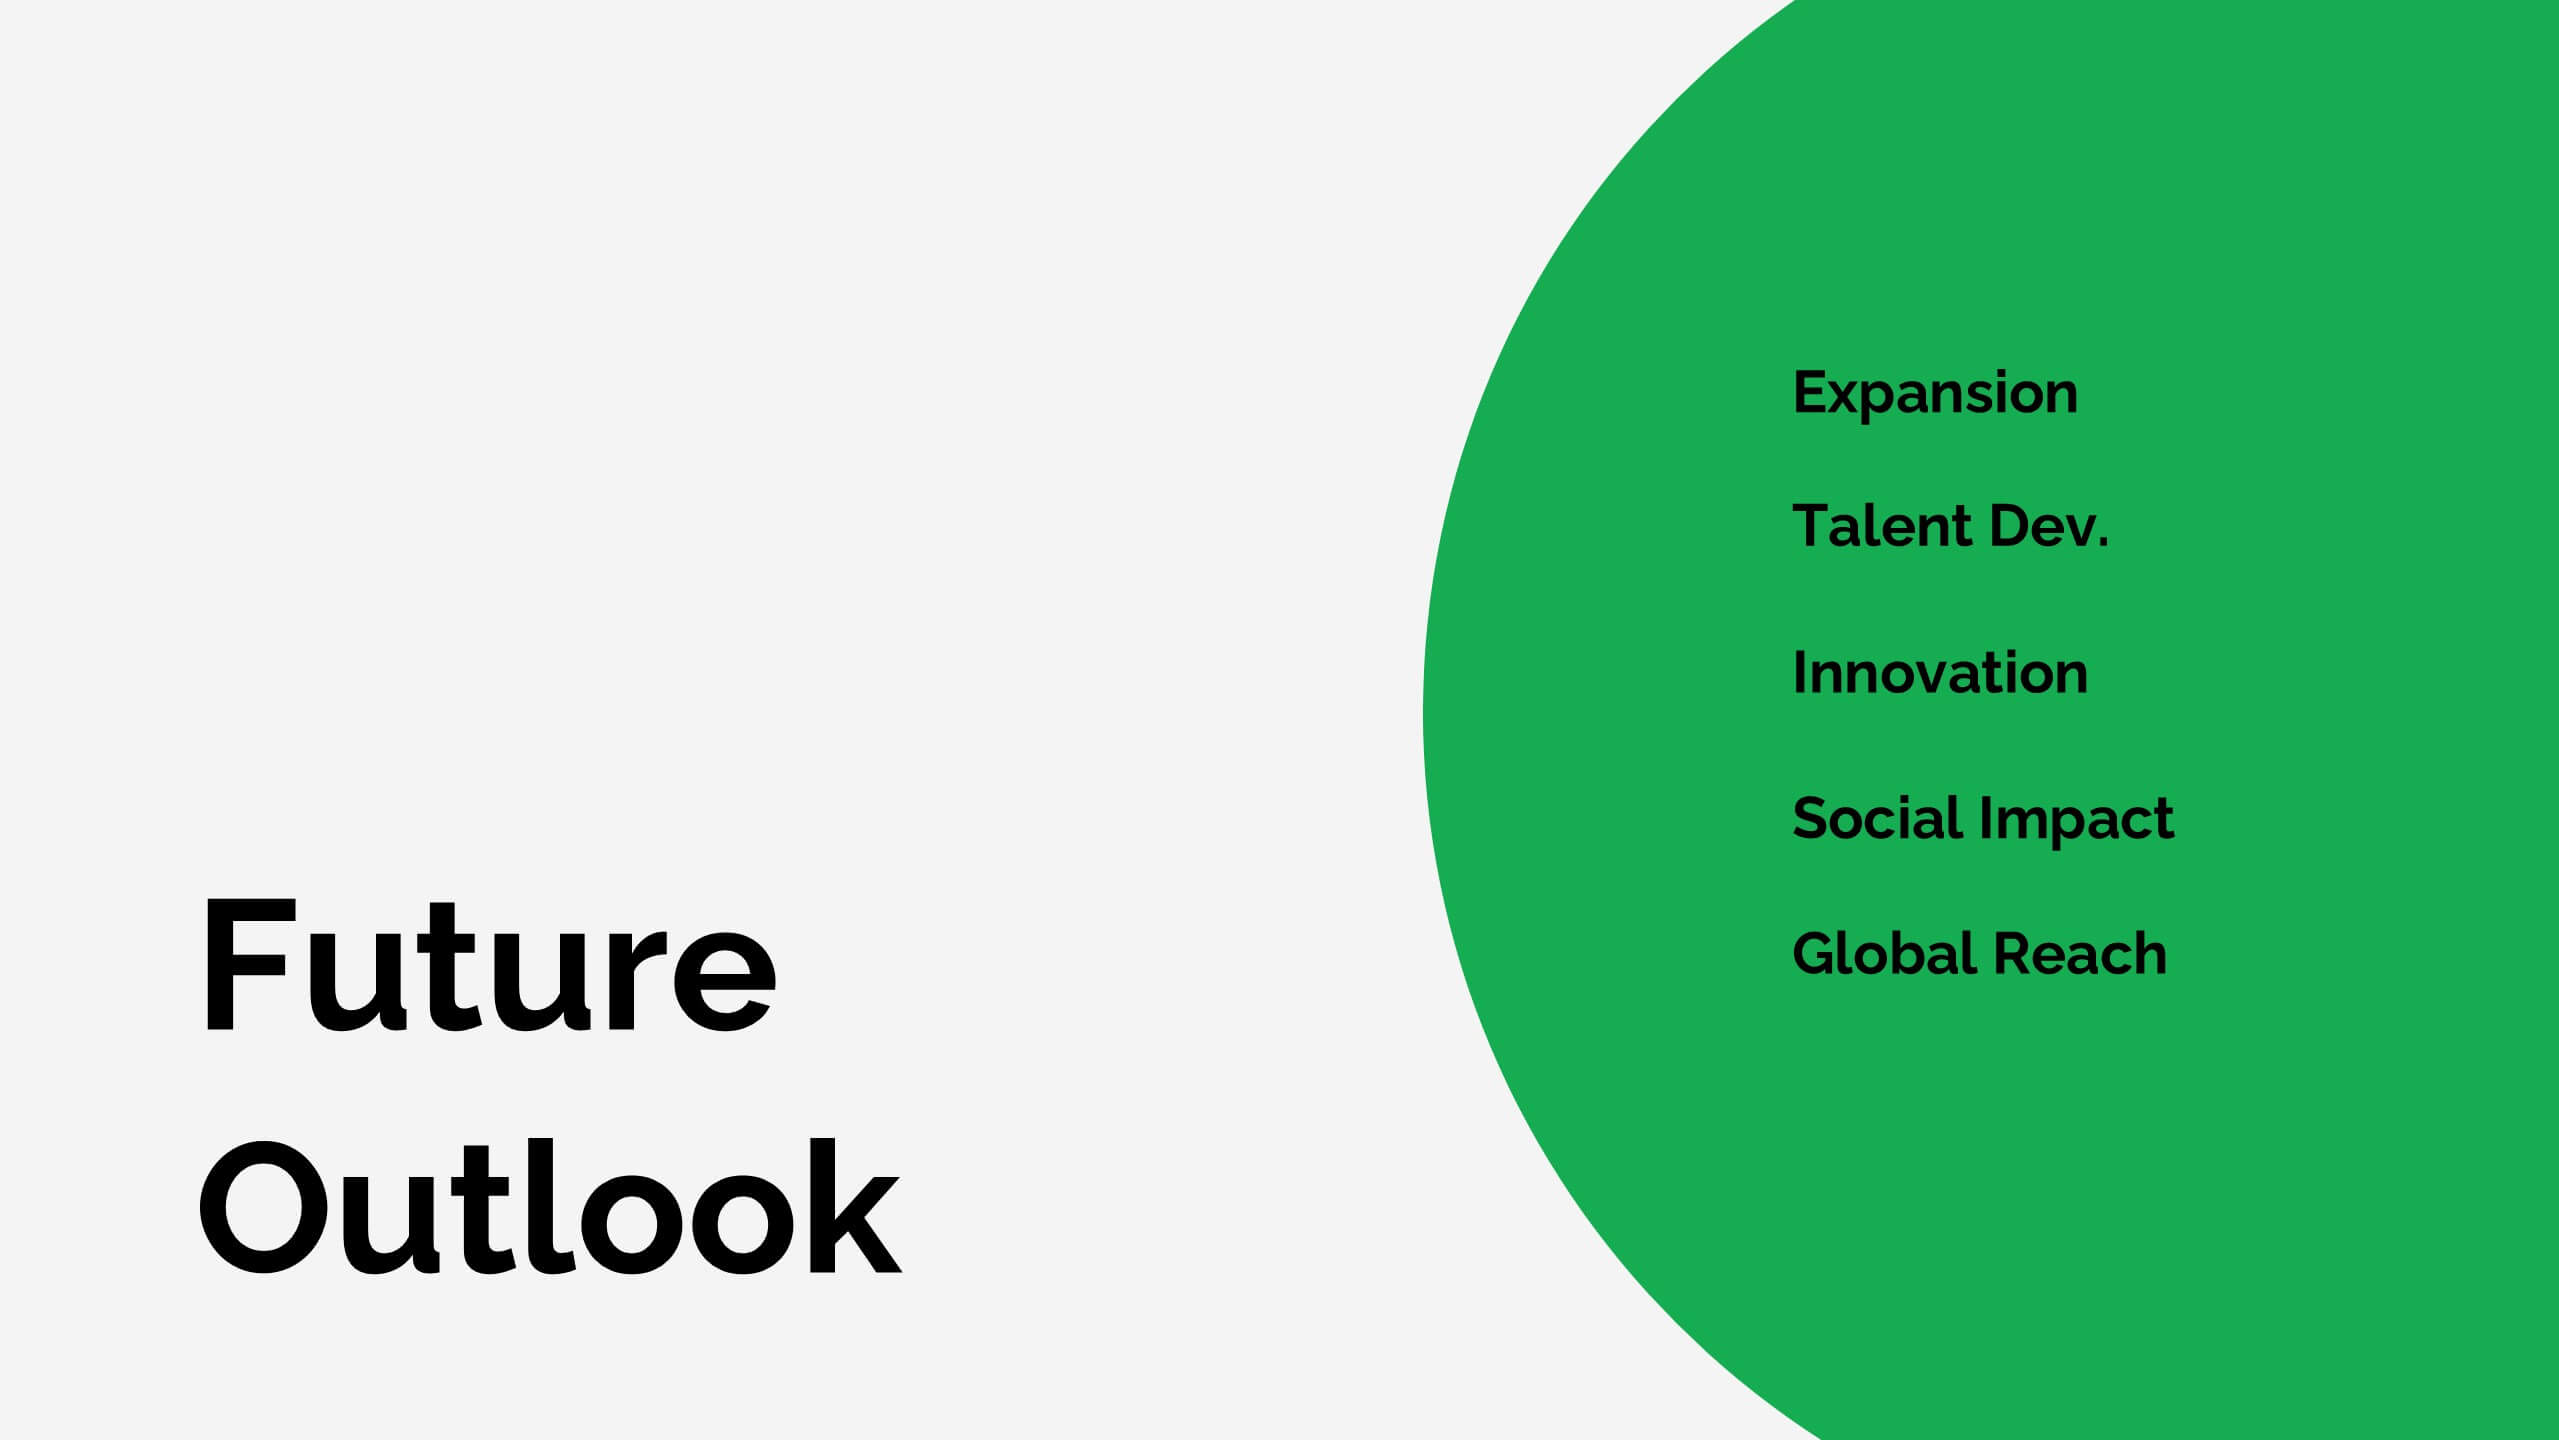
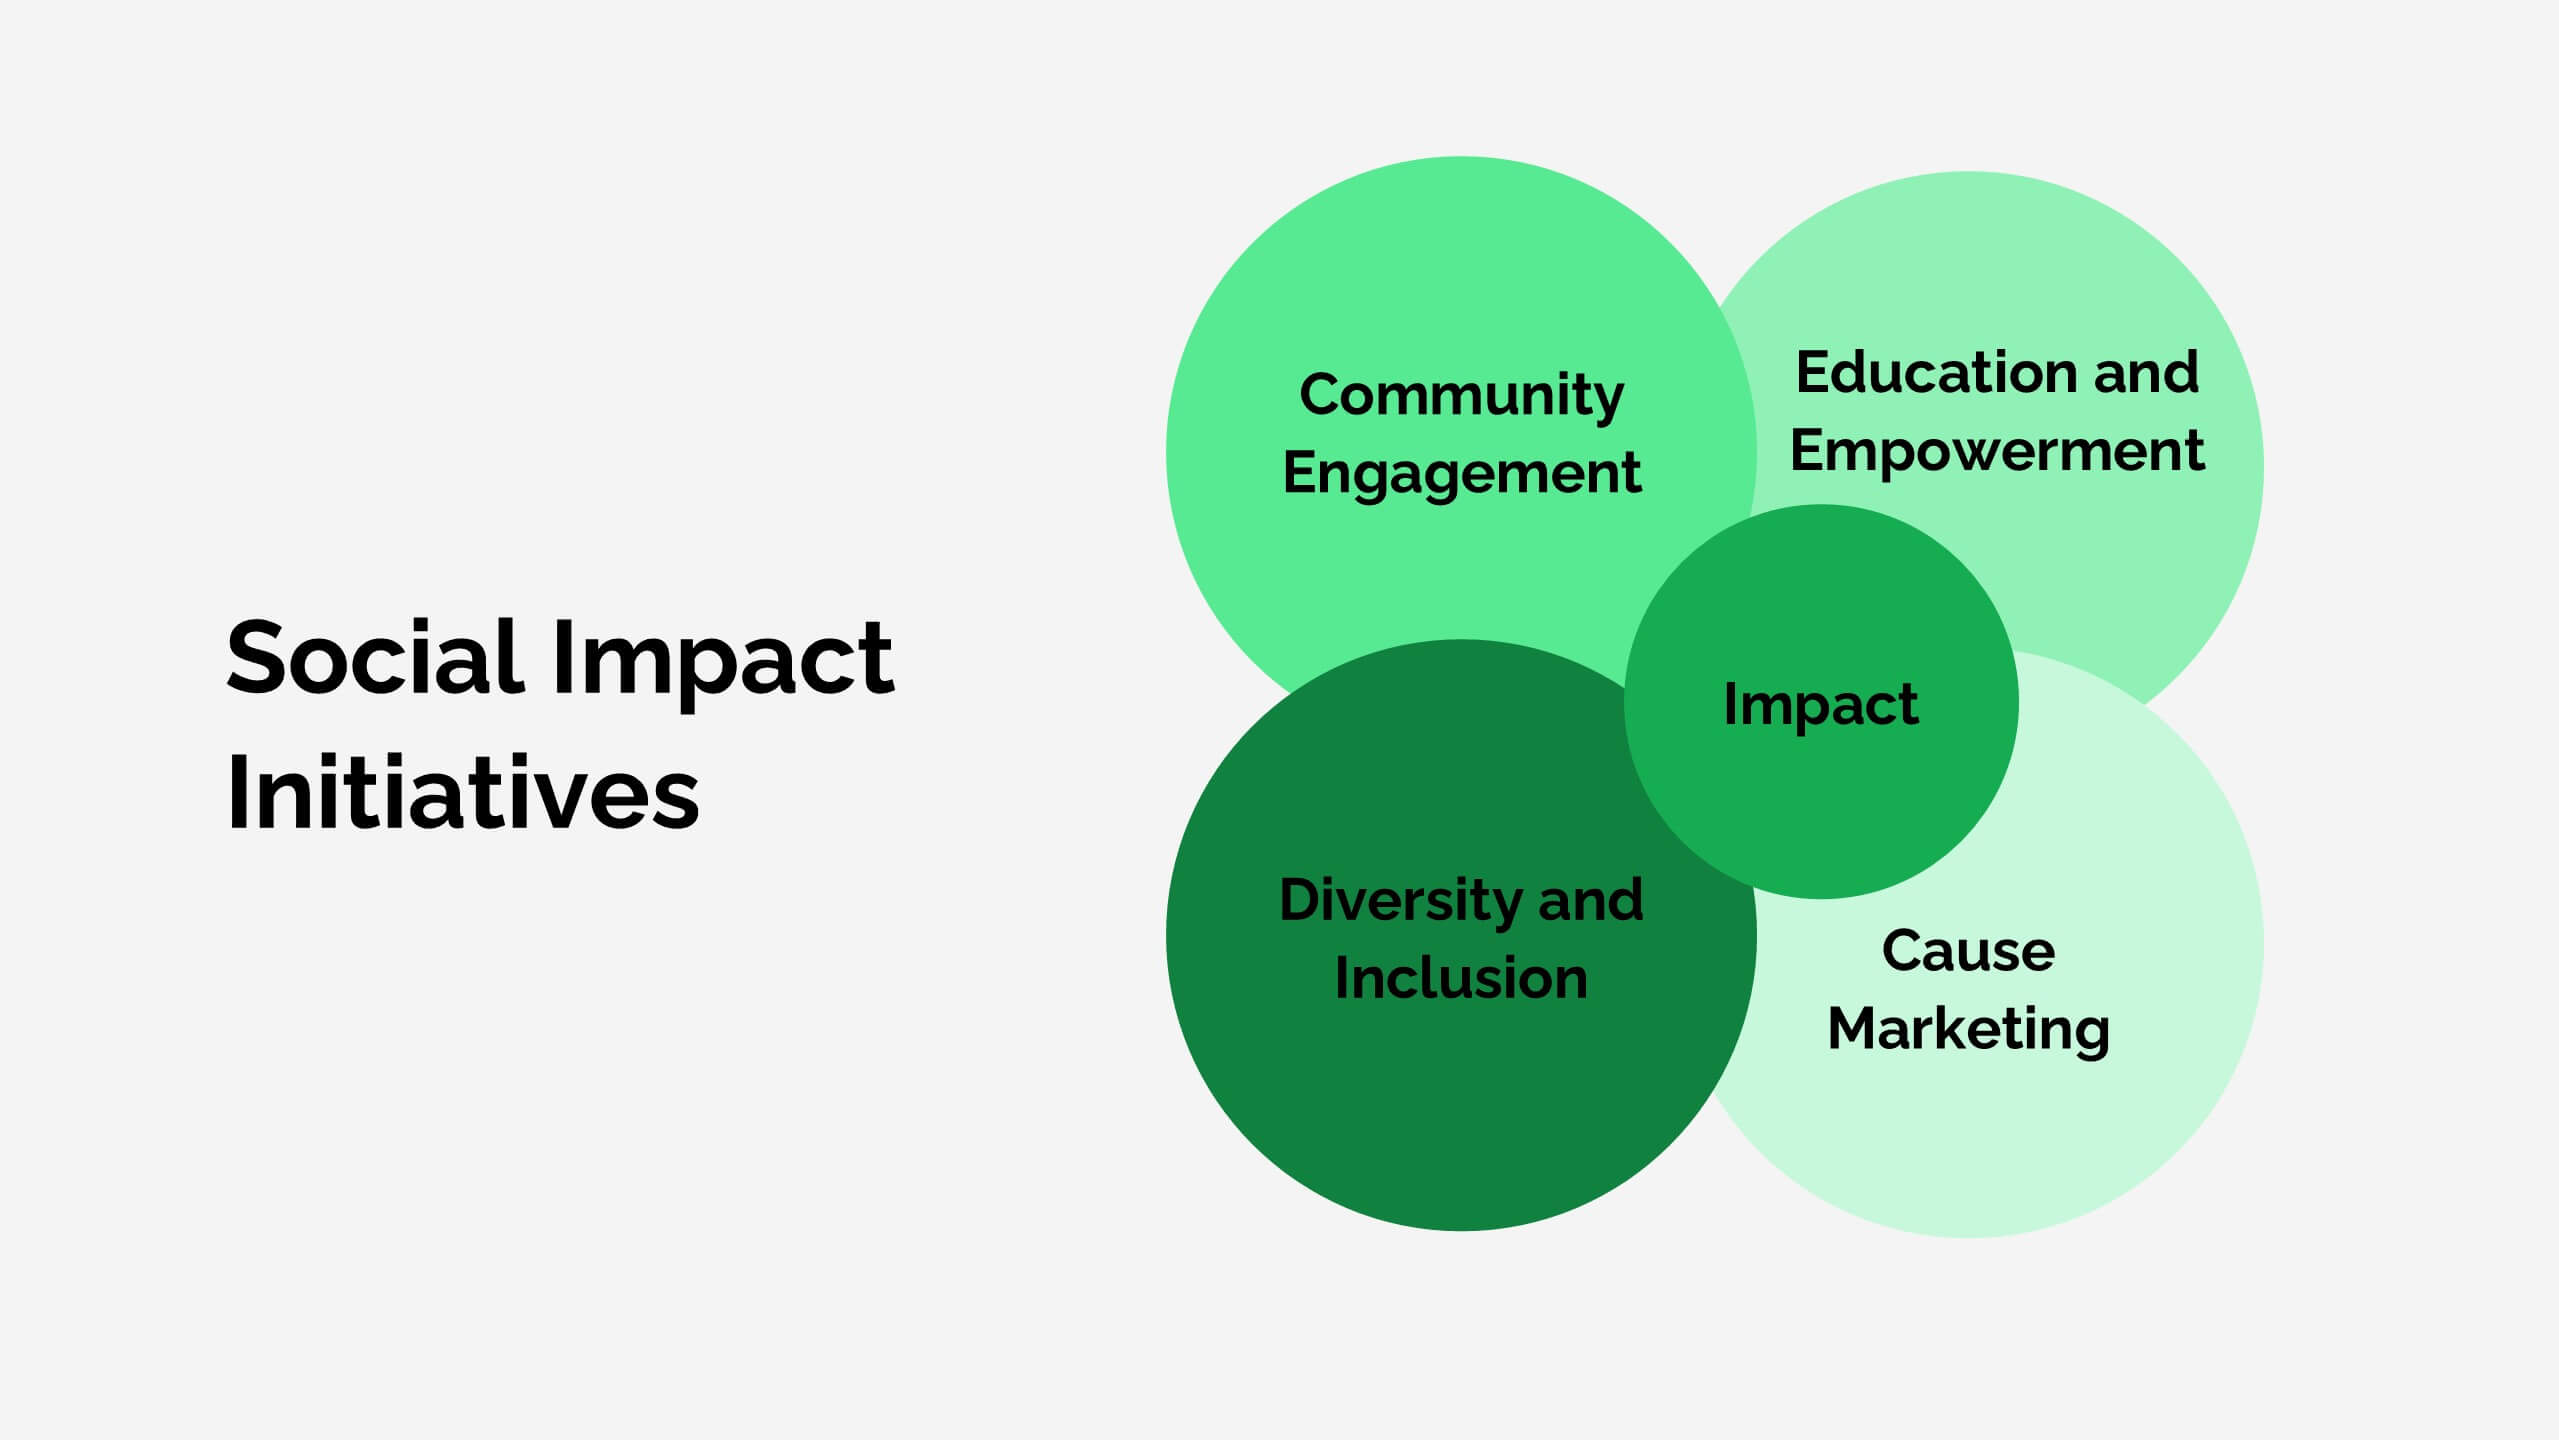
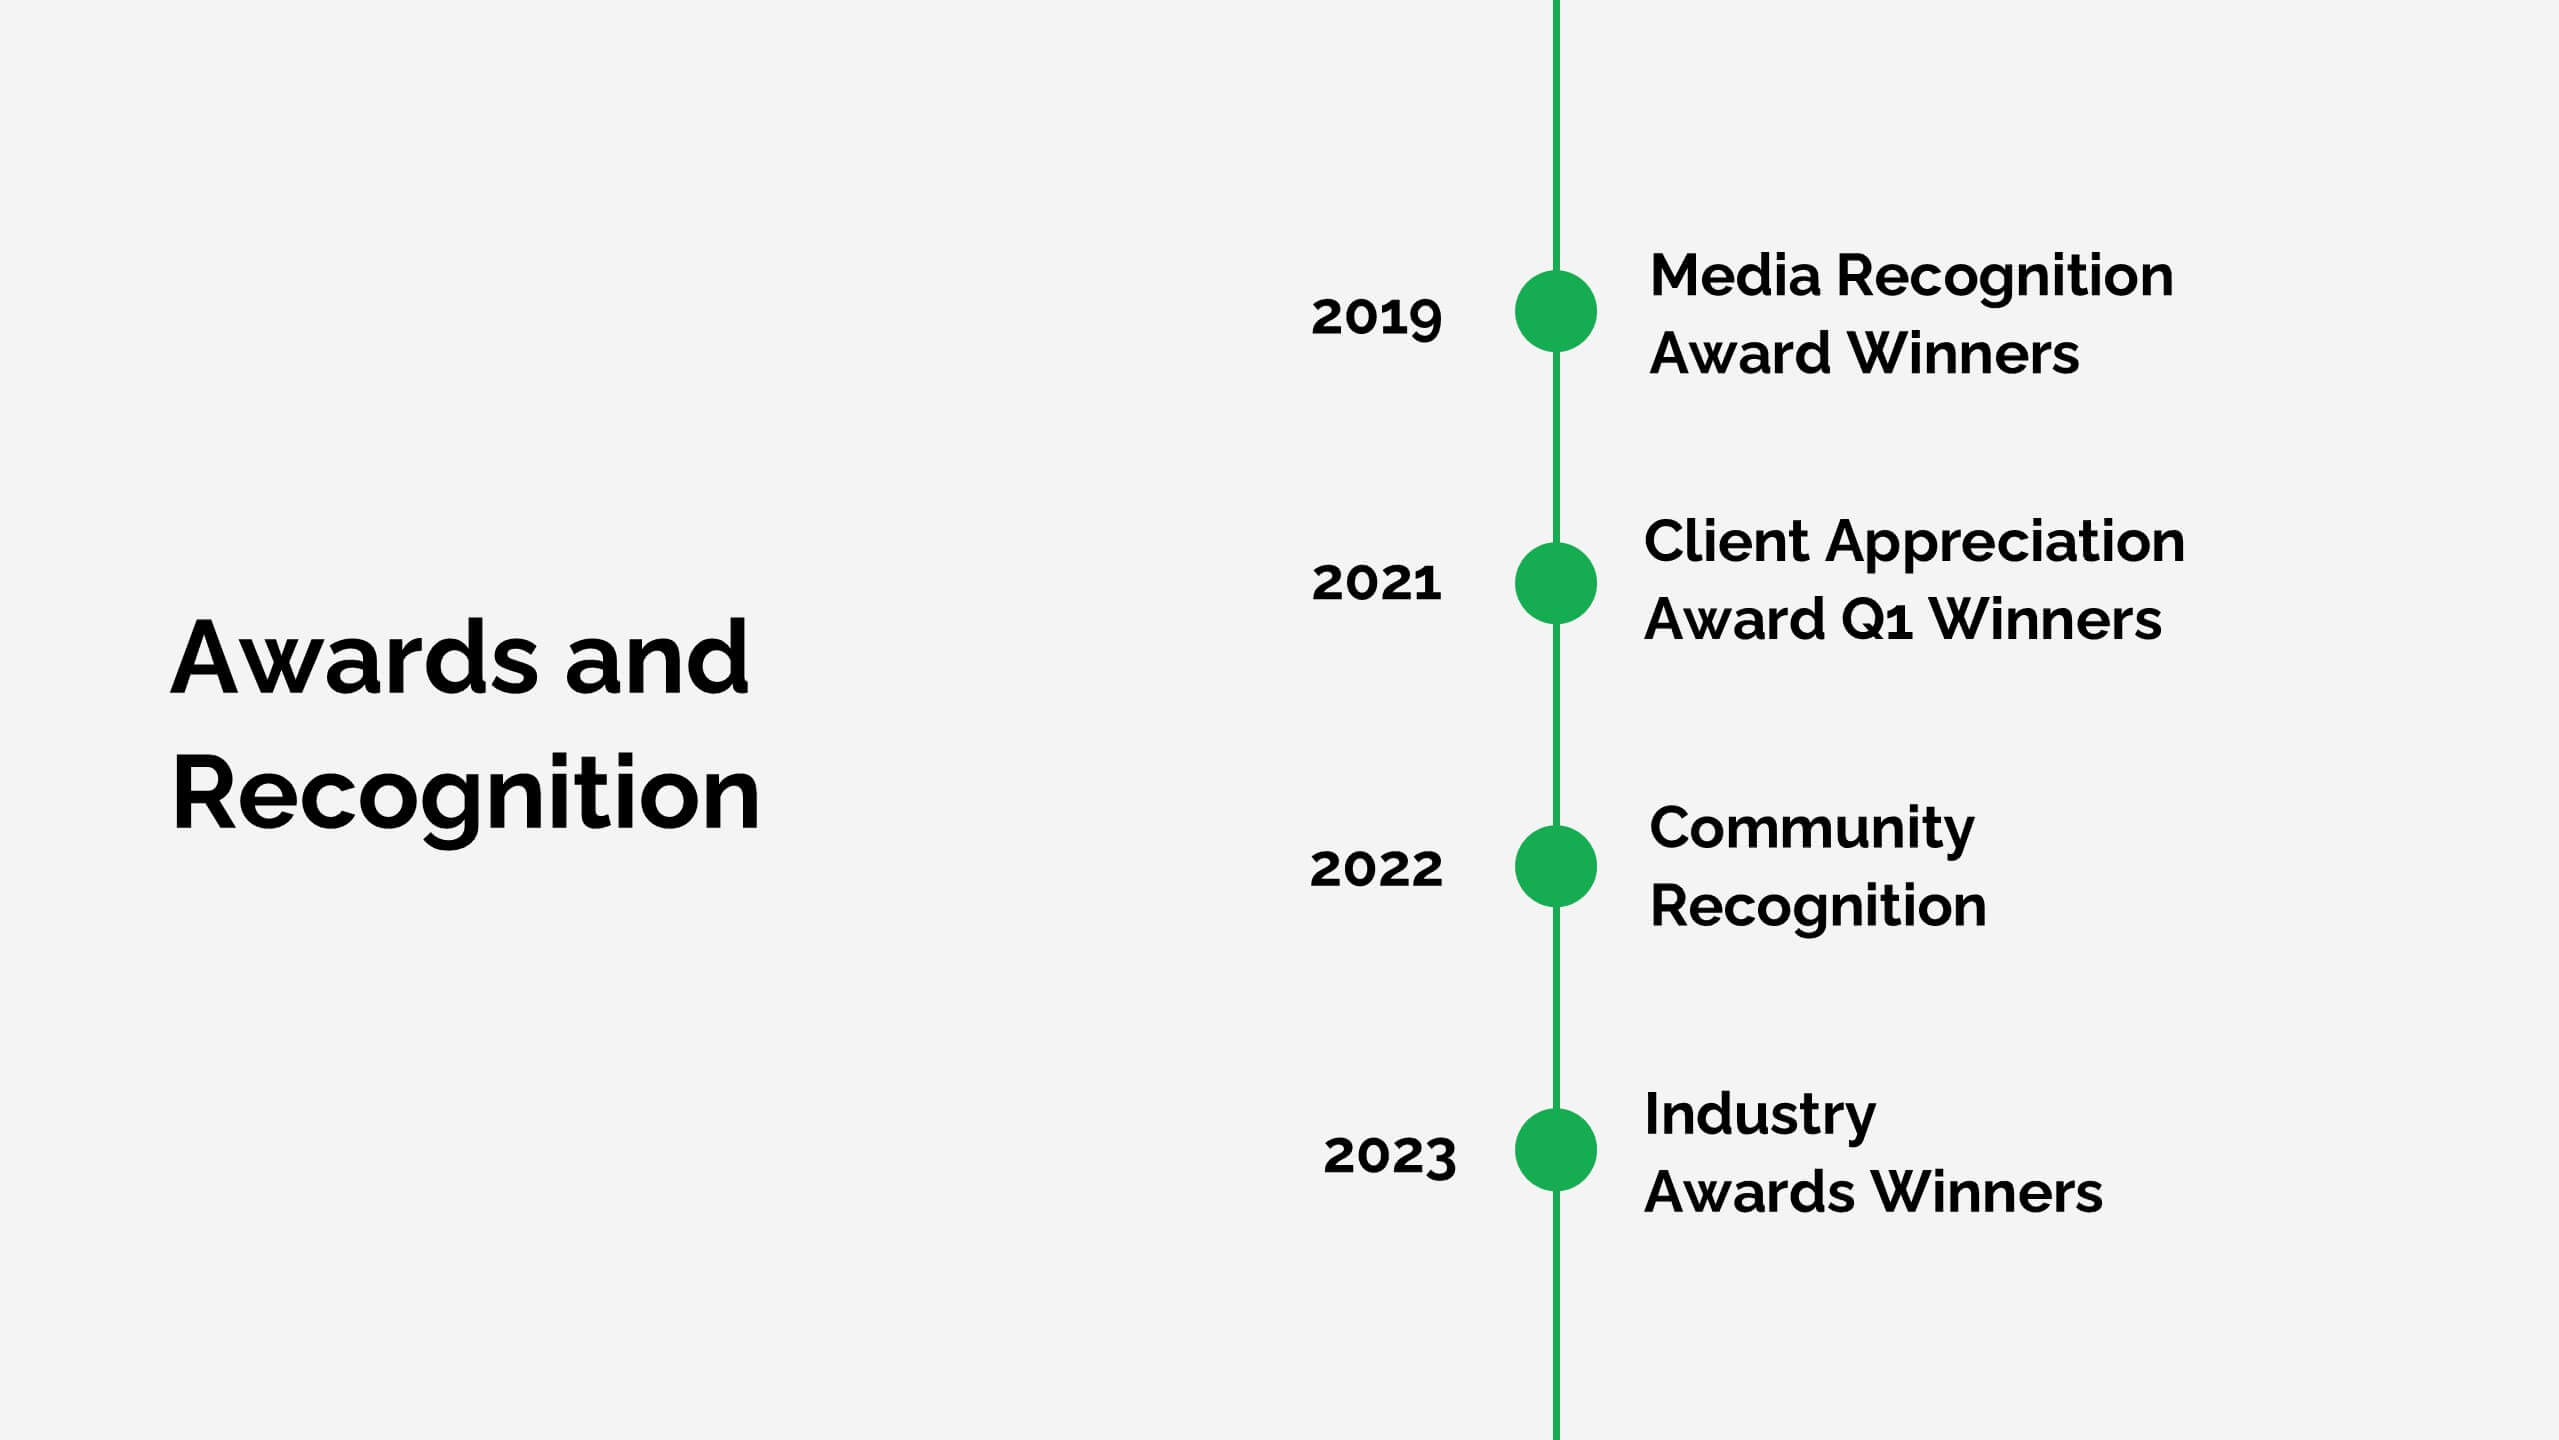
Achieving Career Success Presentation
Achieve your professional goals with the Achieving Career Success Presentation template. Designed for career coaches, professionals, and personal development strategists, this slide deck helps outline key milestones, success strategies, and growth trajectories in a visually compelling way. With a sleek, modern layout and clear step-by-step structure, this template is fully customizable and compatible with PowerPoint, Keynote, and Google Slides.


5 diapositivas
4 Steps Travel Itinerary Slide Presentation
Plan every adventure with a slide that makes travel feel effortless and exciting. This presentation helps you map out destinations, activities, and budgets in four clear, intuitive steps—perfect for trip planning or presenting itinerary options. Designed for smooth customization and fully compatible with PowerPoint, Keynote, and Google Slides.


5 diapositivas
Western Europe Political Map Slide Presentation
Showcase political insights and regional data with a clear, modern map design that highlights countries across Western Europe. Perfect for comparing demographics, election data, or market performance, this layout combines clarity with visual impact. Fully compatible with PowerPoint, Keynote, and Google Slides for easy customization and professional presentations.


5 diapositivas
Employee Training Roadmap Presentation
Take your team on a visual journey that maps out success, one milestone at a time. This roadmap presentation is perfect for outlining employee training stages in a clear, engaging way. Each point leads naturally to the next. Fully editable and compatible with PowerPoint, Keynote, and Google Slides for seamless use.


8 diapositivas
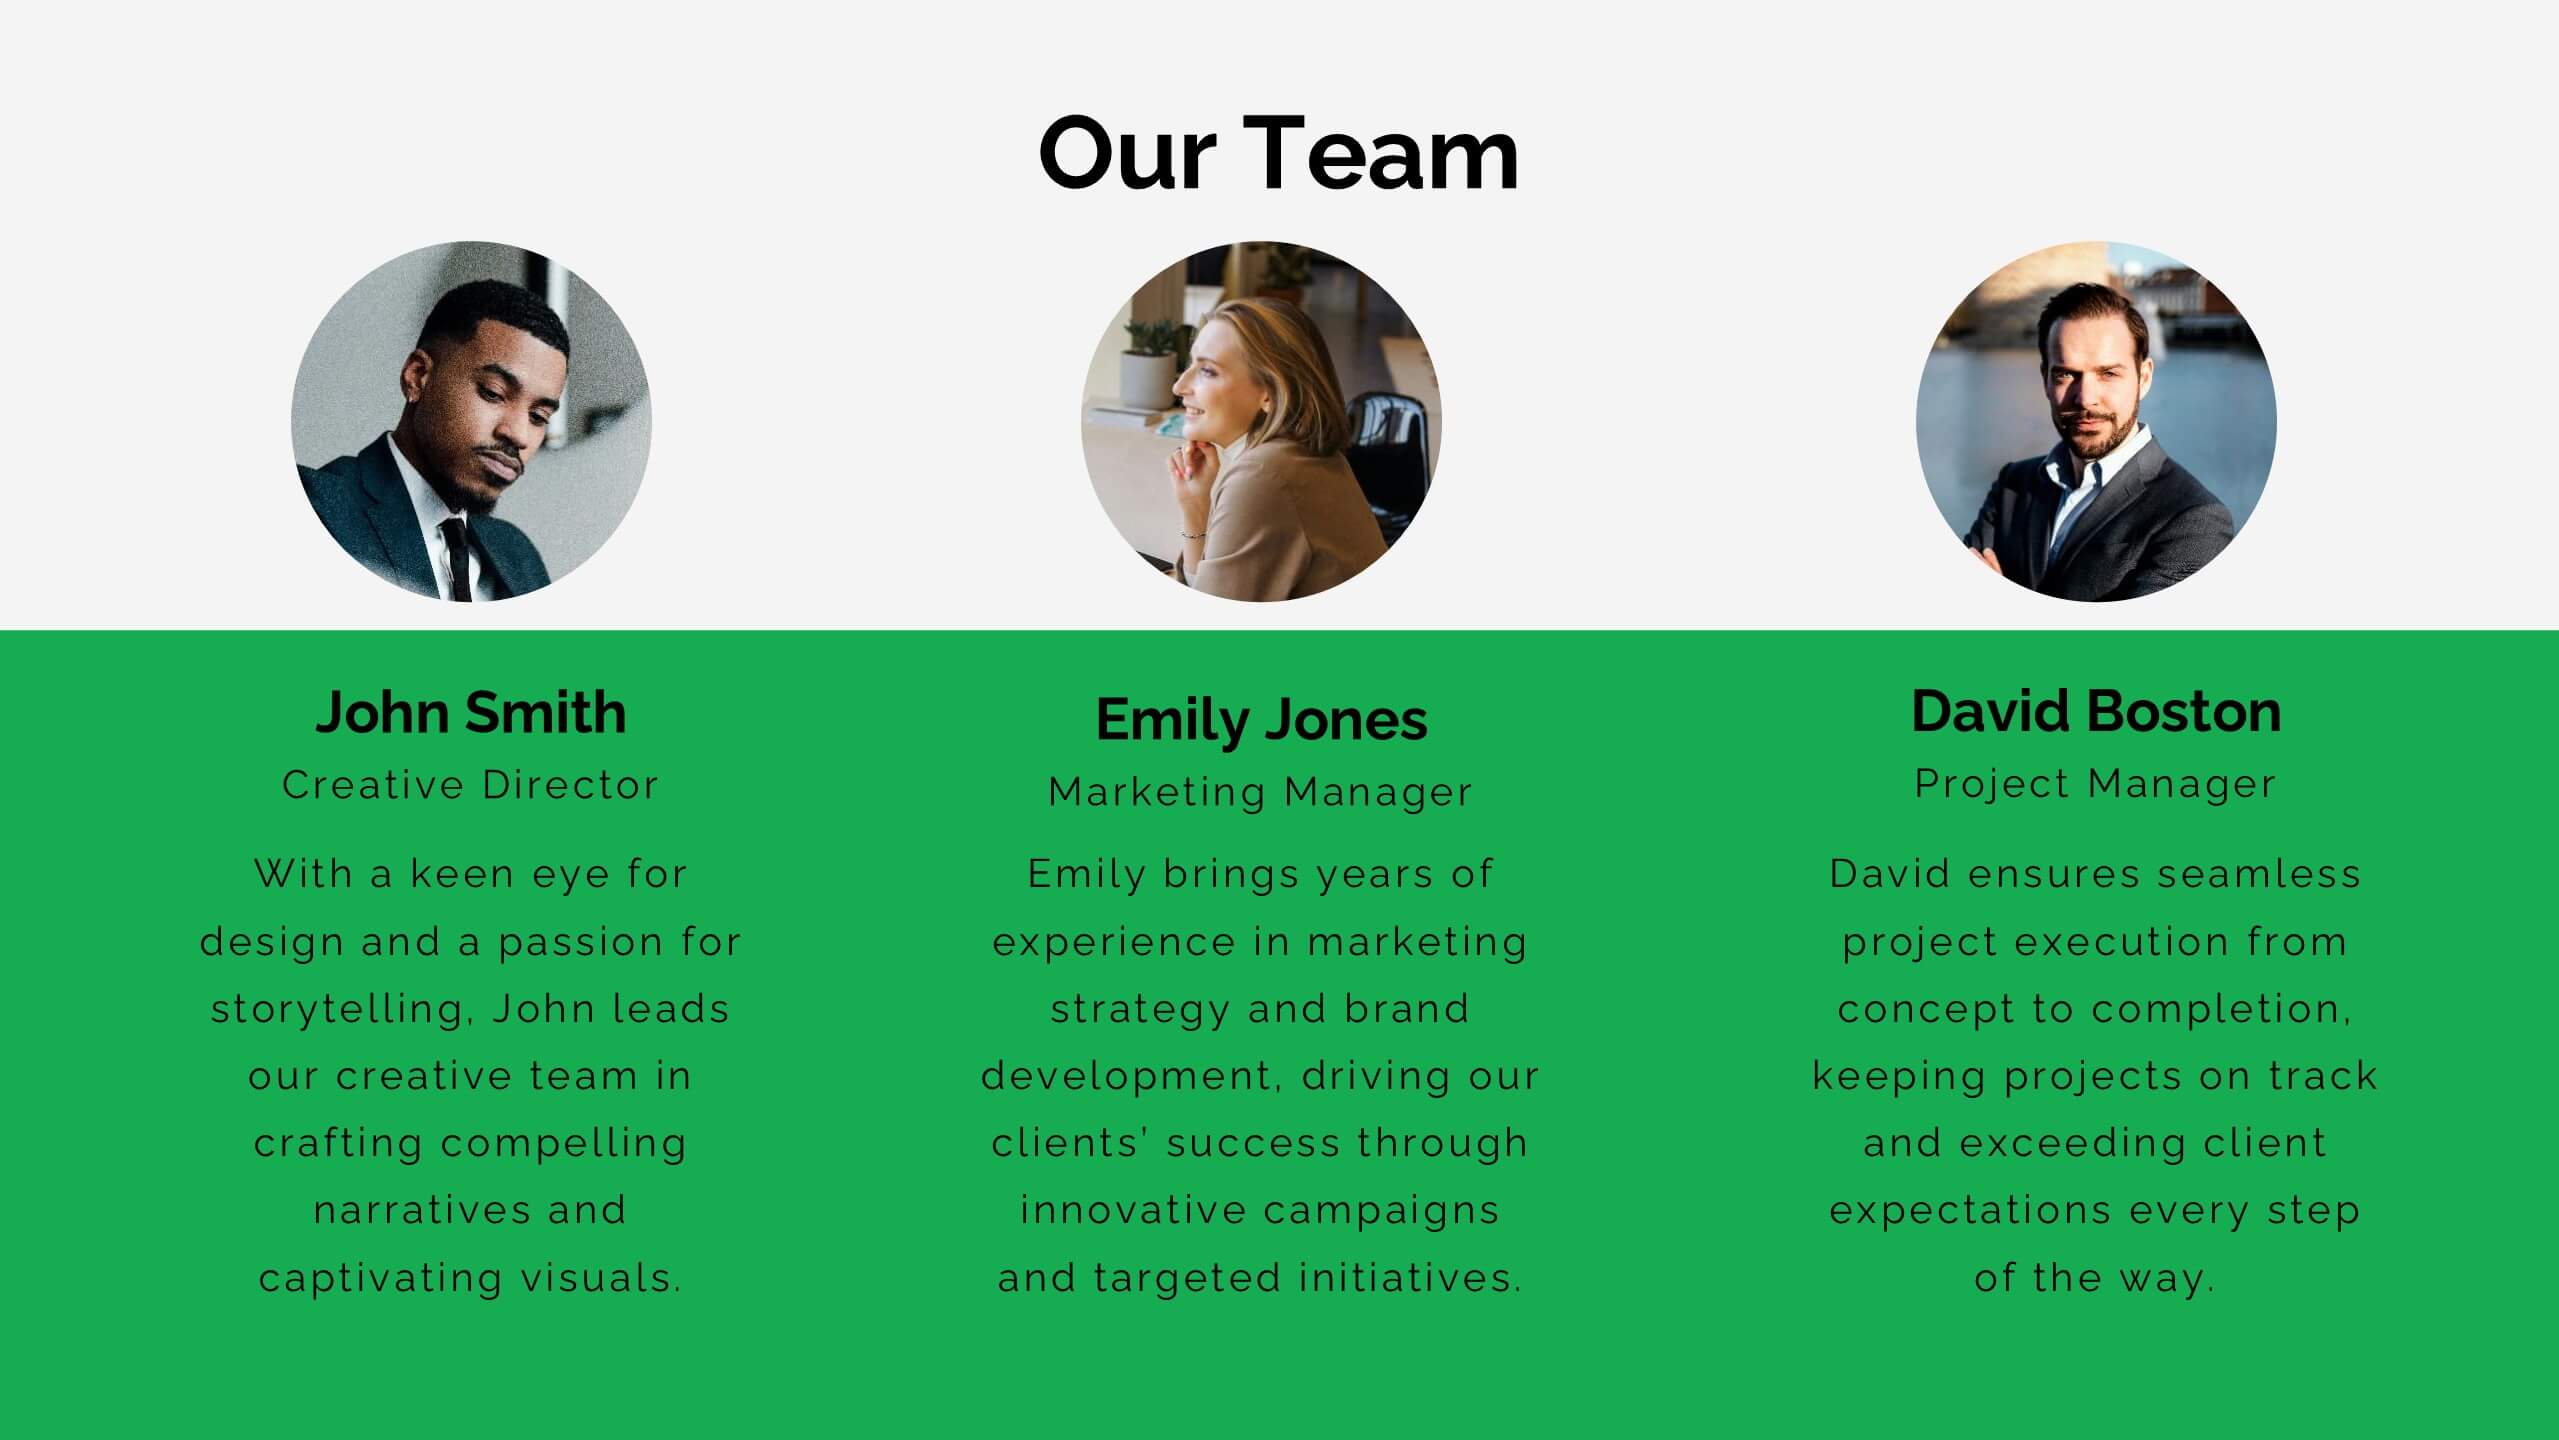
Meet the Team Presentation
Showcase your team effectively with our "Meet the Team Presentation" template. This sleek design features personalized cards for each team member, displaying their photo, name, and contact details on a visually appealing, color-coded background. Perfect for onboarding, company introductions, or team-building presentations, this template enhances recognition and cohesion. The distinct colors can be used to signify different roles or departments, making it easy to identify team dynamics at a glance. Compatible with PowerPoint, Keynote, and Google Slides, it’s an essential tool for any organization aiming to present their team in a professional and engaging manner.


22 diapositivas
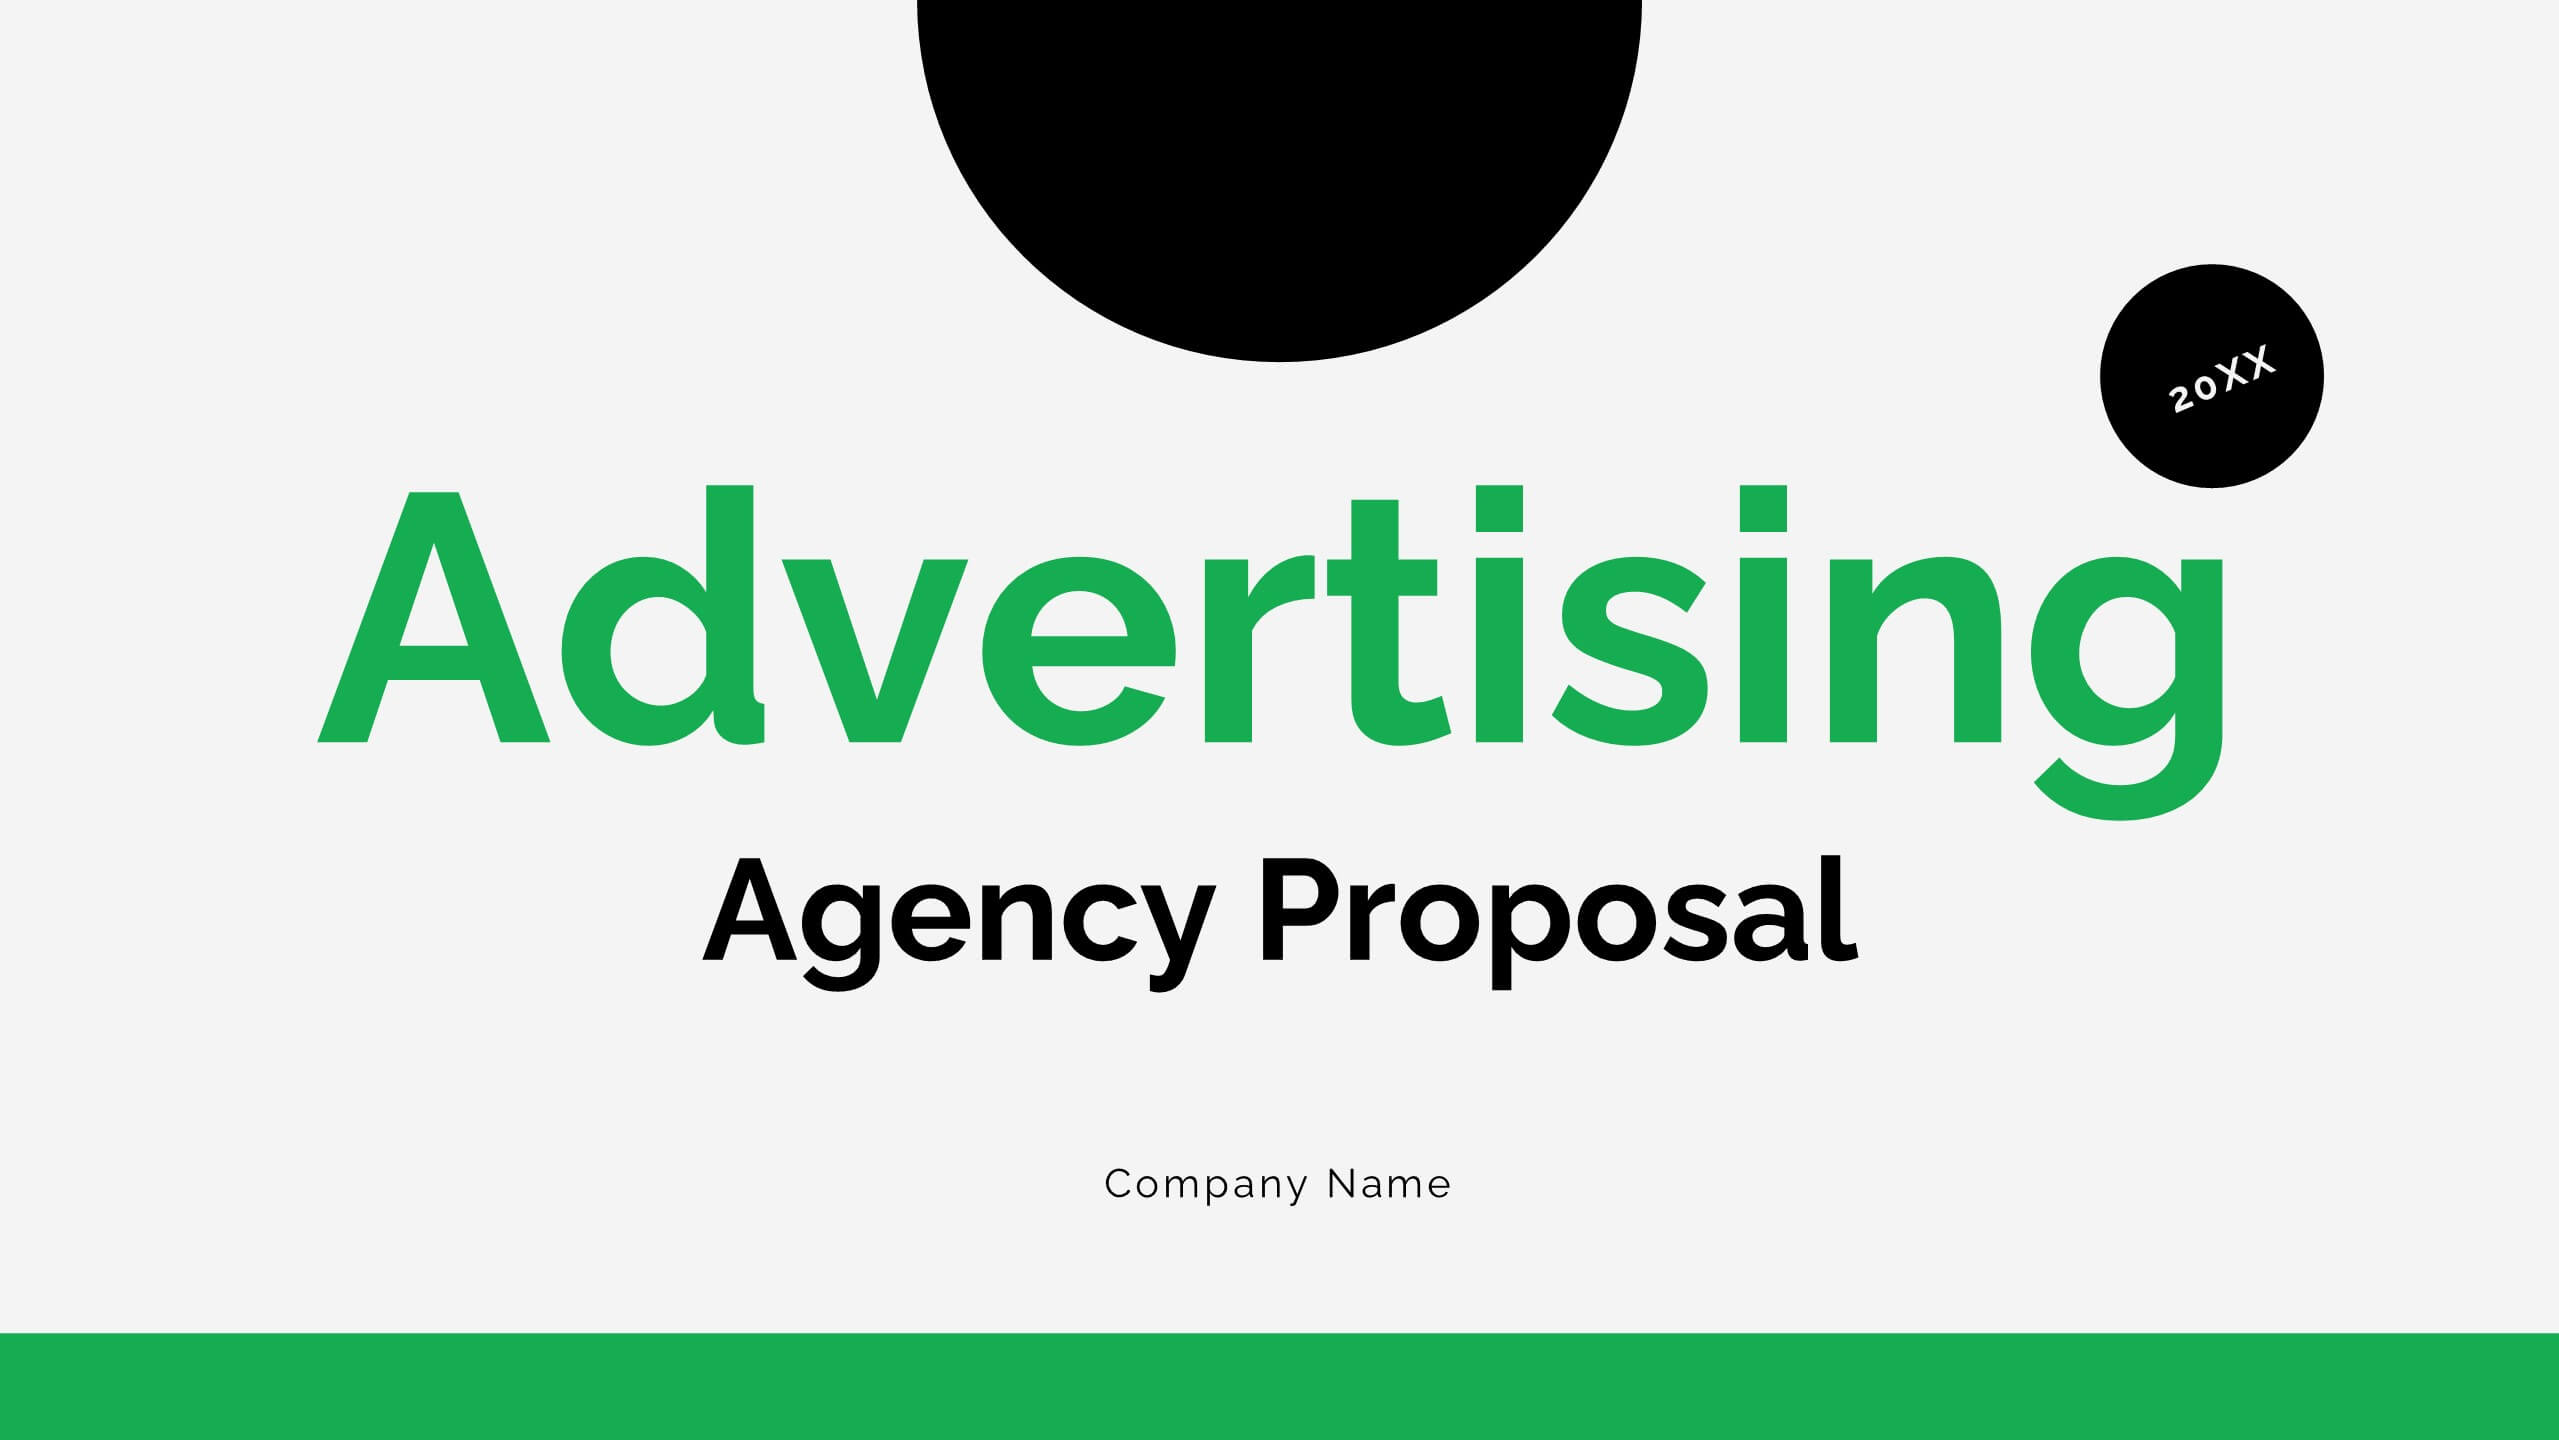
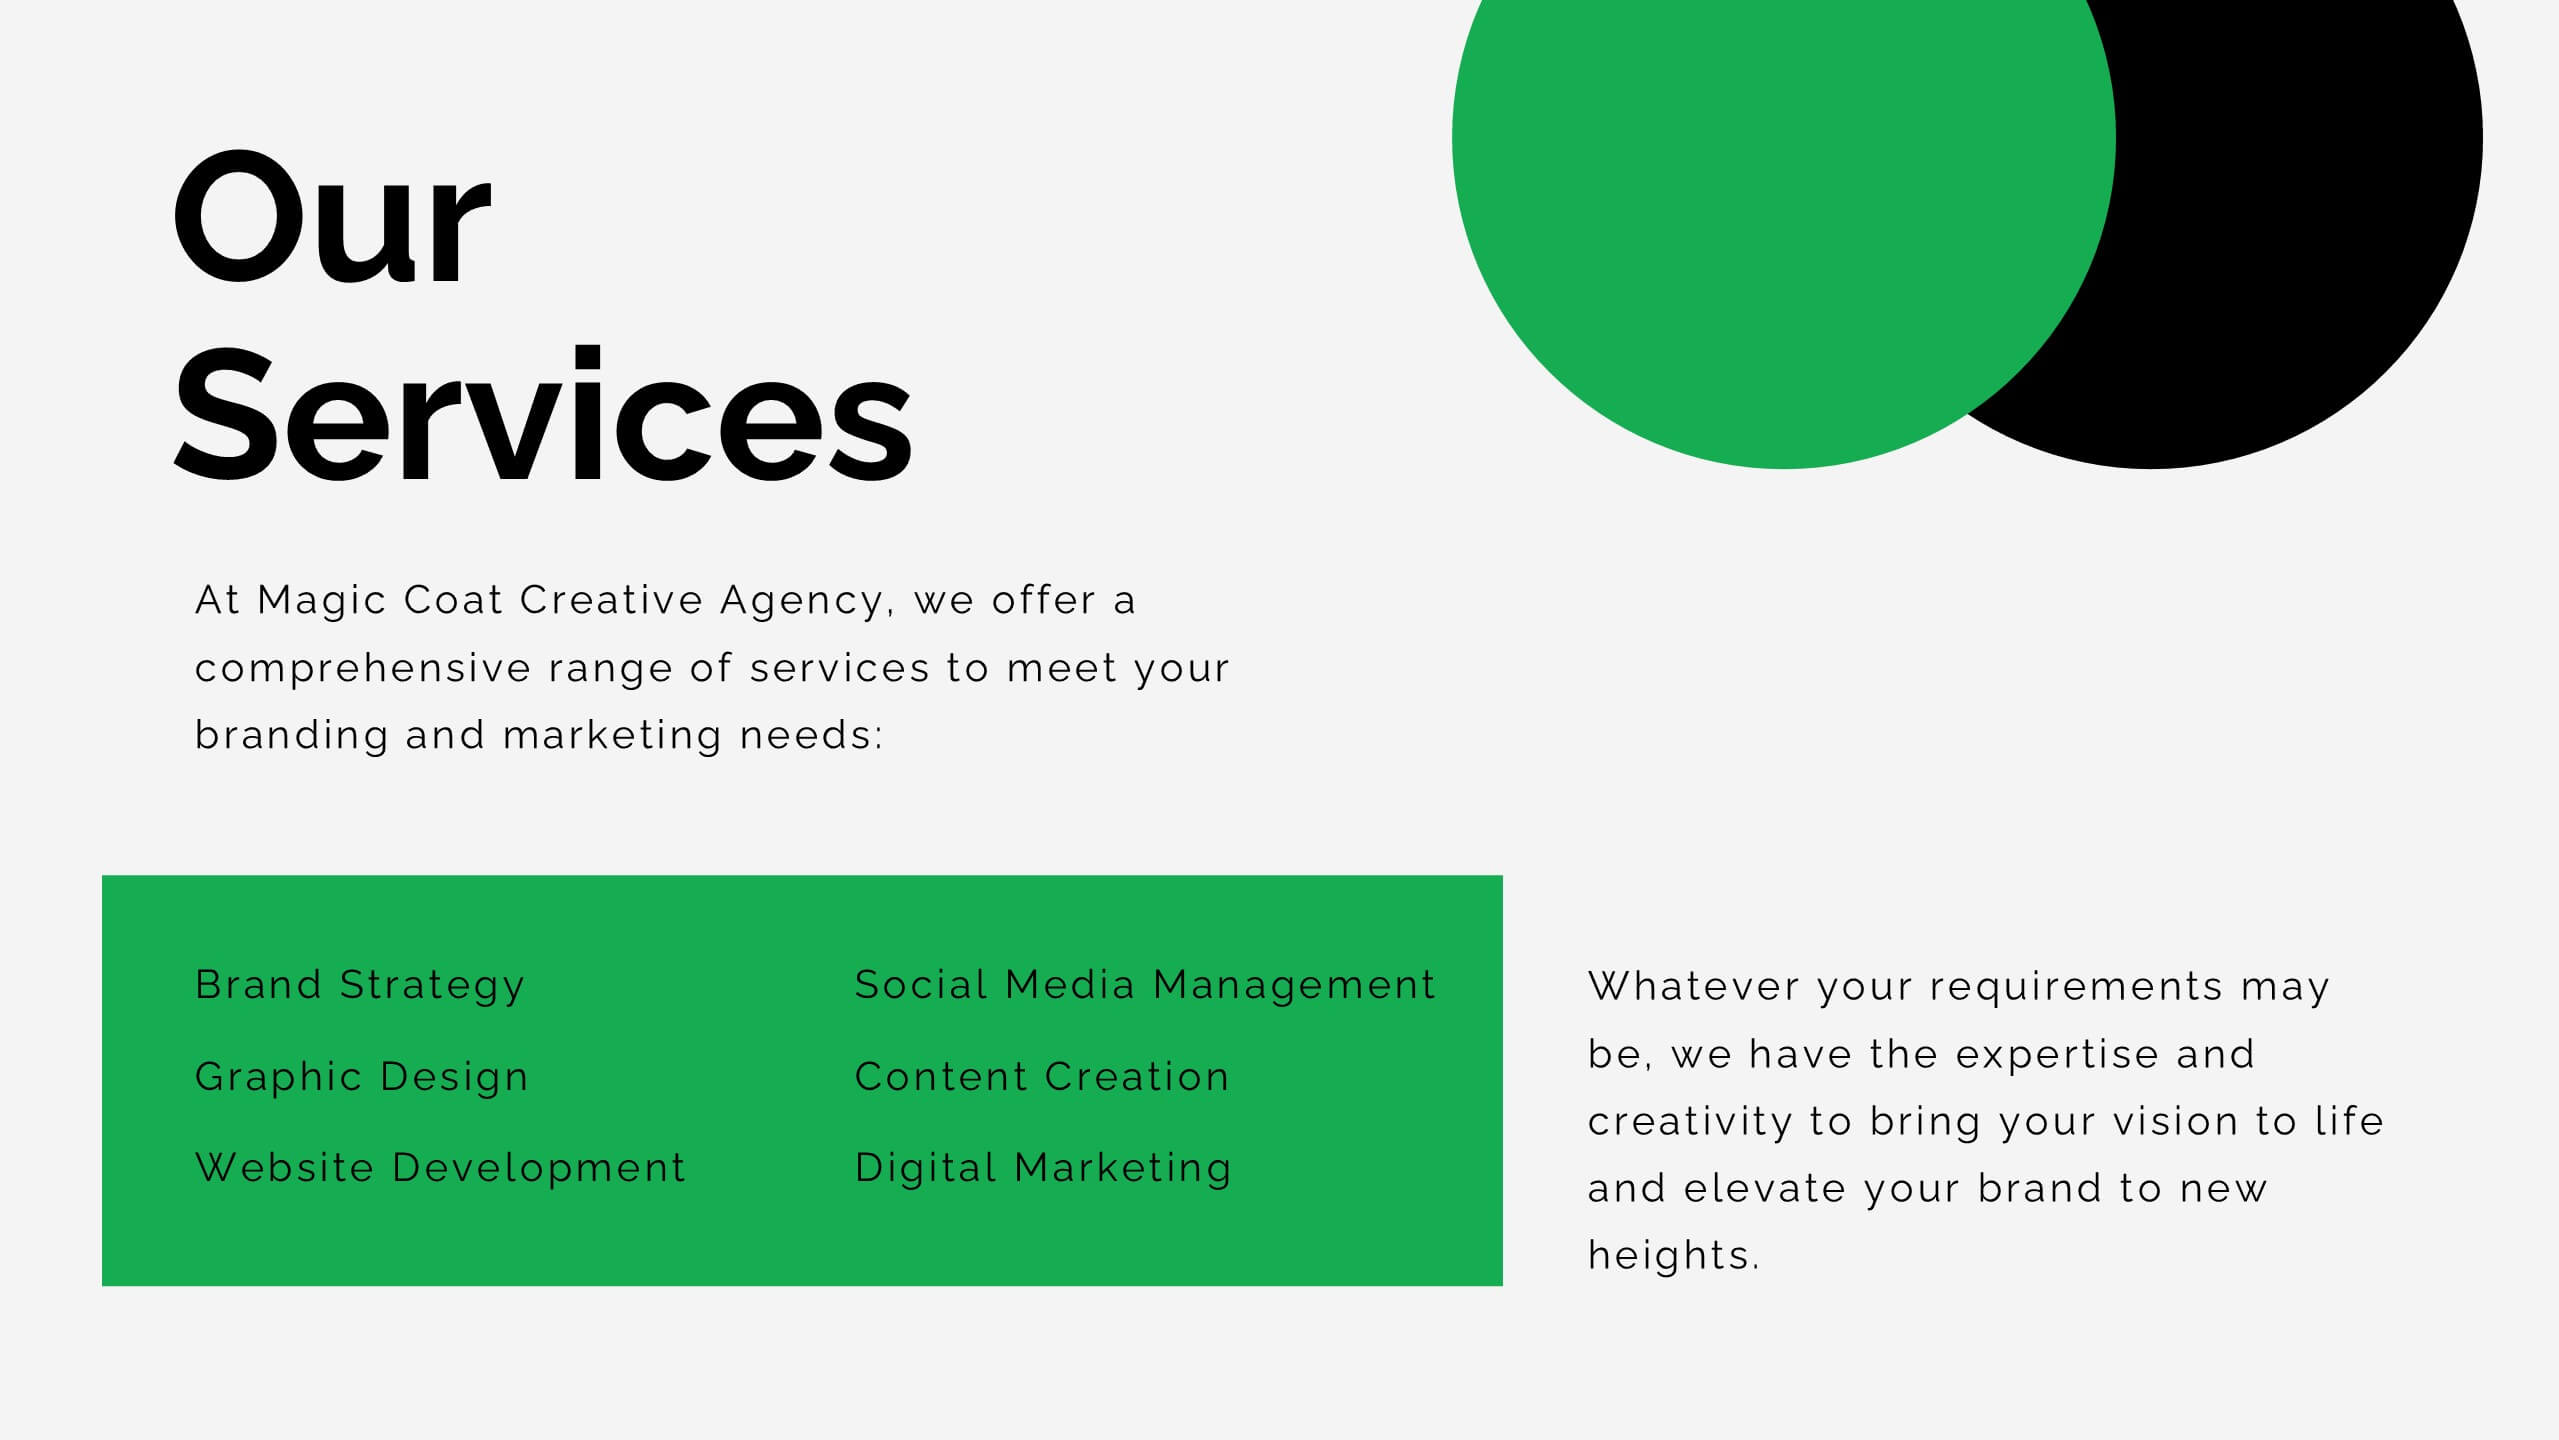
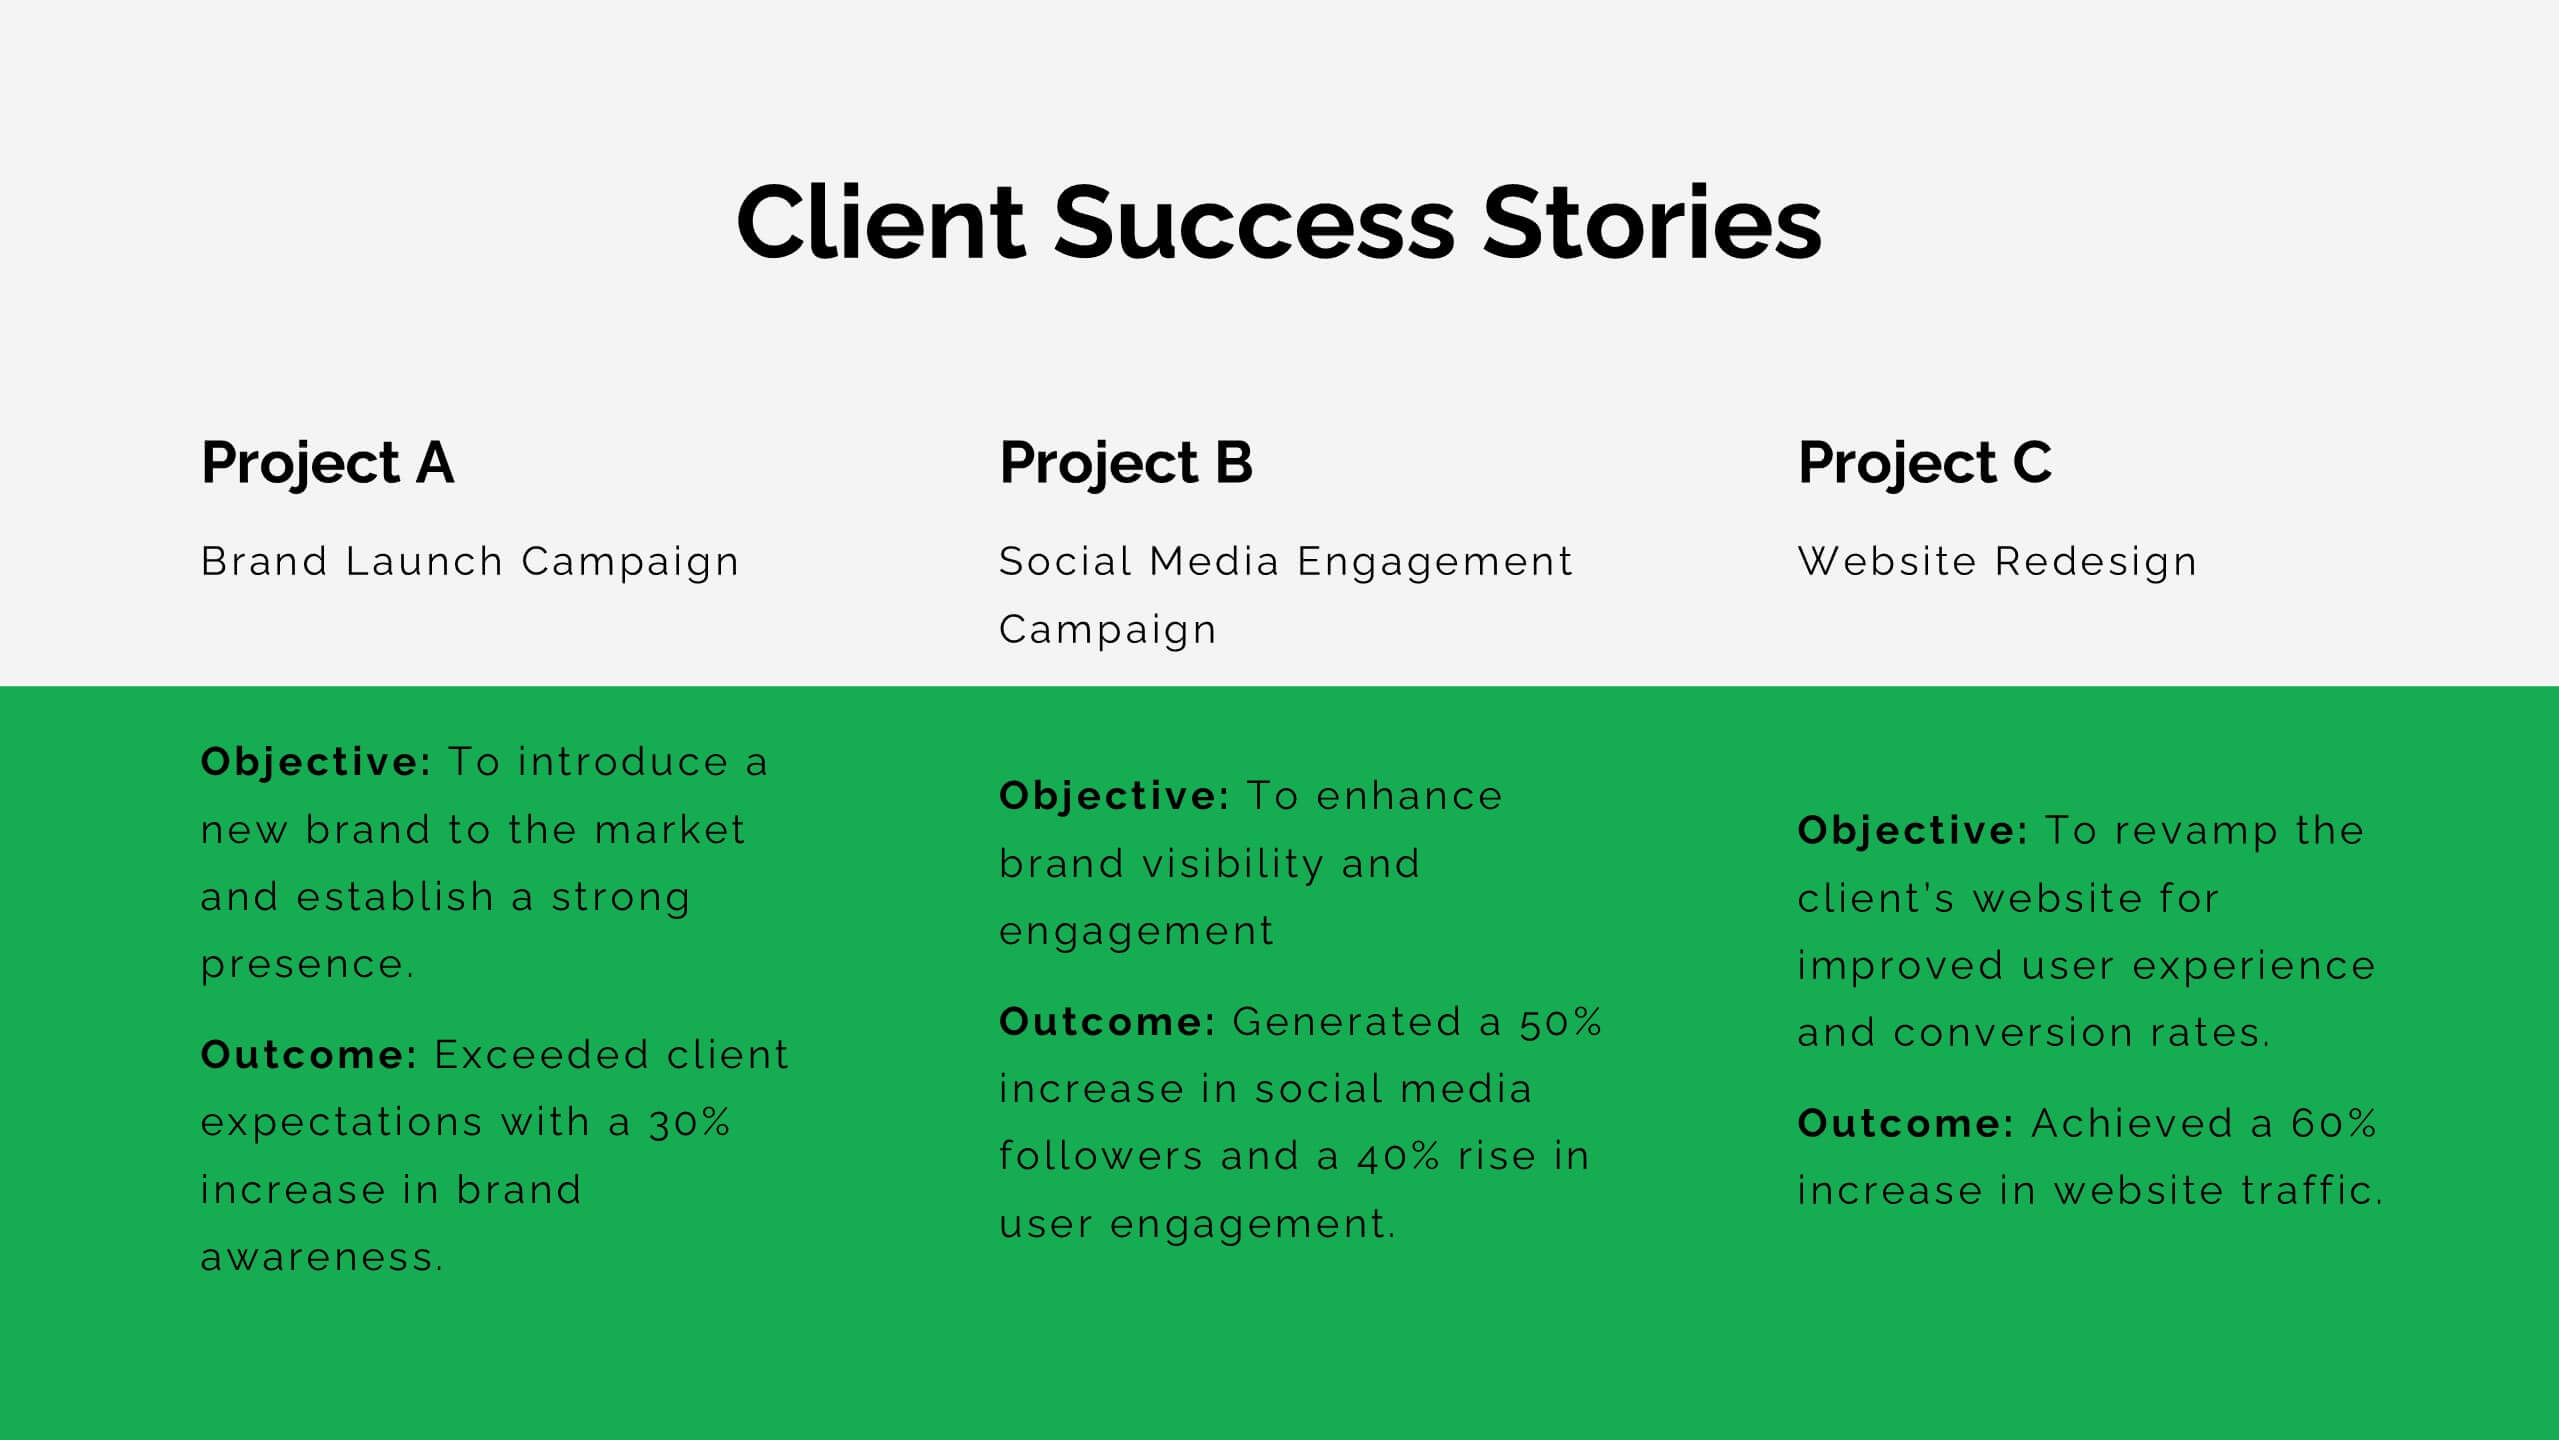
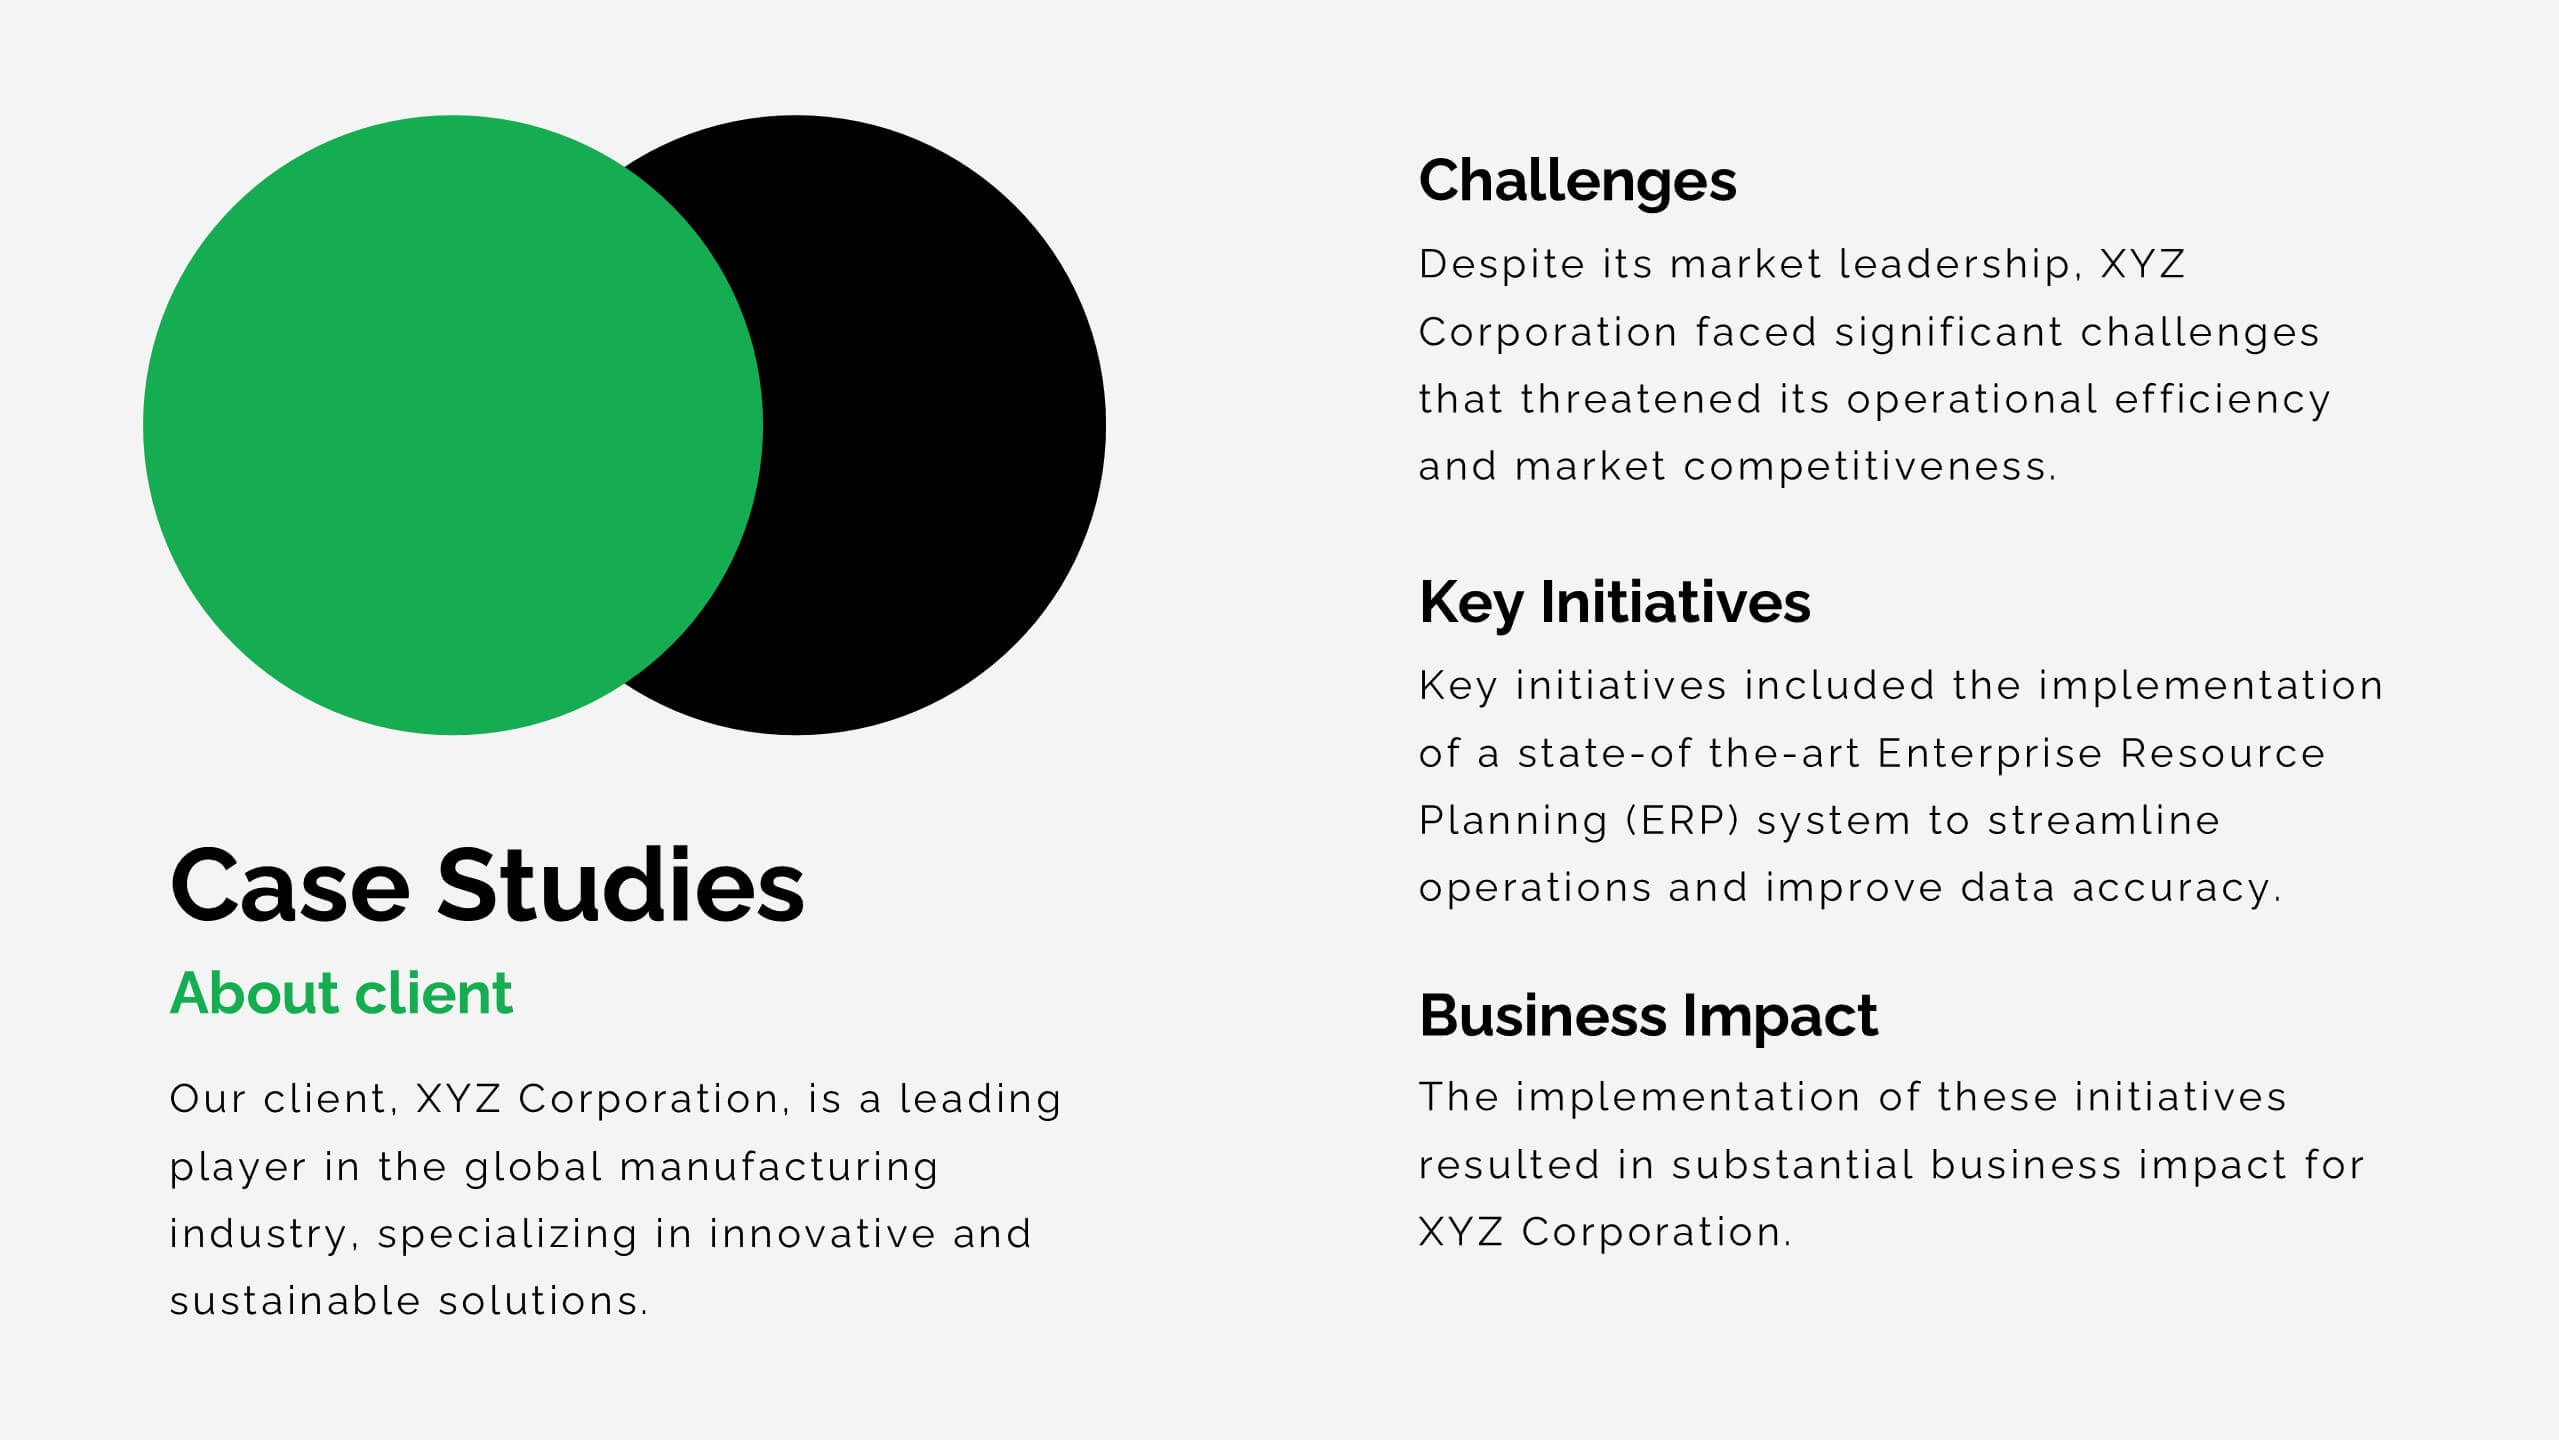
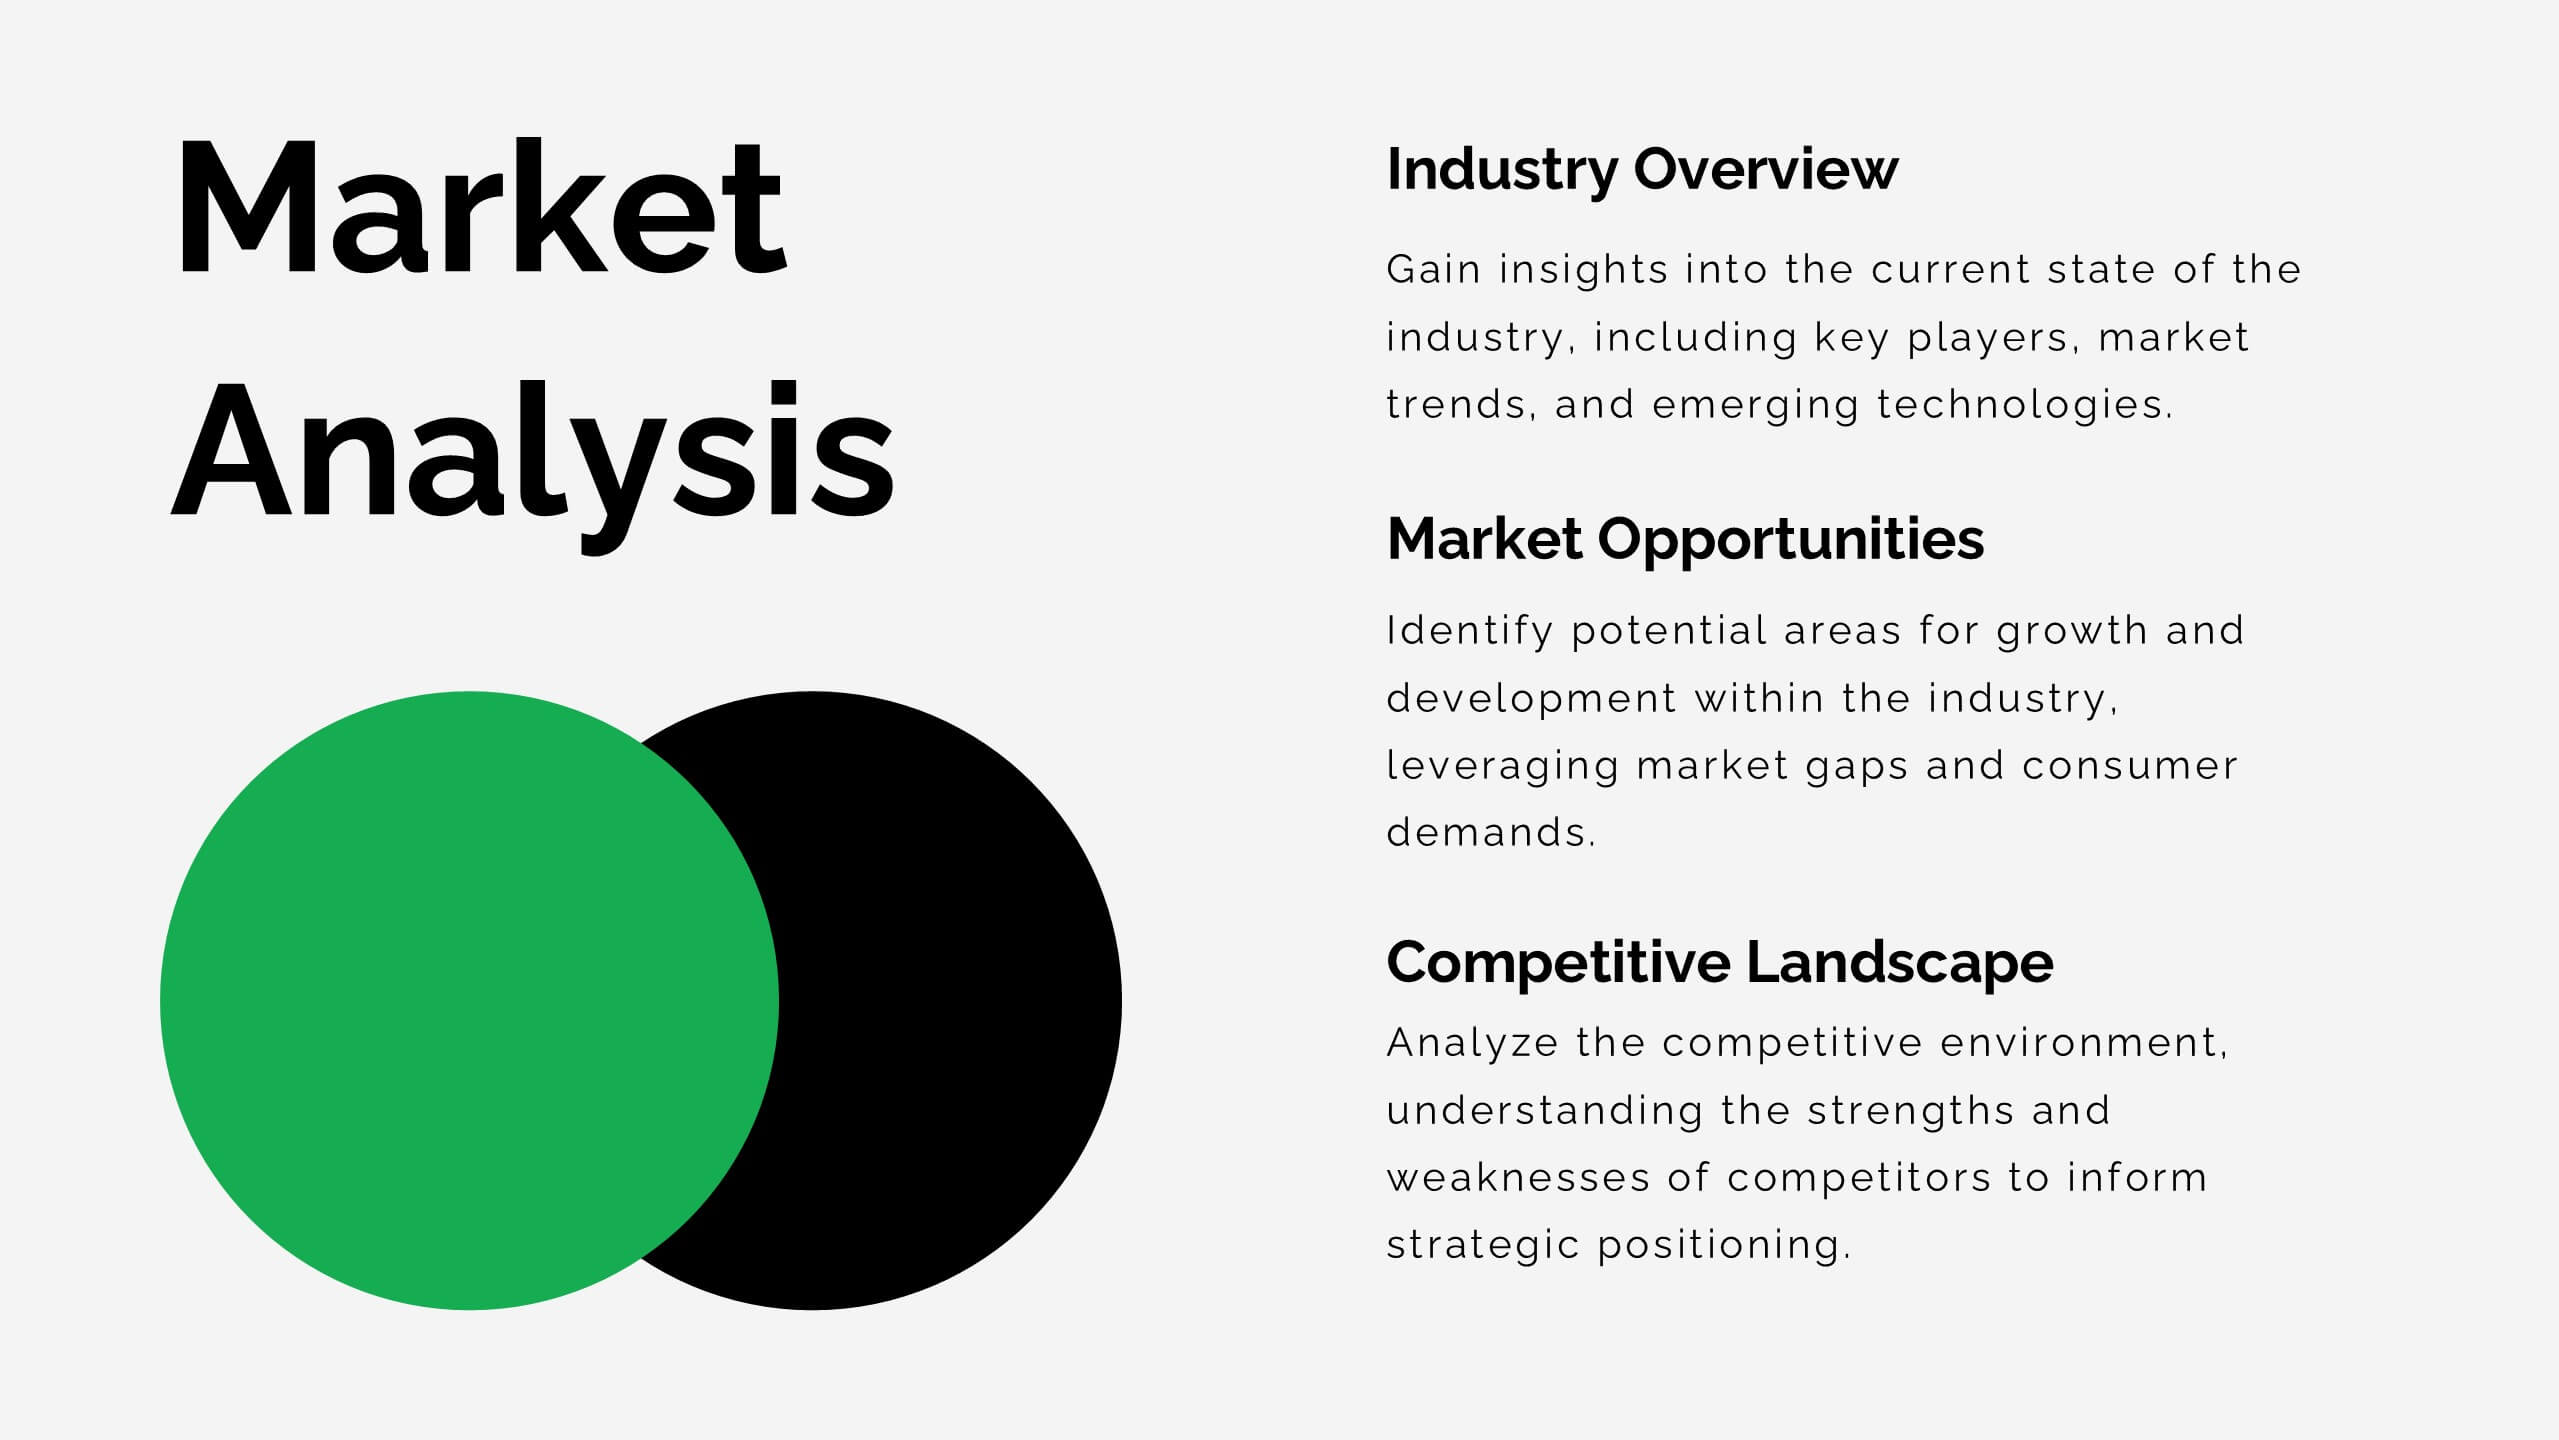
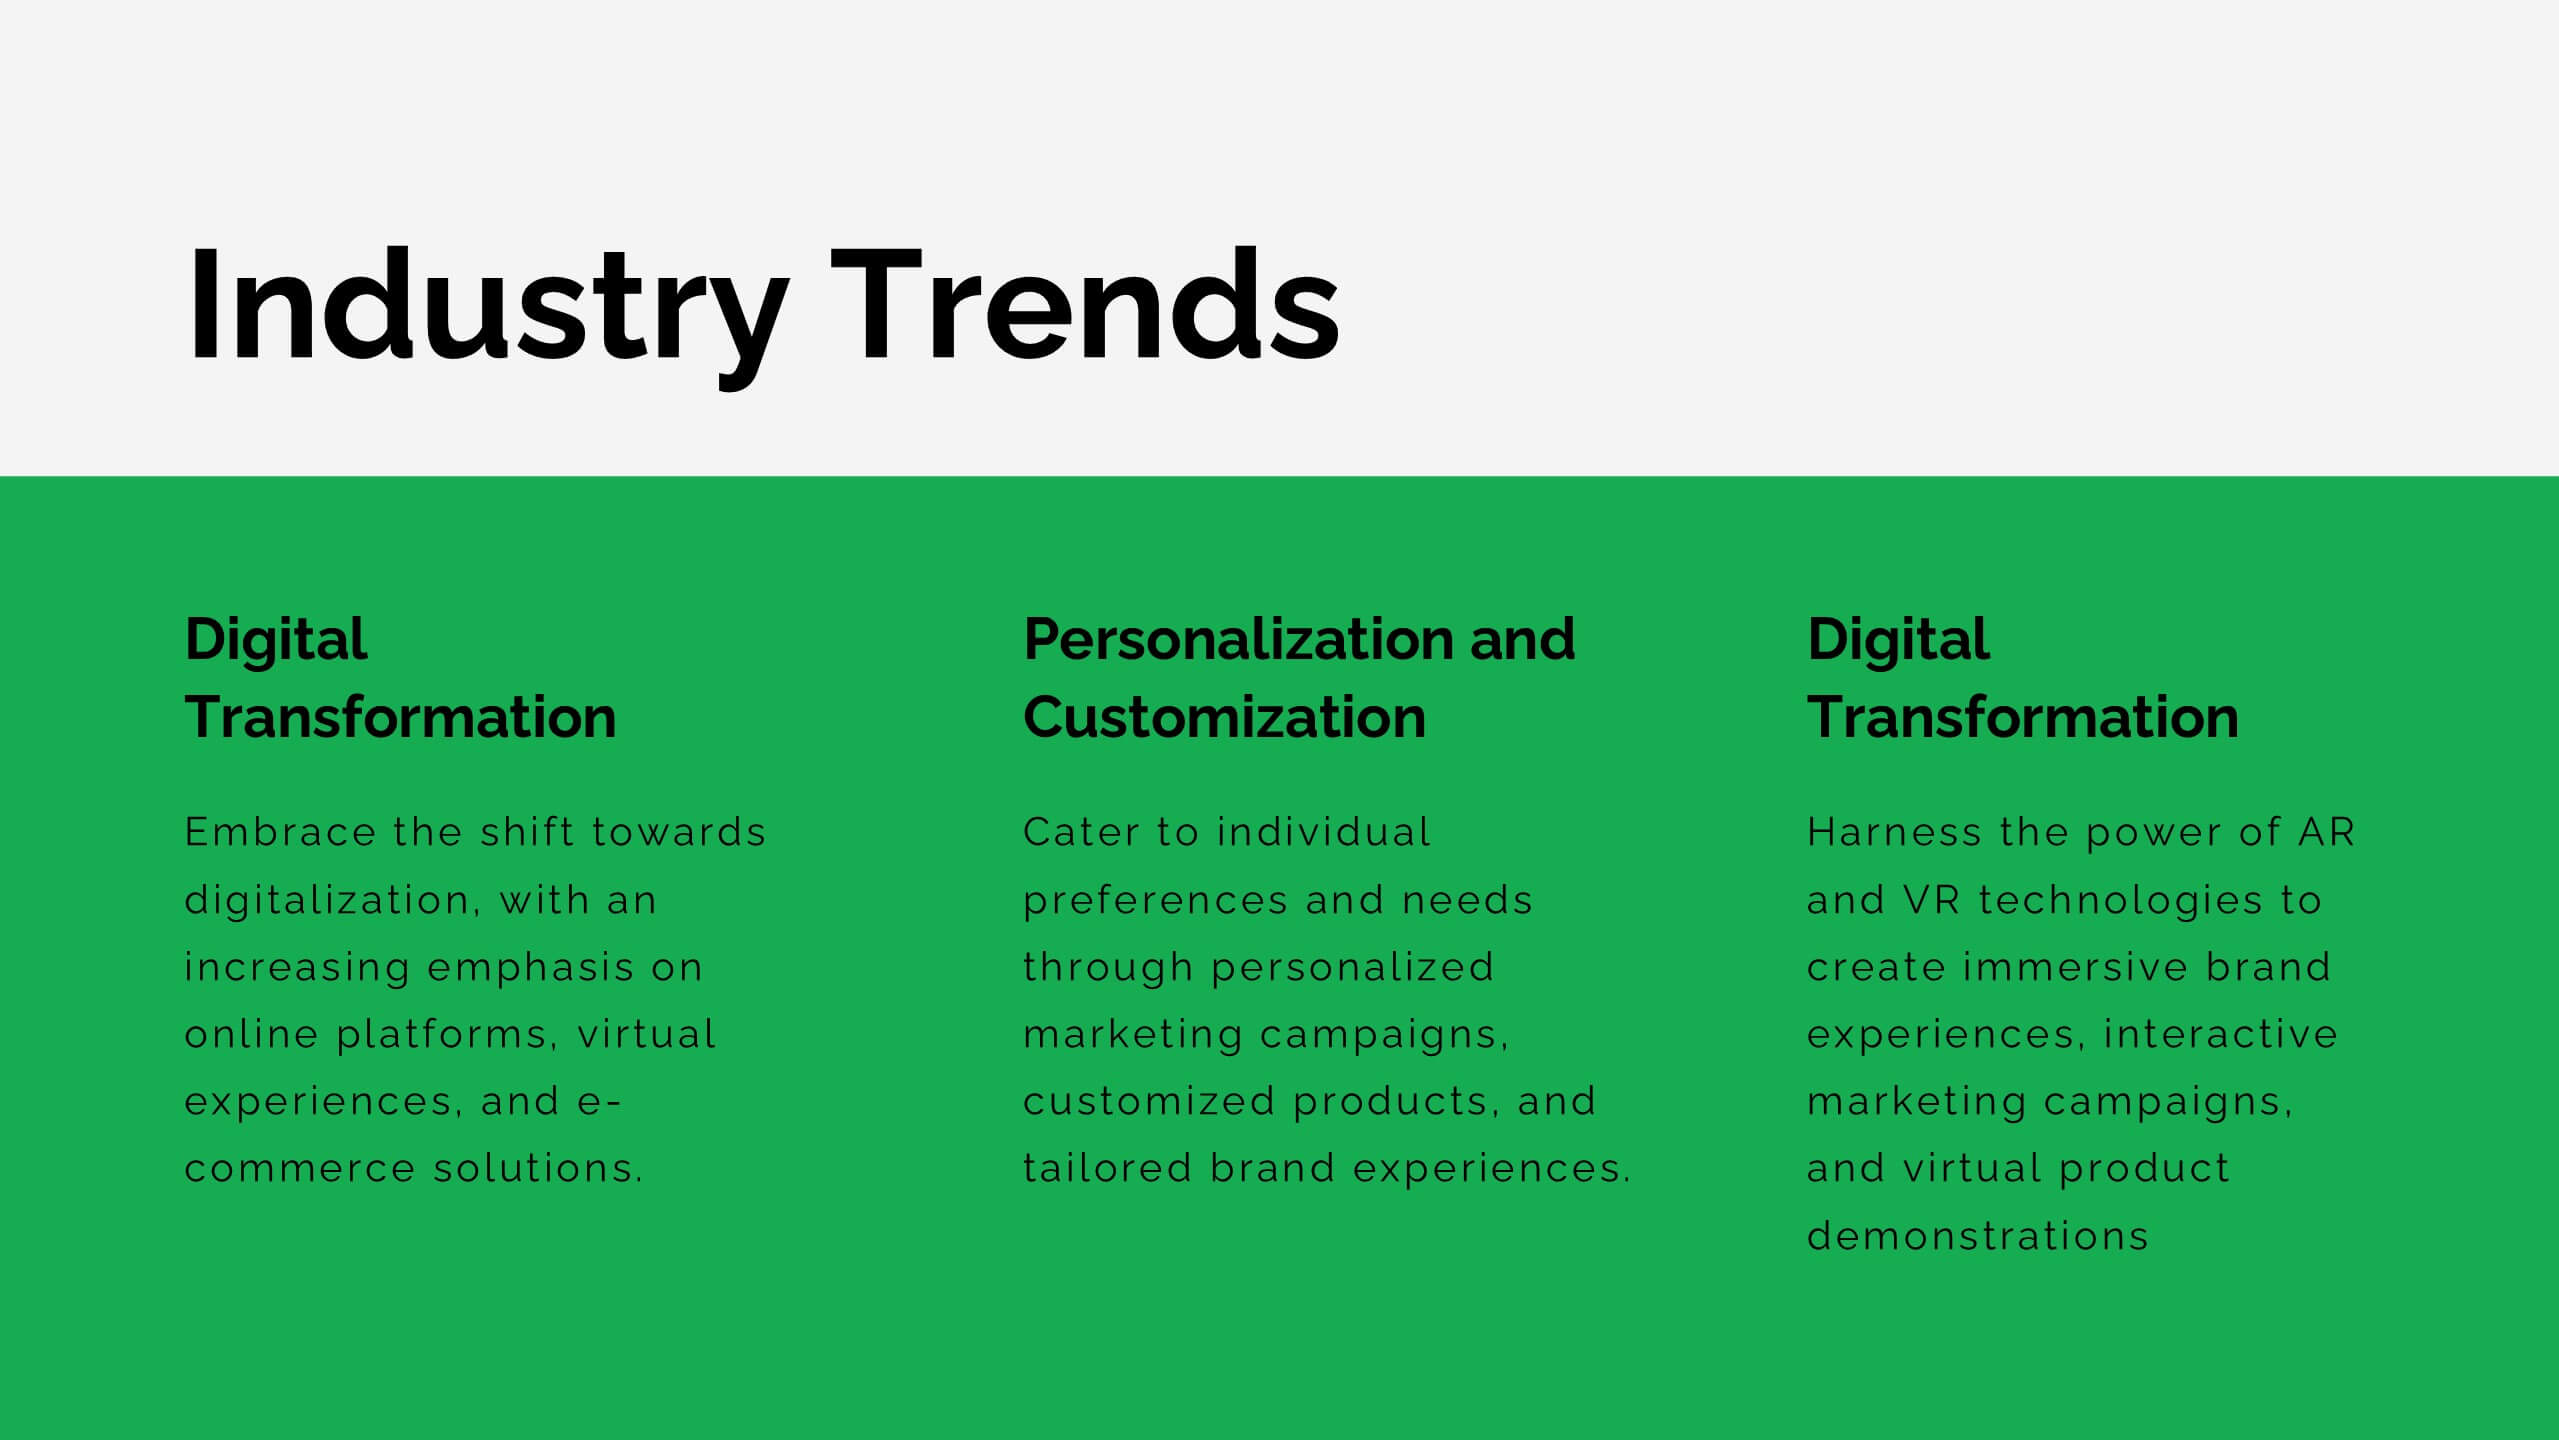
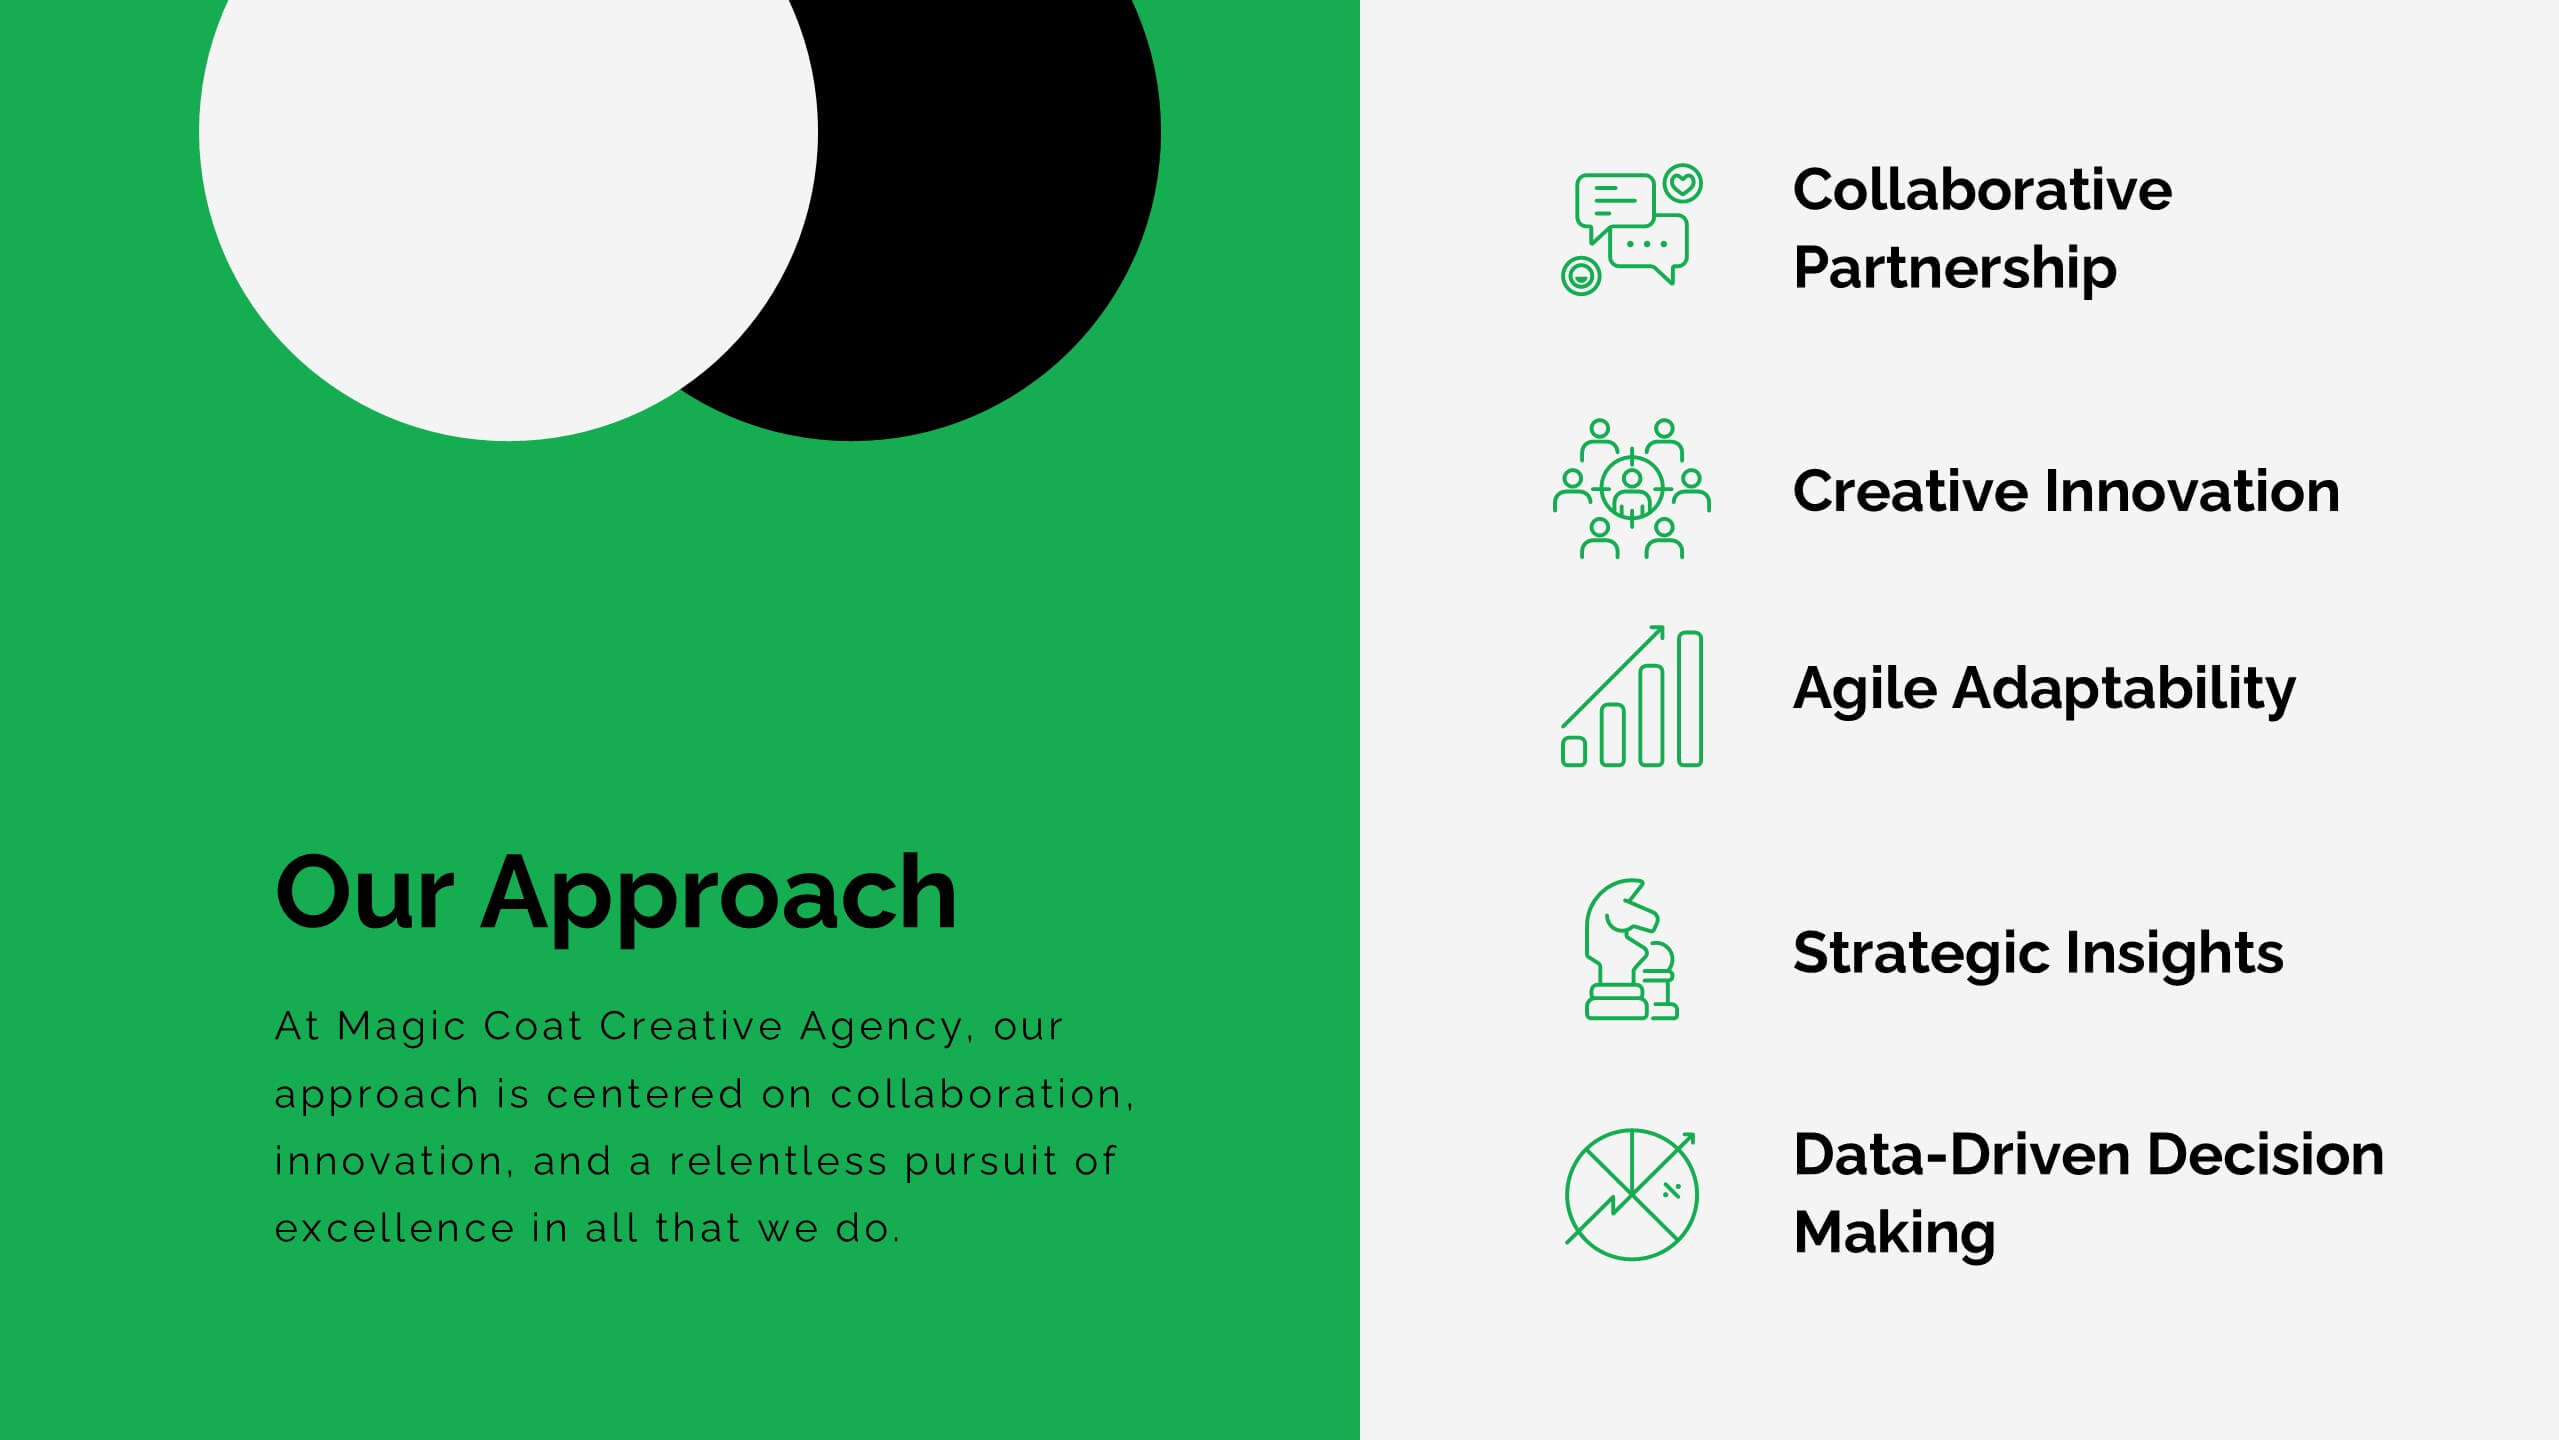
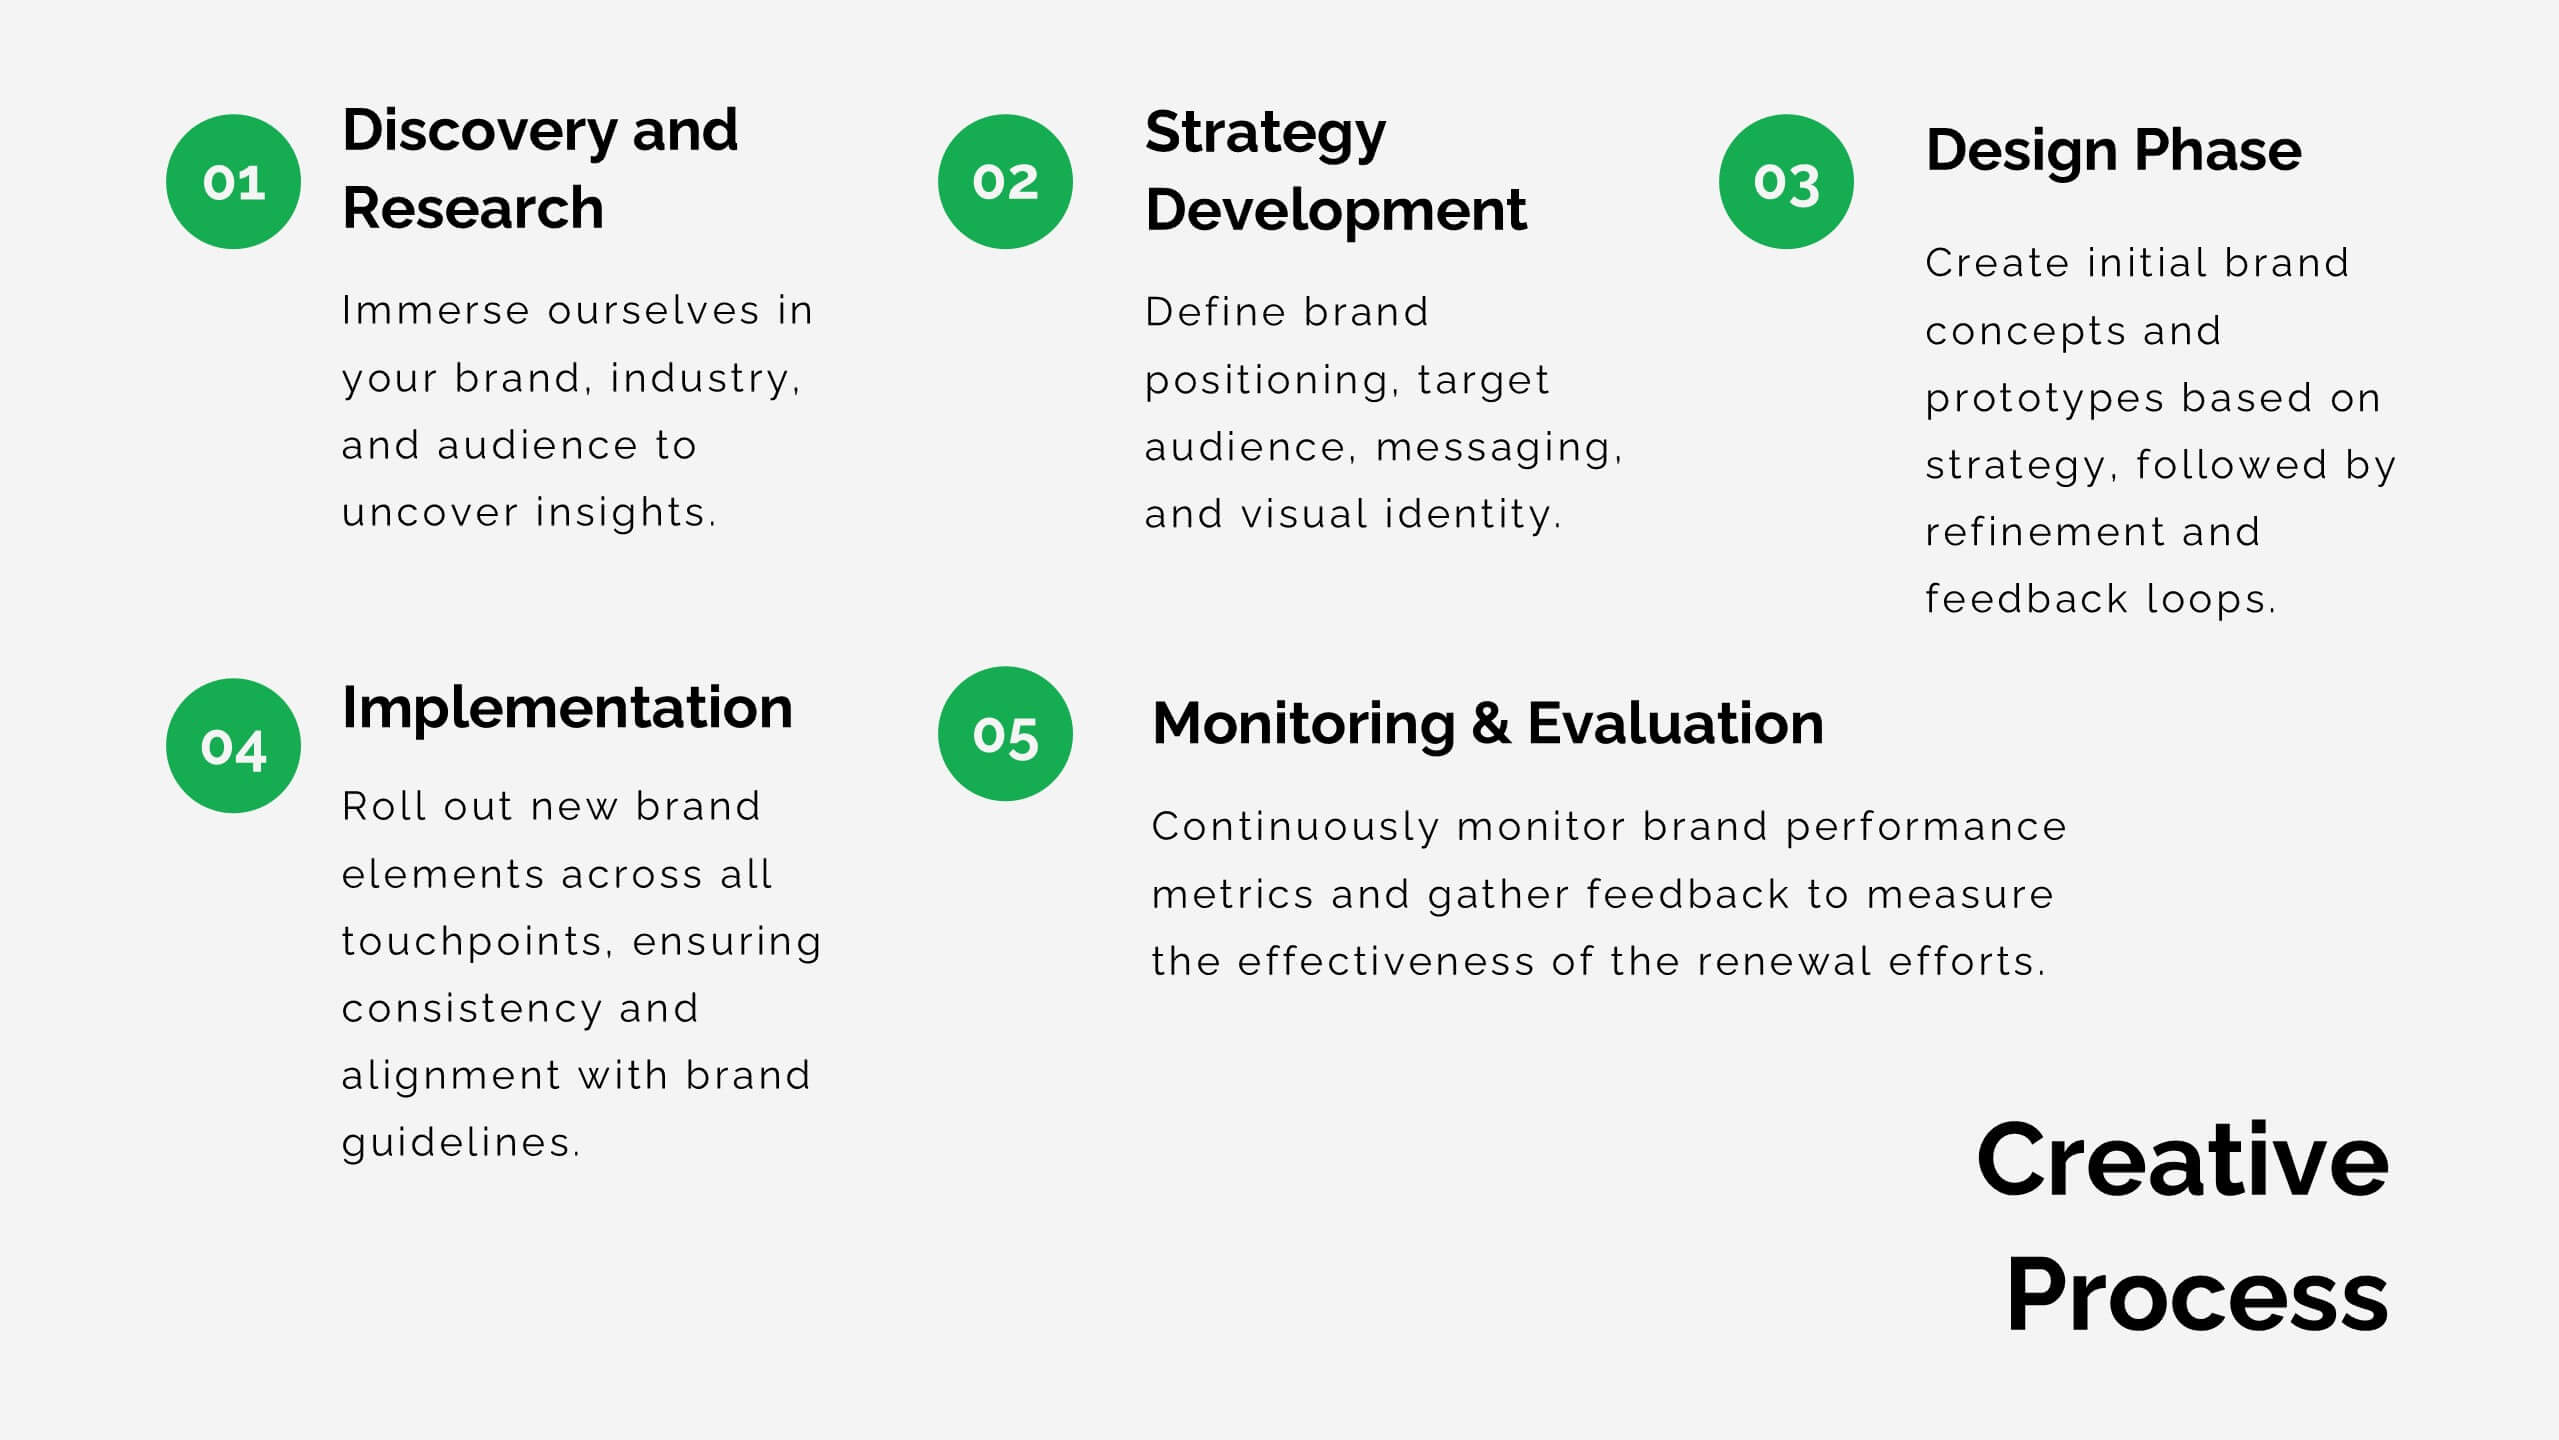
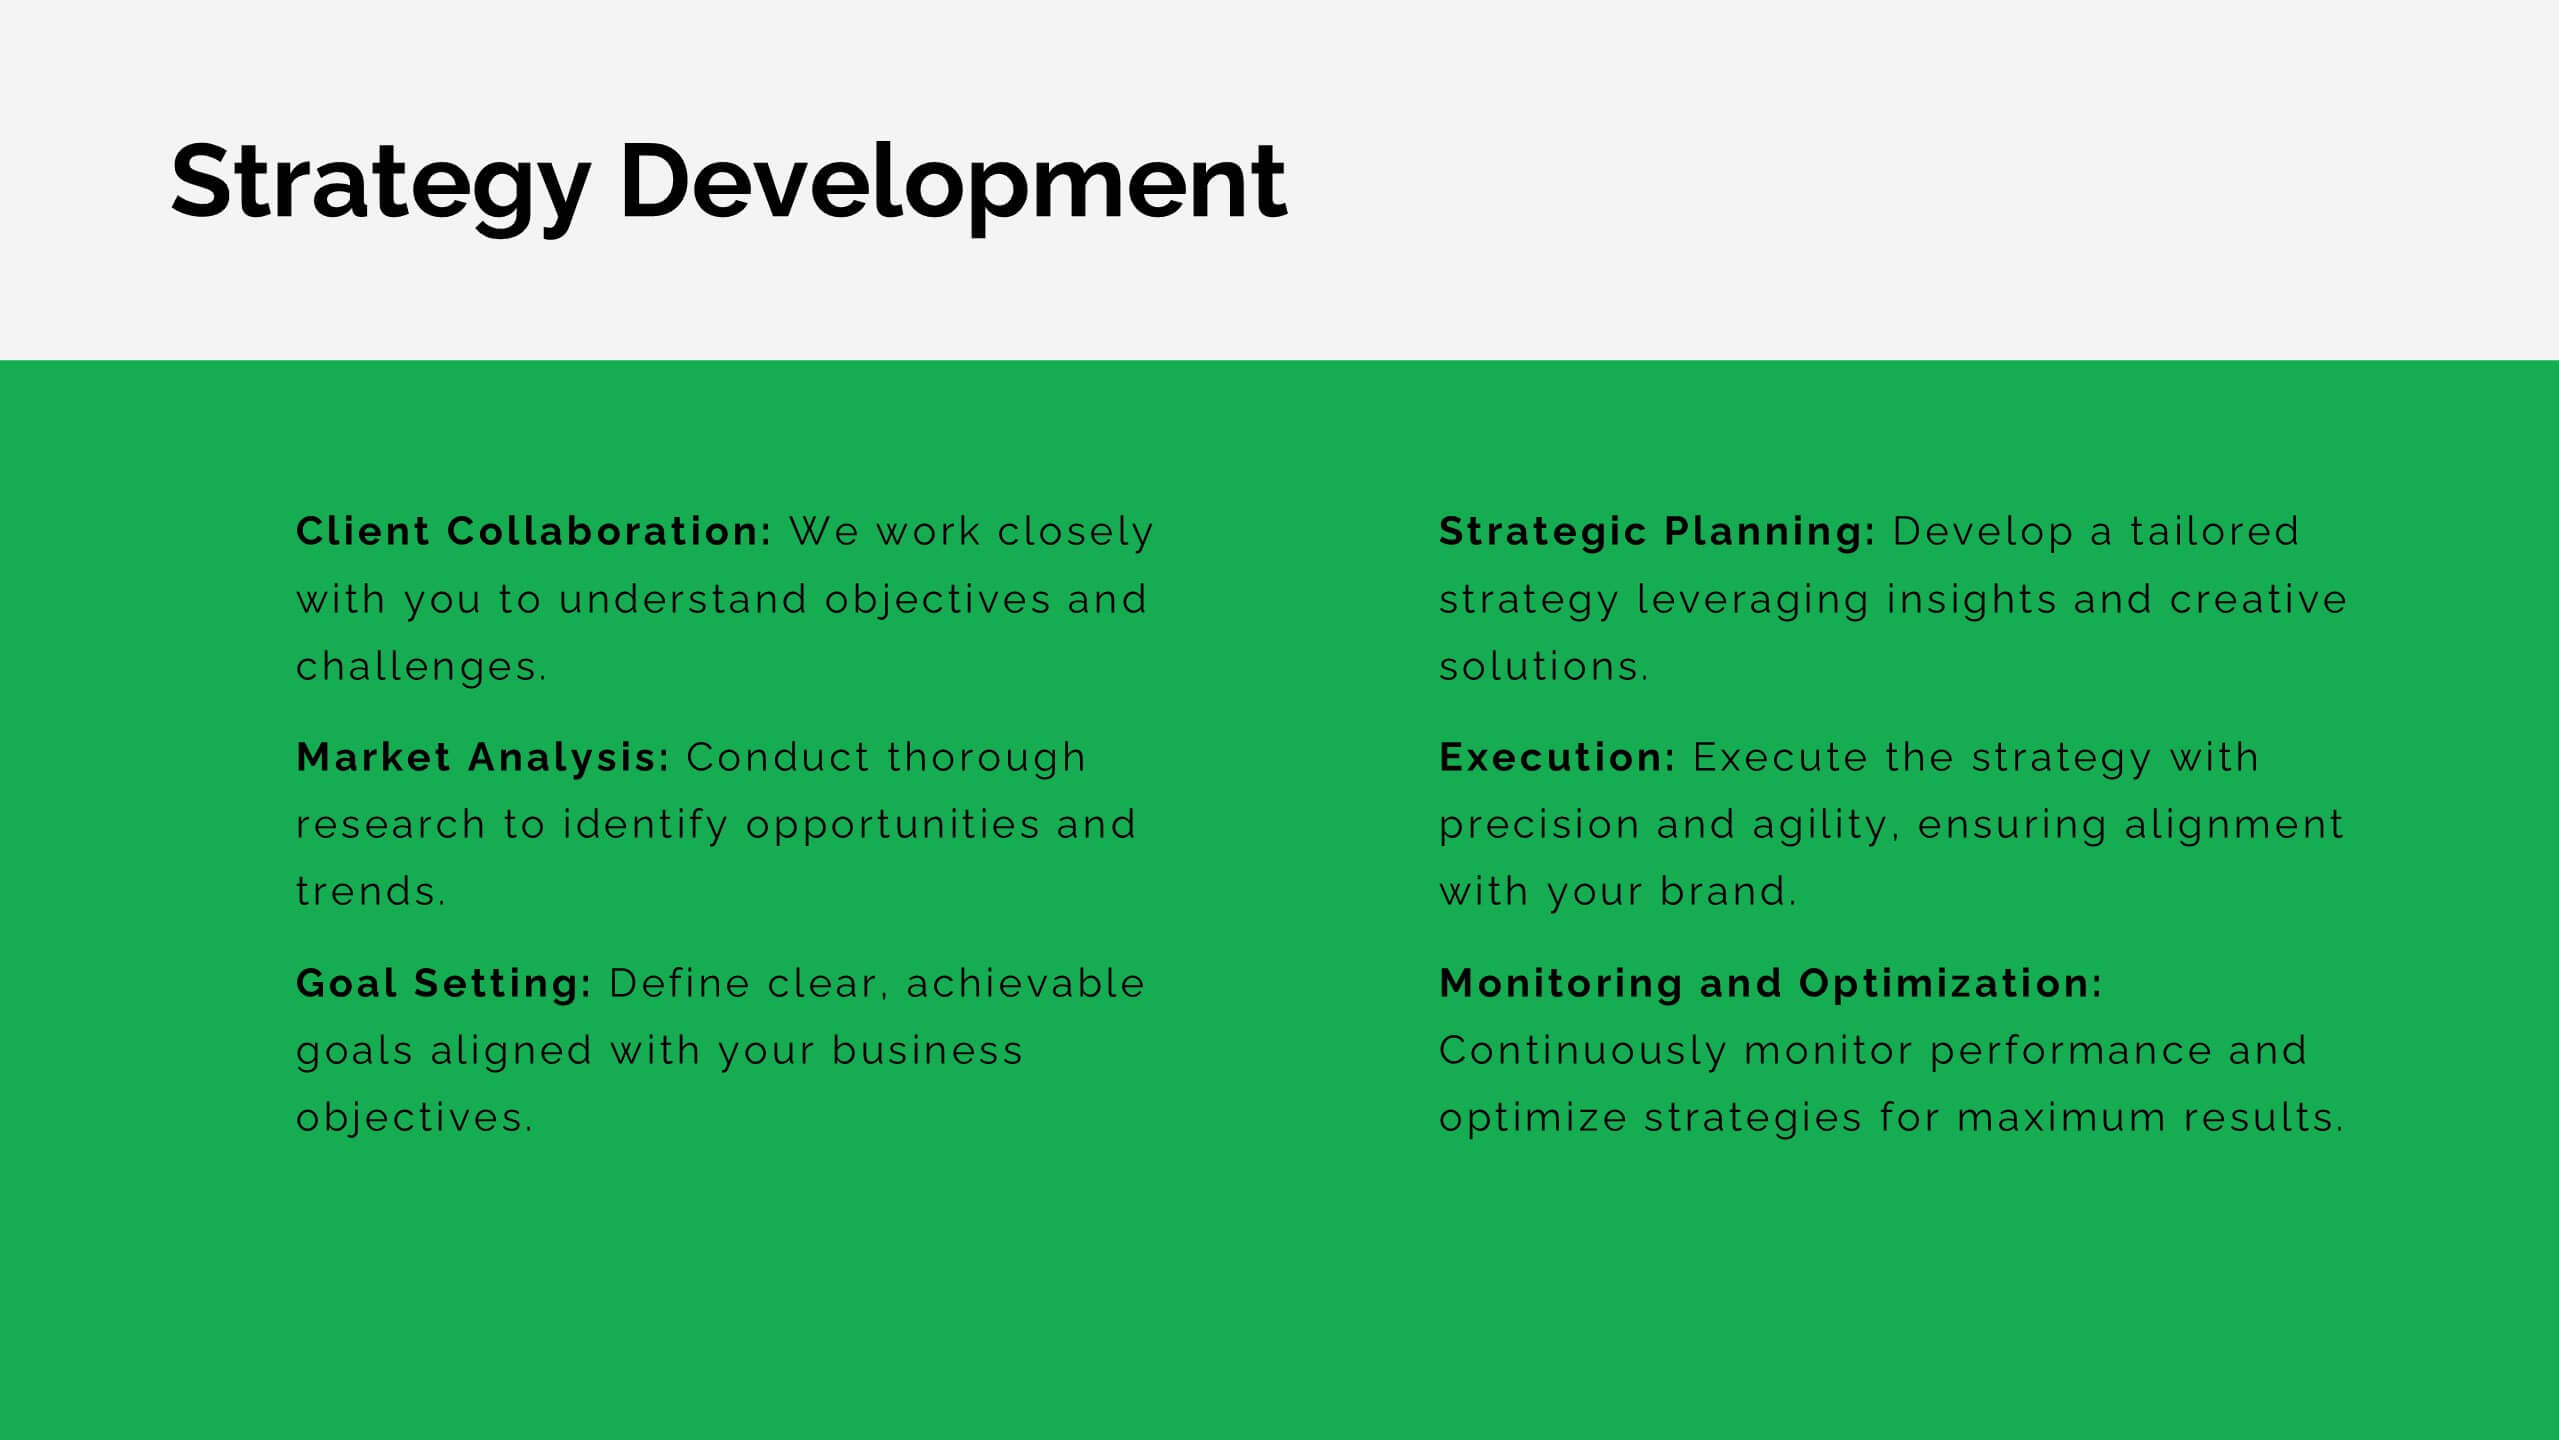
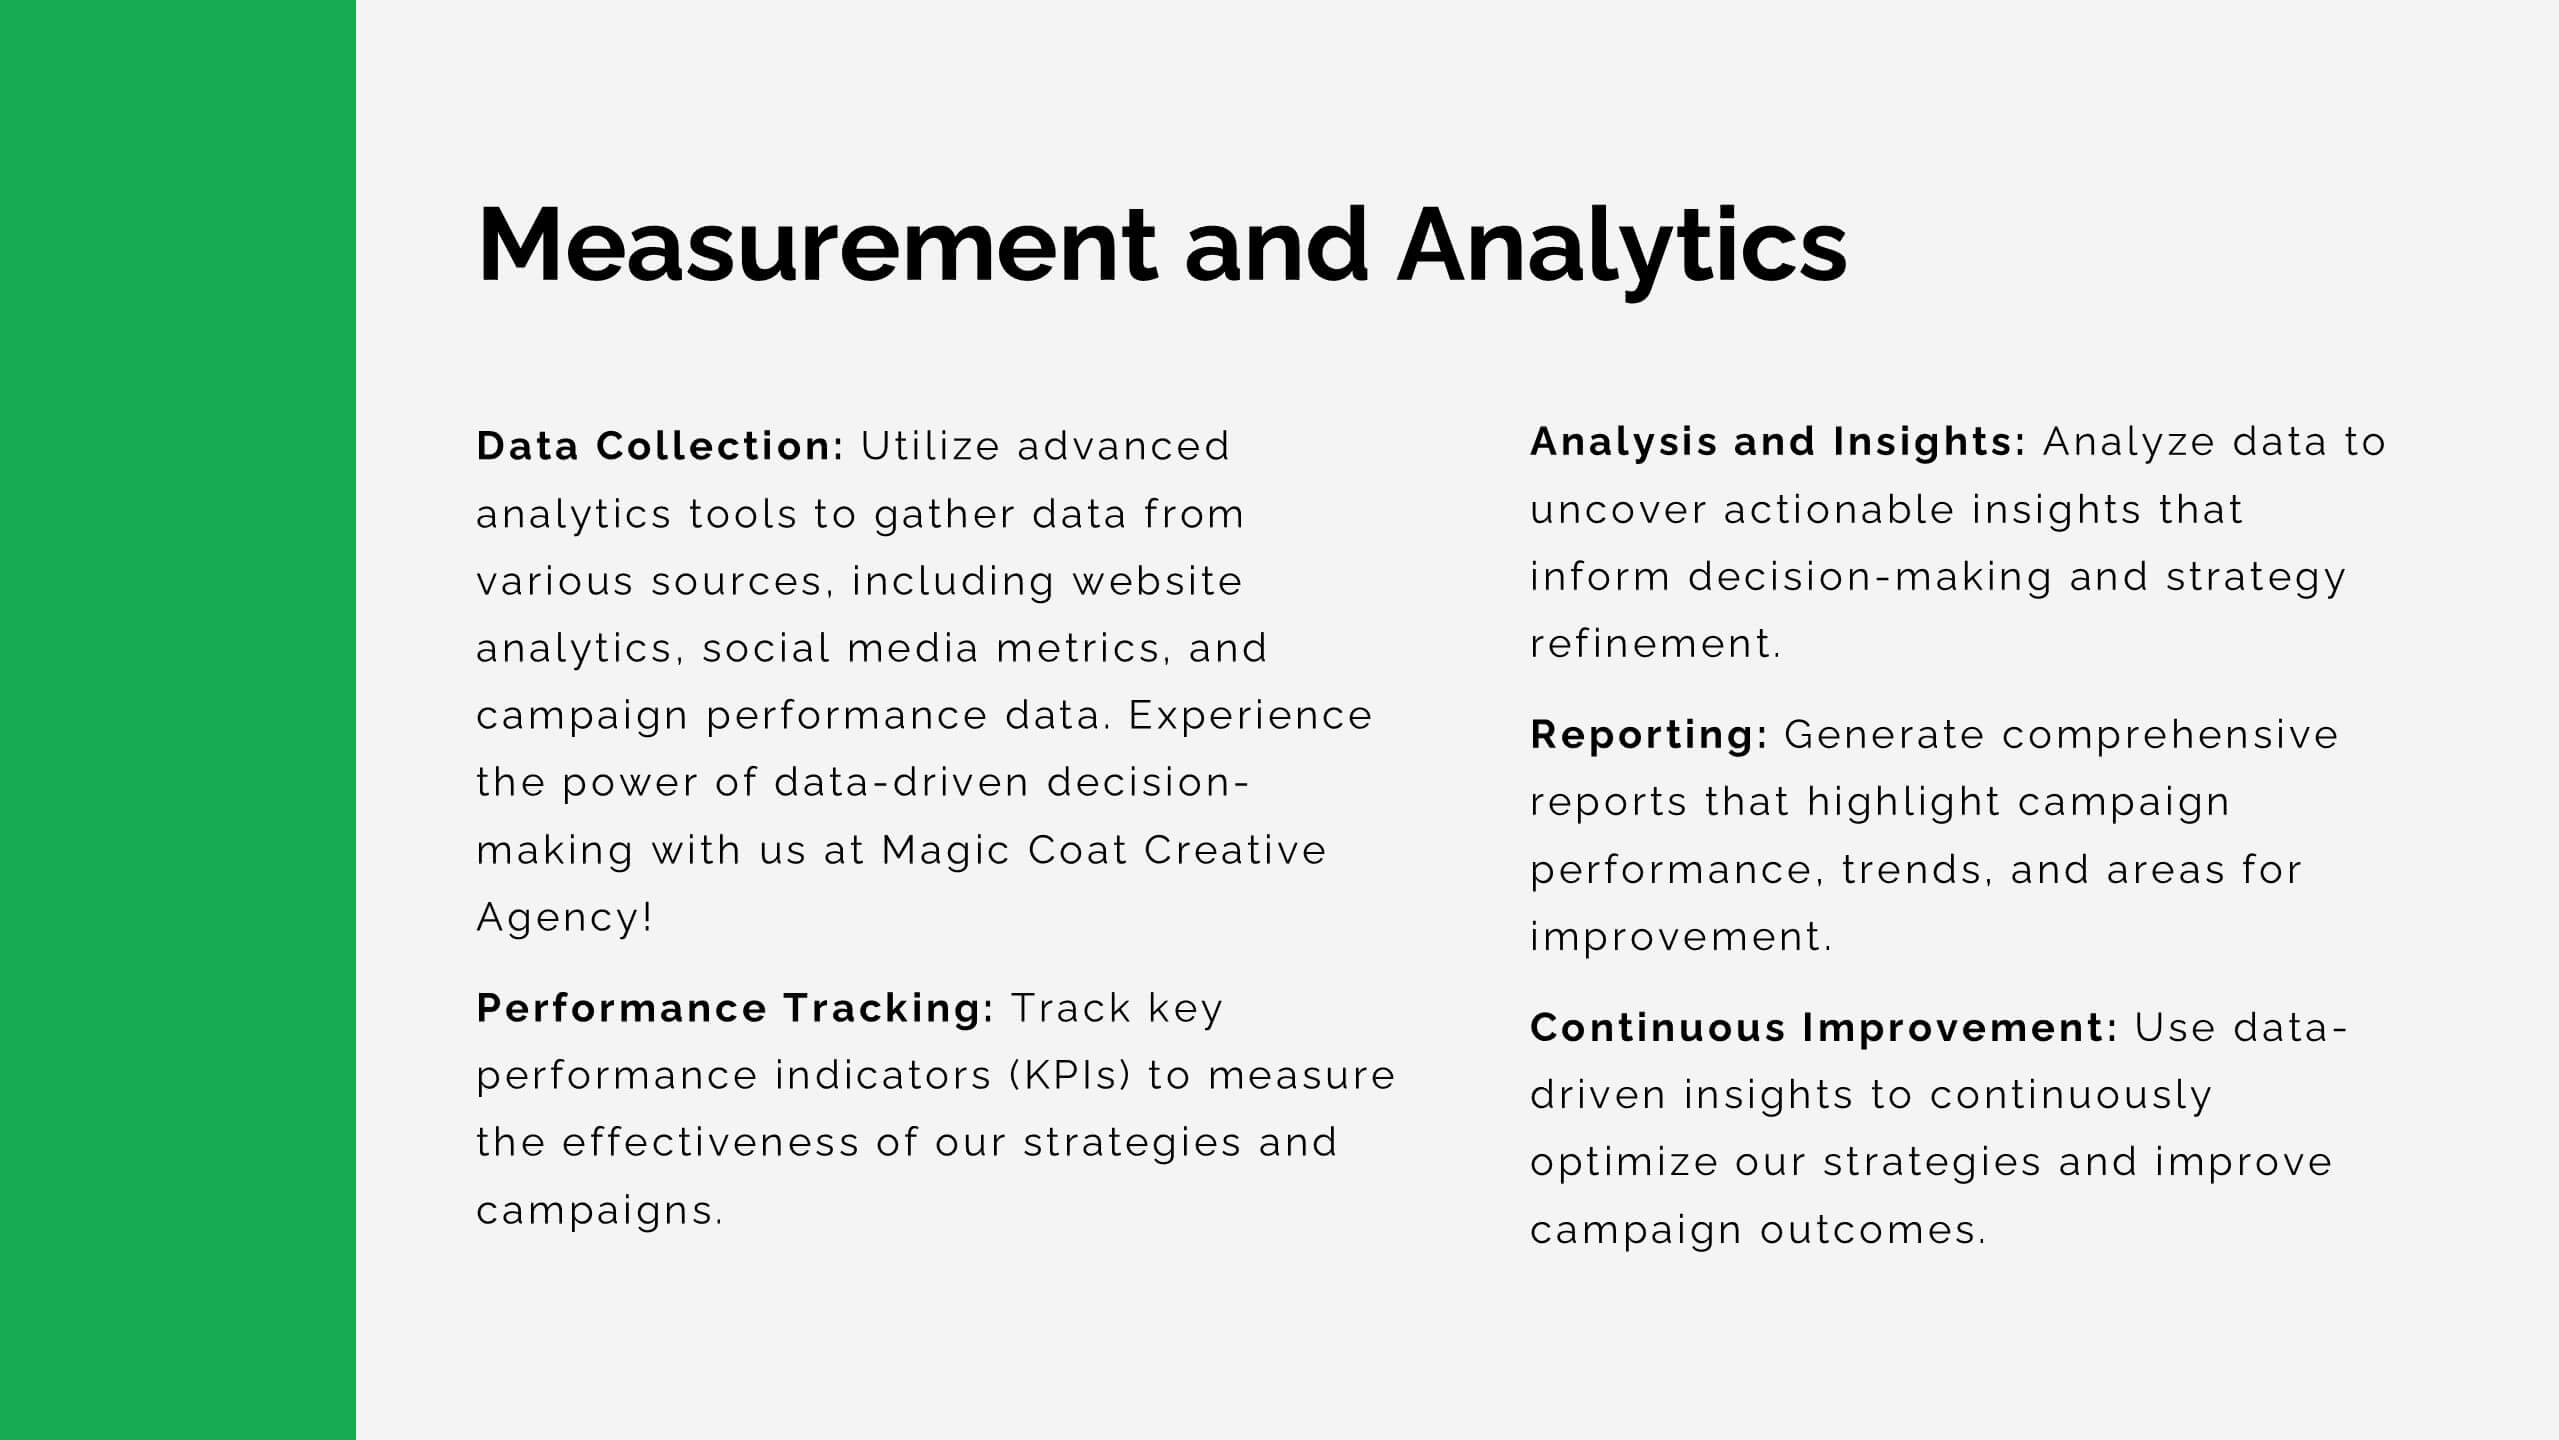
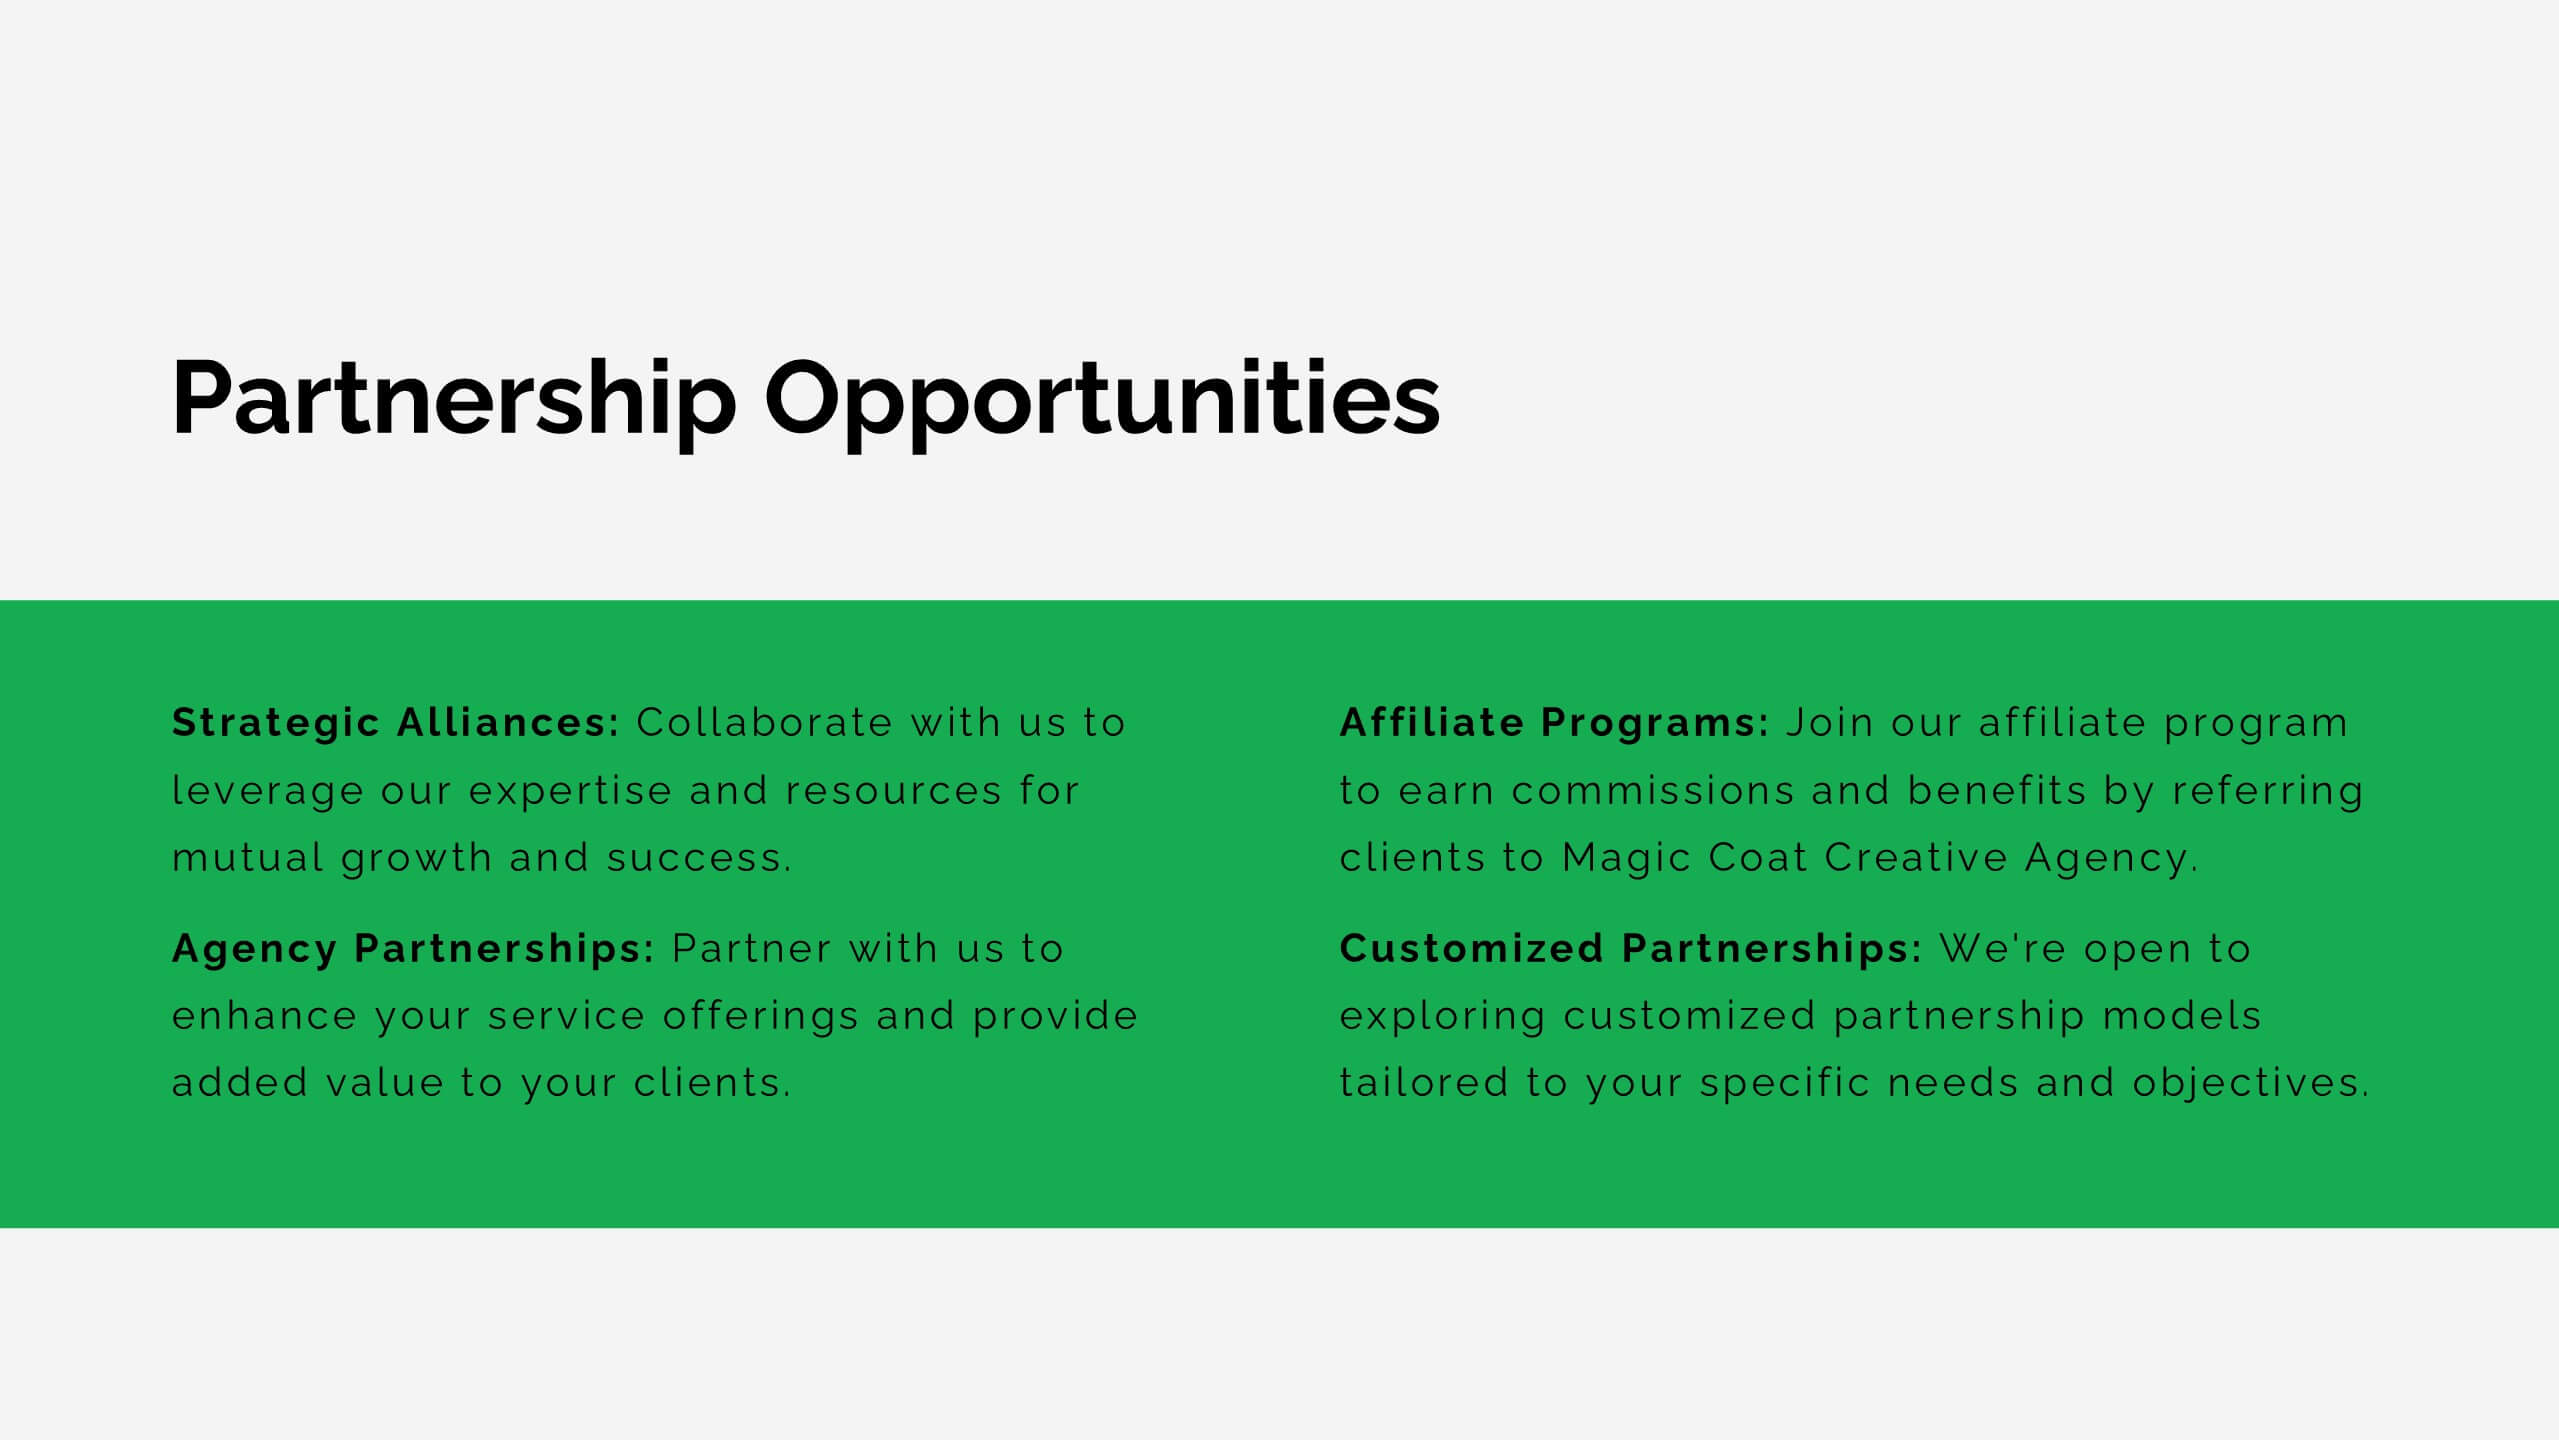
Etherwind Advertising Agency Proposal Presentation
This Advertising Agency Proposal Presentation Template offers a sleek and professional layout, perfect for showcasing your agency's capabilities, services, and success stories. Covering essential sections such as market analysis, strategy development, campaign execution, and client testimonials, it ensures a compelling pitch to potential clients. Designed for easy customization in PowerPoint, Keynote, and Google Slides, making it a versatile choice for agencies looking to impress their audience.


7 diapositivas
Product Life Cycle Analysis Infographic
Our Product Life Cycle Infographic template is the perfect tool for businesses that want to visually represent the various stages of their products' life cycles, from introduction to decline. Our engaging and easy-to-understand visuals help to illustrate the stages of a product's life cycle in a compelling way, making it easier for businesses to gain a better understanding of their products and how they evolve over time. In short, our Product Life Cycle Infographic template is a valuable tool for businesses that want to stay ahead of the curve and gain a deeper understanding of their products. So why wait? Try our template today and take your product development, marketing, sales, and financial planning to the next level!


6 diapositivas
Veterinary School Infographics
Explore the world of Veterinary School with our customizable infographic template. This template is fully compatible with popular presentation software like PowerPoint, Keynote, and Google Slides, allowing you to easily customize it to illustrate and communicate various aspects of veterinary education and training. The Veterinary School infographic template offers a visually engaging platform to outline the curriculum, admissions process, career prospects, and importance of veterinary education. Whether you're a veterinary student, educator, prospective applicant, or simply interested in animal healthcare, this template provides a user-friendly canvas to create informative presentations and educational materials. Enhance your understanding of Veterinary School with this SEO-optimized infographic template, thoughtfully designed for clarity and ease of use. Customize it to showcase admission requirements, core subjects, clinical training, and the impact of veterinary professionals on animal health and welfare. Ensure that your audience gains valuable insights into the world of veterinary education. Start crafting your personalized infographic today to explore the realm of Veterinary School.
22 diapositivas
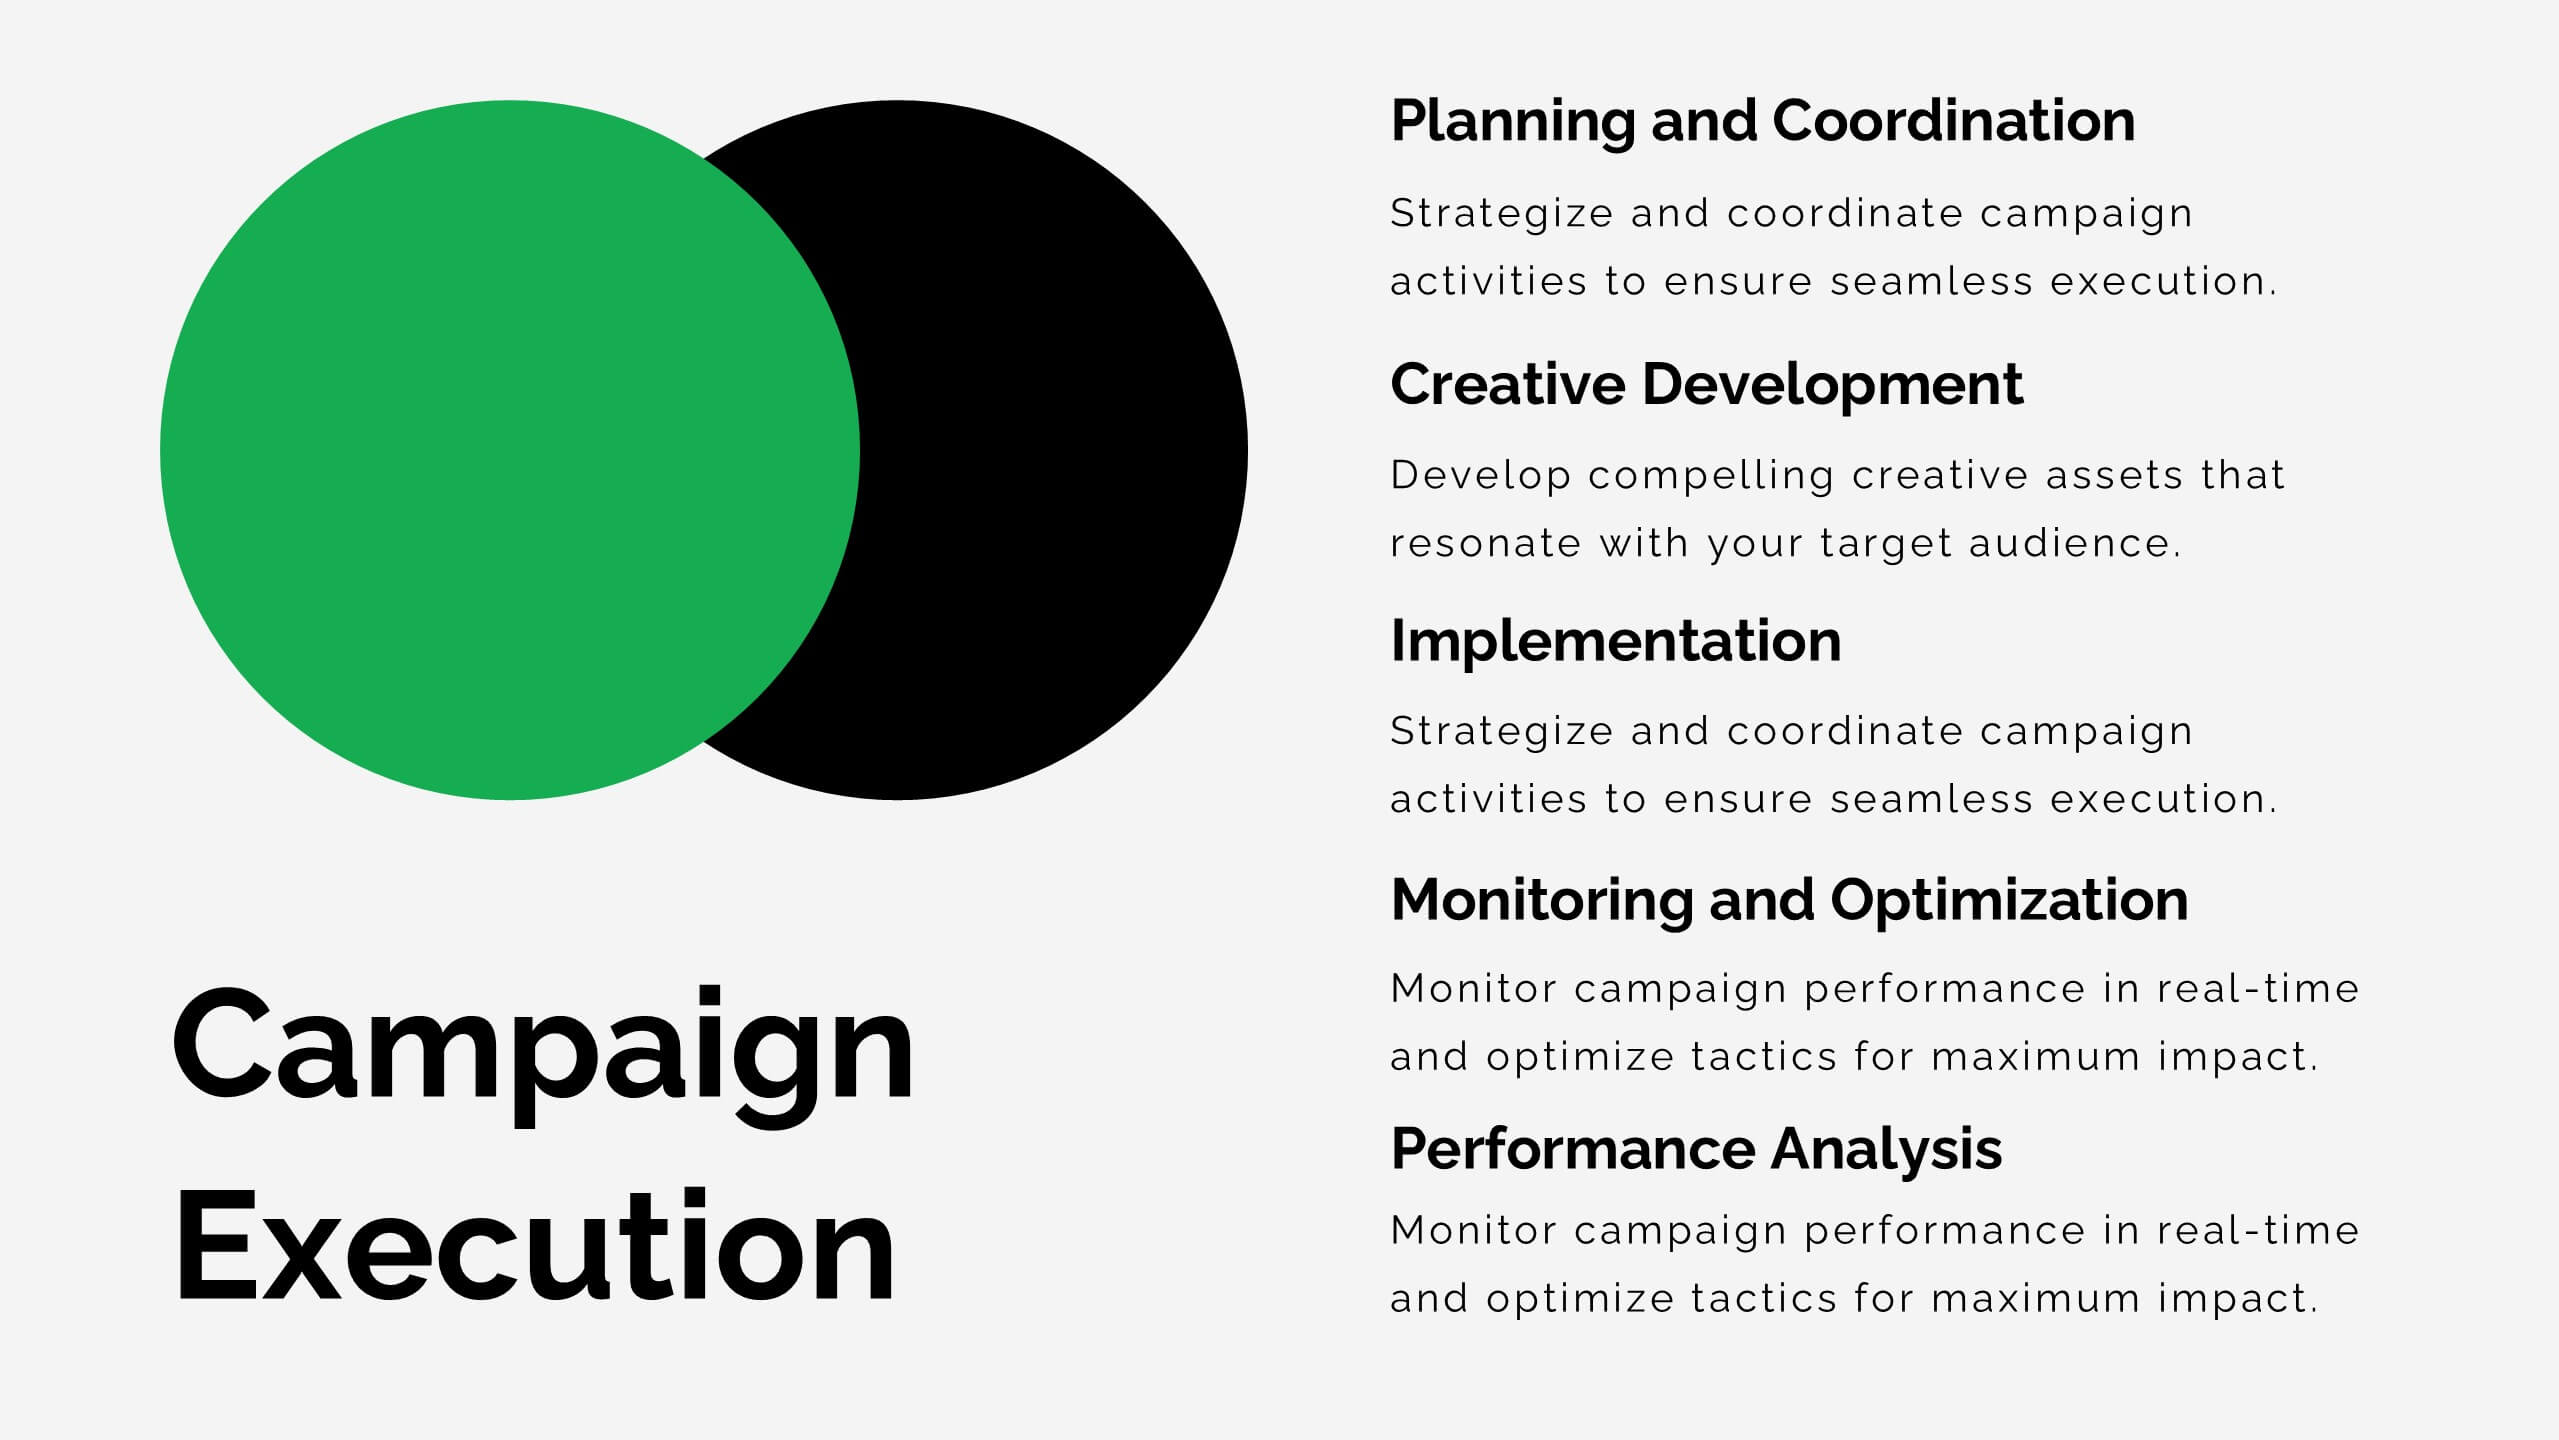
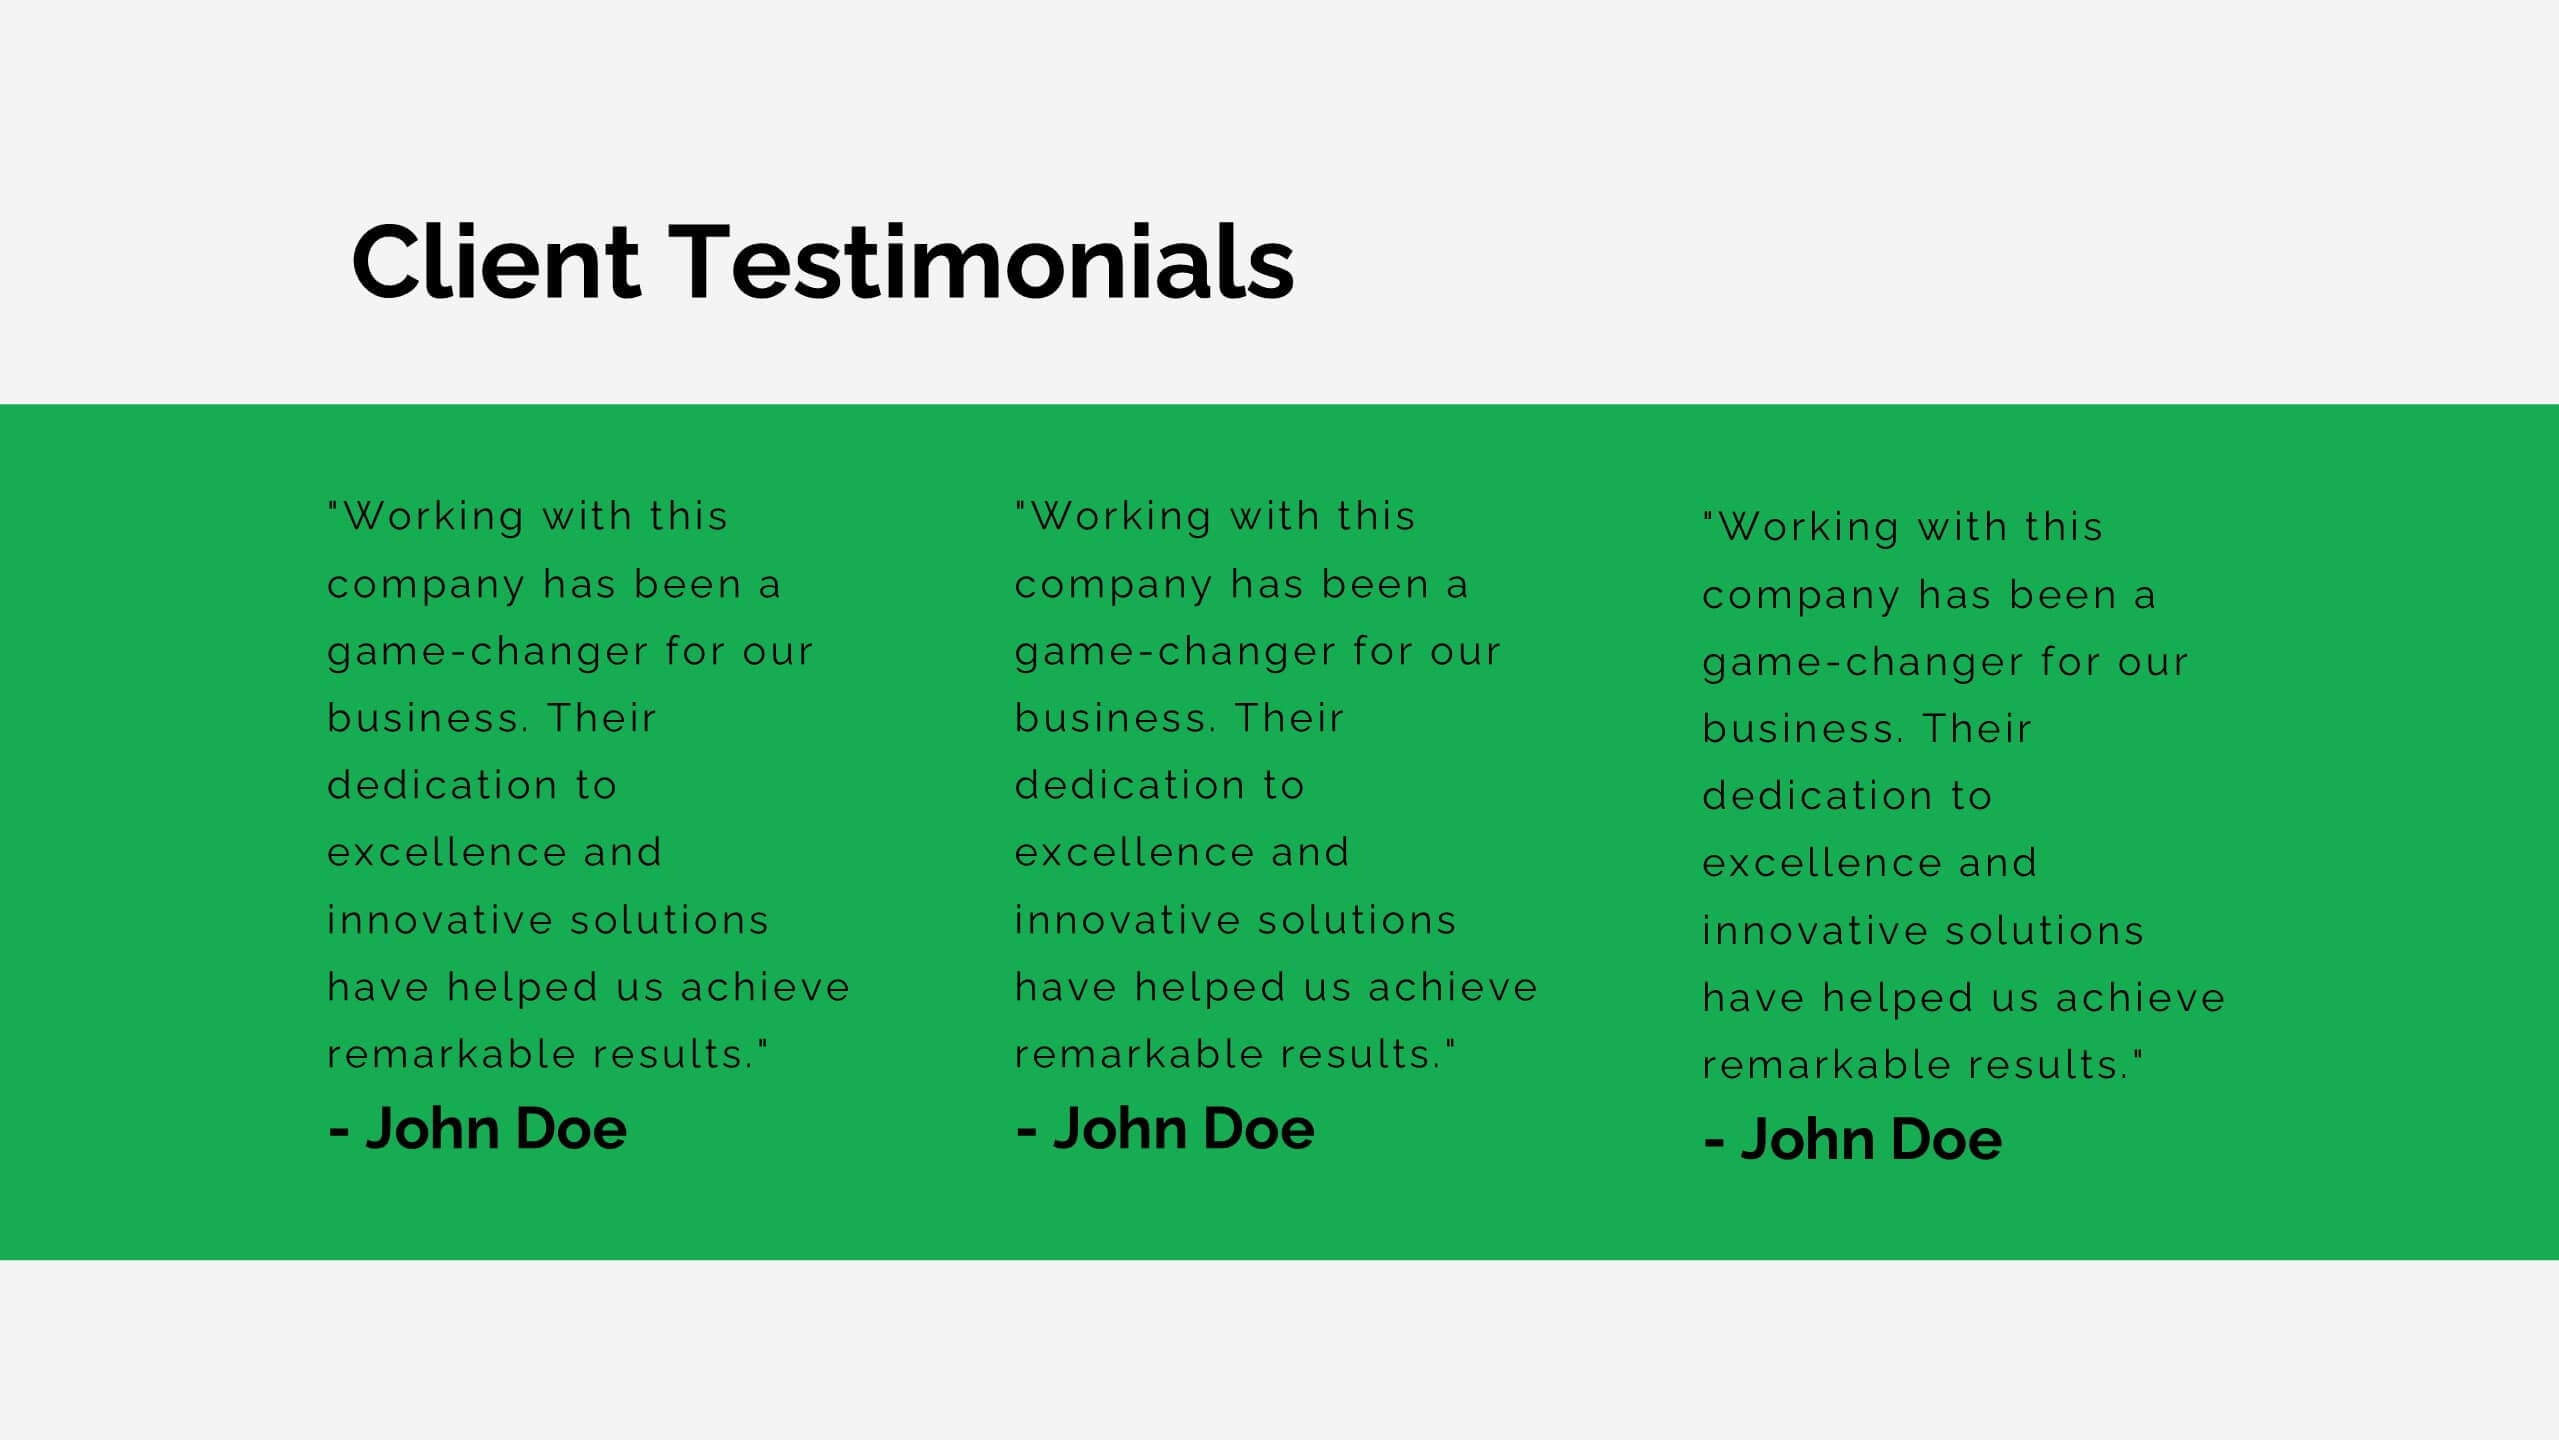
Lithium Advertising Agency Proposal Presentation
Elevate your advertising agency’s proposals with this sleek and modern template! It covers key areas like market analysis, case studies, client success stories, and campaign execution. Fully customizable, this template is perfect for presenting your agency’s services and strategies. Compatible with PowerPoint, Keynote, and Google Slides, it’s designed for impactful client presentations.
6 diapositivas
Key Project Milestone Tracker Presentation
Stay on top of project timelines with this clean and colorful milestone tracker. Ideal for Gantt-style overviews, this slide helps teams visualize progress across months for multiple tasks. Compatible with PowerPoint, Keynote, and Google Slides for seamless editing.