


Características


¿Tienes alguna pregunta?
Recomendar


20 diapositivas
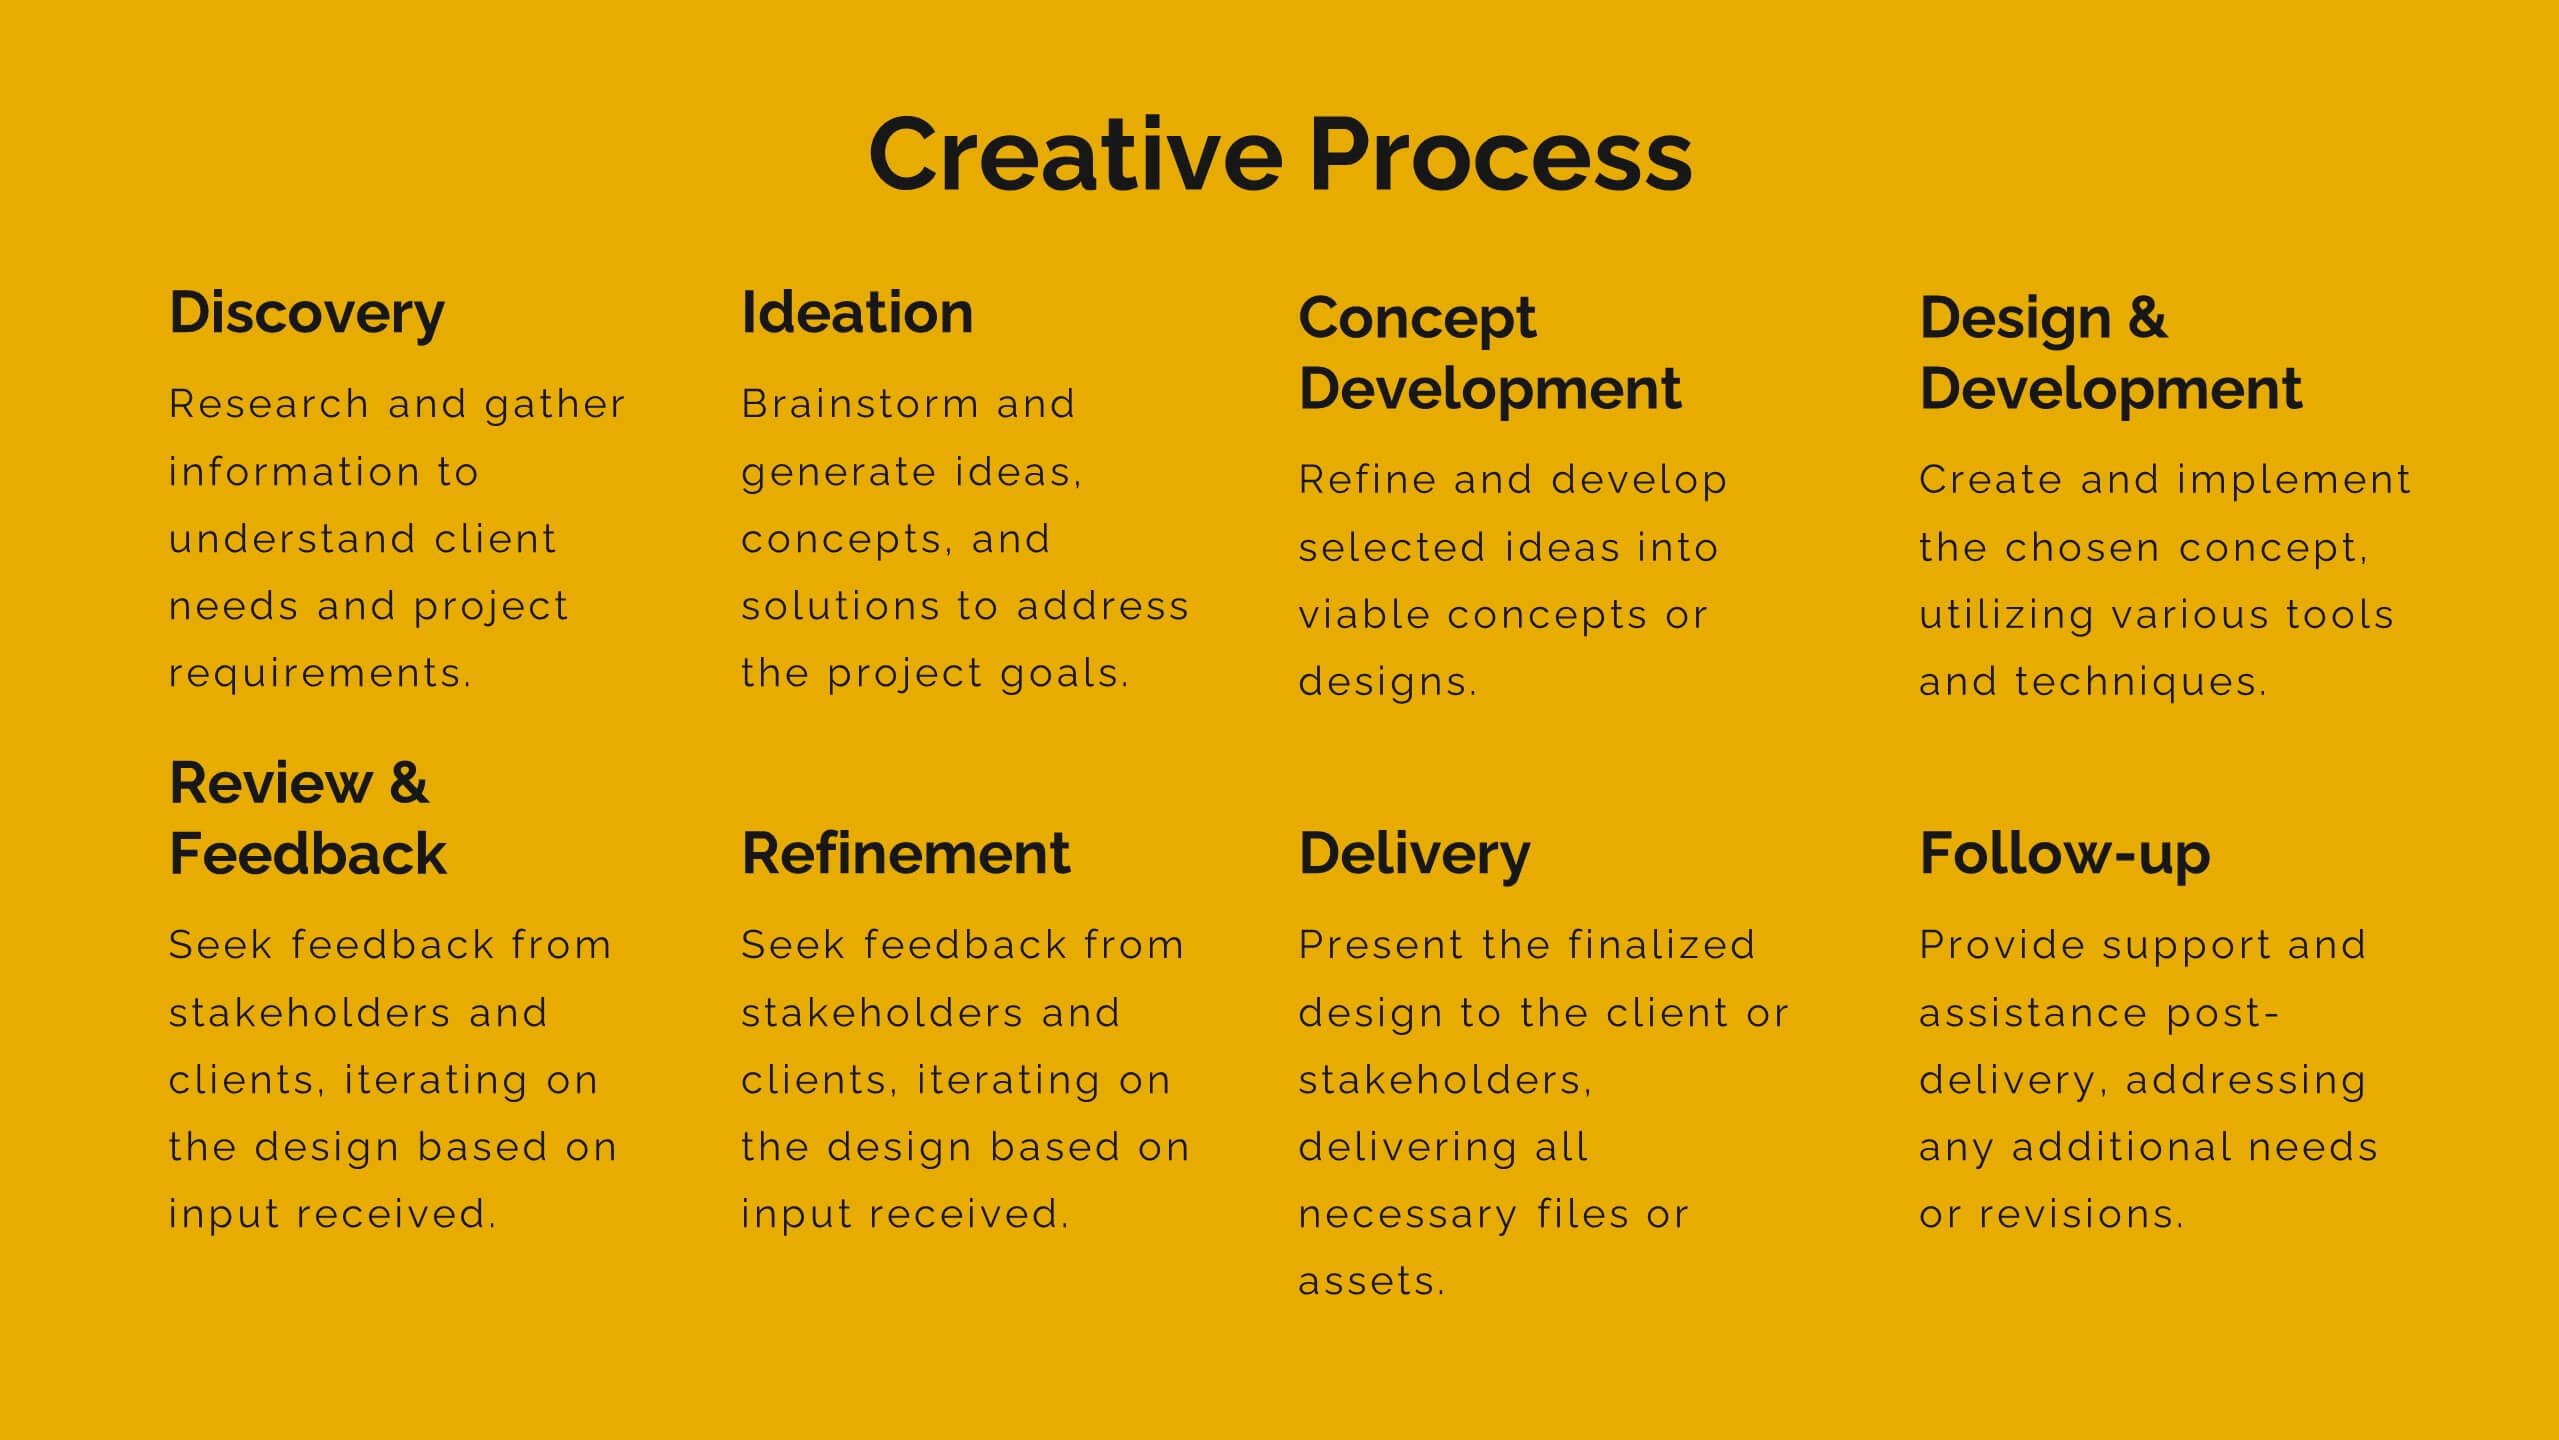
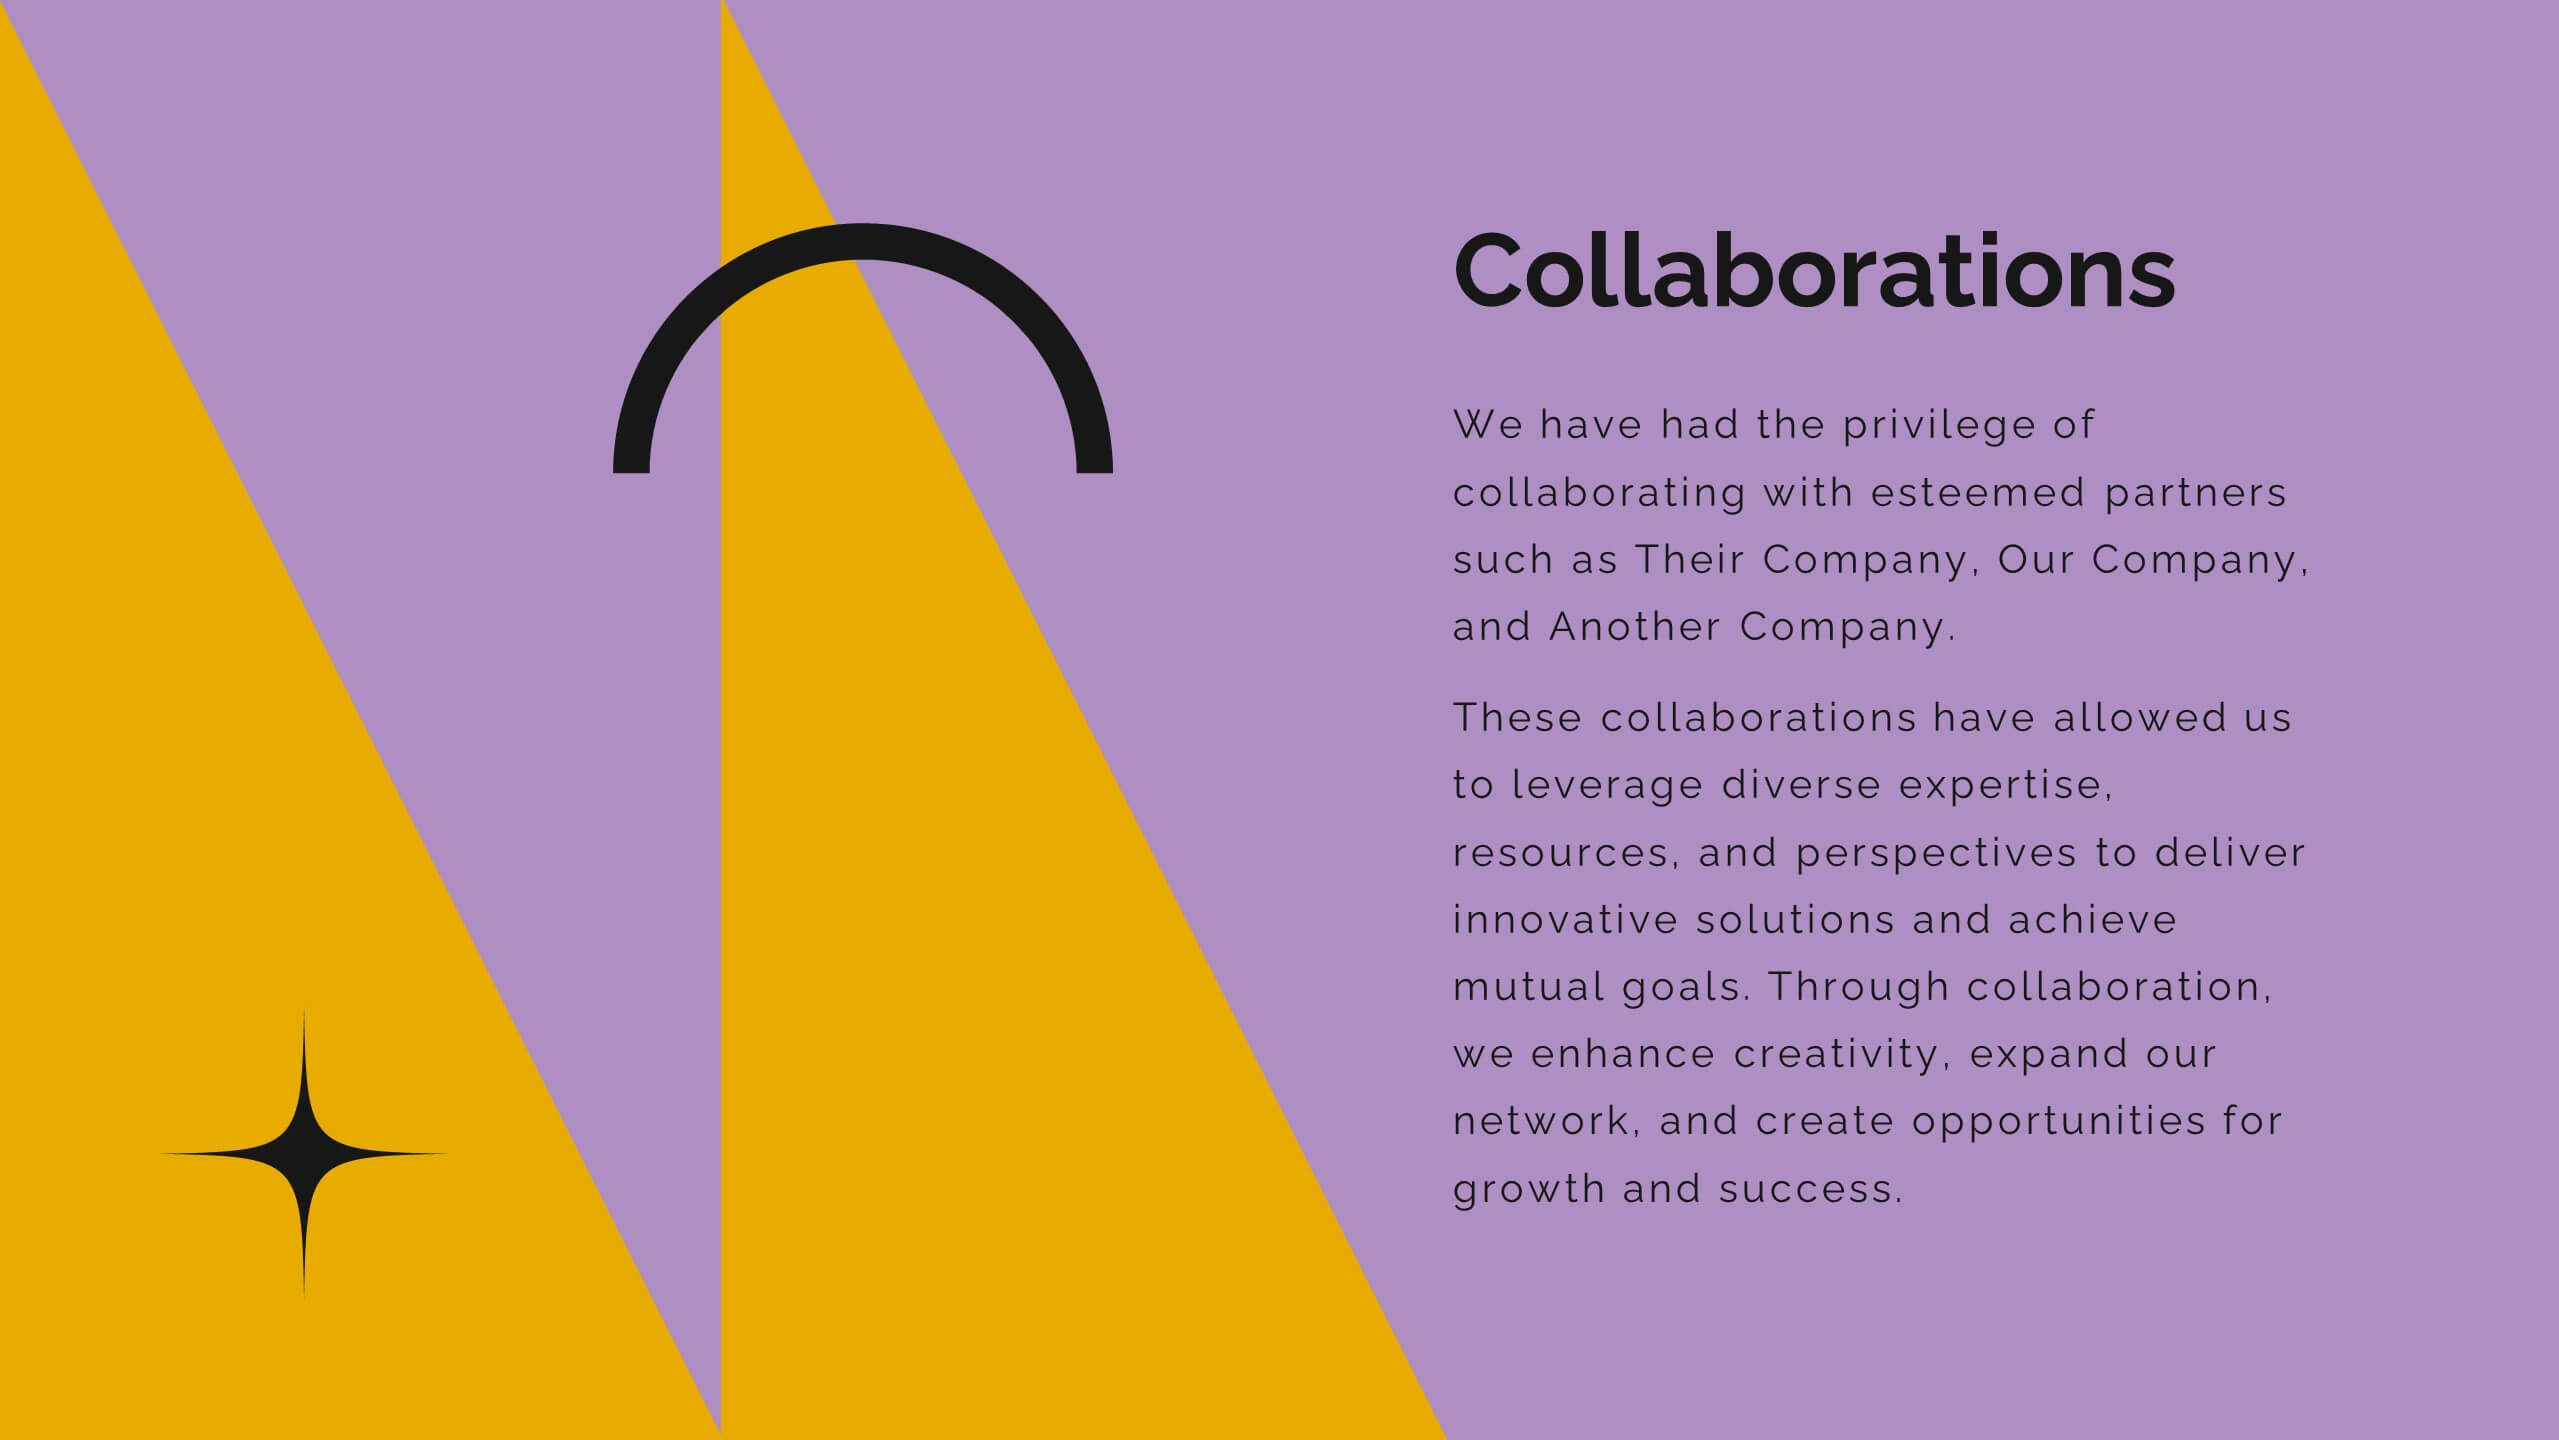
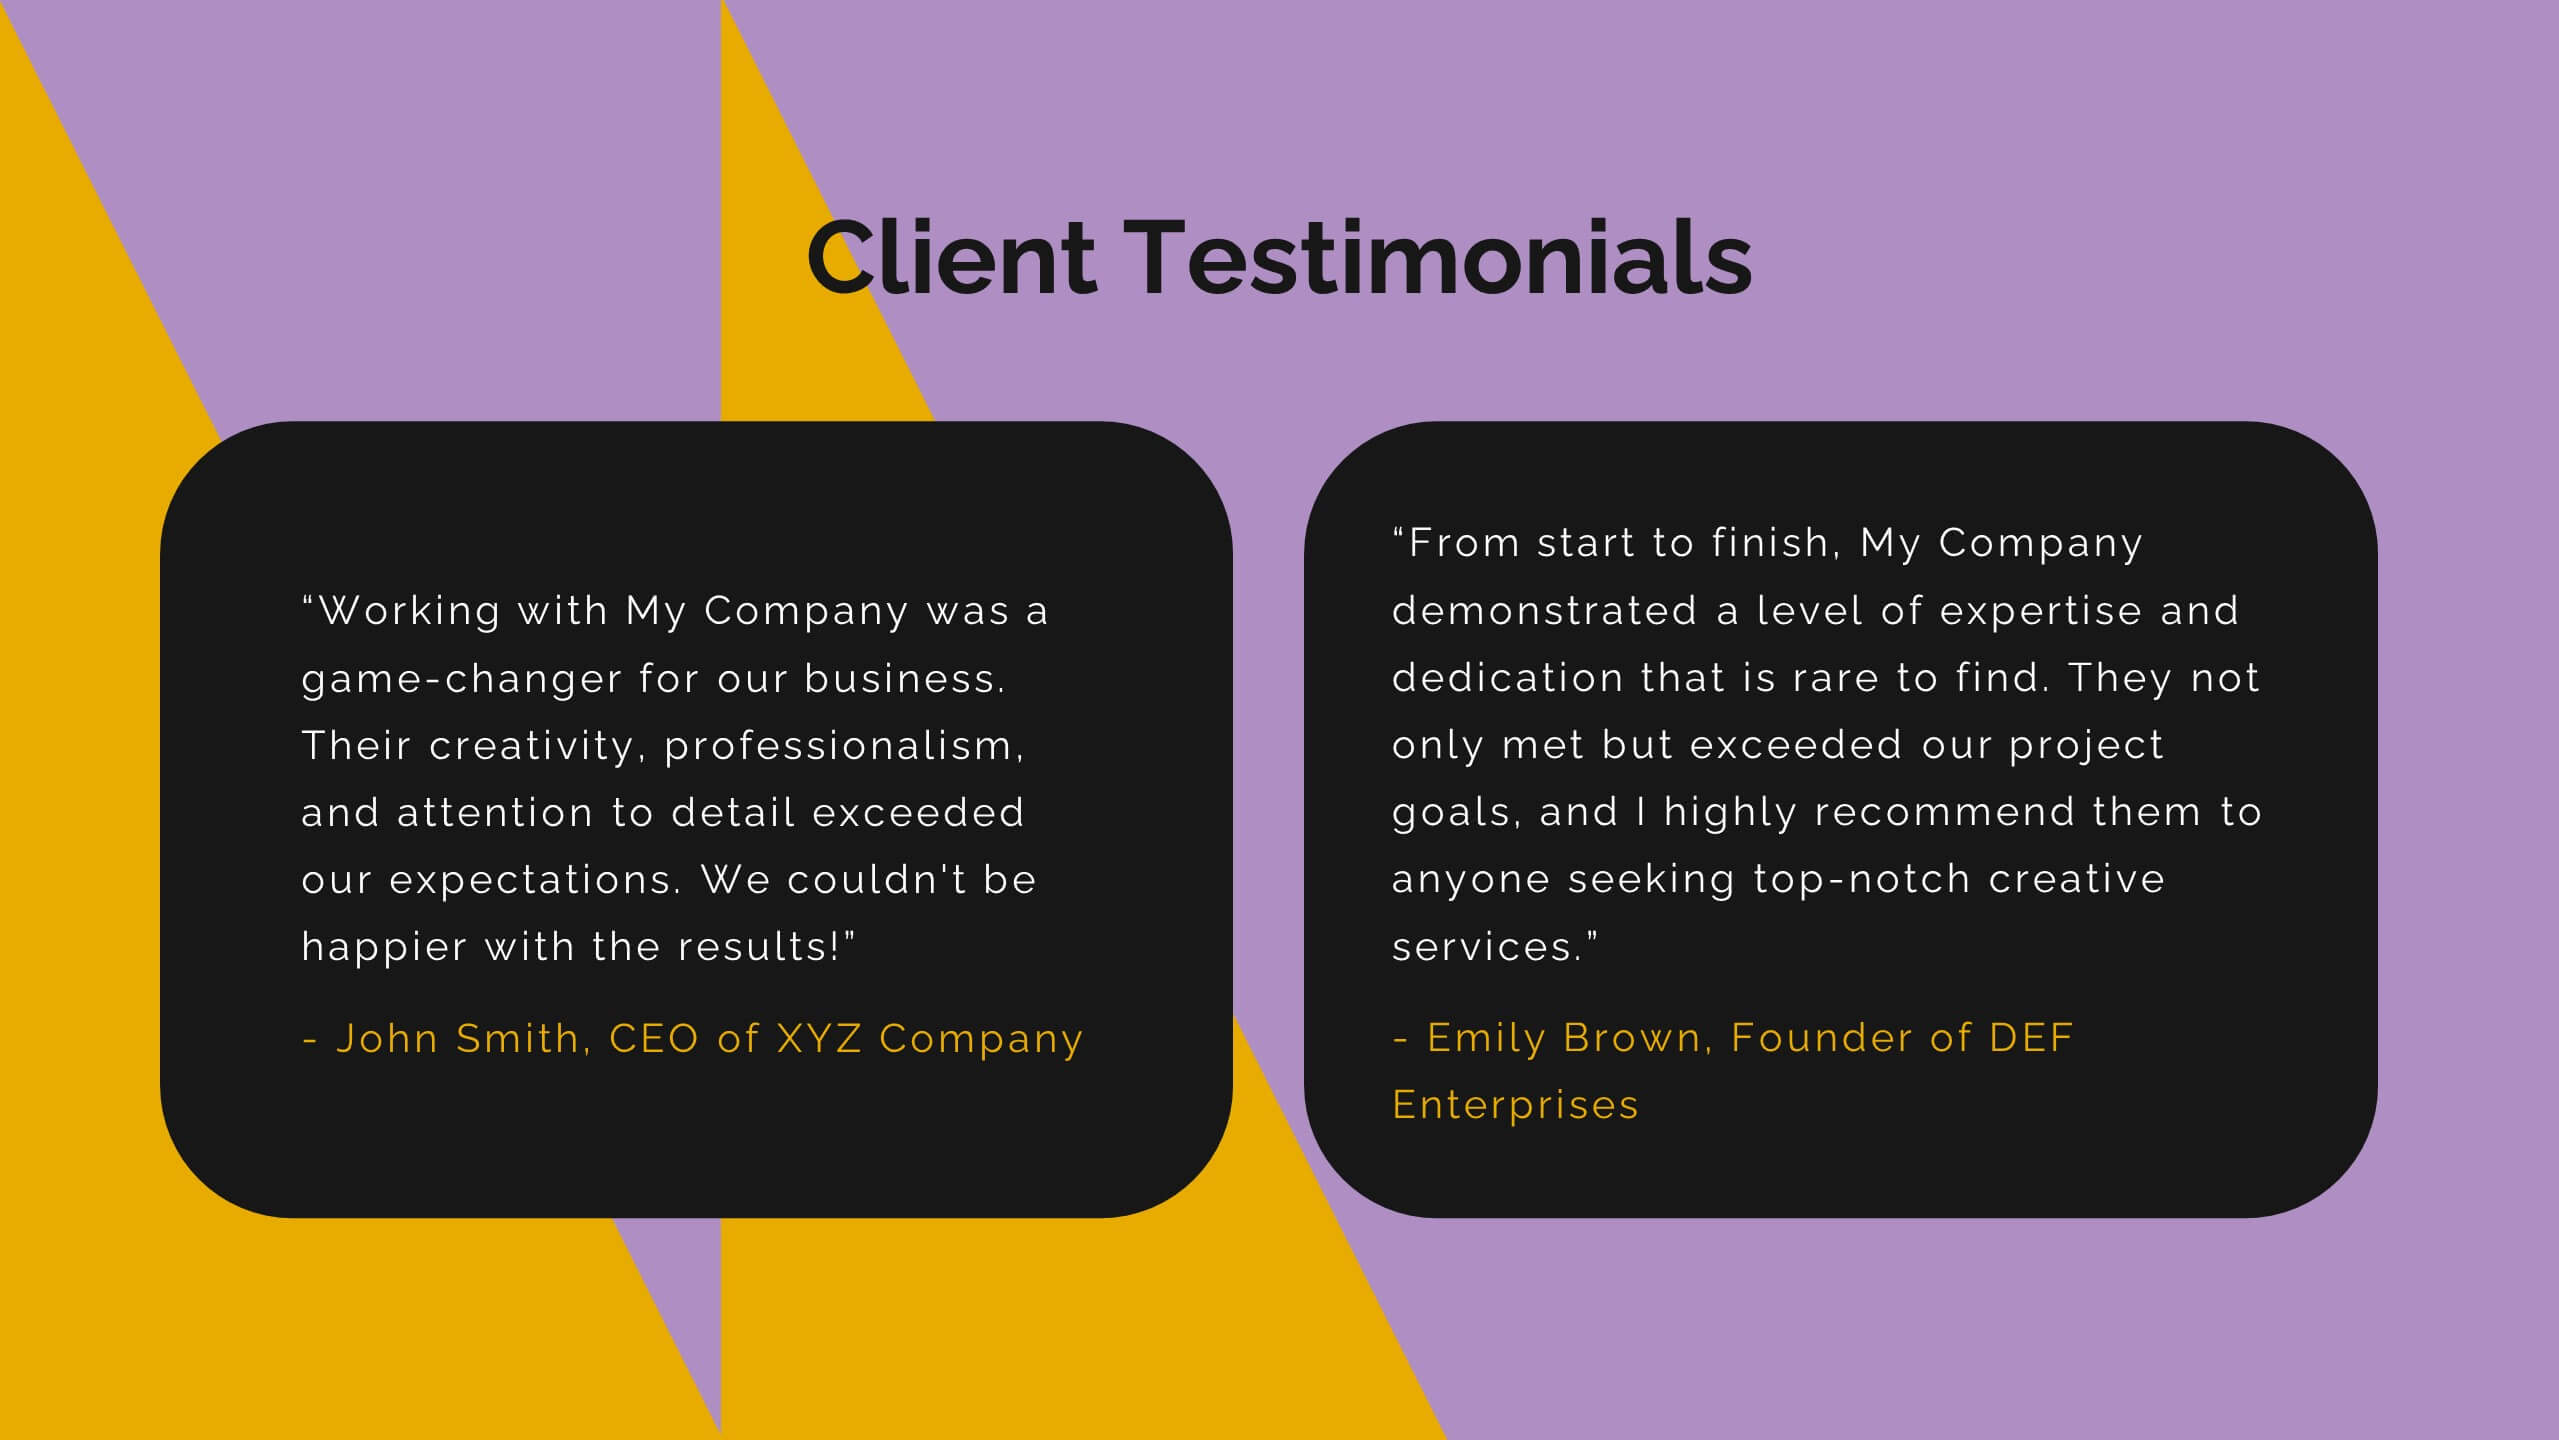
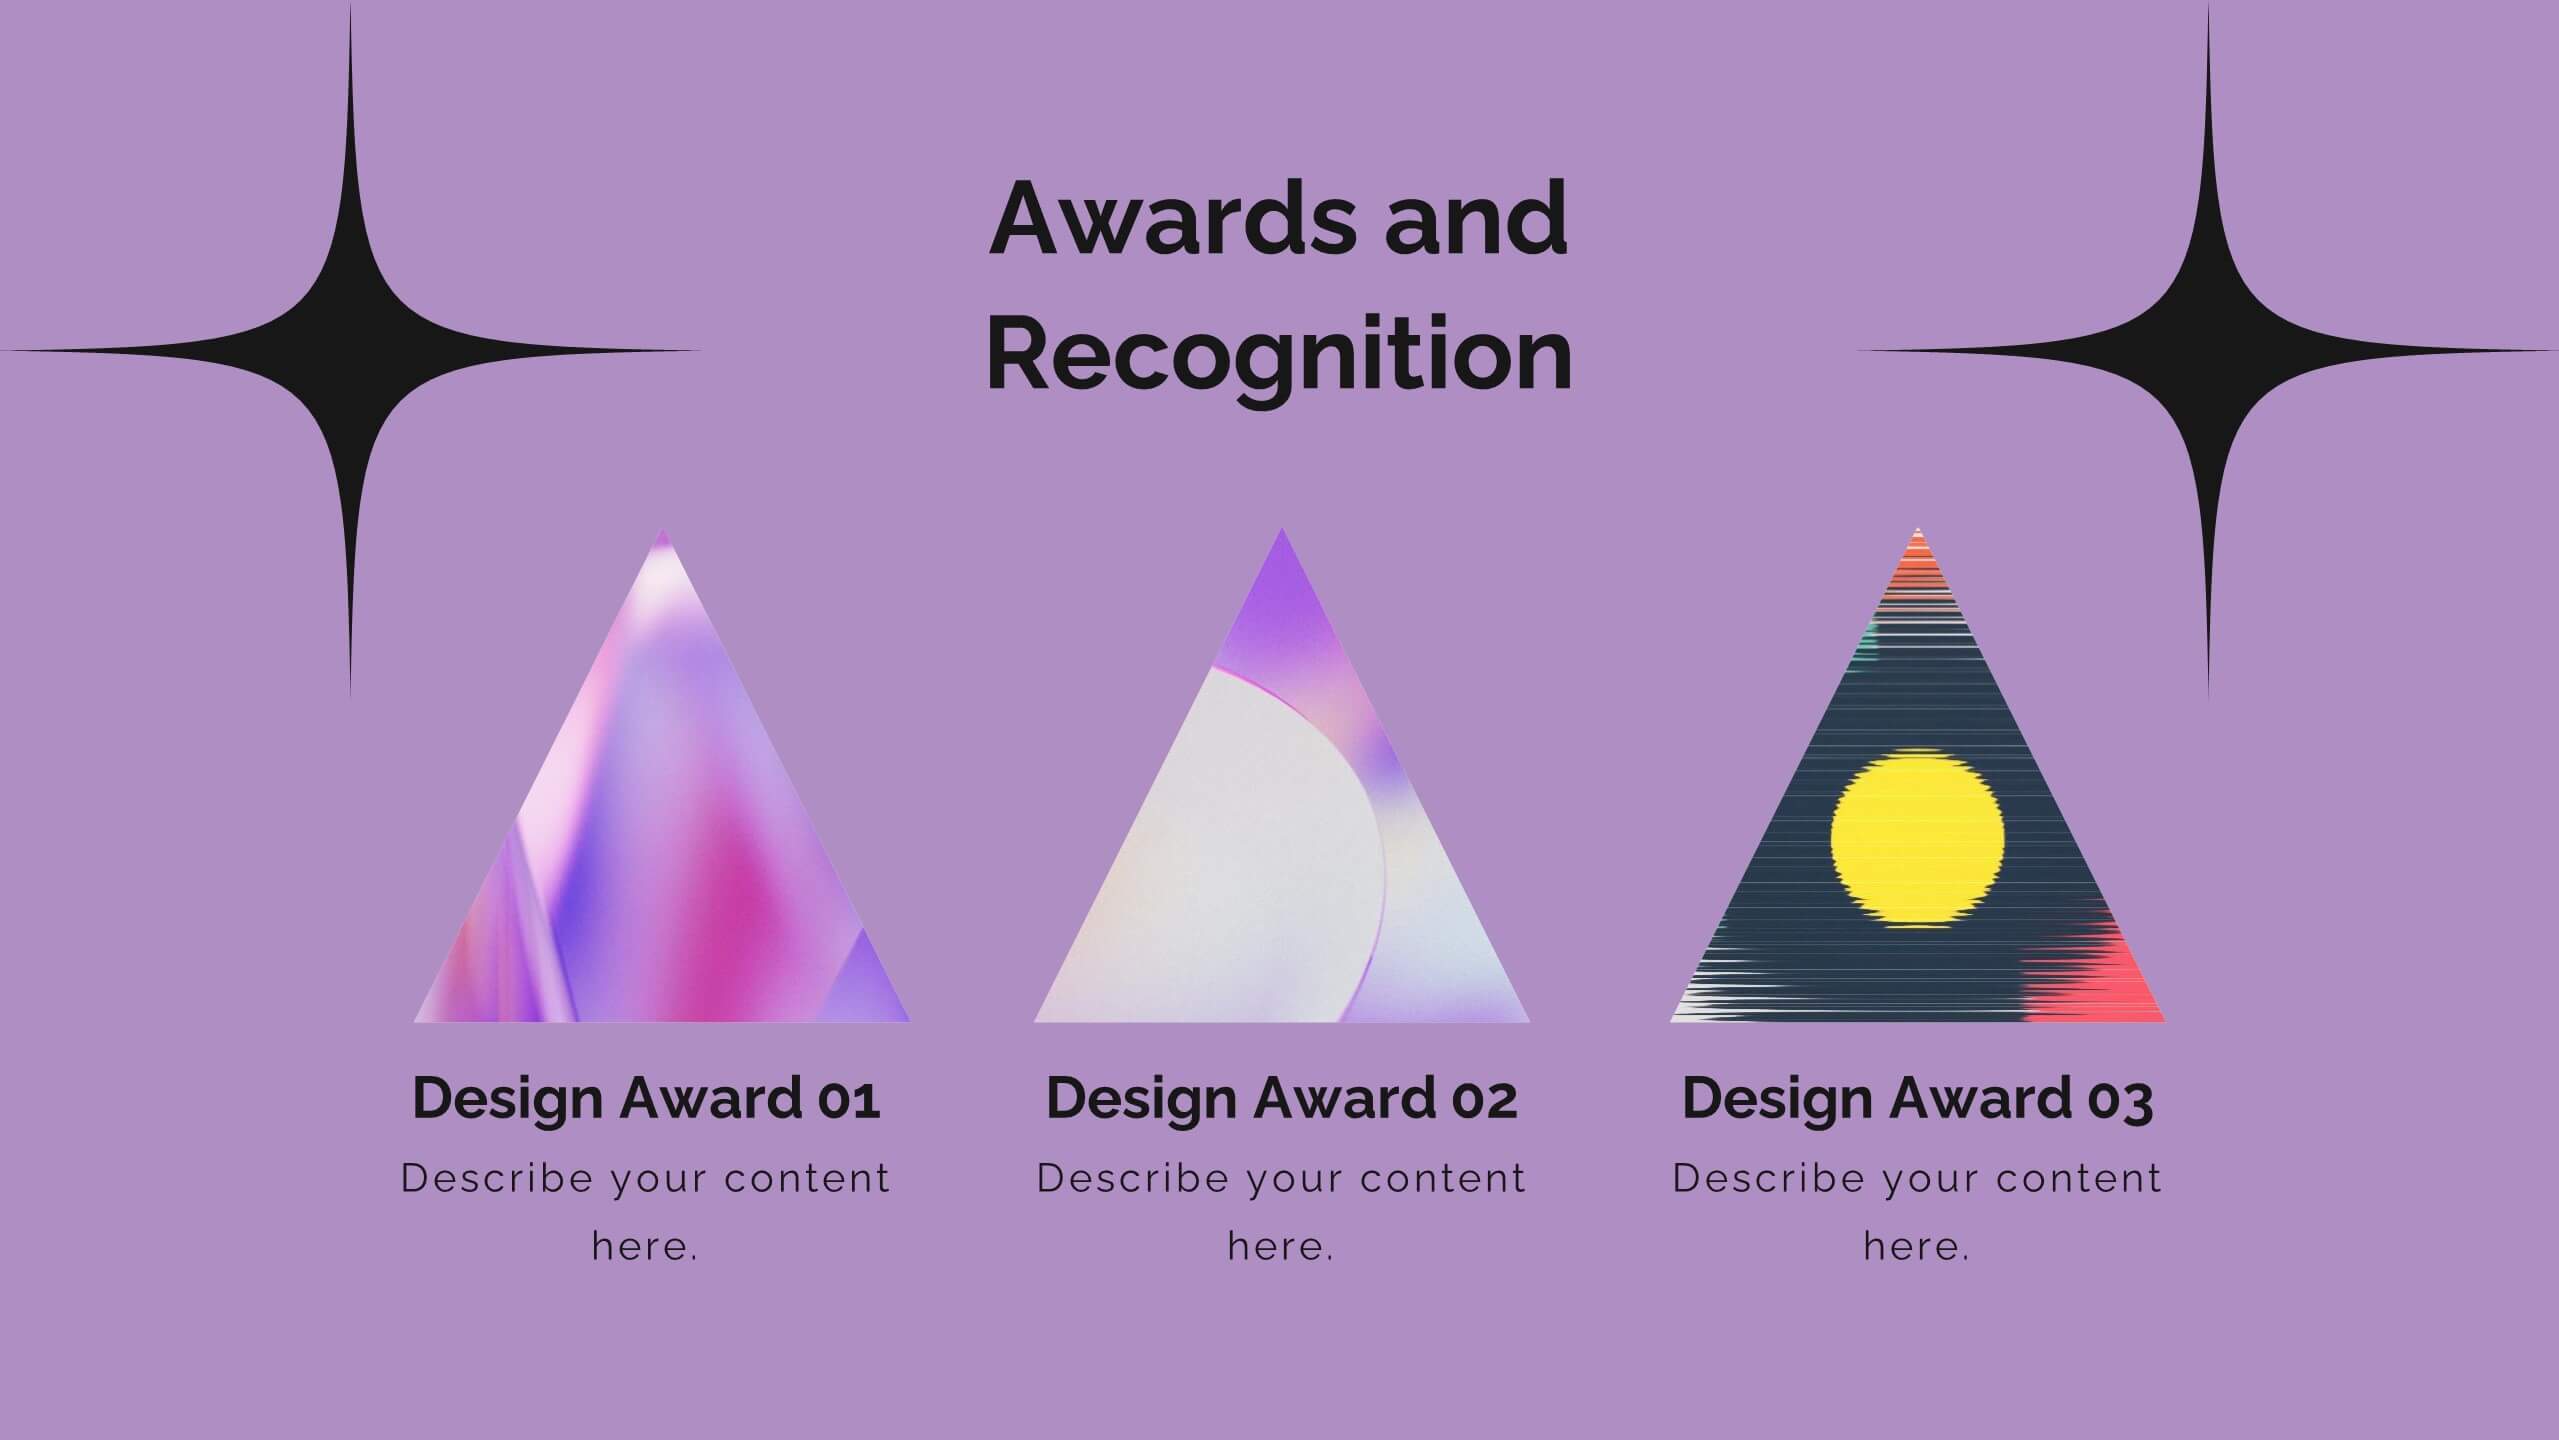
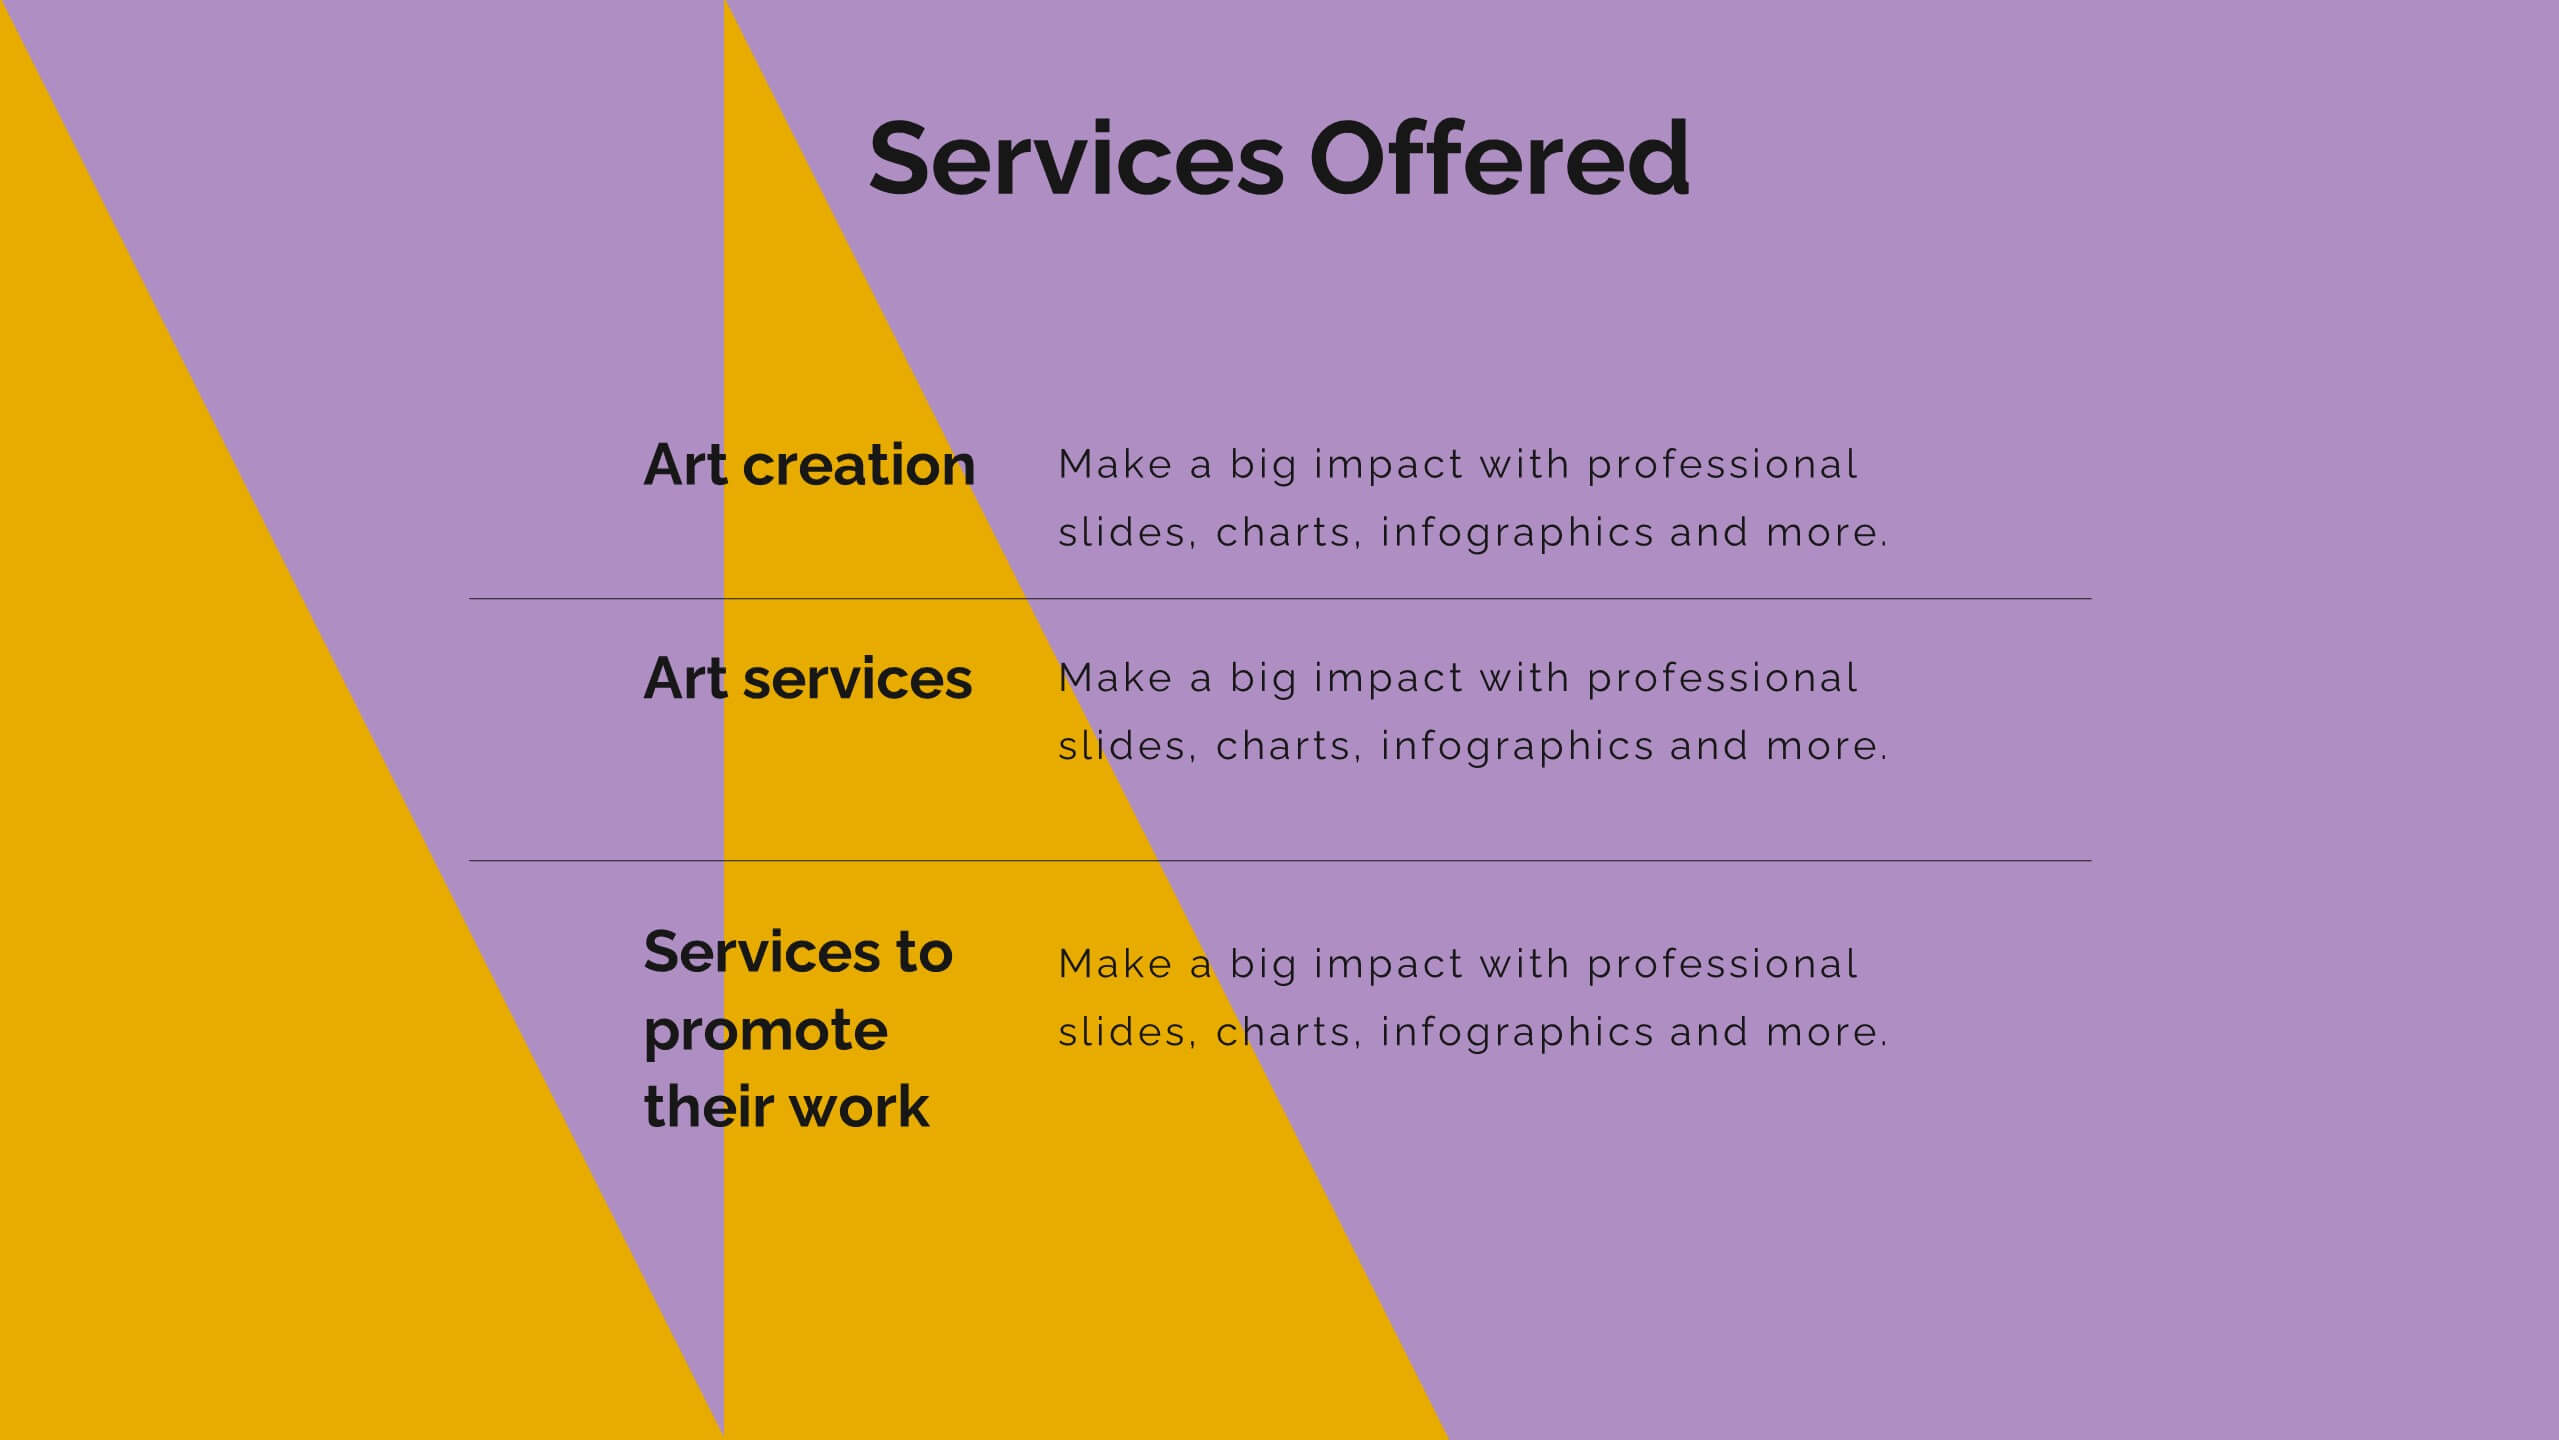
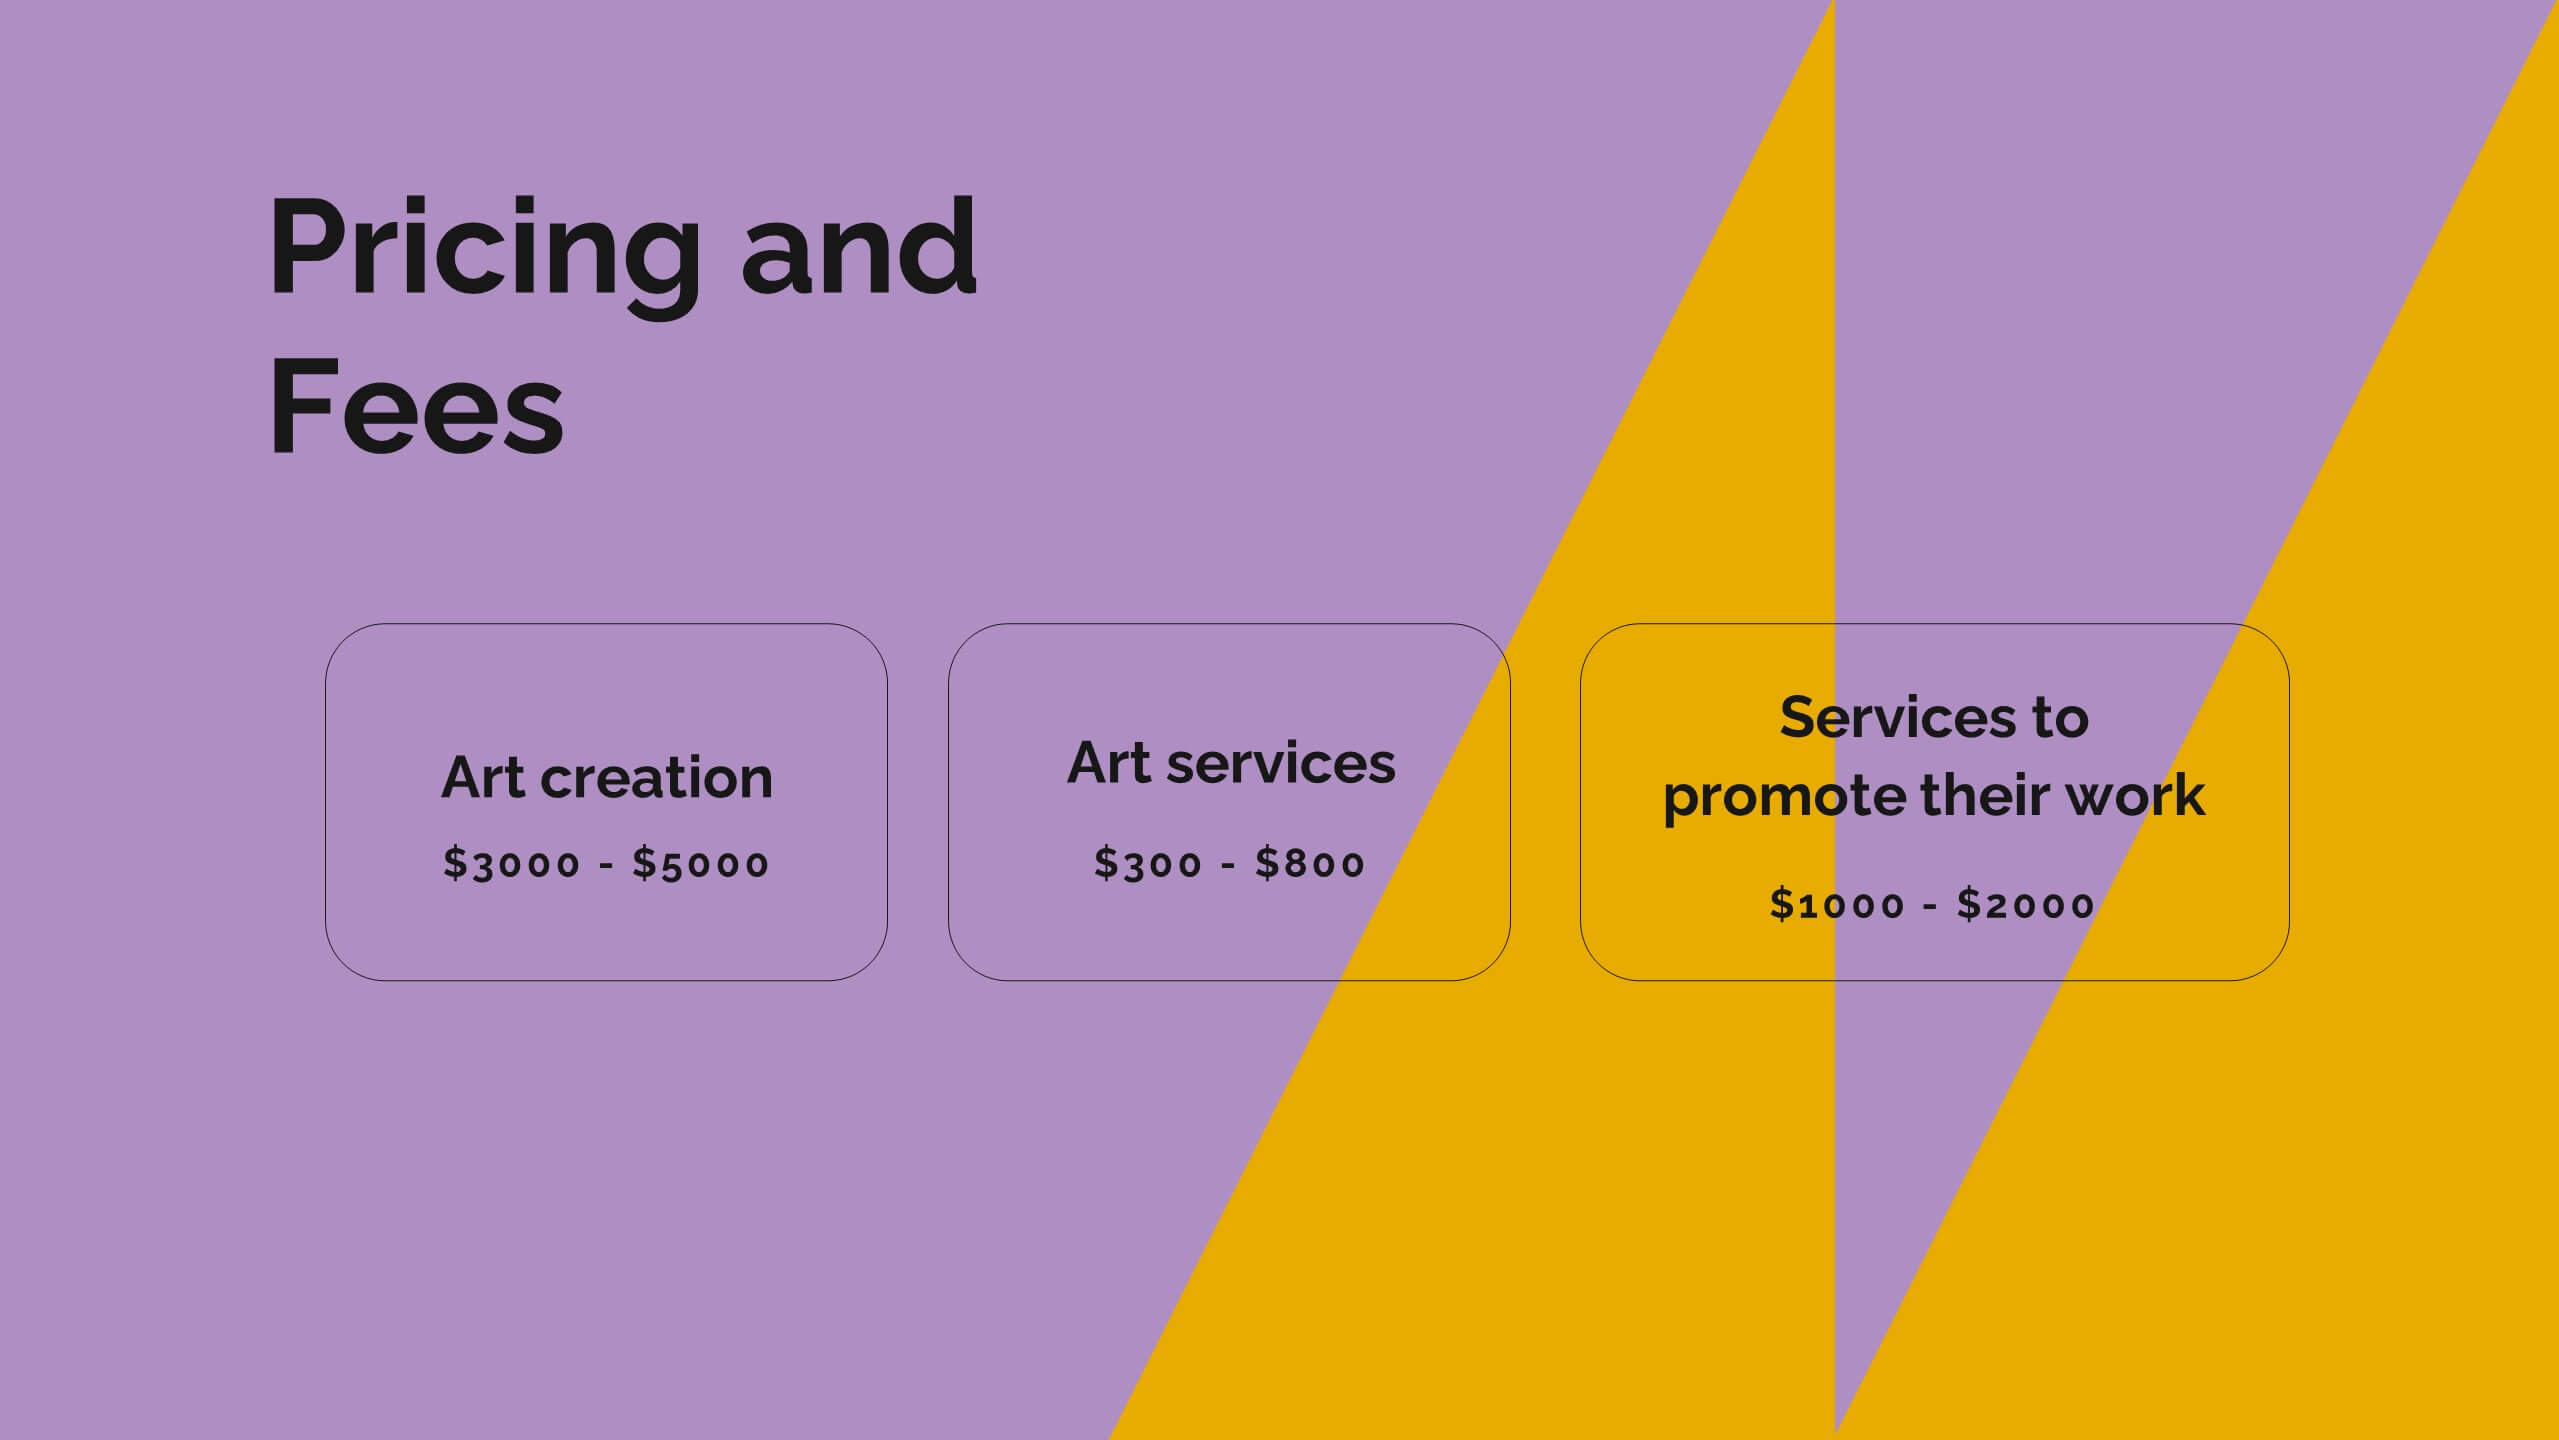
Vortex Artist Portfolio Template Presentation
Showcase your artistic brilliance with this eye-catching portfolio presentation template! Perfect for highlighting your projects, creative process, and awards, it features vibrant slides for your philosophy, collaborations, and client testimonials. Impress potential clients and collaborators with a stunning, well-organized portfolio. Compatible with PowerPoint, Keynote, and Google Slides for seamless presentations on any platform.


5 diapositivas
Customer Conversion with AIDA Framework
Present your sales strategy effectively with the Customer Conversion with AIDA Framework Presentation. This template breaks down the four key stages—Attention, Interest, Desire, and Action—into a clear and visually engaging funnel design. Perfect for marketing professionals, sales teams, and business strategists. Fully editable in PowerPoint, Keynote, and Google Slides.


5 diapositivas
Customer Behavior Pathway Visualization Presentation
Illustrate each step in the decision-making journey with this Customer Behavior Pathway Visualization presentation. Designed with directional arrows and dotted flow markers, this slide helps you map behavioral patterns across key stages—from awareness to loyalty. Ideal for sales, marketing, or UX teams. Fully editable in PowerPoint, Canva, and Google Slides.


6 diapositivas
Probability Venn Diagram Infographic
This infographic template displays a set of Probability Venn Diagrams. These are visual tools used to represent the logical relationships between different sets of items, commonly utilized in statistics. They are perfect for presentations to explain concepts like intersections, unions, and complements of sets. Each Venn diagram in the image varies in complexity and color scheme, providing a range of options to illustrate how individual sets overlap or differ, which is useful in showing probabilities, possible logical relations, and more. These diagrams can be especially helpful in business or academic settings where data relationships need to be clarified visually.


5 diapositivas
Poaching Effects Infographics
Navigate the critical issue of wildlife endangerment with our poaching effects infographics. Crafted in earthy tones of brown and tan, this informative and creatively styled vertical template sheds light on the harsh realities of illegal wildlife hunting. Whether you're an environmental activist, an educator, or part of an ecological research team, this infographic is structured to resonate with your audience, offering compelling visuals and thematic icons that starkly represent the consequences of poaching. It's more than a presentation; it's a call to global action, crucial for anyone advocating for wildlife preservation and aiming to inspire change through storytelling.


4 diapositivas
Decision Making with Option Comparison Presentation
Illuminate your choices with the Decision Making with Option Comparison Presentation. This slide uses a bold lightbulb illustration surrounded by icons to visually break down multiple options or solutions. Ideal for showcasing pros and cons, strategic alternatives, or scenario evaluations. Each option includes space for a clear title and supporting insights, making it easy to compare ideas side-by-side. Fully editable in PowerPoint, Keynote, and Google Slides—perfect for business strategy sessions, team decisions, or client pitches.


5 diapositivas
Social Media Marketing Infographics
Social Media Marketing is an essential component of any modern marketing strategy. These vertical infographics can be used to provide valuable insights into the most effective social media platforms, the latest trends in social media marketing, and tips and strategies for optimizing social media campaigns. These are an excellent way to communicate complex information in an easy-to-digest format and can be used for marketing and educational purposes. Use these infographics to Include data on user demographics, engagement rates, platform-specific best practices, and industry benchmarks.


6 diapositivas
Organizational Structure Framework Presentation
Unlock the potential of your organization with our Organizational Structure Framework template. This versatile tool is designed to help you present and analyze various business structures, from chain-of-command to functional divisions. Ensure clear, concise communication of strategies across your organization. Perfect for use in PowerPoint, Keynote, and Google Slides, this template supports a professional presentation of your organizational strategy, ensuring alignment and clarity in your business processes.


6 diapositivas
Project Timeline Infographic Presentation
Streamline your workflow with this Project Timeline Infographic template. Perfect for visualizing milestones, tracking progress, and organizing tasks, this design is fully editable to suit any project needs. Adjust colors, icons, and text effortlessly. Compatible with PowerPoint, Keynote, and Google Slides for smooth presentations and collaboration.


2 diapositivas
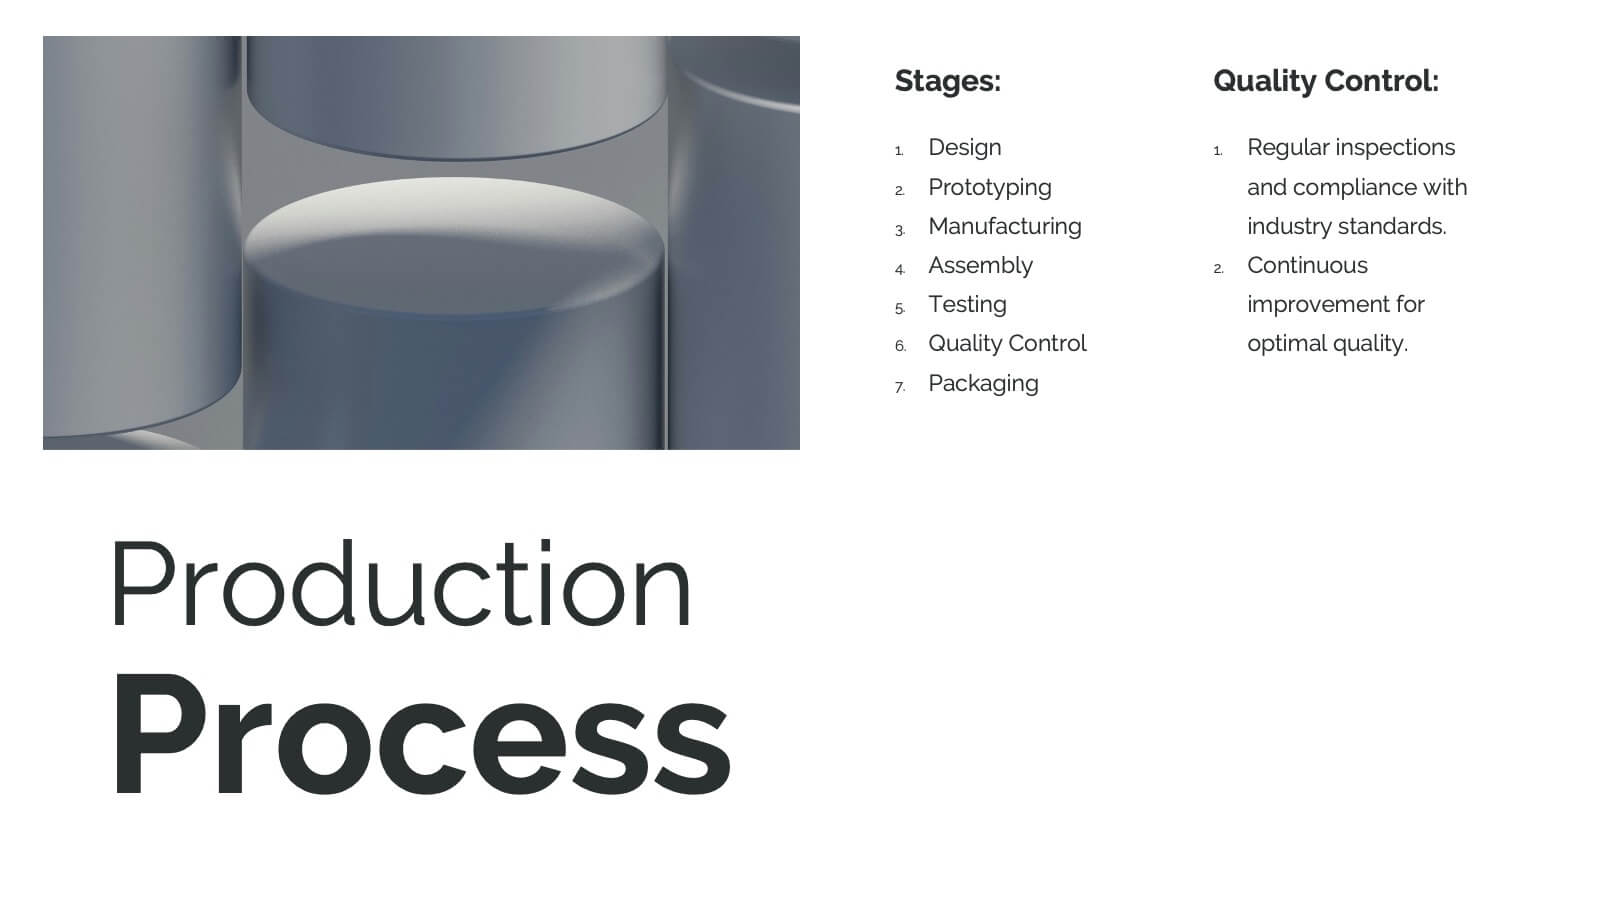
Professional Cover and Title Layout
Make a bold first impression with this stylish and modern cover slide template. Featuring a balanced design of imagery and typography, it's perfect for business reports, marketing decks, or strategic plans. Fully editable in PowerPoint, Keynote, and Google Slides for effortless customization.


4 diapositivas
Product List Table for Quick Overview
Showcase product highlights at a glance with the Product List Table for Quick Overview Presentation. This sleek, column-based layout allows you to compare up to three product categories or service features side by side. Each section includes an icon, title, and space for three concise text rows—ideal for summarizing specifications, benefits, or pricing tiers. Fully editable in PowerPoint, Keynote, and Google Slides.


7 diapositivas
Startup Infographic Presentation Template
A Startup Infographic is a visual representation of information related to starting a new business, including important data, statistics, and information about the process of launching a startup company. The aim of our startup infographic is for you to present information in an easily digestible and visually appealing manner. Help to communicate complex concepts to an audience and the steps involved in starting a new business. Use this template to make presentations that’ll blow your audience away. This layout is flexible, adaptable and compatible with Powerpoint, Keynote, and Google Slides.


5 diapositivas
Four-Step Customer Experience Framework Presentation
Showcase your customer journey with this sleek, step-by-step visual. Featuring a stair-step arrow design, it’s ideal for highlighting stages in user experience, onboarding, or service improvement. Each step is editable, with icons and titles for clarity. Compatible with PowerPoint, Keynote, and Google Slides—perfect for marketers, strategists, and CX professionals.


26 diapositivas
Carson Presentation Template
If you want a futuristic and bold design, this is the presentation template for you. The colors are bold and captivating to the eye. The font goes with technology and security. We designed the template to provide a magnificent structure for information. It's easy to use, resulting in high quality presentations. Since the colors are editable, you can personalize this presentation by adding colors that tie directly back to your company and its image. This template can be used for both personal use as well as professional use. Enhance your details with our Carson template for your next project.


6 diapositivas
Project Cycle Infographics
The "Project Cycle" infographic template is a meticulously designed resource, ideal for project managers, team leaders, and business analysts. This template facilitates a clear and comprehensive presentation of the various stages involved in a project, from initiation to completion. This template encompasses essential elements of the project cycle, including project initiation, planning, execution, monitoring, and closure. The structured design ensures each phase is distinctly represented, allowing for detailed exploration of timelines, resource allocation, and milestone achievements. This makes it an excellent tool for project planning meetings, stakeholder briefings, and team workshops. The design is professional and methodical, featuring a color scheme that is both engaging and indicative of progression and clarity. This not only enhances the visual appeal of the presentation but also aids in effectively communicating the sequential and cyclical nature of project management. Whether it's used in corporate boardrooms or educational settings, this template guarantees that your project cycle is presented in a detailed, visually compelling, and easily understandable manner.


5 diapositivas
Multi-Level Concentric Circles Framework Presentation
Visualize relationships and layered strategies with the Multi-Level Concentric Circles Framework Presentation. This template uses interlinked circular nodes to represent multi-tier systems, process flows, or strategic components in an intuitive layout. Easily editable in PowerPoint, Keynote, and Google Slides for seamless integration into your presentations.


20 diapositivas
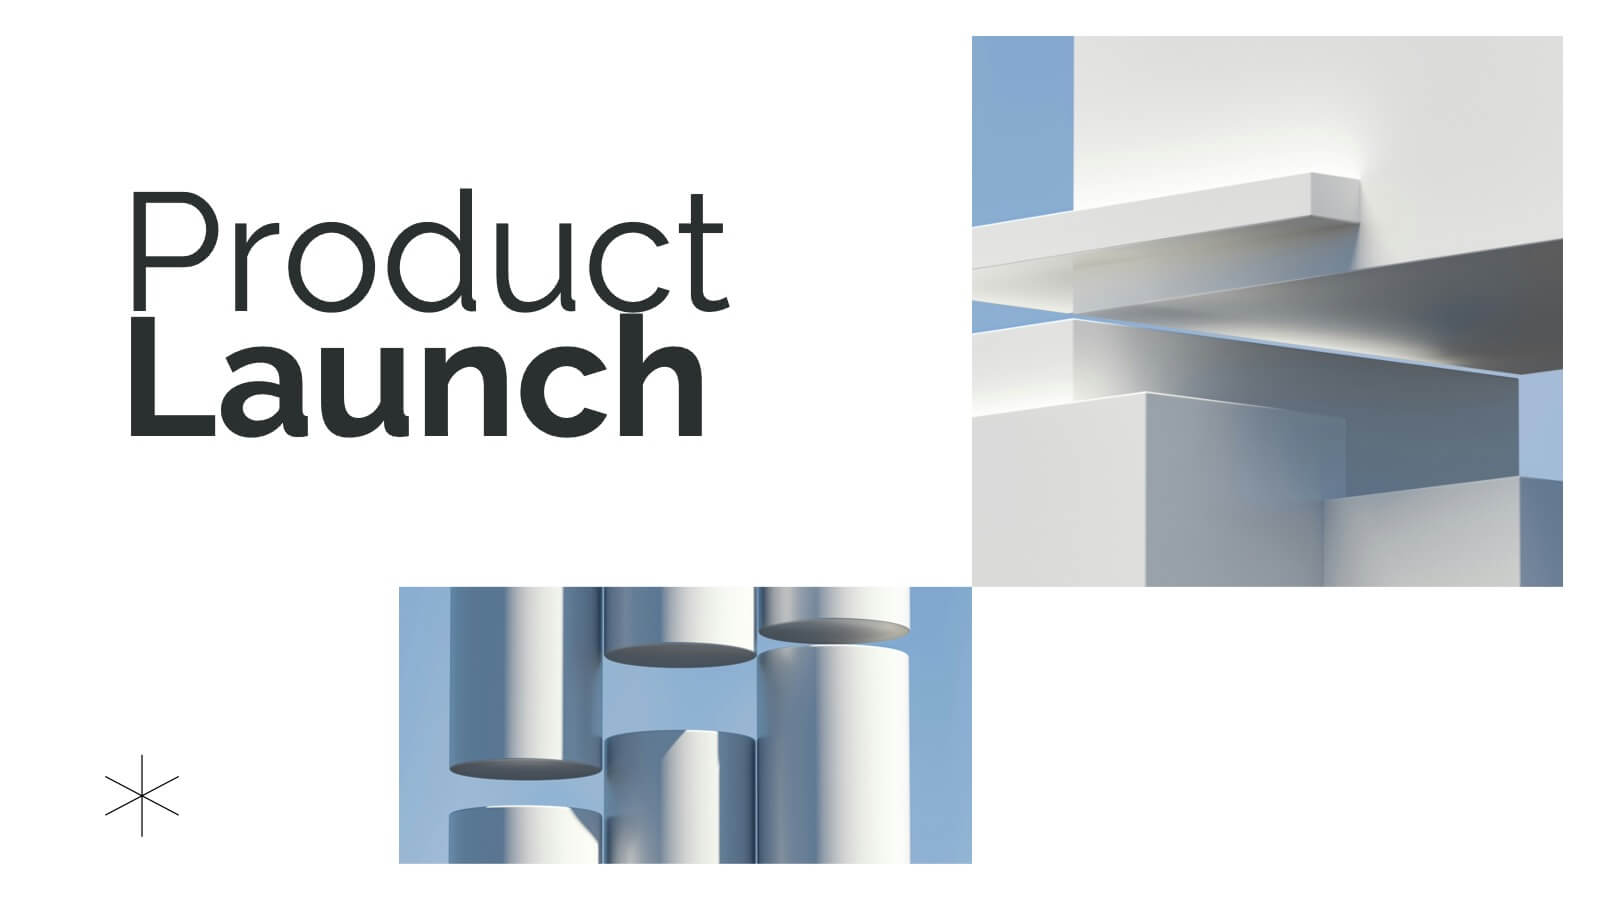
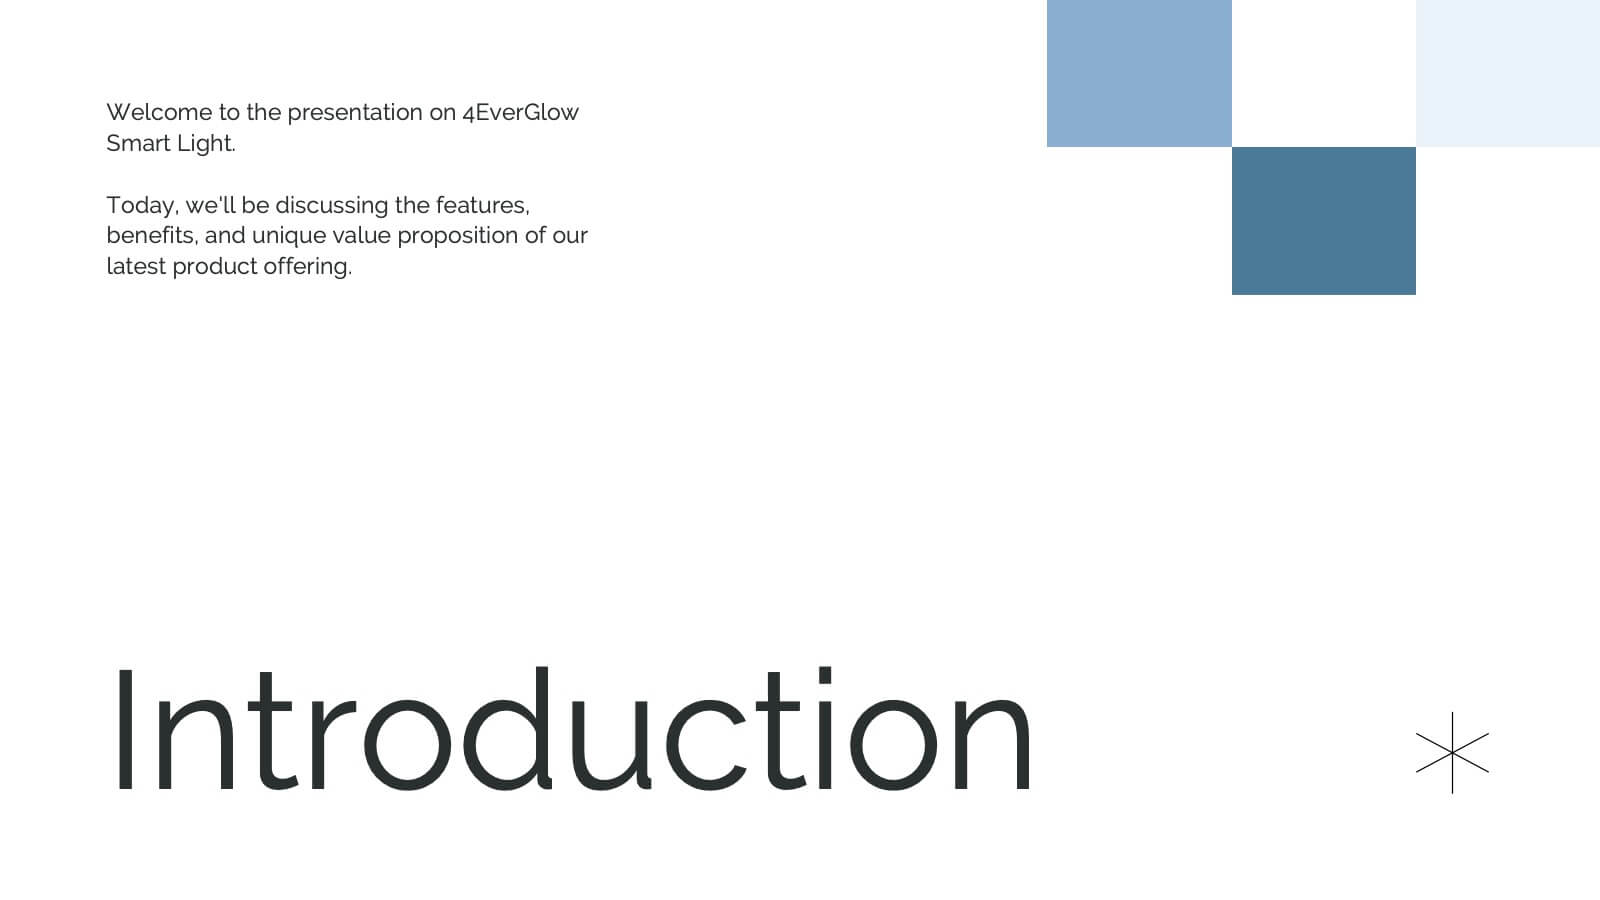
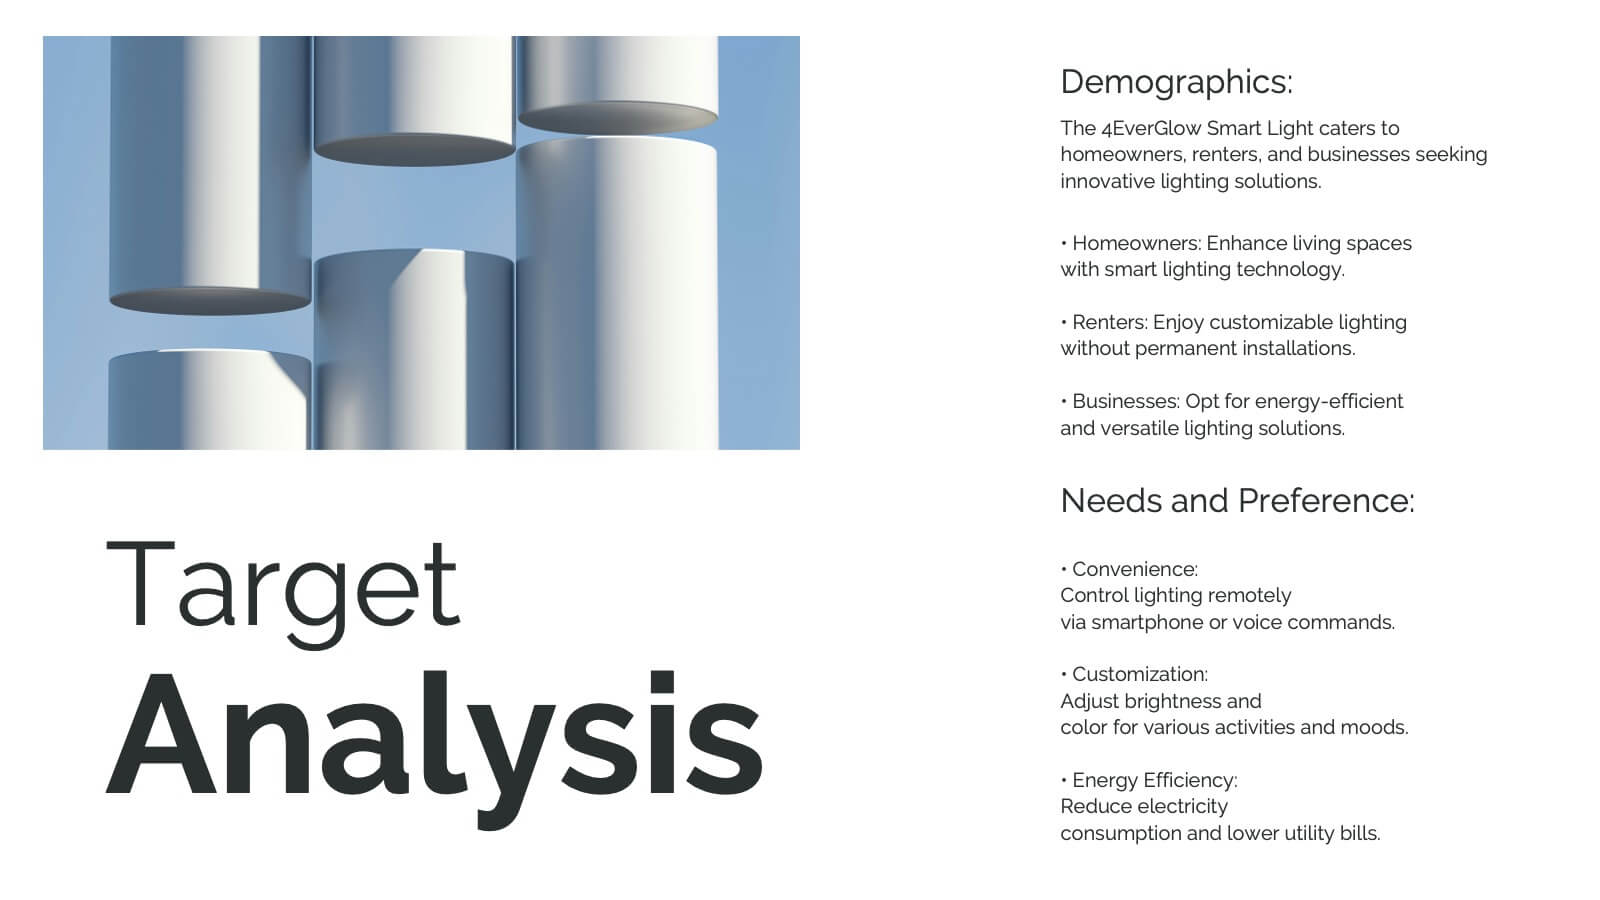
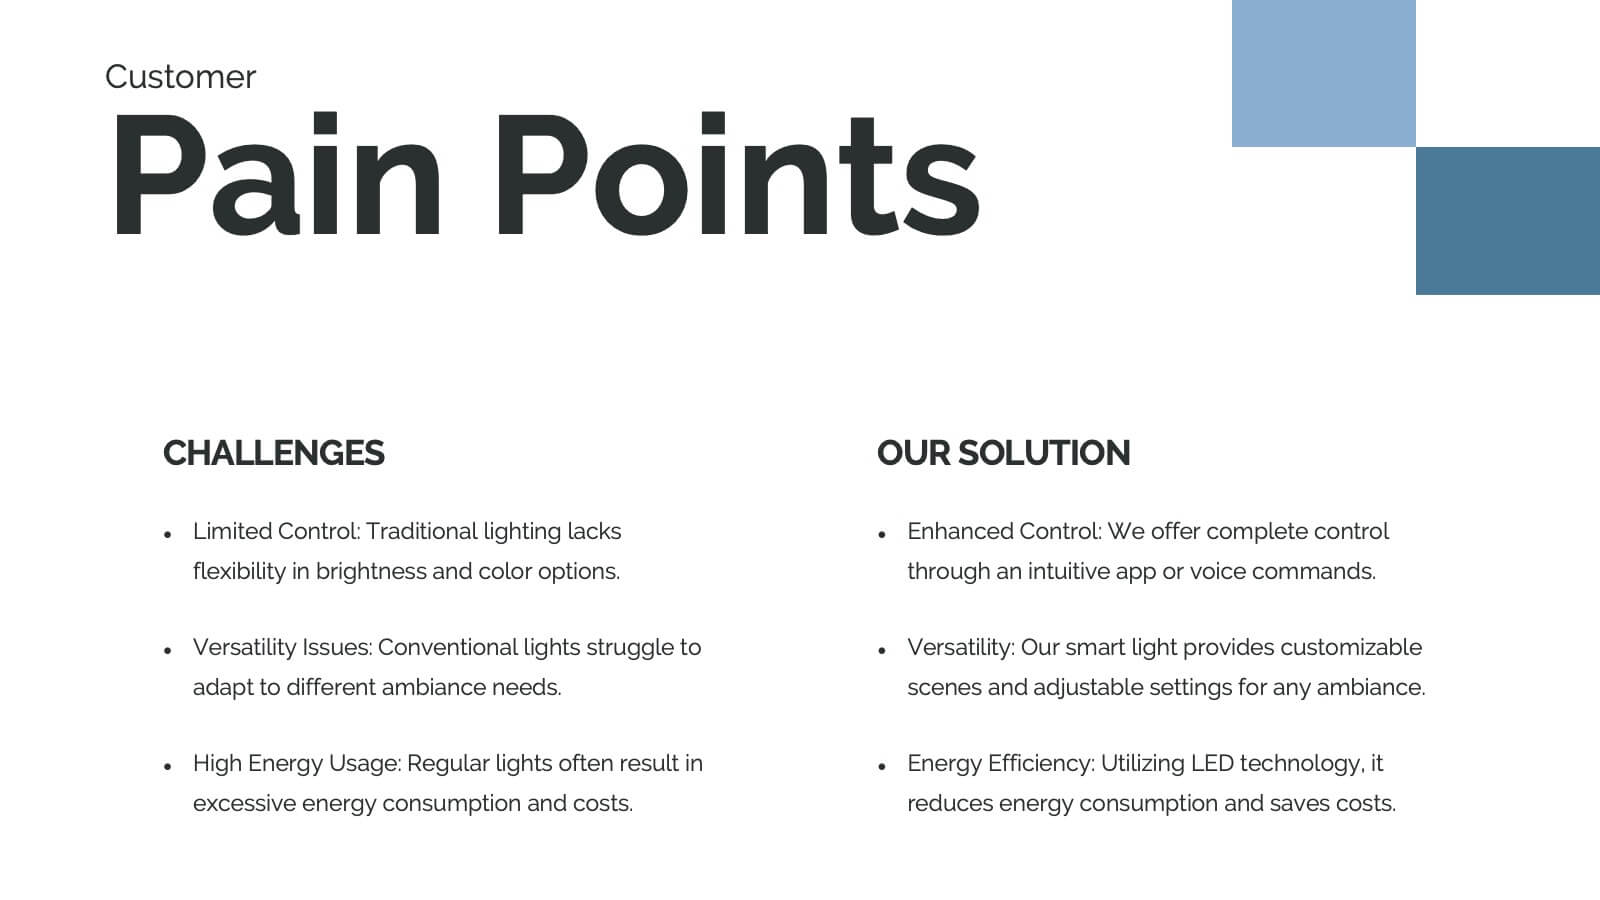
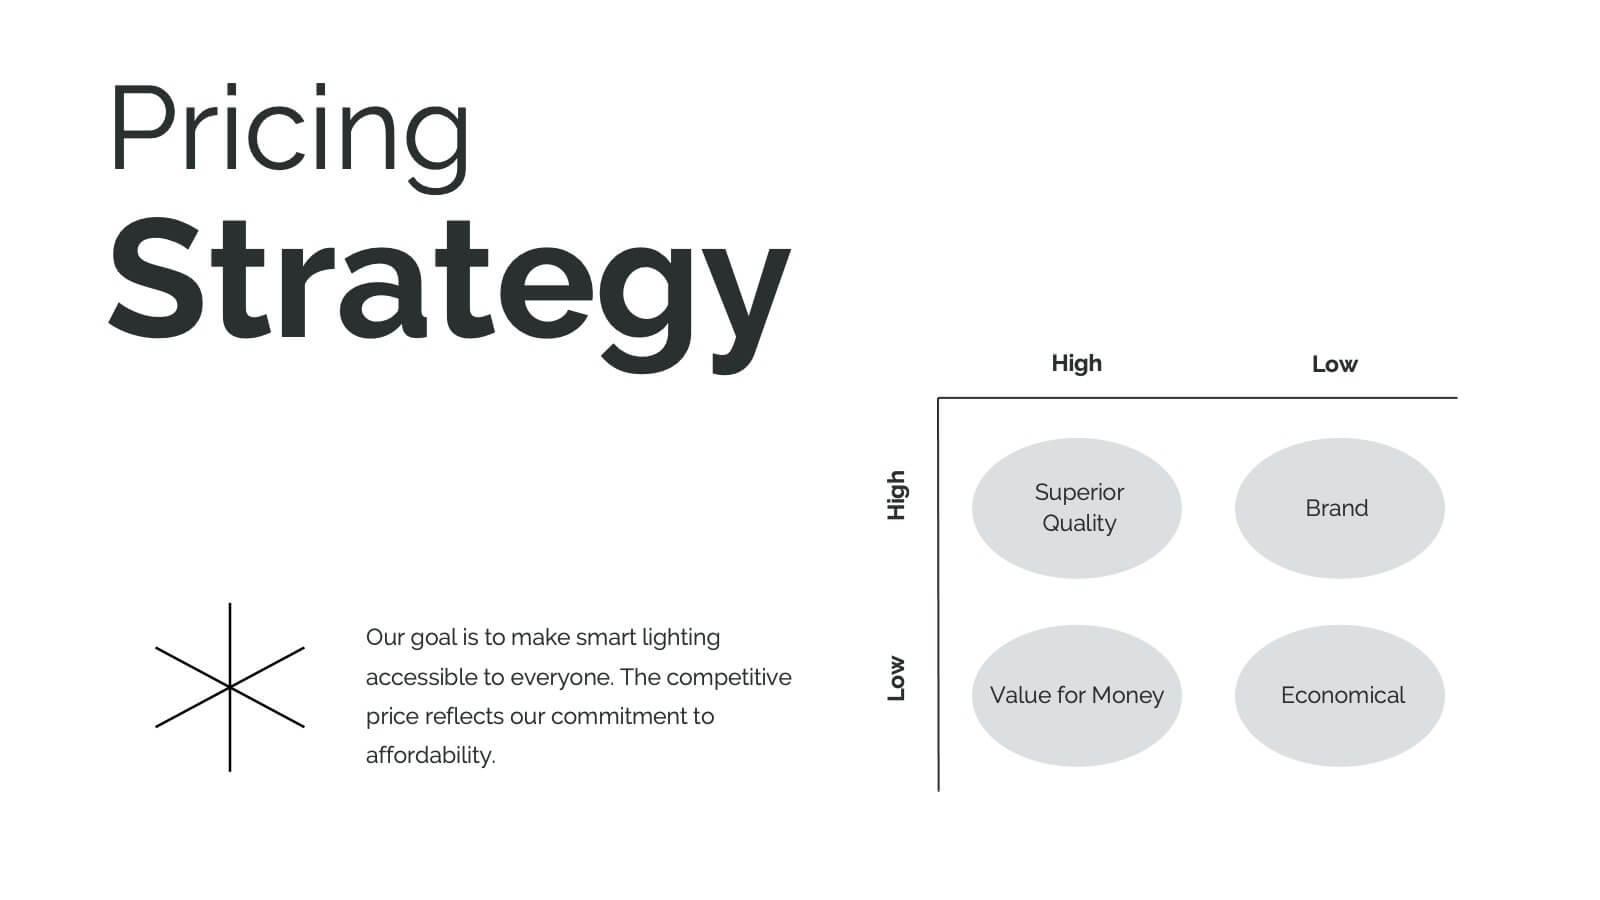
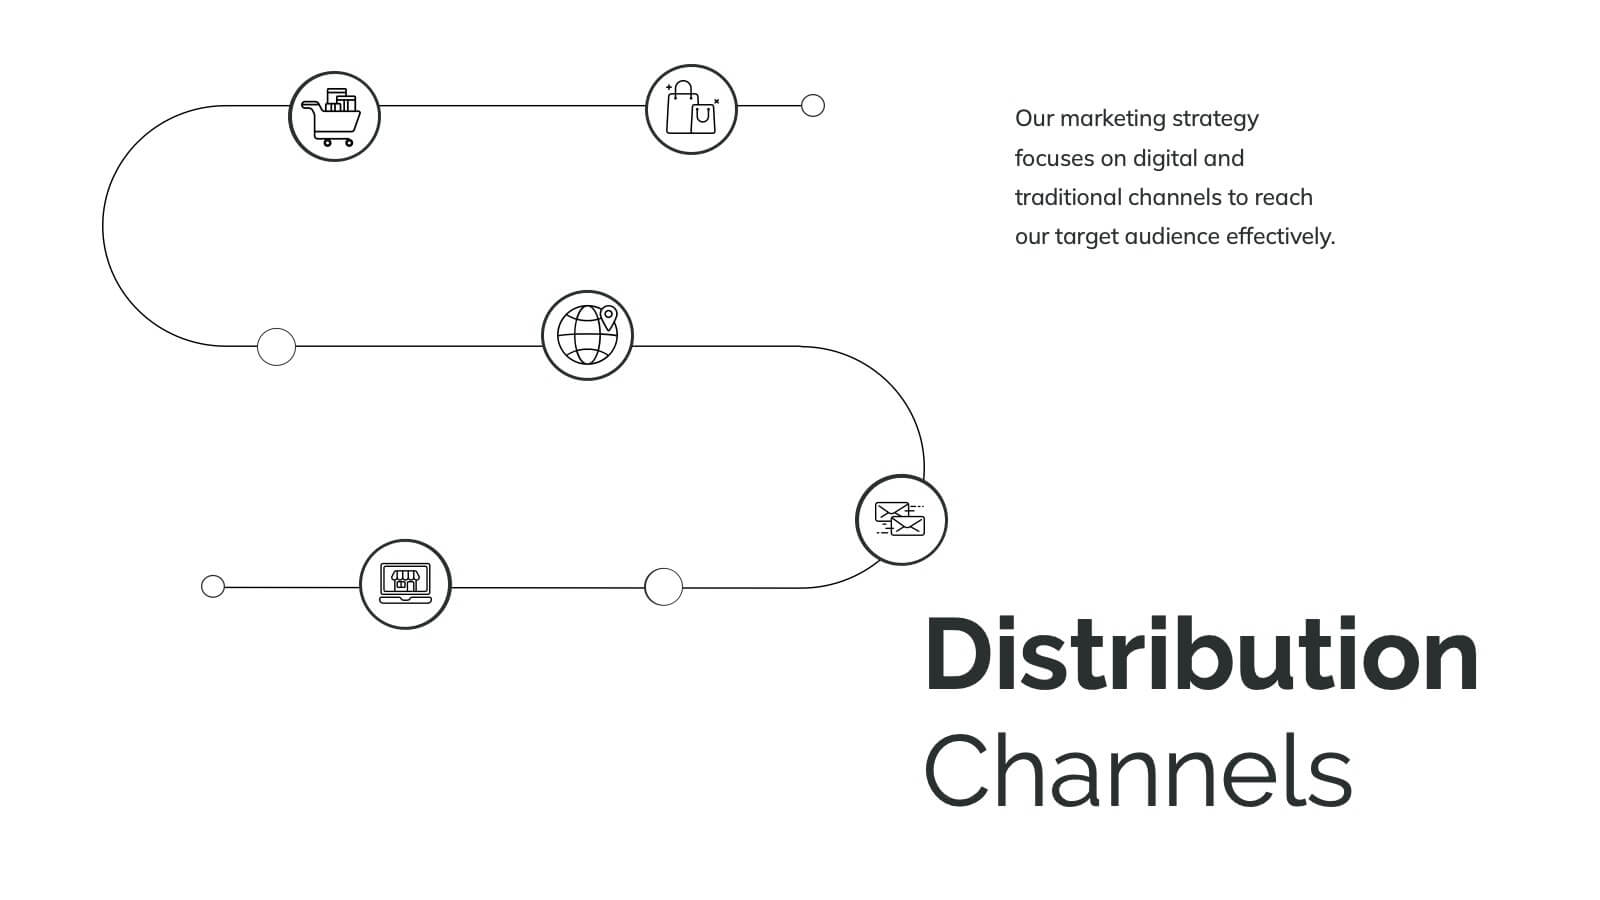
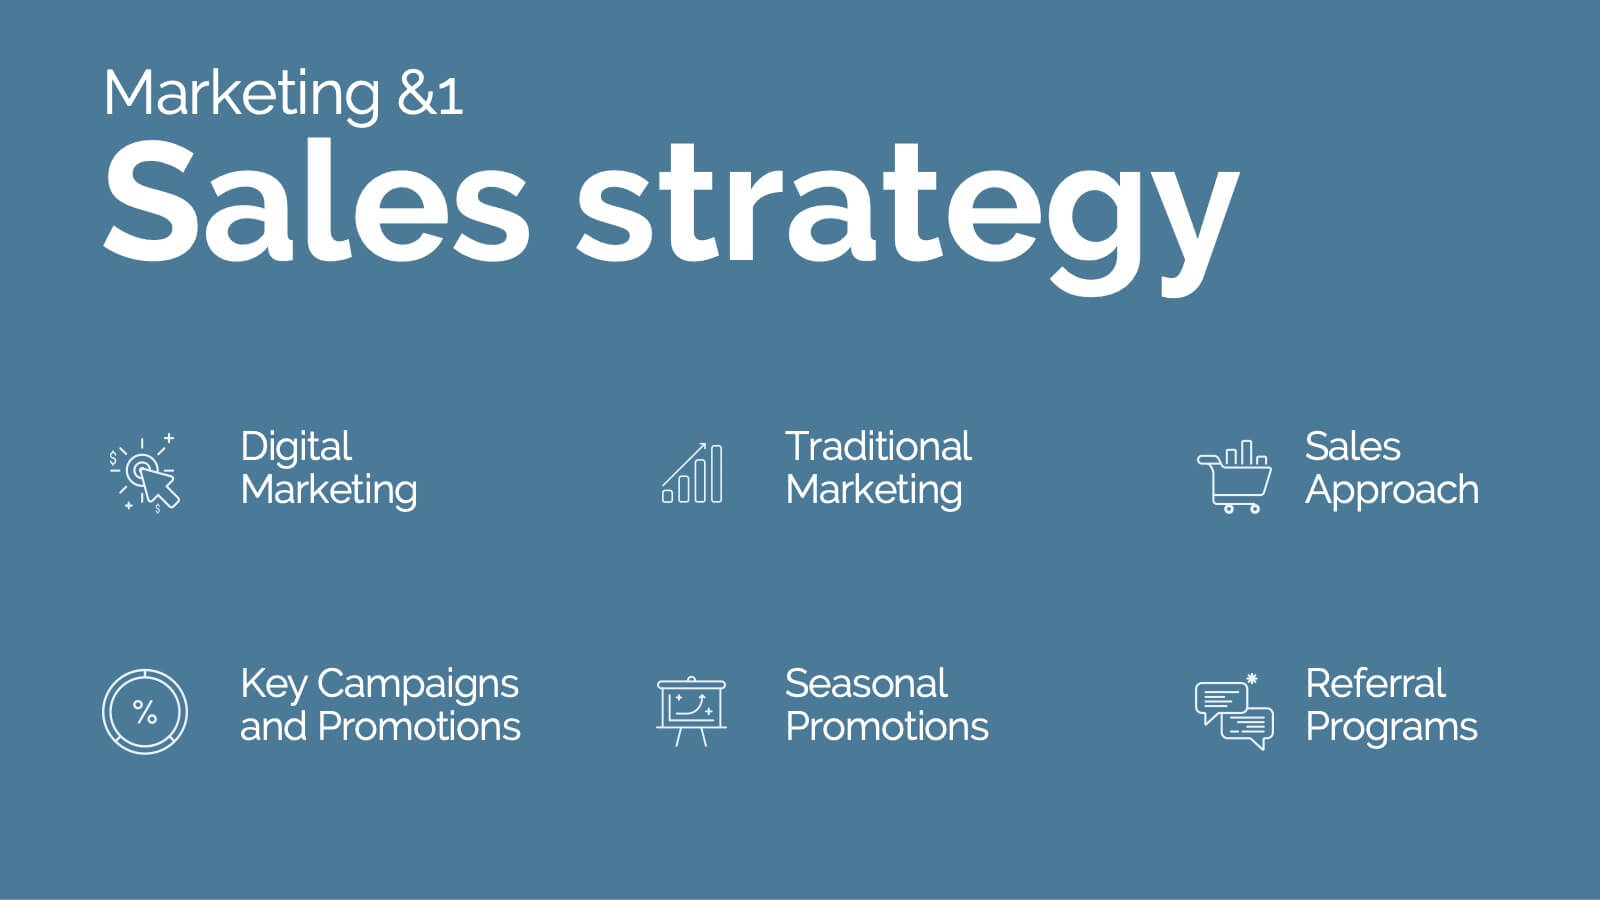
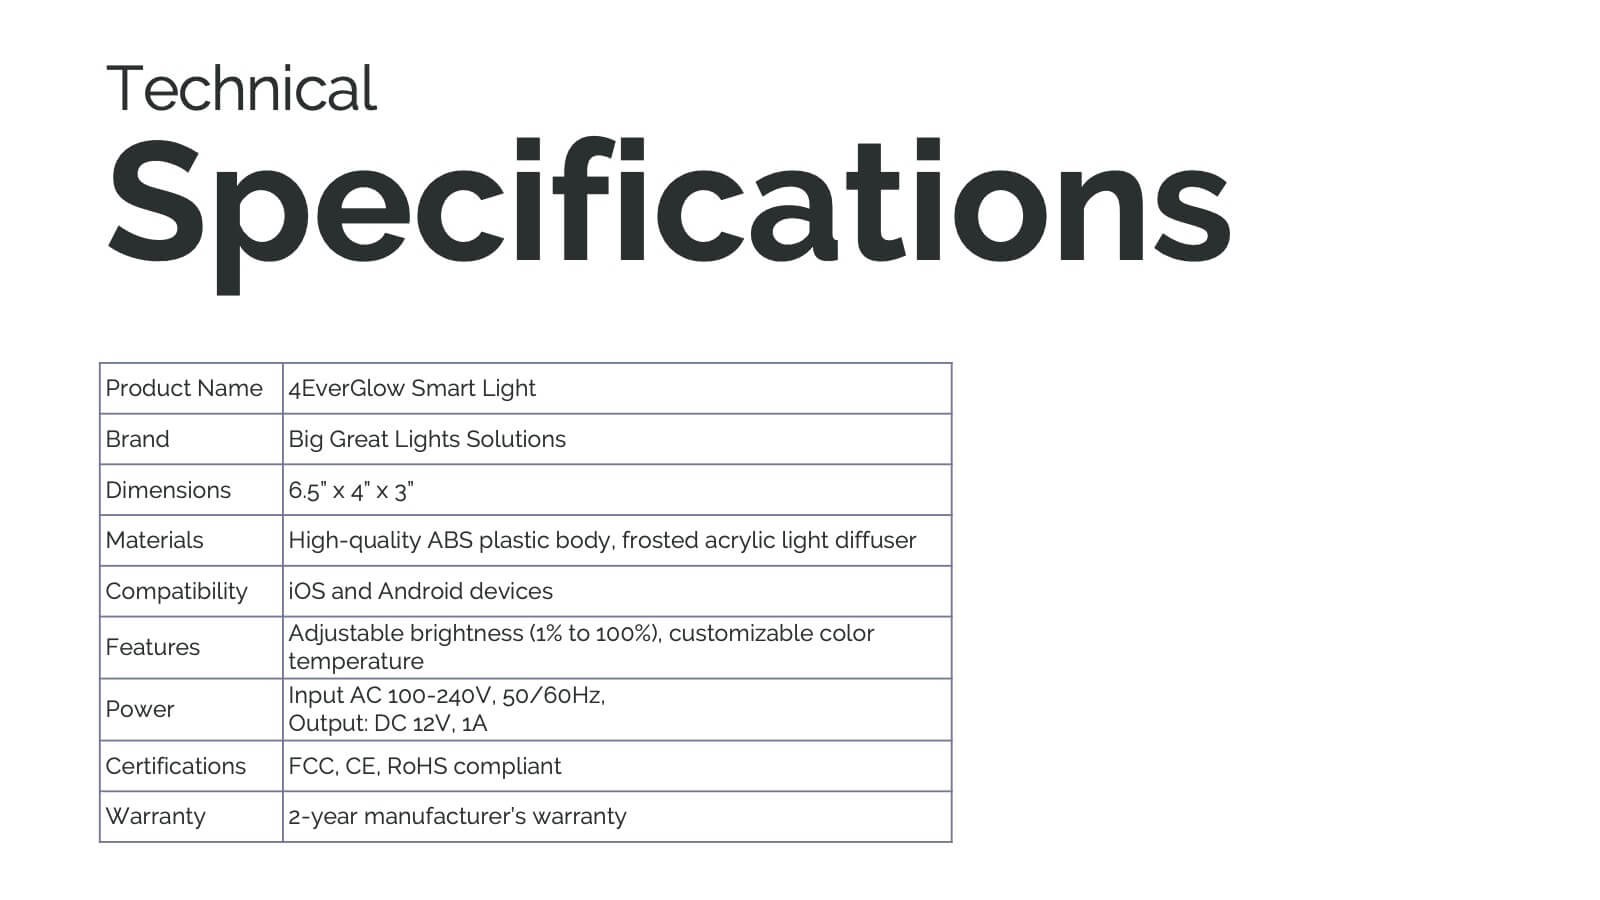
Hydra Product Launch Presentation
Unveiling your latest product has never been easier or more captivating! This comprehensive presentation template covers every aspect of your product's journey—from launch to competitive analysis. Engage your audience with detailed slides on features, target analysis, and pricing strategy. Seamlessly compatible with PowerPoint, Keynote, and Google Slides for maximum flexibility and impact.