


Características


¿Tienes alguna pregunta?
Recomendar


8 diapositivas
Annual Business Performance Report Presentation
Visualize your company’s progress with the Annual Business Performance Report Presentation. This sleek, data-driven template combines donut charts and bar graphs to showcase KPIs, milestones, and key achievements. Perfect for year-end summaries and stakeholder updates. Fully editable in Canva, PowerPoint, and Google Slides for easy customization and professional results.


6 diapositivas
Bubble Chart Data Visualization Presentation
Make your data pop with visuals that tell a story at a glance. This modern presentation transforms raw numbers into clear, engaging bubble charts that simplify complex insights and comparisons. Fully editable and compatible with PowerPoint, Keynote, and Google Slides for effortless customization and professional results.


3 diapositivas
Corporate Law and Regulation Guide Presentation
Clarify legal structures with the Corporate Law and Regulation Guide Presentation. This visually balanced design uses legal scale and book icons to symbolize authority, compliance, and fairness. Perfect for illustrating legal frameworks, policy breakdowns, or governance models. Fully editable for PowerPoint, Keynote, and Google Slides.


6 diapositivas
Organizational Structure Overview Presentation
Map out your team’s structure with clarity using this simple organizational chart template. Ideal for showcasing departments, reporting lines, or team roles, it helps stakeholders quickly understand who’s who and how responsibilities are divided. Perfect for internal meetings, onboarding decks, or company overviews. Works with PowerPoint, Keynote, and Google Slides.


4 diapositivas
Employee and Team Performance Analysis
Visualize individual and team contributions with this clear and structured performance analysis template. Showcase key metrics, employee growth, and team achievements using easy-to-read layouts and progress indicators. Ideal for HR reports, performance reviews, and team evaluations. Fully editable in PowerPoint, Keynote, and Google Slides.


5 diapositivas
Visual Mind Connections Bubble Chart
Present interconnected ideas with clarity using the Visual Mind Connections Bubble Chart Presentation. This diagram helps map key points around a central concept, making it perfect for brainstorming, strategy sessions, or educational content. Easy to customize in PowerPoint, Keynote, or Google Slides. Ideal for teams, coaches, and presenters.


7 diapositivas
Health Science Infographic
Dive deep into the realm of health science with our health science infographic. Merging the meticulousness of a laboratory with health, this infographic is crafted in pristine white complemented by refreshing green shades. The design captures the essence of both the clinical and nurturing facets of health science. Integrated within the template are tailored graphics symbolizing various aspects of health science. Compatible with PowerPoint, Keynote, and Google Slides. The icons are designed to convey complex scientific concepts with clarity, while the strategically placed image placeholders allow for the incorporation of real-life visuals or explanatory diagrams.


6 diapositivas
Product Pricing Table Comparison
Make your pricing pitch clear and compelling with this vibrant comparison table template designed for easy decision-making. Whether you're showcasing subscription plans, service tiers, or product bundles, this slide helps highlight key features and value differences at a glance. Fully editable in PowerPoint, Keynote, and Google Slides.


30 diapositivas
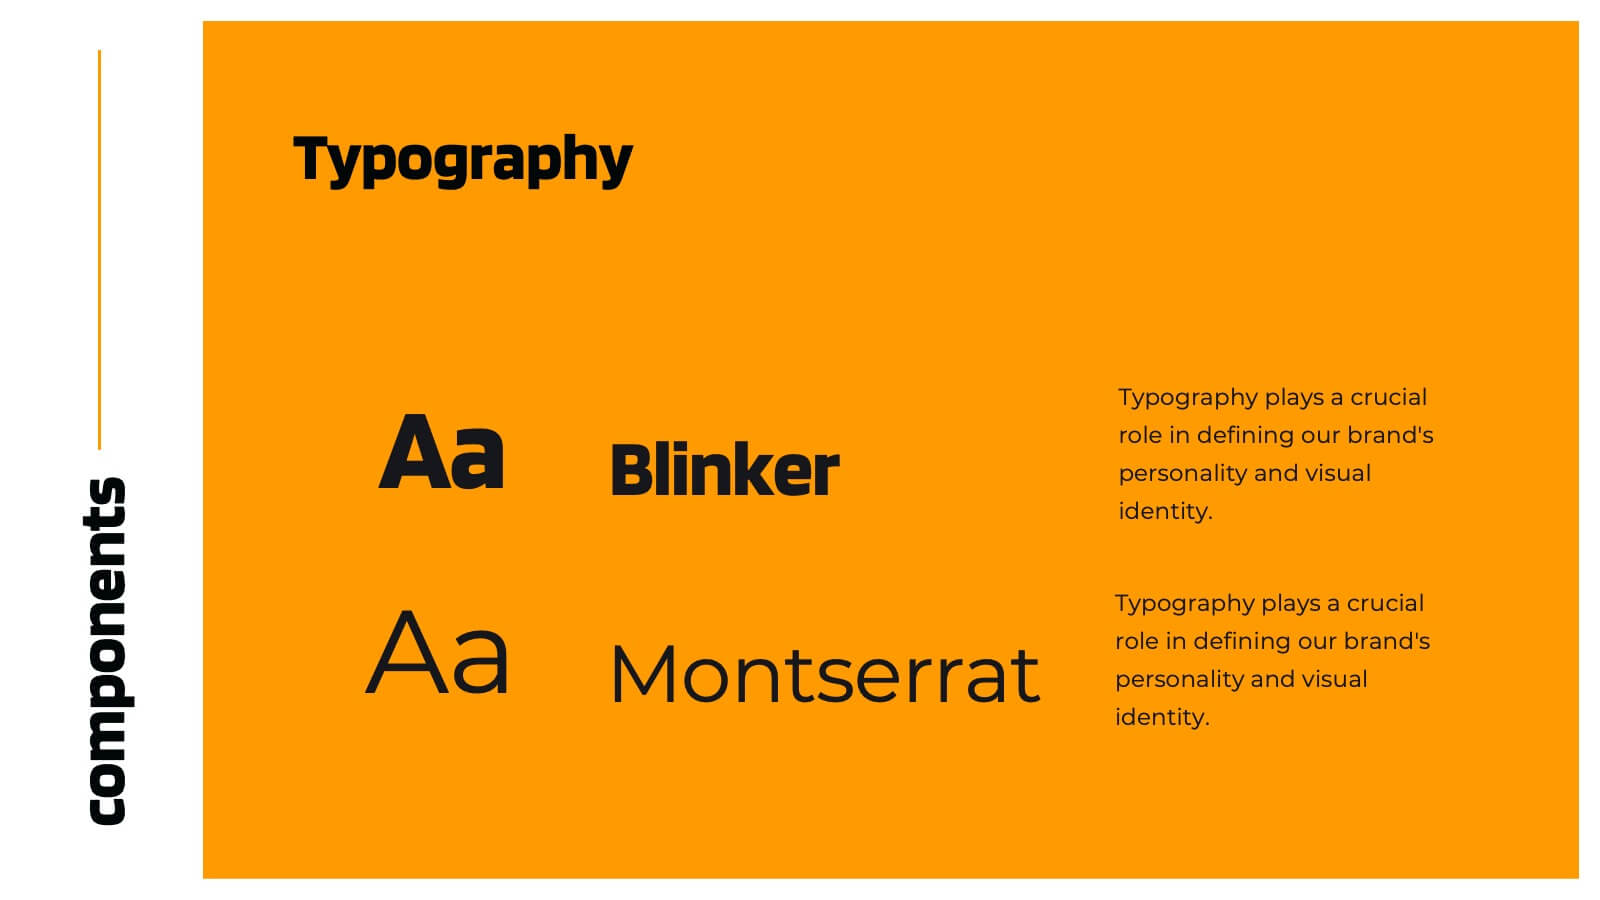
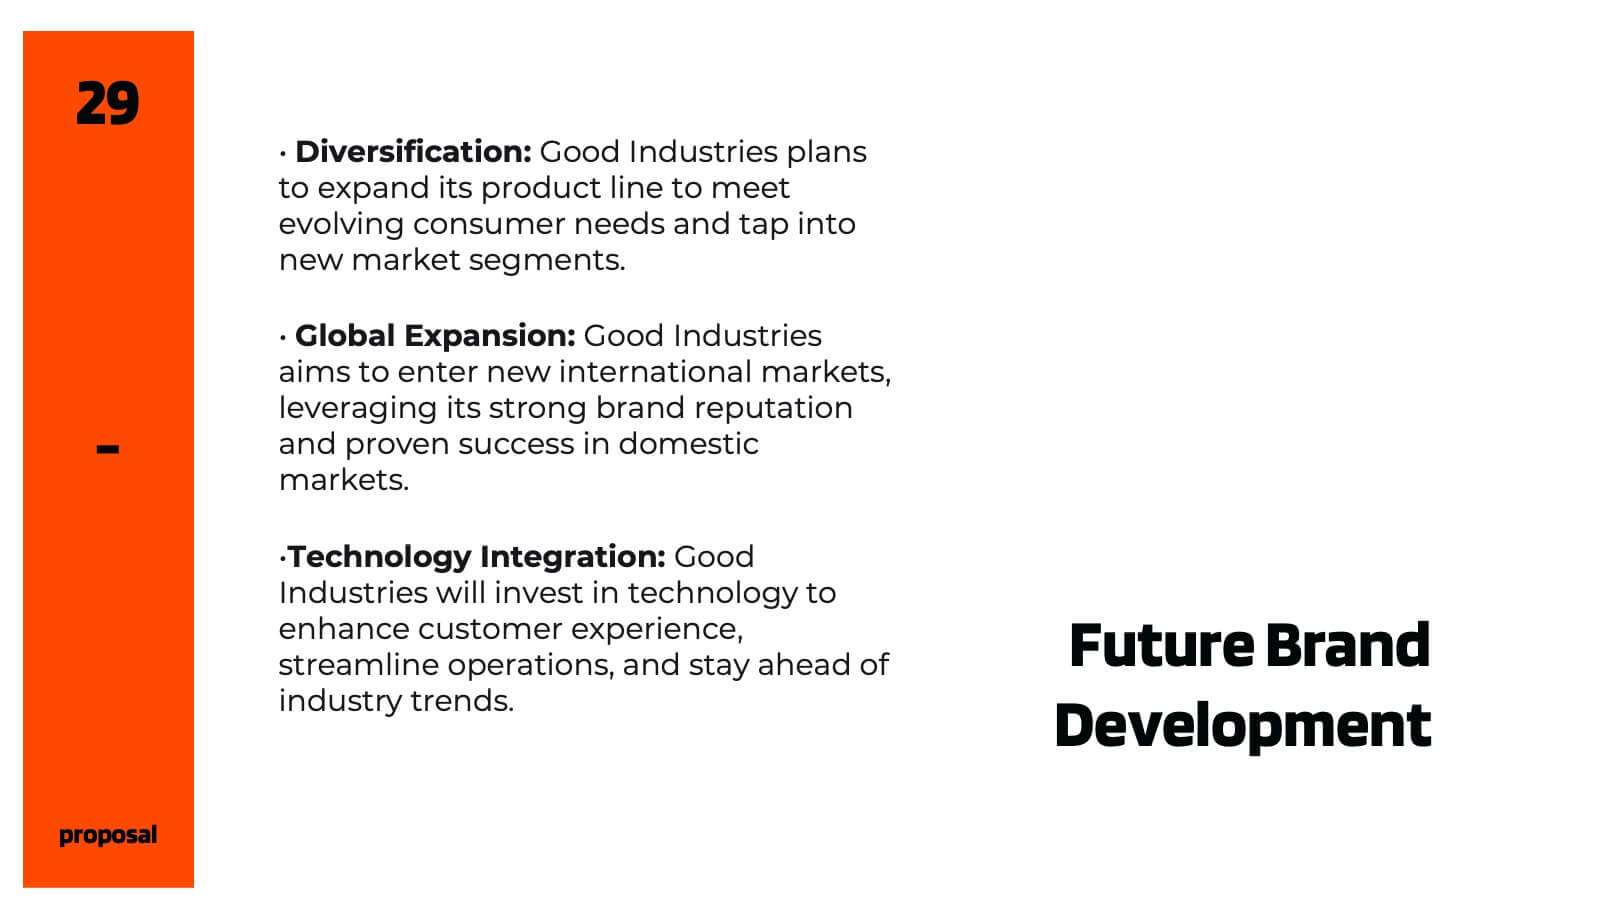
Chromalight Brand Guidelines Proposal Presentation
Elevate your brand's story with this visually engaging presentation template that embodies modern, professional aesthetics. From mission and vision statements to brand identity and market positioning, each slide is crafted to showcase your brand's core essence. Ideal for brand strategists and marketers, this template is compatible with PowerPoint, Keynote, and Google Slides.


5 diapositivas
Managing Product Maturity and Decline
Effectively visualize each phase of a product’s lifecycle with this curve-style infographic—from introduction to decline. Ideal for business strategy, product development, or market lifecycle planning. Fully editable in PowerPoint, Keynote, or Google Slides for seamless customization.


5 diapositivas
Business Choices and Outcomes Analysis Presentation
Visually connect key business options with their potential results using the Business Choices and Outcomes Analysis slide. Featuring a clean puzzle-style layout, this template is perfect for illustrating decision pathways, pros and cons, or strategy alternatives. Ideal for consultants, managers, and analysts. Easily customizable in PowerPoint, Keynote, and Google Slides.


4 diapositivas
Case Analysis for Executive Decision Making Presentation
Guide stakeholders through data-driven insights with the Case Analysis for Executive Decision Making Presentation. This layout uses a clear upward progression with labeled steps to showcase milestones, challenges, or strategic outcomes—perfect for leadership meetings or high-level reviews. Fully customizable in PowerPoint, Keynote, and Google Slides.


7 diapositivas
Business Decision-Making Questions Presentation
Streamline your decision-making process with this engaging and structured presentation slide. Featuring a lightbulb and question mark design, this template effectively illustrates problem-solving and strategic choices in a professional and visually appealing way. Ideal for business strategy, consulting, and brainstorming sessions, it is fully editable, allowing you to customize text, colors, and layout to fit your needs. Compatible with PowerPoint, Keynote, and Google Slides for seamless use.


6 diapositivas
Sales Associate Infographic
A sales associate, also known as a sales representative or salesperson, is an individual who is responsible for selling products or services to customers. This infographic template is designed to highlight the key roles, skills, and responsibilities of a sales associate. It provides an informative and engaging overview of the sales associate's role within a company or organization, showcasing their contribution to sales and customer satisfaction. This template is suitable for various industries and can be customized to fit specific company or organizational contexts. Compatible with Powerpoint, Keynote, and Google Slides, this is easily customizable.


5 diapositivas
Teaching Framework Presentation
Bring your teaching steps to life with a clear, uplifting layout that turns educational progression into an easy-to-follow visual journey. This presentation helps you break down concepts, outline stages, and guide learners smoothly from one level to the next. Fully compatible with PowerPoint, Keynote, and Google Slides.


21 diapositivas
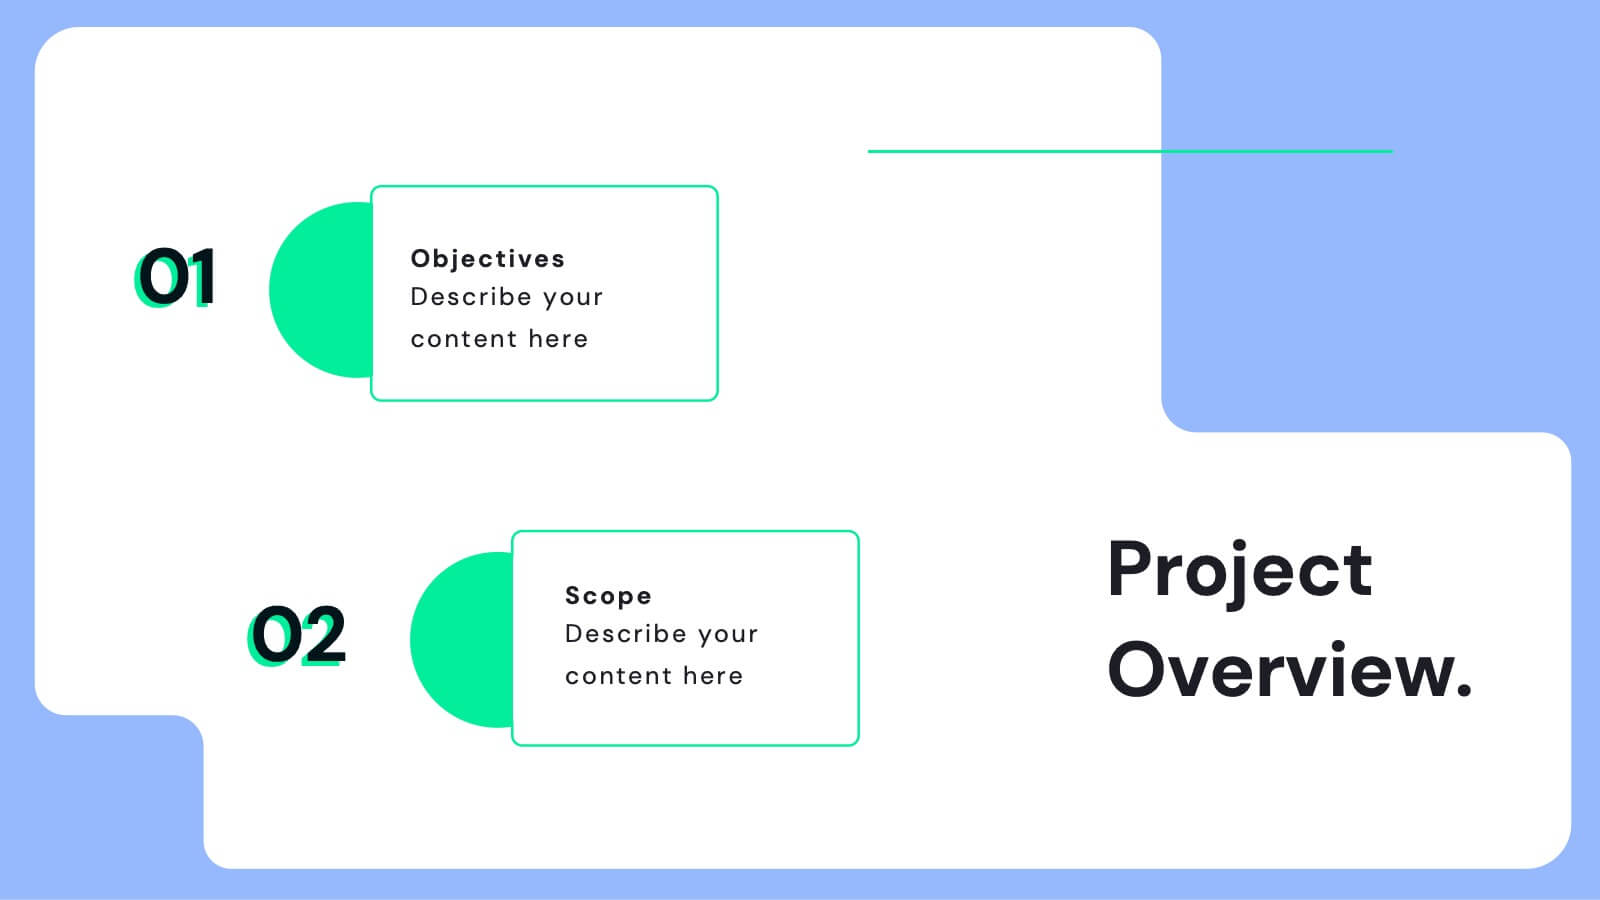
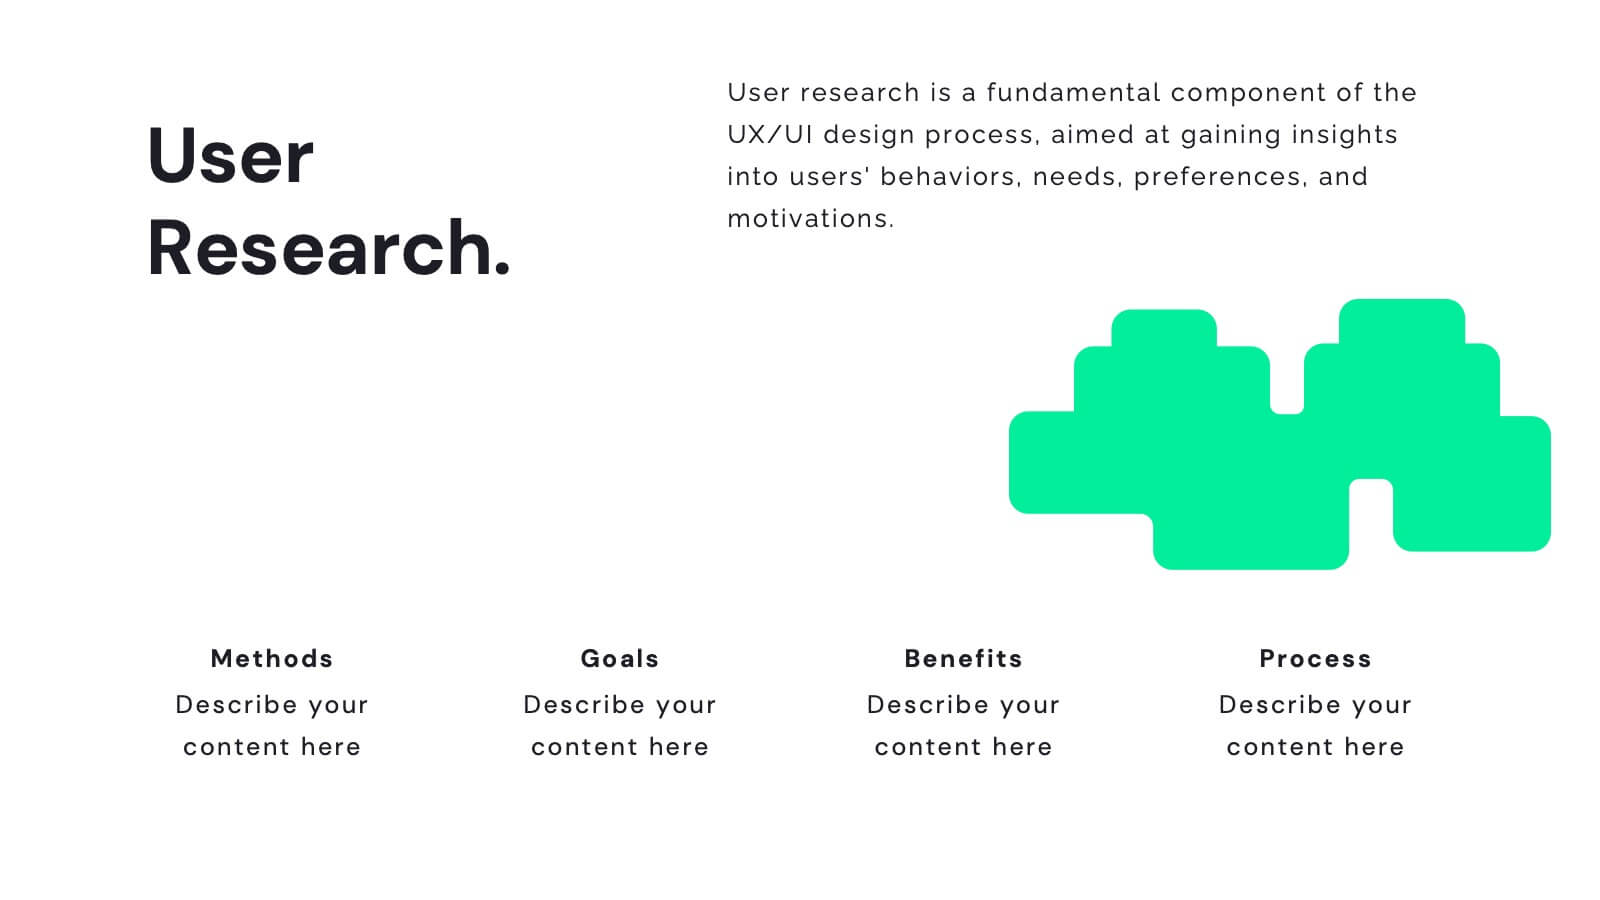
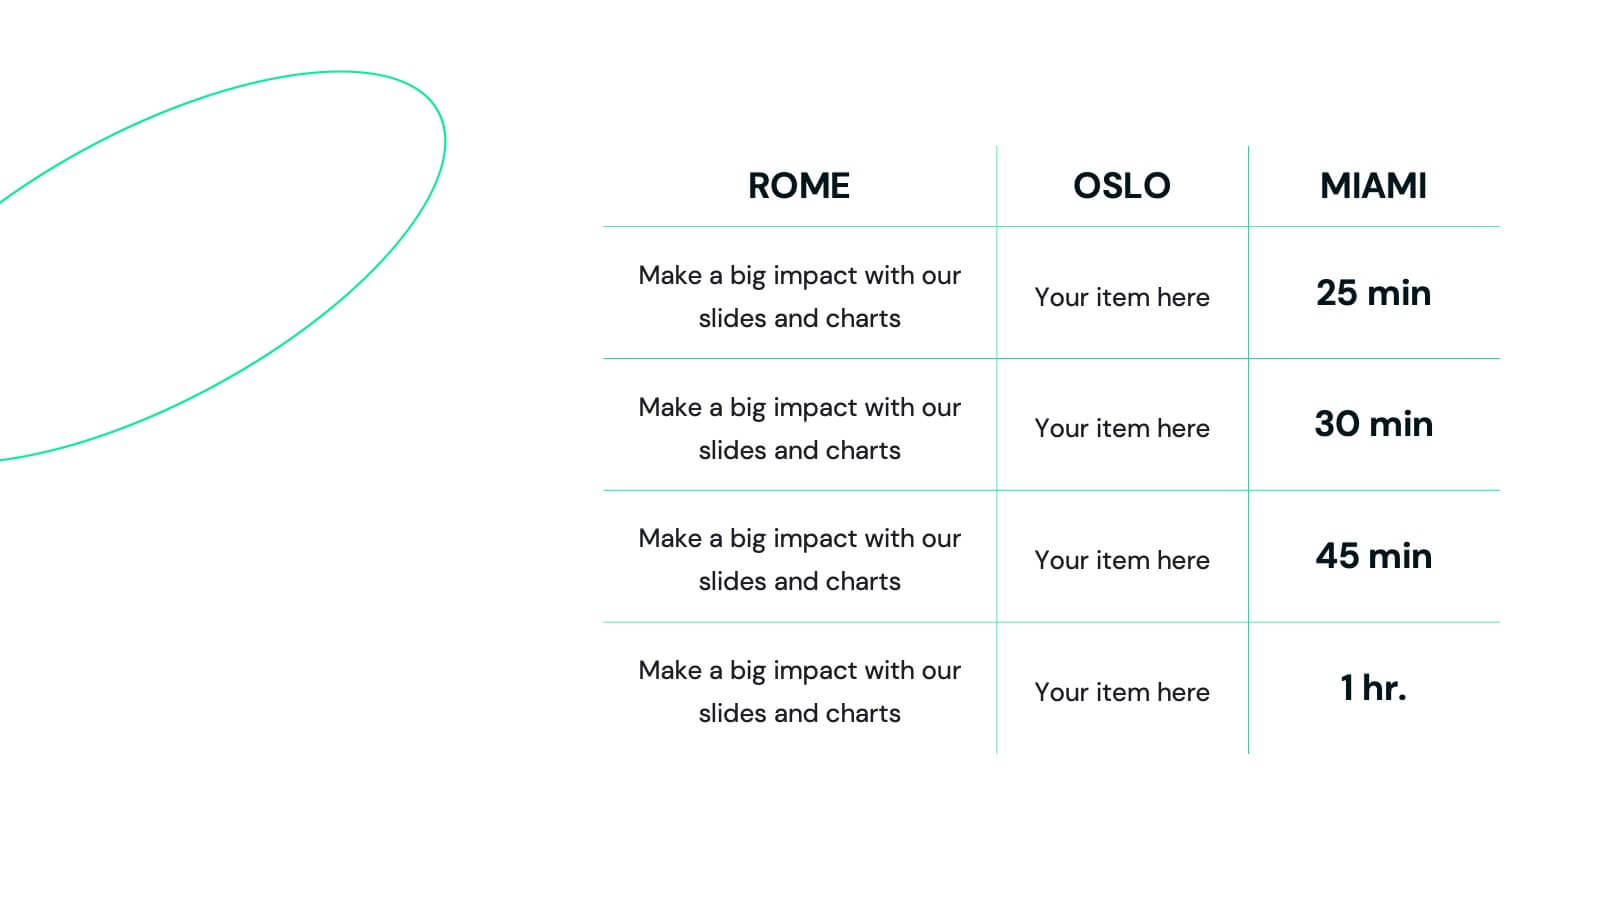
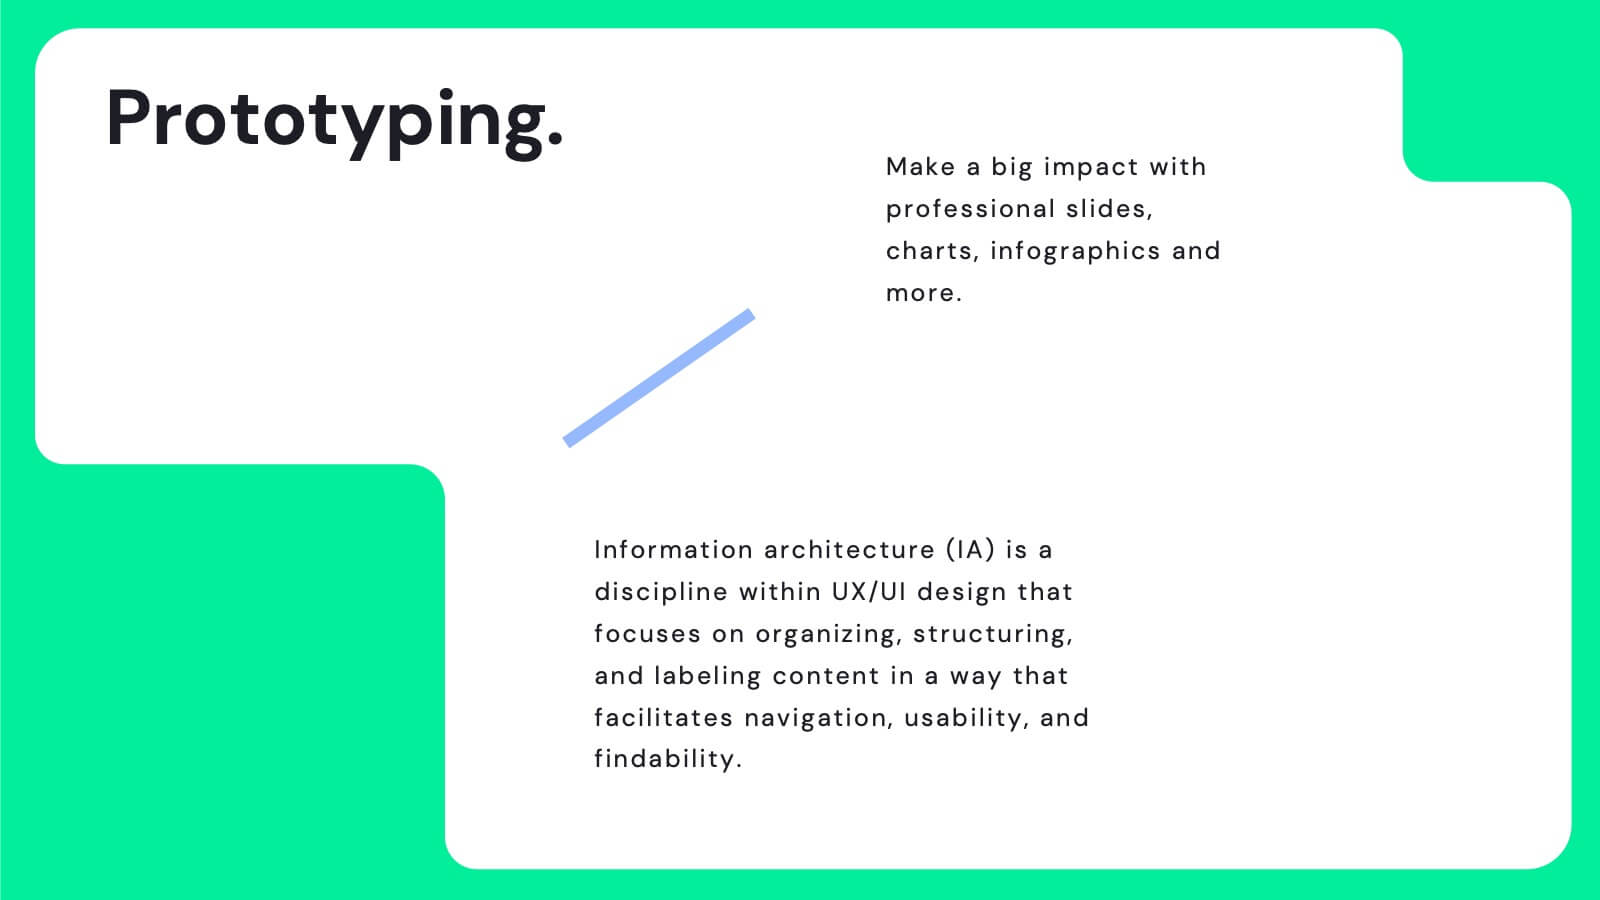
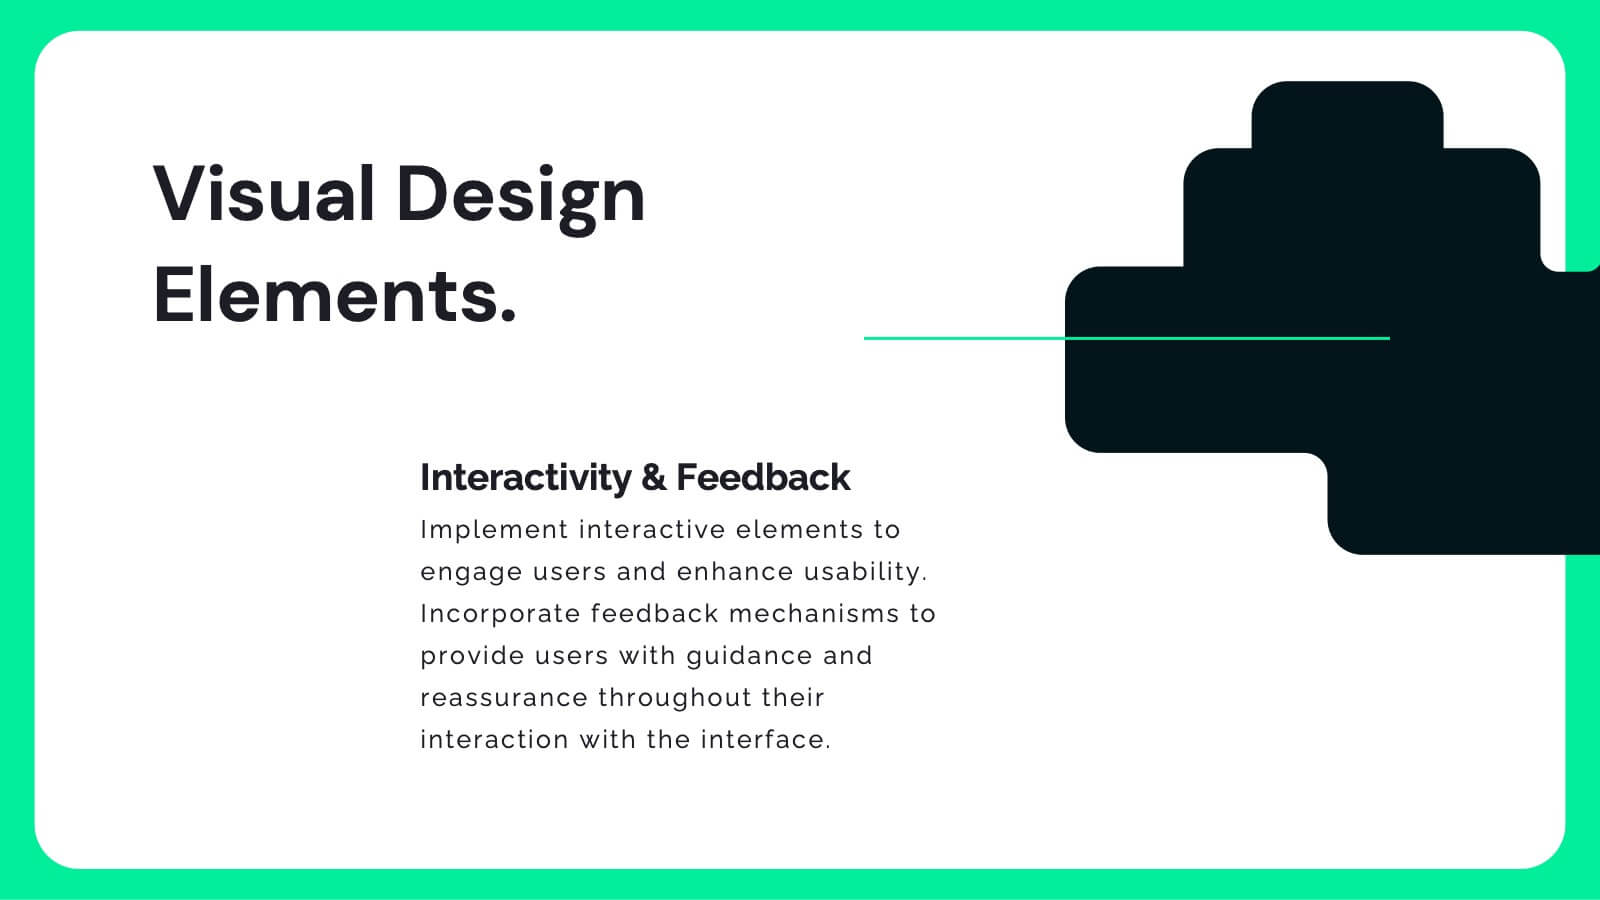
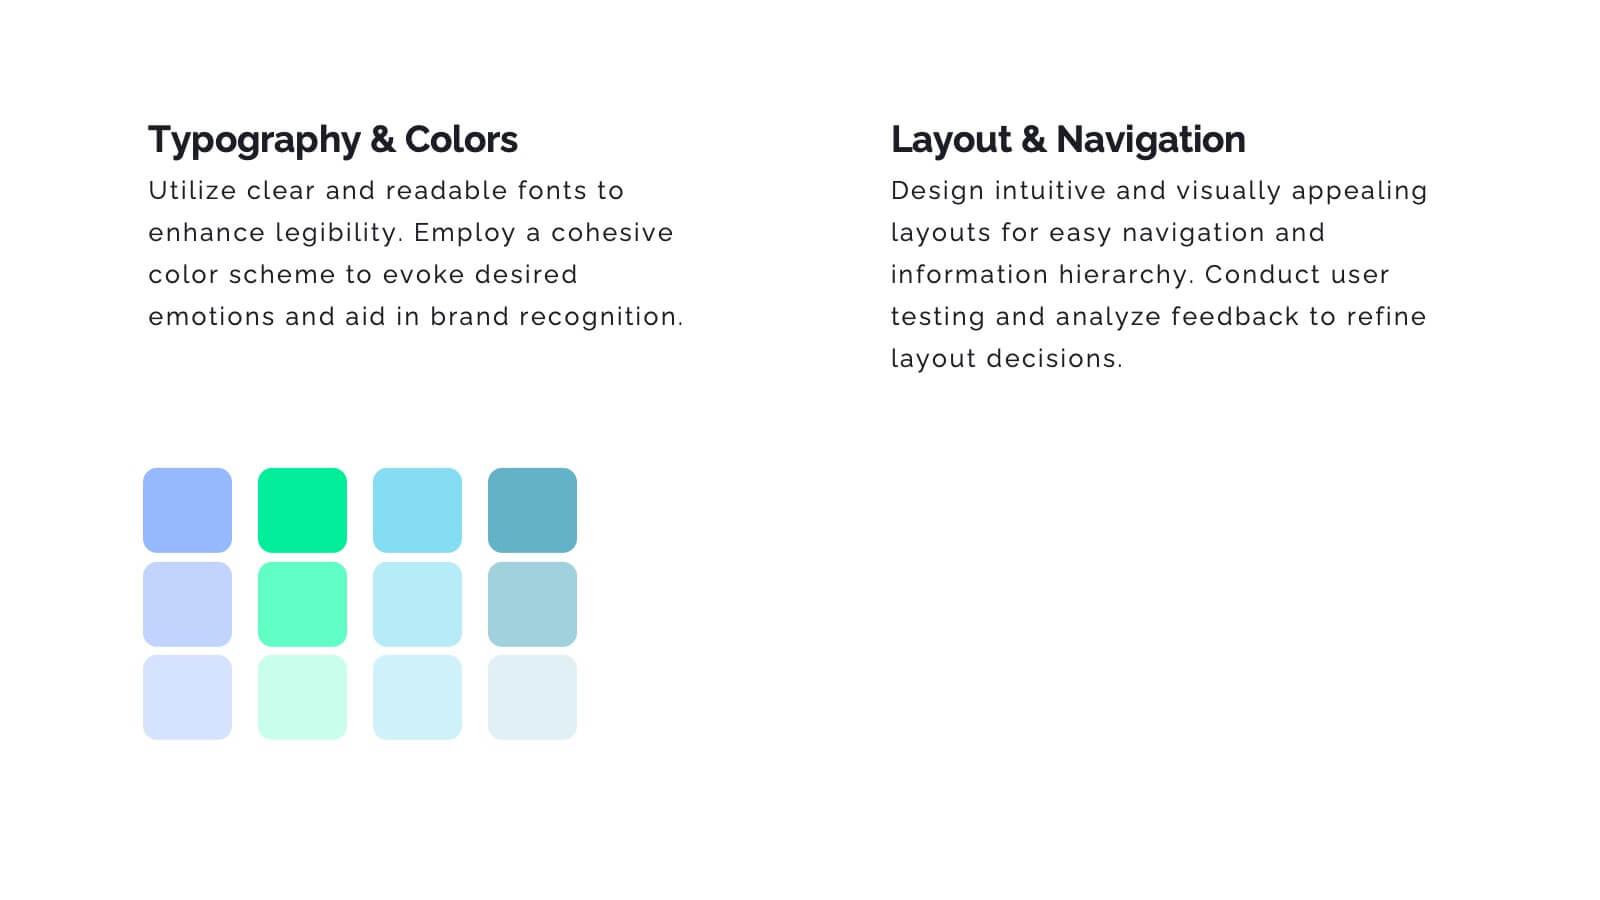
Juno UX Case Study Presentation
Enhance your UX presentations with this sleek, user-friendly template designed for showcasing detailed case studies and user research. With a modern layout and clear sections for user journey mapping, prototyping, and usability guidelines, this template ensures a professional and engaging presentation. Compatible with PowerPoint, Keynote, and Google Slides, it's perfect for any platform.


4 diapositivas
Healthcare Access and Preventive Care Presentation
Bring your health strategy to life with this engaging heart-themed infographic slide. Perfect for illustrating patient access points, wellness checkpoints, or preventive initiatives, each segment is cleanly organized with icons and text. Ideal for medical presentations, this template works seamlessly in PowerPoint, Keynote, and Google Slides for total flexibility.