


Características


¿Tienes alguna pregunta?
Recomendar


7 diapositivas
Problem Solution Infographic
The Problem Solution Infographic is a versatile template designed to clearly articulate challenges and corresponding strategies. It guides viewers through a sequence of problem identification to the implementation of solutions, offering a structured approach to problem-solving. This template is perfect for professionals who aim to present issues and their solutions in a logical, step-by-step manner. With its compatibility across PowerPoint, Google Slides, and Keynote, this tool is ideal for workshops, business meetings, academic environments, or any scenario where clear communication of problem-solving is required.
21 diapositivas
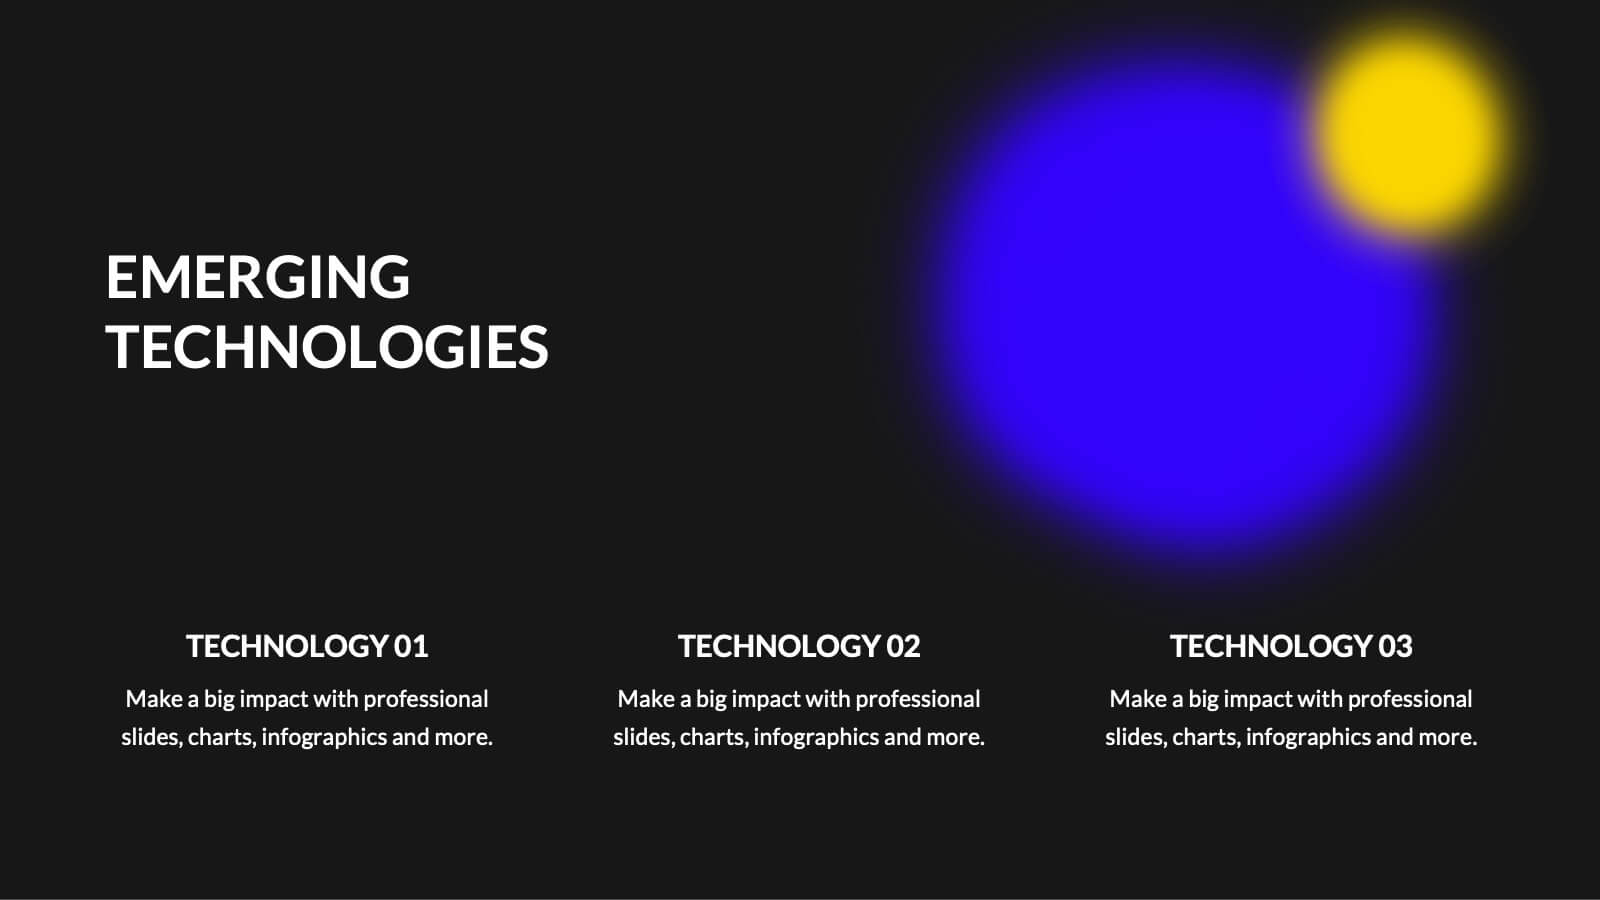
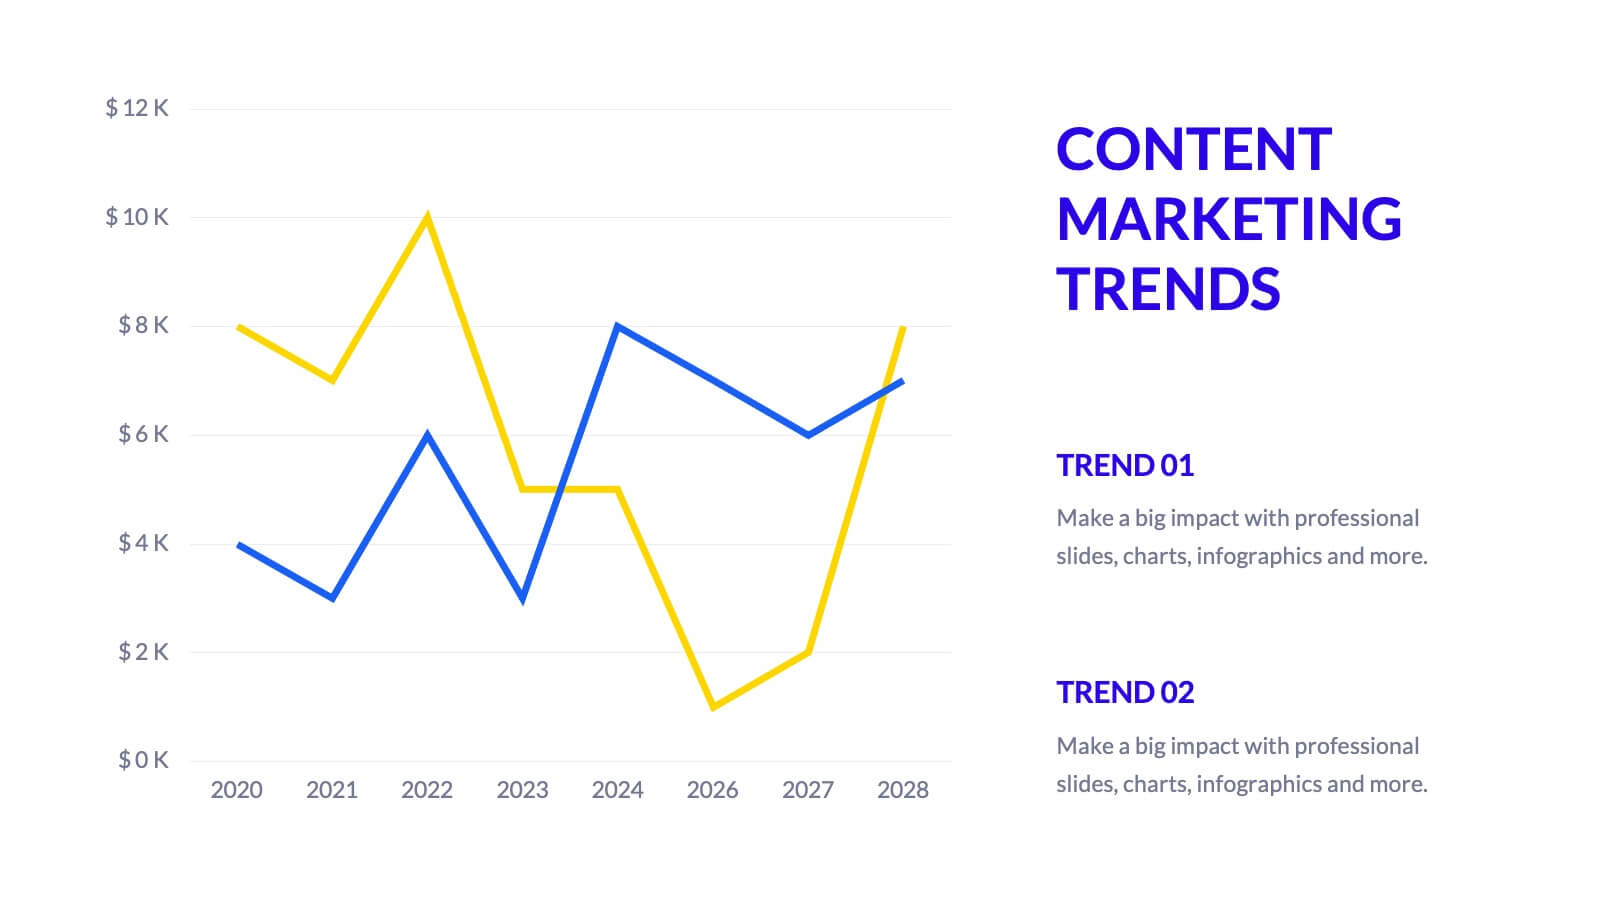
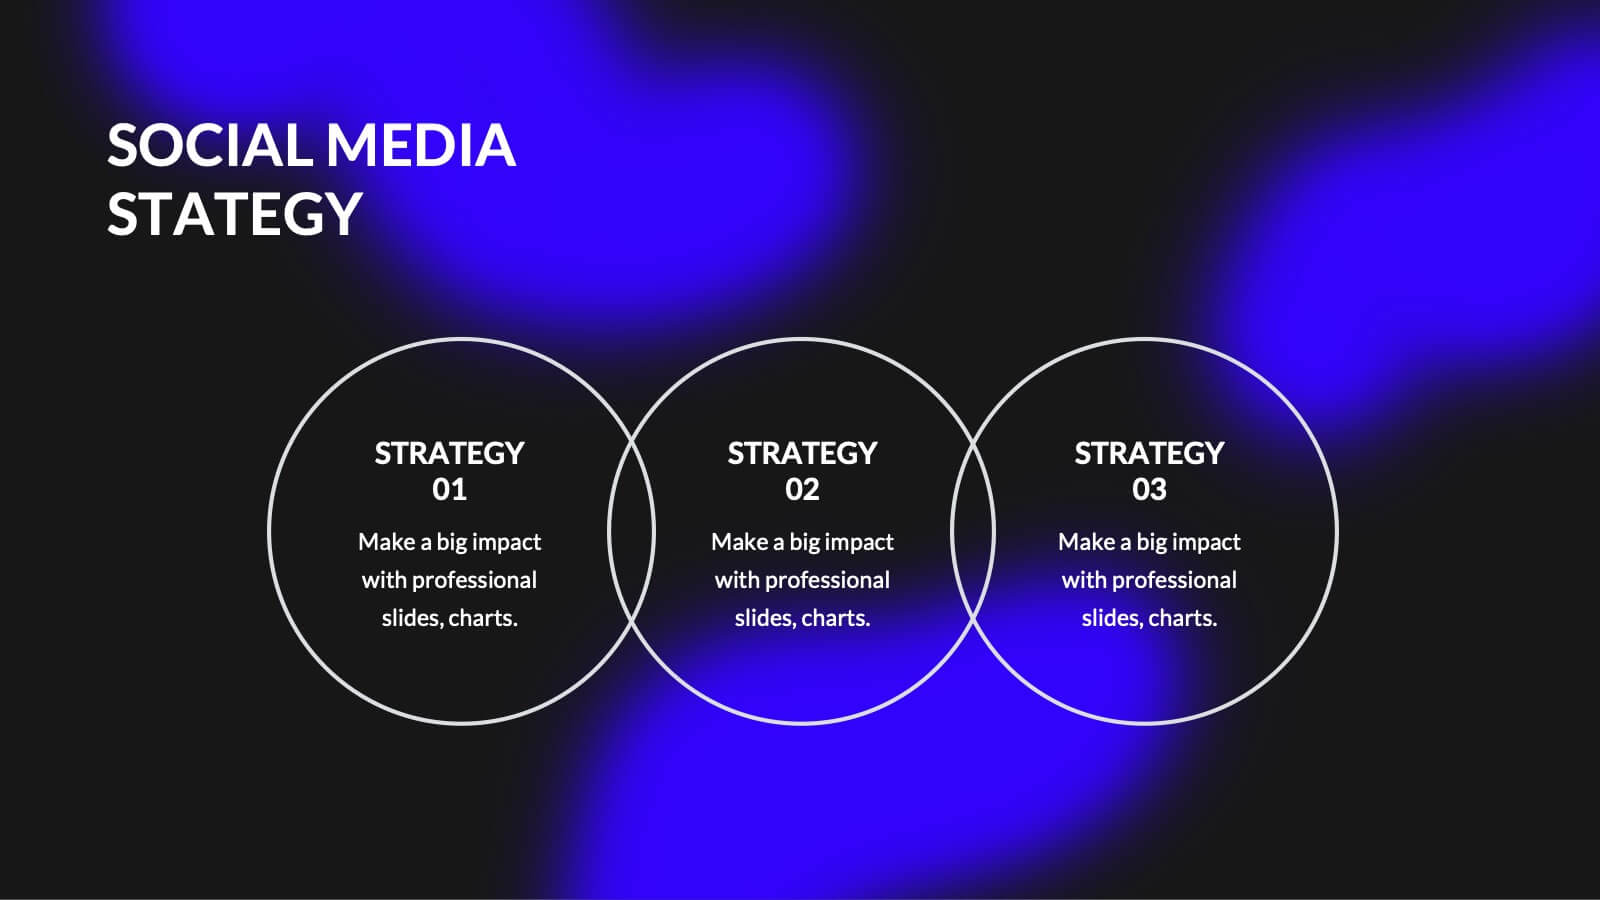
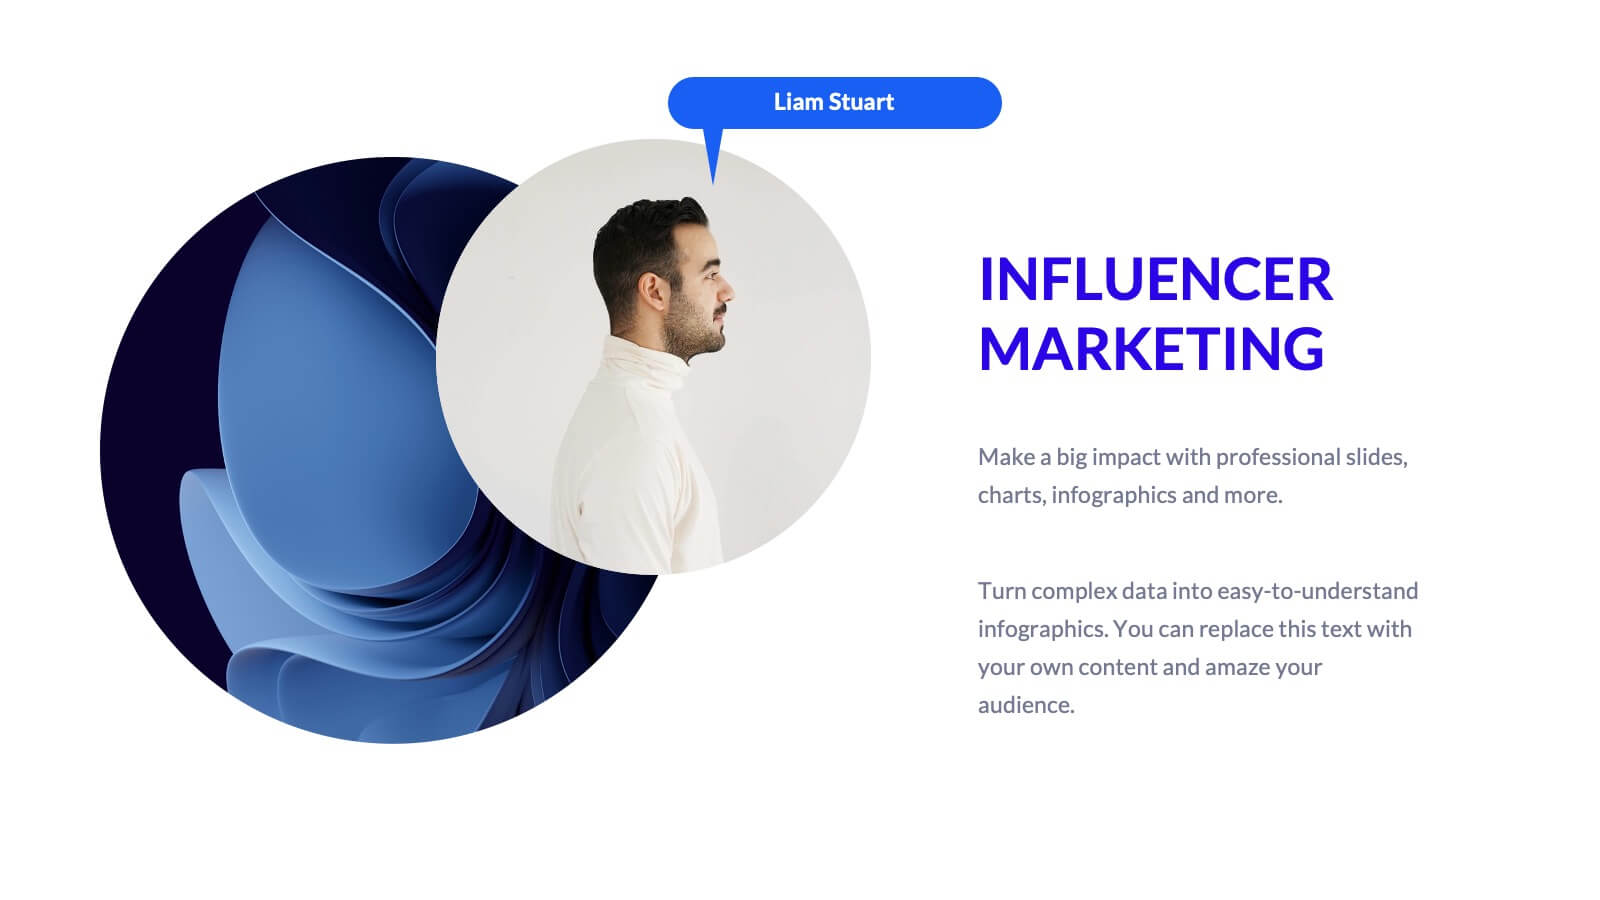
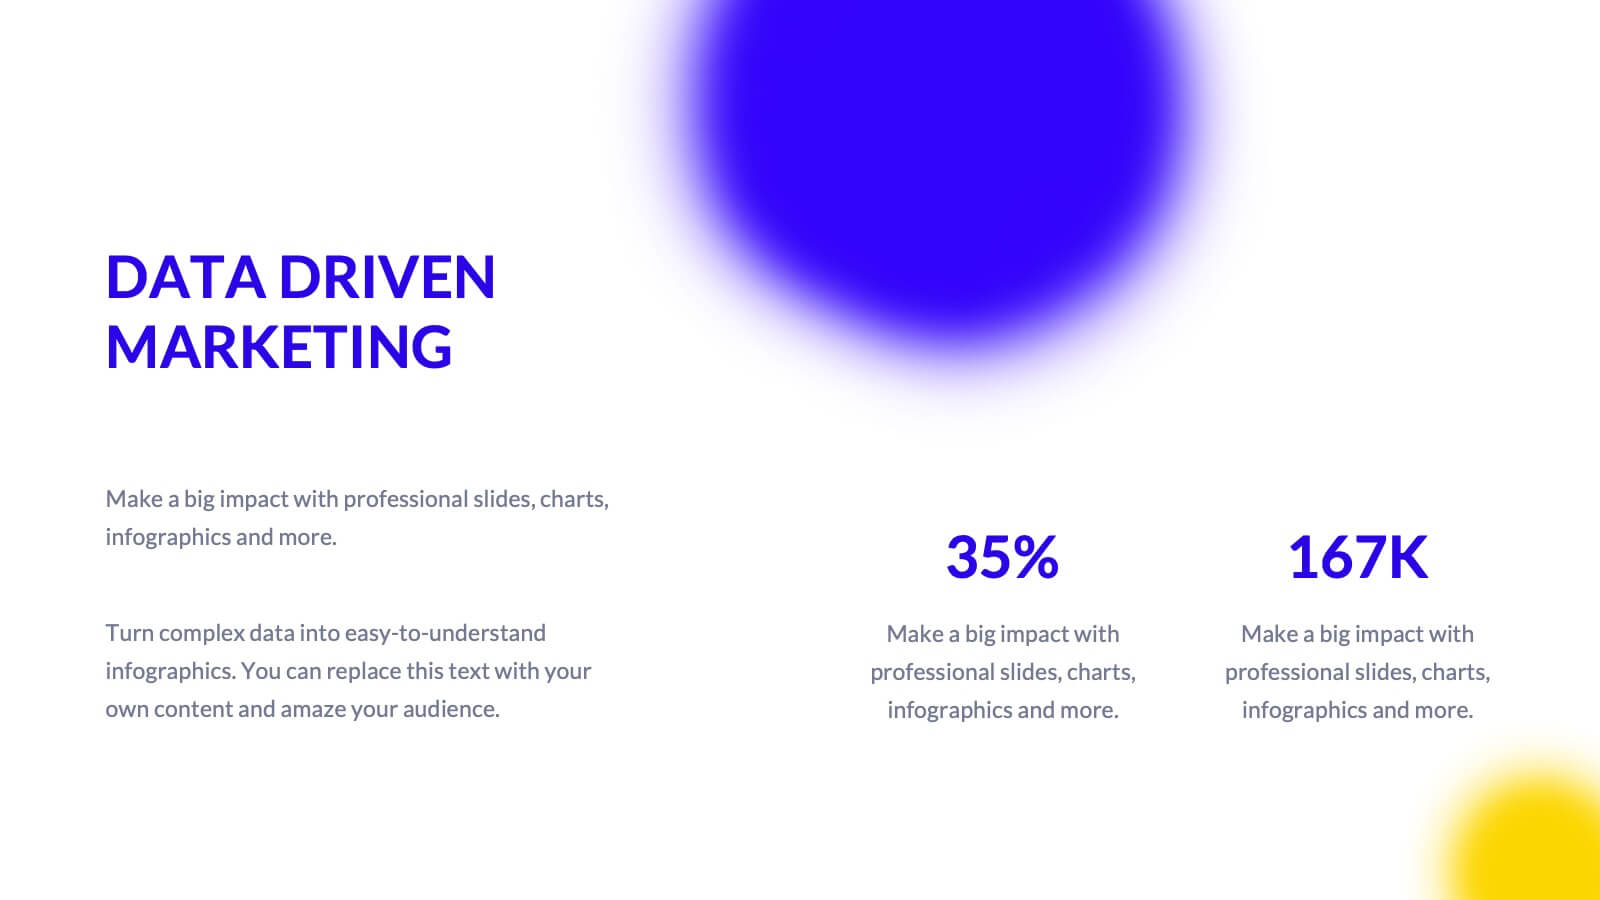
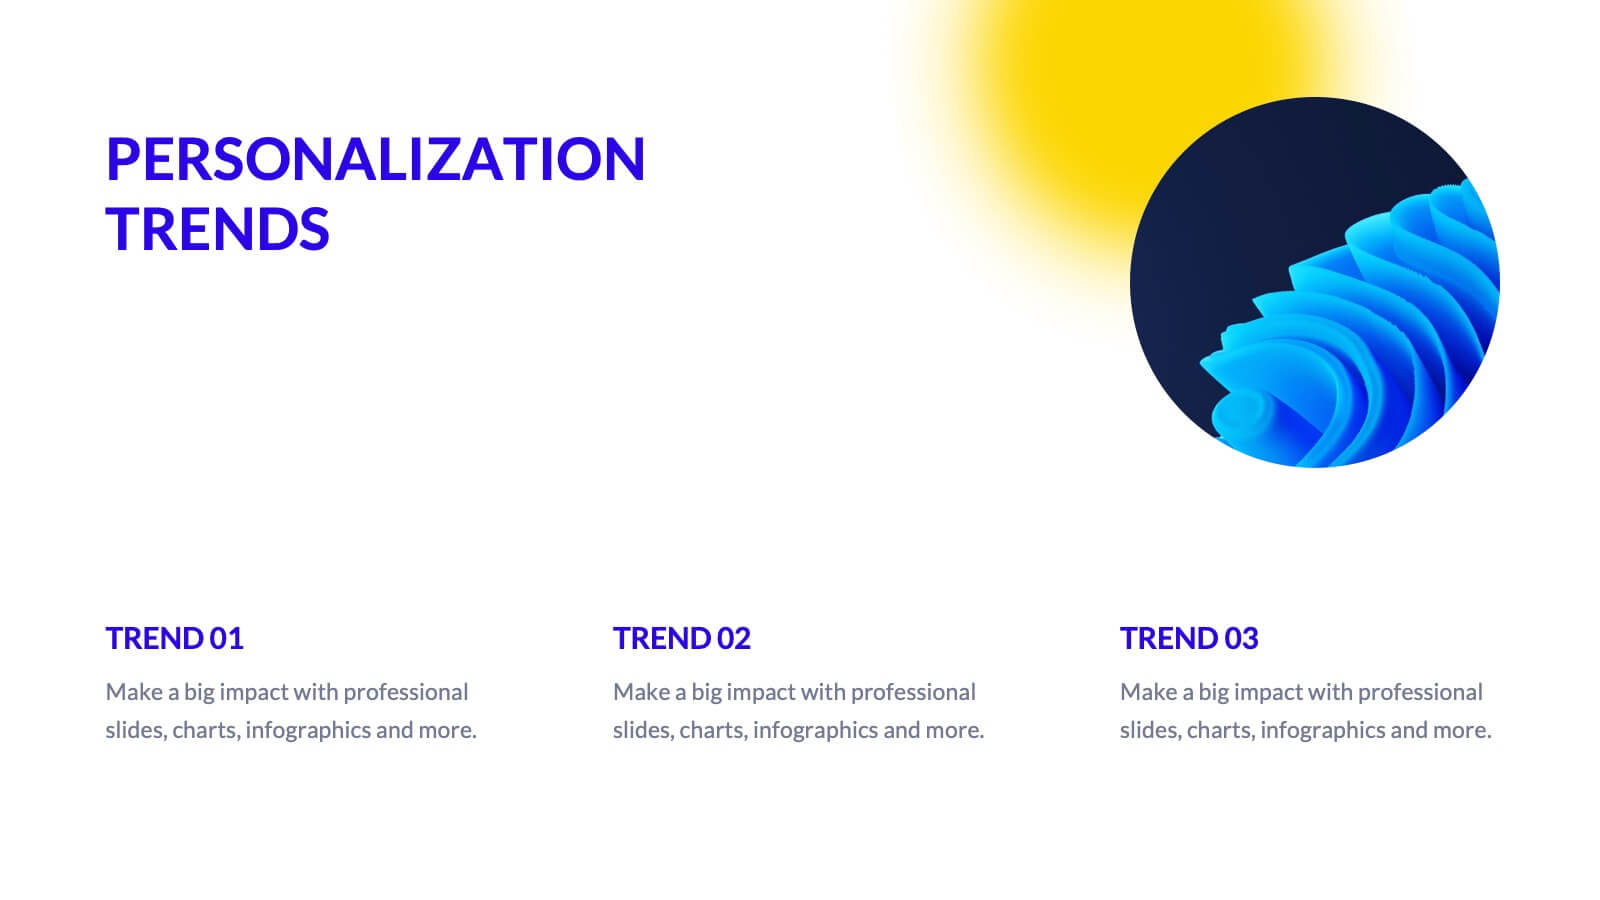
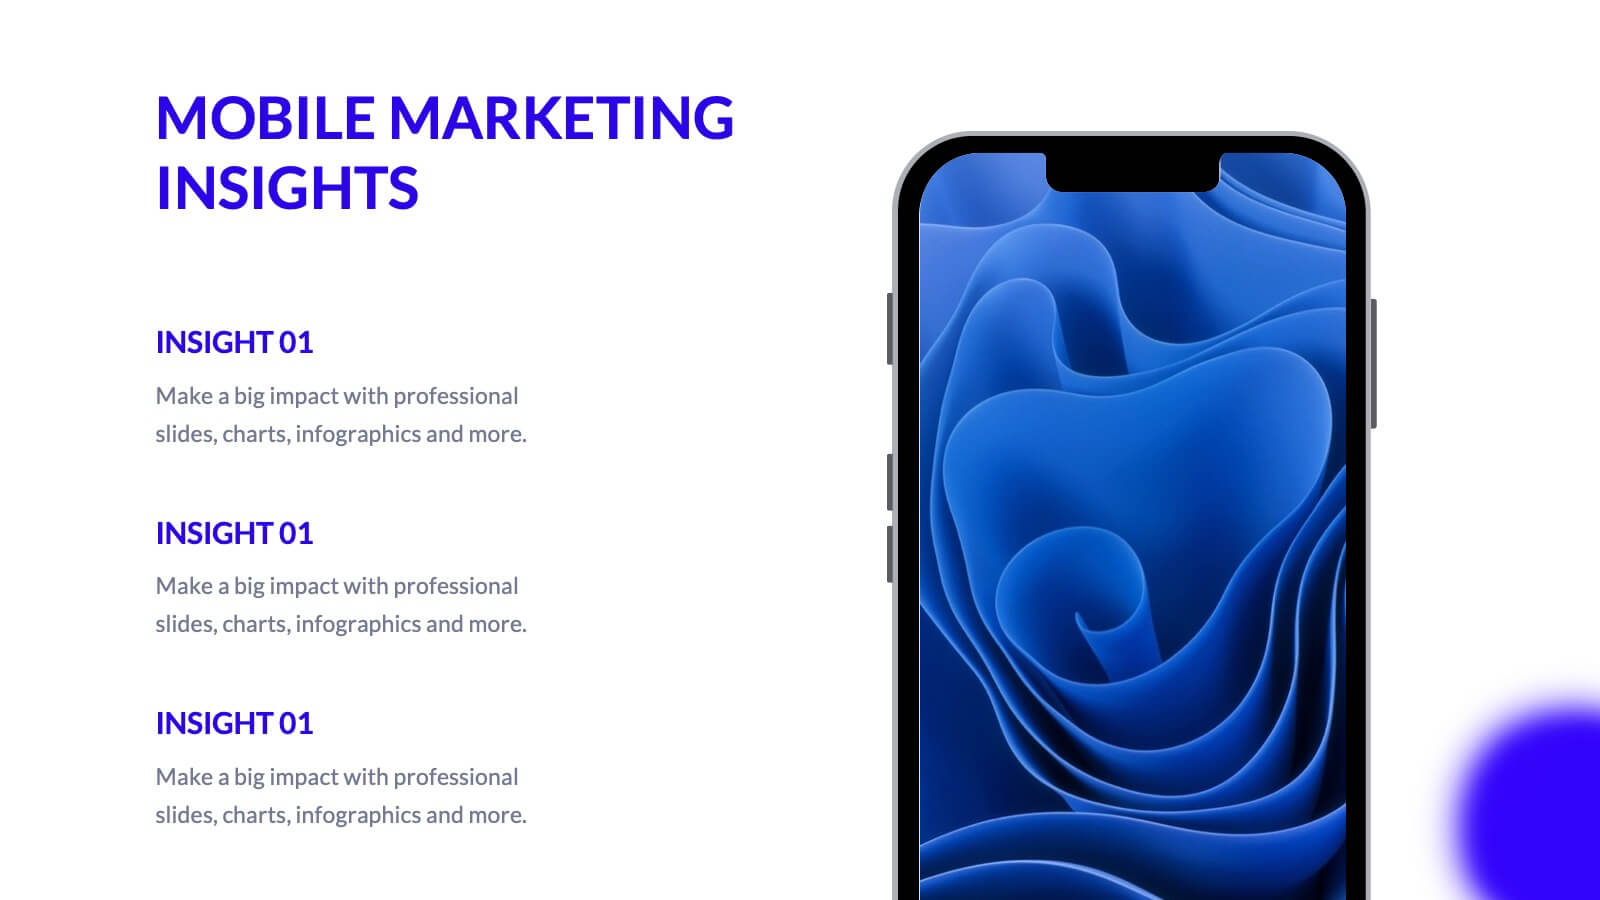
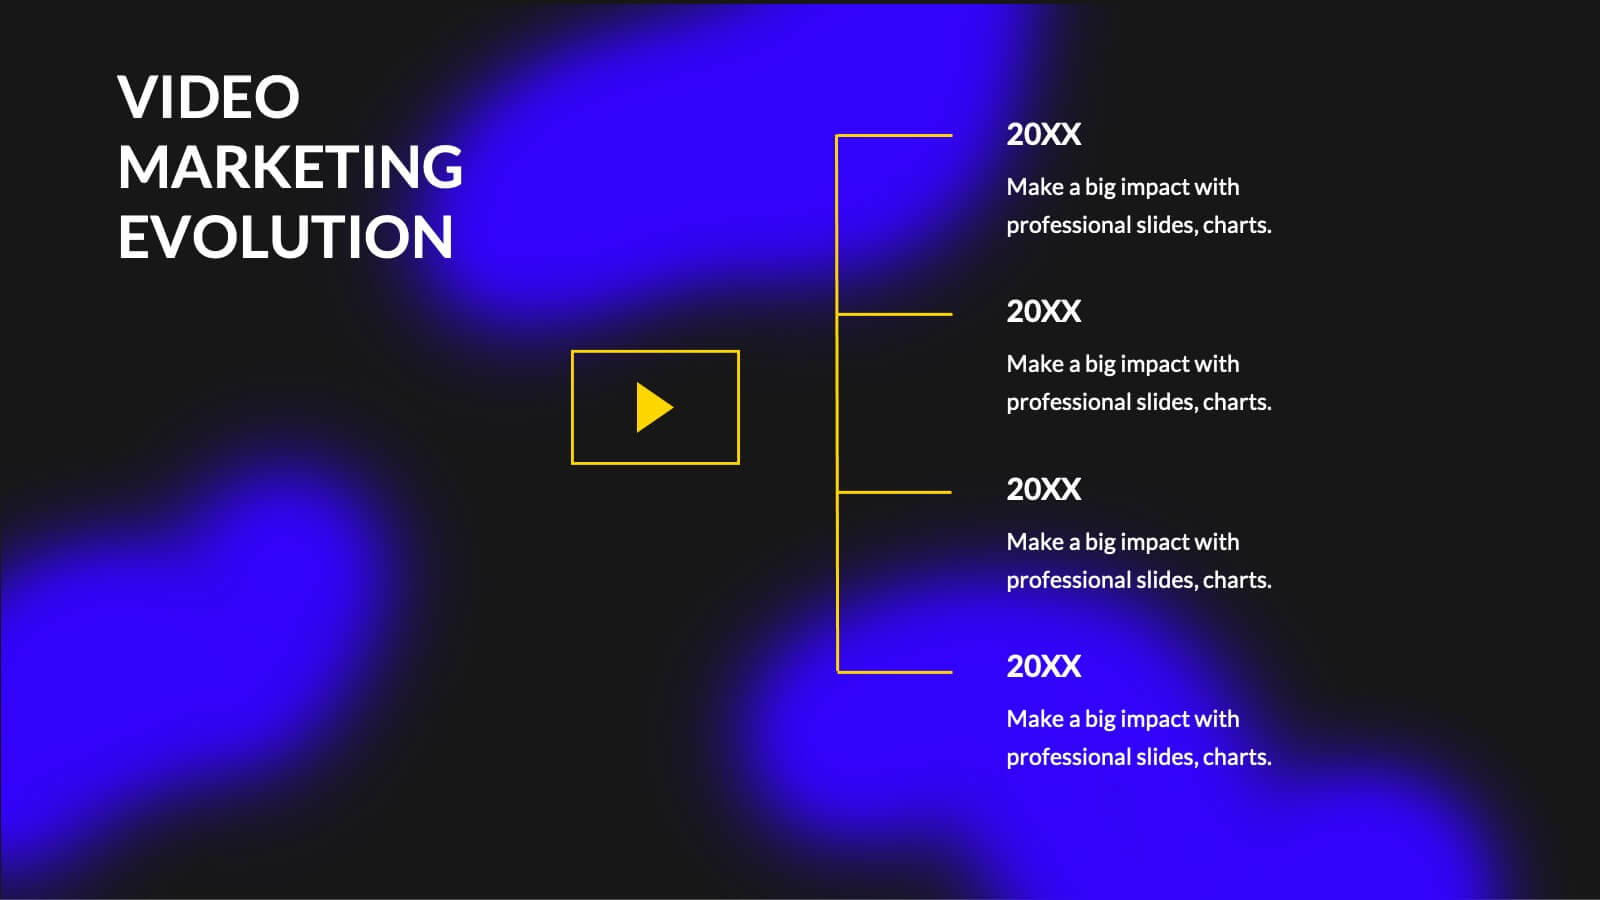
Catalyst Digital Marketing Strategy Plan Presentation
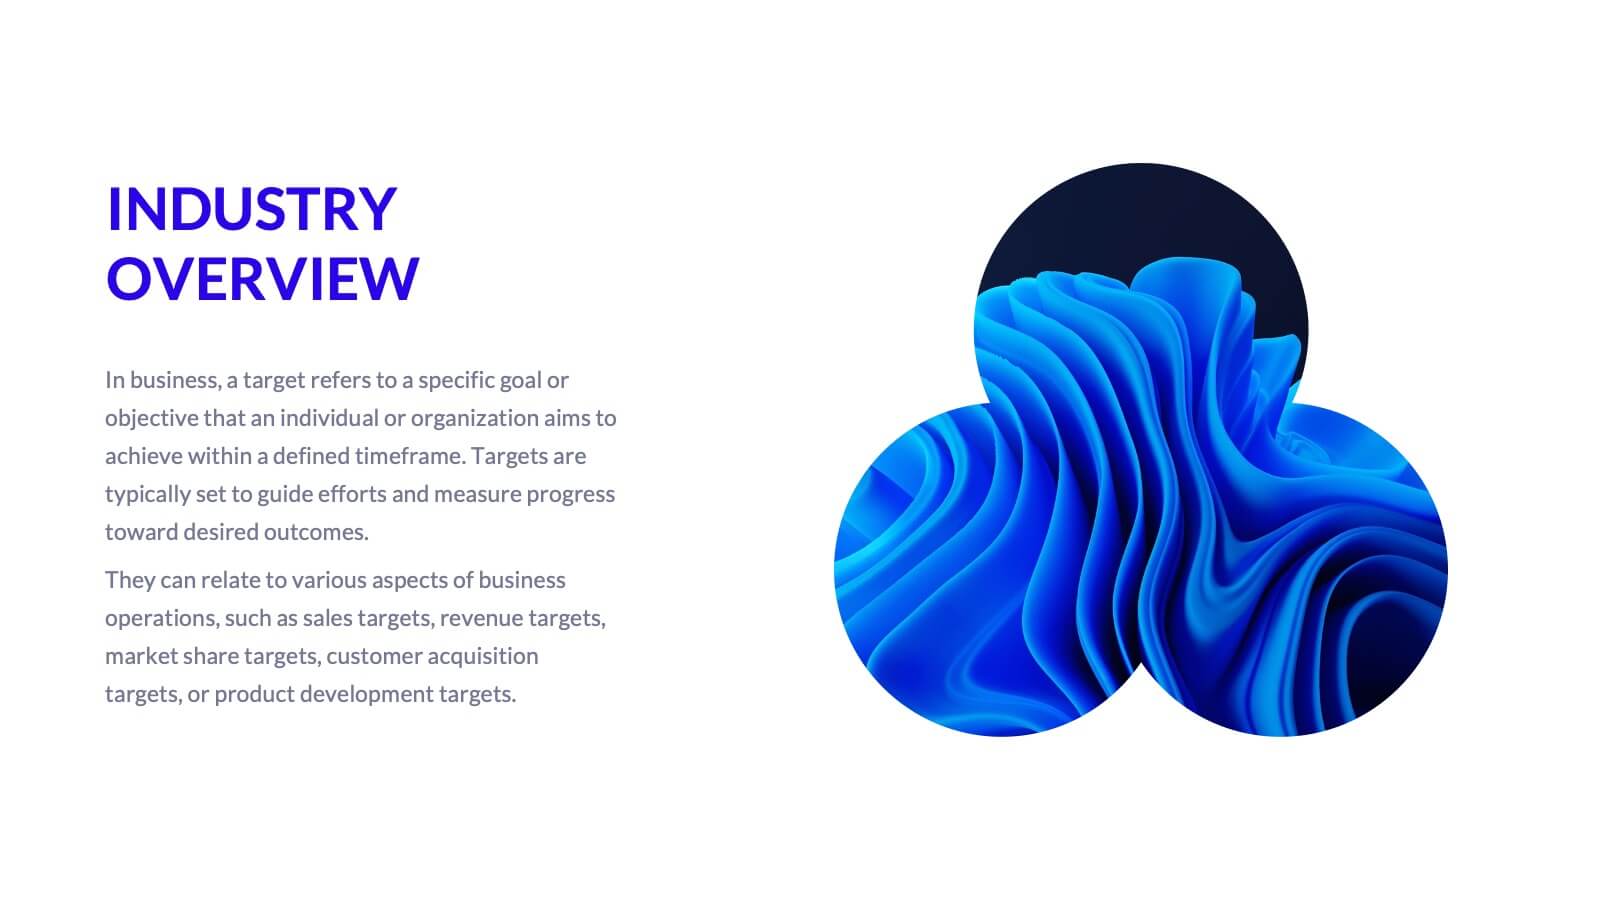
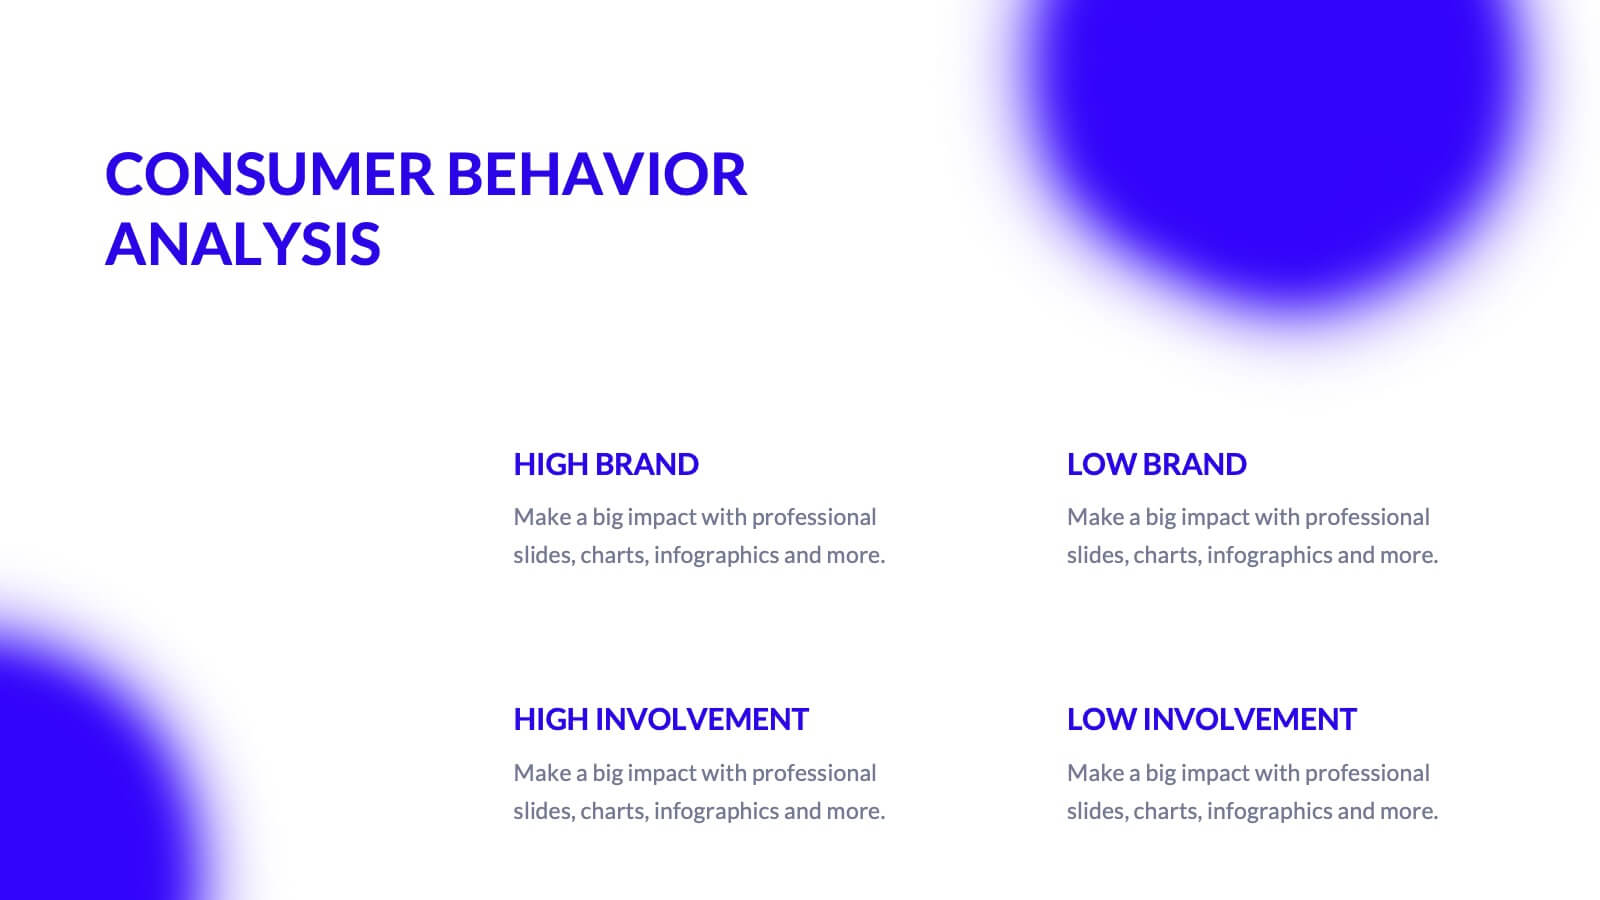
Supercharge your digital marketing strategy with this vibrant, modern presentation template. Perfect for detailing industry overviews, consumer behavior analysis, and social media strategies, it features a dynamic design that captures attention. Highlight key trends like SEO, influencer marketing, and e-commerce to engage your audience. Compatible with PowerPoint, Keynote, and Google Slides, it ensures seamless presentations on any platform.


4 diapositivas
Event Planning and Calendar Timeline Presentation
Plan smarter, not harder! This sleek timeline infographic is perfect for keeping your event plans organized and on track. Whether you're managing a multi-day conference or a team schedule, this visual template makes deadlines and tasks crystal clear. Fully compatible with PowerPoint, Keynote, and Google Slides for seamless editing and presentation.


5 diapositivas
IT Security and Data Protection Presentation
Communicate your cybersecurity objectives with impact using this clean, shield-based visual layout. This presentation slide features five distinct steps with matching icons, perfect for detailing protocols like data governance, firewall strategies, or access control measures. Ideal for IT professionals, network admins, or compliance teams. Fully customizable and compatible with PowerPoint, Keynote, and Google Slides.


4 diapositivas
Healthcare Impact on Breast Cancer Day Presentation
Educate and inspire with the Healthcare Impact on Breast Cancer Day Presentation. This thoughtfully designed layout uses meaningful visuals to highlight data, awareness efforts, and key messages around breast cancer healthcare. Ideal for awareness campaigns, health reports, or nonprofit presentations. Fully editable in PowerPoint, Google Slides, Keynote, and Canva.


6 diapositivas
Connection and Relationship Strategy Presentation
Present your workflow or relationship journey with clarity using the Connection and Relationship Strategy Presentation. This linear hexagon path is ideal for visualizing sequences, strategies, or stages in professional relationships. Fully customizable for PowerPoint, Keynote, and Google Slides—perfect for consultants, marketers, or project managers.


7 diapositivas
Business Plan Process Infographic
Unveil the roadmap to entrepreneurial success with our business plan process infographic. This simple and streamlined infographic encapsulates the quintessential steps to draft a robust business plan, guiding entrepreneurs and business professionals on their journey to creating a successful enterprise. This infographic is an indispensable tool for budding entrepreneurs, business consultants, educators, and anyone looking to gain insights into the formulation of a business plan. Designed for seamless integration with PowerPoint, Keynote, or Google Slides, this template promises a presentation that is both engaging and educative.


7 diapositivas
Modern Education Infographic
Immerse yourself in the evolving world of learning with our Modern Education Infographic. With a crisp white canvas, the design incorporates an energizing mix of orange, the trust-building hue of blue, and a dash of passionate red. This template boasts modern infographics, bespoke icons, and versatile image placeholders, offering a visual guide to contemporary educational methods, tools, and trends. Precision-made for Powerpoint, Keynote, or Google Slides. Ideal for educators, curriculum developers, edtech startups, or any professional keen on showcasing the transformation in learning techniques.


5 diapositivas
Project Planning and Rollout Timeline
Stay on track from kickoff to delivery with the Project Planning and Rollout Timeline Presentation. This curved roadmap layout visually guides your audience through five sequential stages—perfect for illustrating workflows, rollout phases, or go-to-market strategies. Easily customizable in PowerPoint, Keynote, and Google Slides to suit any project.


20 diapositivas
Miragyn Project Proposal Presentation
Showcase your project proposal with confidence using this visually appealing and structured template. Featuring a clear layout, it includes slides for project summaries, problem statements, and proposed solutions, allowing you to effectively communicate your vision and strategy. This template highlights essential details such as objectives and goals, timeline and milestones, and budget breakdown, making it ideal for delivering concise and impactful proposals. It also includes dedicated sections for team expertise, client testimonials, and terms and conditions, ensuring every aspect of your project is covered. Fully editable and compatible with PowerPoint, Google Slides, and Keynote, this template is perfect for professionals aiming to leave a lasting impression with their project presentations.


5 diapositivas
5 Whys Analysis Slide Presentation
Unlock problem-solving clarity with a vibrant, puzzle-style layout that helps teams dig deeper and uncover the true reason behind any challenge. This presentation guides viewers through each “why” step in a simple, structured flow, making root-cause insights easy to communicate. Fully compatible with PowerPoint, Keynote, and Google Slides.


6 diapositivas
Career Goals Infographic
Career goals refer to the professional objectives and aspirations that individuals set for themselves to achieve in their chosen careers. This infographic template serves as a powerful tool for individuals to map out their career aspirations, create a clear roadmap, and communicate their goals effectively. This template is designed to articulate and communicate your career aspirations and goals. This infographic provides a clear and organized overview of career objectives, steps for achieving those goals, and key milestones along the way. Compatible with Powerpoint, Keynote, and Google Slides.


7 diapositivas
Business Networking Strategy Presentation
Build strong business connections with this Business Networking Strategy template. Featuring a circular segmented diagram, this slide helps illustrate key networking approaches, strategic partnerships, and relationship-building techniques in an easy-to-understand format. Ideal for entrepreneurs, business developers, and corporate leaders, this fully editable slide is compatible with PowerPoint, Keynote, and Google Slides.


7 diapositivas
Structure Infographic Presentation Template
A structure infographic is a visual aid that is designed to help present information about the structural components of a particular topic. This template can be used to create presentations on a variety of subjects, such as education, business, buildings, machines, or organisms, and can help to break down complex information. Use this PowerPoint template to structure your most important ideas and impress your audience with more than just a bullet point list. Take a look at our infographic presentation templates if you want to add a bit of personality to your next presentation design!


5 diapositivas
Layered Business Pyramid Framework
Visualize business hierarchy and strategic layers with the Layered Business Pyramid Framework Presentation. This editable slide features a five-tier pyramid diagram aligned with corresponding text sections, ideal for showcasing organizational structures, workflow levels, or growth stages. Each layer is color-coded for clarity and impact, making your insights easy to digest. Fully compatible with PowerPoint, Keynote, and Google Slides.


21 diapositivas
Argentis UX Strategy Plan Presentation
Craft a seamless user experience with this professional UX strategy plan presentation. Covering key topics like user research, interaction design, wireframes, and accessibility considerations, this template helps you present a structured and insightful design approach. Fully customizable and compatible with PowerPoint, Keynote, and Google Slides for a smooth and impactful presentation.


20 diapositivas
Storynix New Product Proposal Presentation
This beautifully designed presentation template is your perfect tool to showcase a new product with style and professionalism. It covers everything from company overview and product features to pricing strategies and distribution plans, ensuring a comprehensive and persuasive pitch. Compatible with PowerPoint, Keynote, and Google Slides for seamless customization.