


Características


¿Tienes alguna pregunta?
Recomendar


7 diapositivas
Human Resources Administration Infographic
Human Resources Administration involves managing and overseeing various aspects of an organization's human capital and related processes. Our HR administration Infographic is your compass in the vast realm of HR, guiding you through essential aspects, best practices, and strategies crucial for successful HR management. This template is your guide to navigating the HR terrain. Compatible with Powerpoint, Keynote, and Google Slides. Discover best practices, strategies, and essential aspects of HR, empowering you to lead with expertise, empathy, and efficiency in the exciting world of human resources.


7 diapositivas
Challenge Infographic Presentation Template
Our Challenge Infographic template is designed for conveying the challenge, purpose, problem and solution of an issue. This template is perfect for presenting ideas and plans on any topic from business to education. It features a clean design that allows you to highlight your ideas with confidence. With this template, you will make your data stand out with a variety of charts, graphs and text to create contrast and guide the audience through your message. Our template is compatible with powerpoint and gives you the ability to customize all of the text boxes, colors and any other elements.


4 diapositivas
Total Addressable Market Strategy Presentation
Define Your Market Potential with this Total Addressable Market Strategy presentation template. This visually structured design effectively breaks down TAM, SAM, and SOM using Venn diagrams and clear segmentation to help businesses analyze market opportunities and define realistic growth targets. Ideal for startups, investors, and business strategists, this fully editable template is compatible with PowerPoint, Keynote, and Google Slides, ensuring seamless customization for market research, pitch decks, and financial planning.


5 diapositivas
Leadership Decision-Making Process Presentation
Guide your audience through leadership challenges with this step-by-step visual. Featuring four clearly defined stages, this layout is perfect for illustrating strategy development, executive planning, or coaching frameworks. The rising path graphic and human figure emphasize progress and achievement. Fully editable and compatible with PowerPoint, Keynote, and Google Slides.


4 diapositivas
High-Performance Team Collaboration Presentation
Showcase teamwork, trust, and synergy with this bold, interconnected arms graphic. Ideal for illustrating roles, partnerships, or team frameworks, this infographic is perfect for leadership, HR, or corporate strategy slides. Fully customizable in PowerPoint, Keynote, and Google Slides.


20 diapositivas
Windsong Sales Proposal Presentation
Craft a persuasive sales proposal with this sleek and professional template. Perfectly suited for communicating your value proposition, this design includes slides for introductions, company overviews, and a detailed service summary. Address critical business factors with sections for target markets, competitive analysis, and clearly defined sales objectives. Highlight your sales process, showcase the team's expertise, and build trust through customer testimonials. Dedicated slides for pricing strategies, promotions, and discounts allow you to present a compelling financial offer. Wrap up with an actionable next steps plan and a feedback section to reinforce client engagement. Fully customizable and compatible with PowerPoint, Google Slides, and Keynote, this template combines modern design with functional layouts to ensure your proposal stands out. Ideal for creating a lasting impression.


6 diapositivas
Simple Workflow Process Presentation
Streamline your workflow presentations with this Simple Workflow Process template. Featuring a clean, step-by-step layout with intuitive lightbulb icons, it effectively visualizes processes. Fully customizable with editable colors, icons, and text to match your branding. Compatible with PowerPoint, Keynote, and Google Slides for effortless integration into your presentations.


24 diapositivas
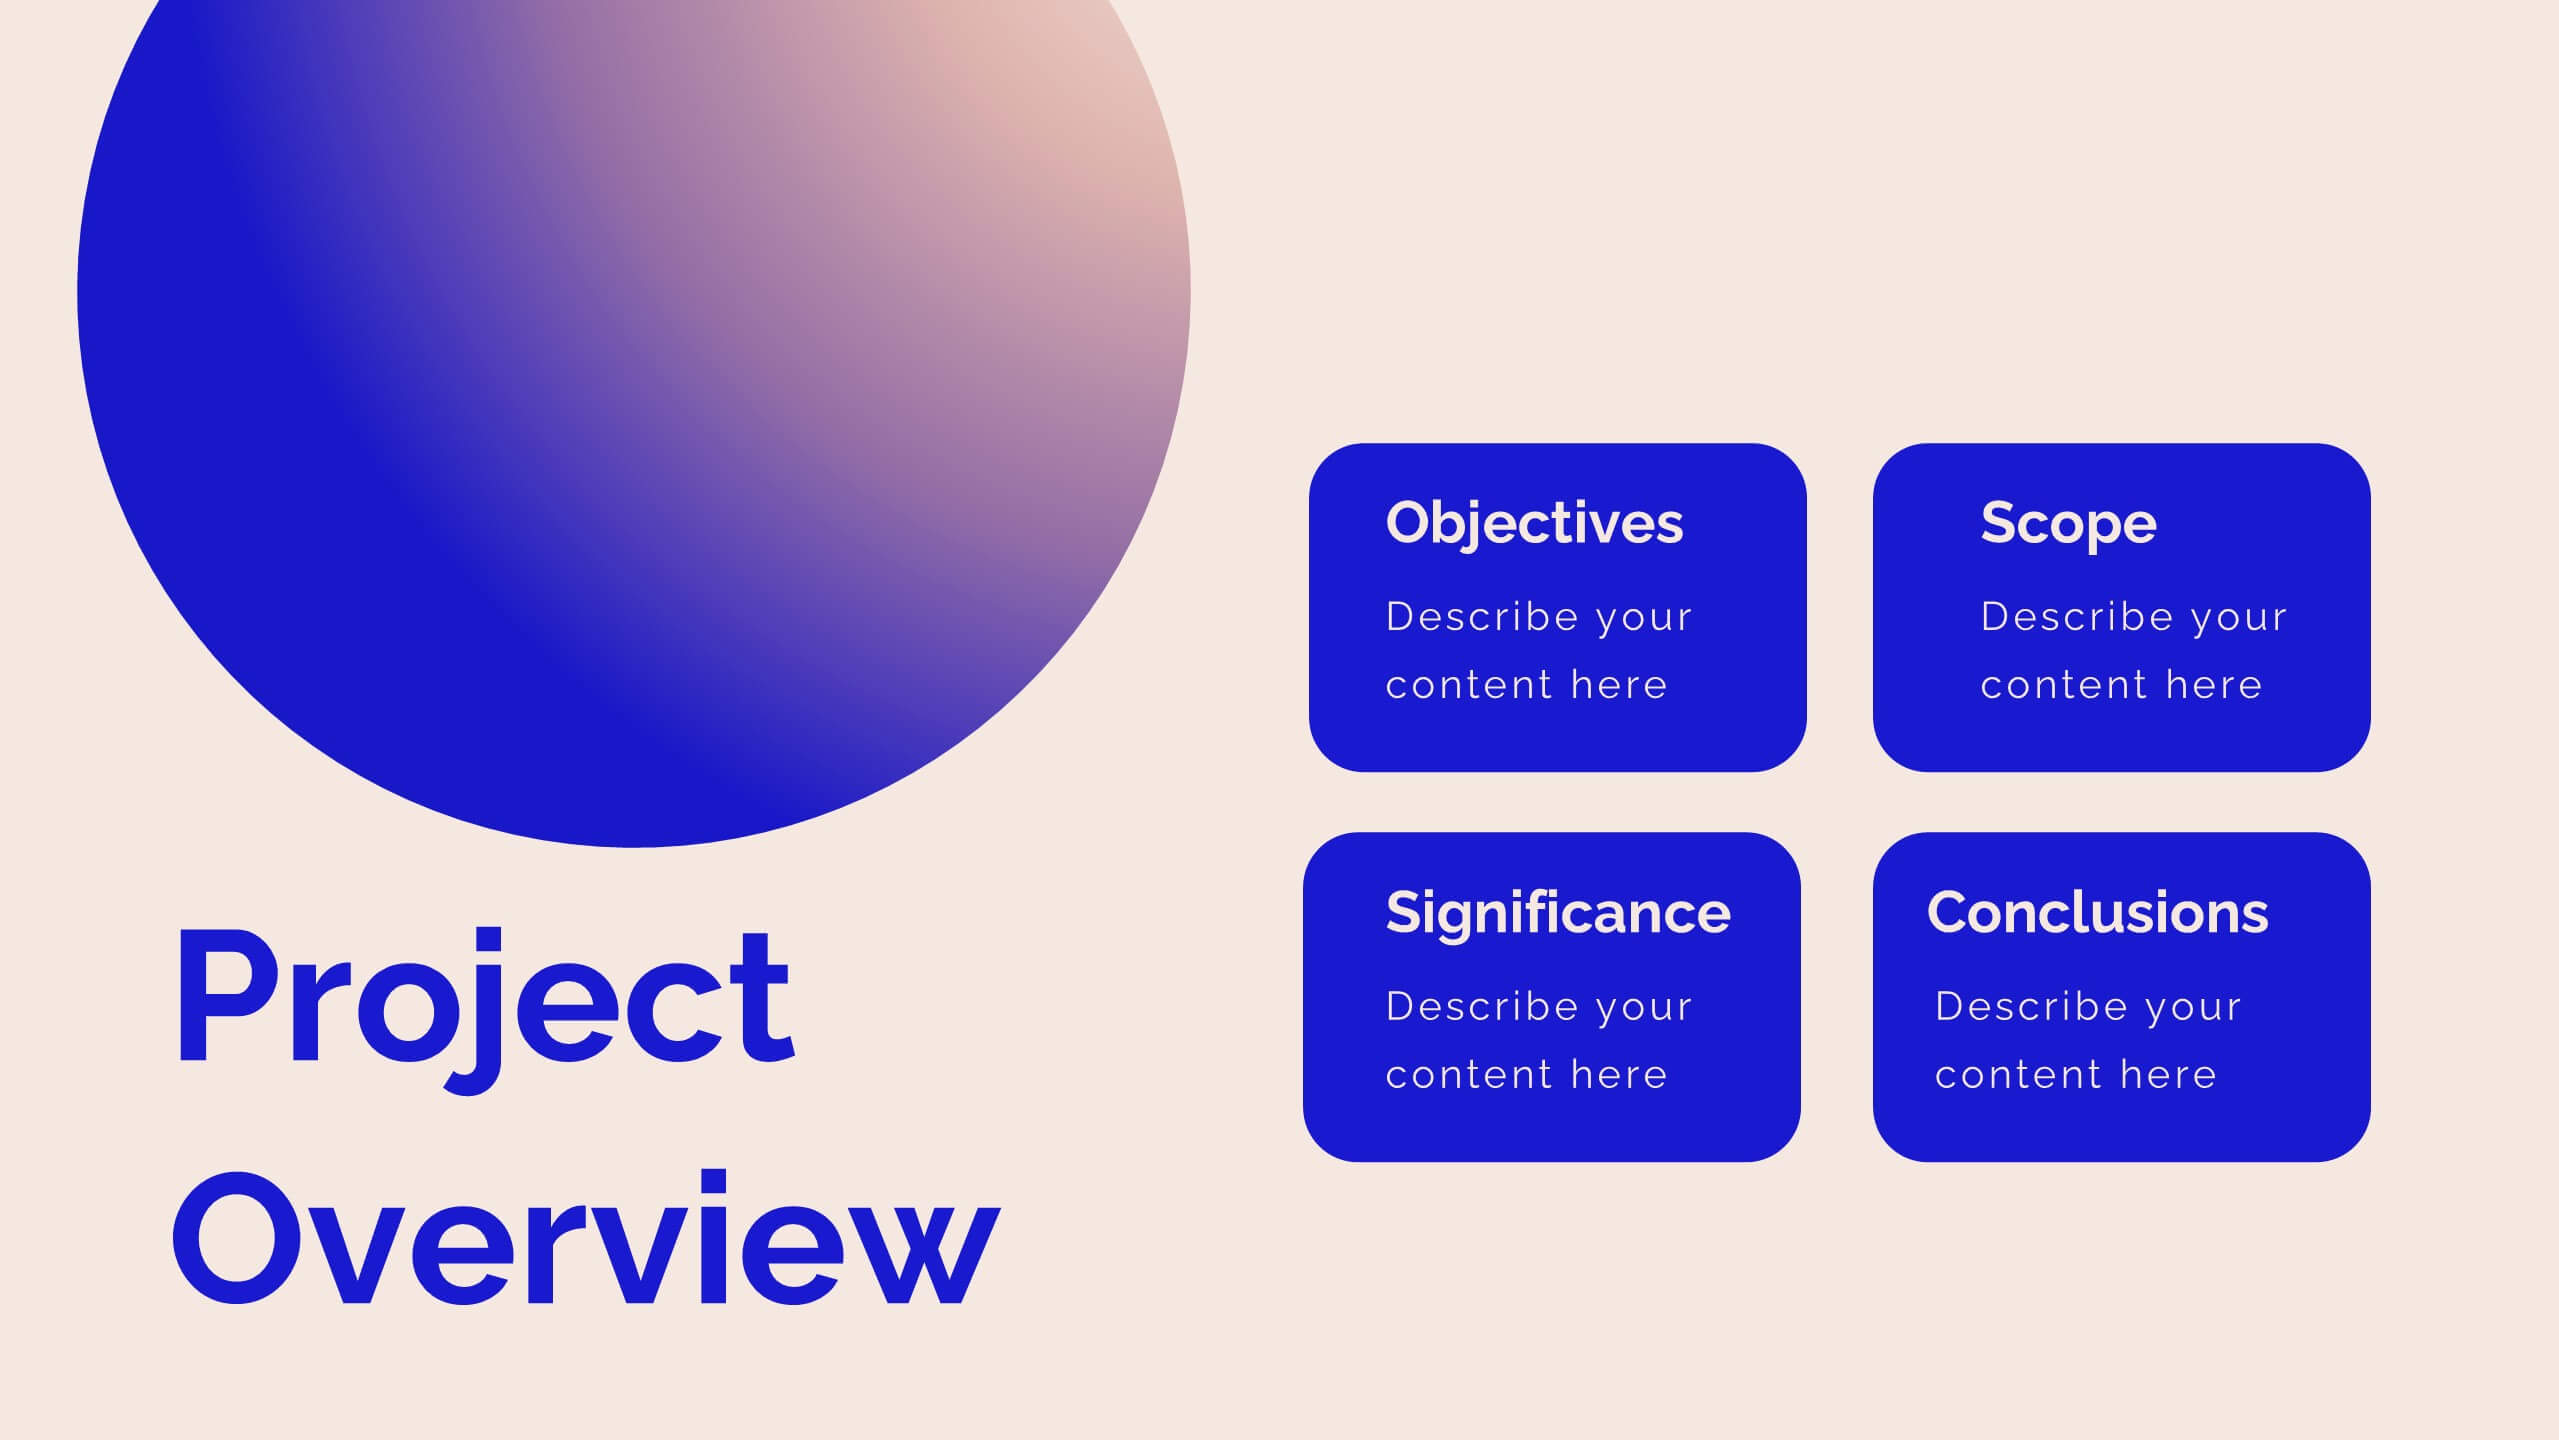
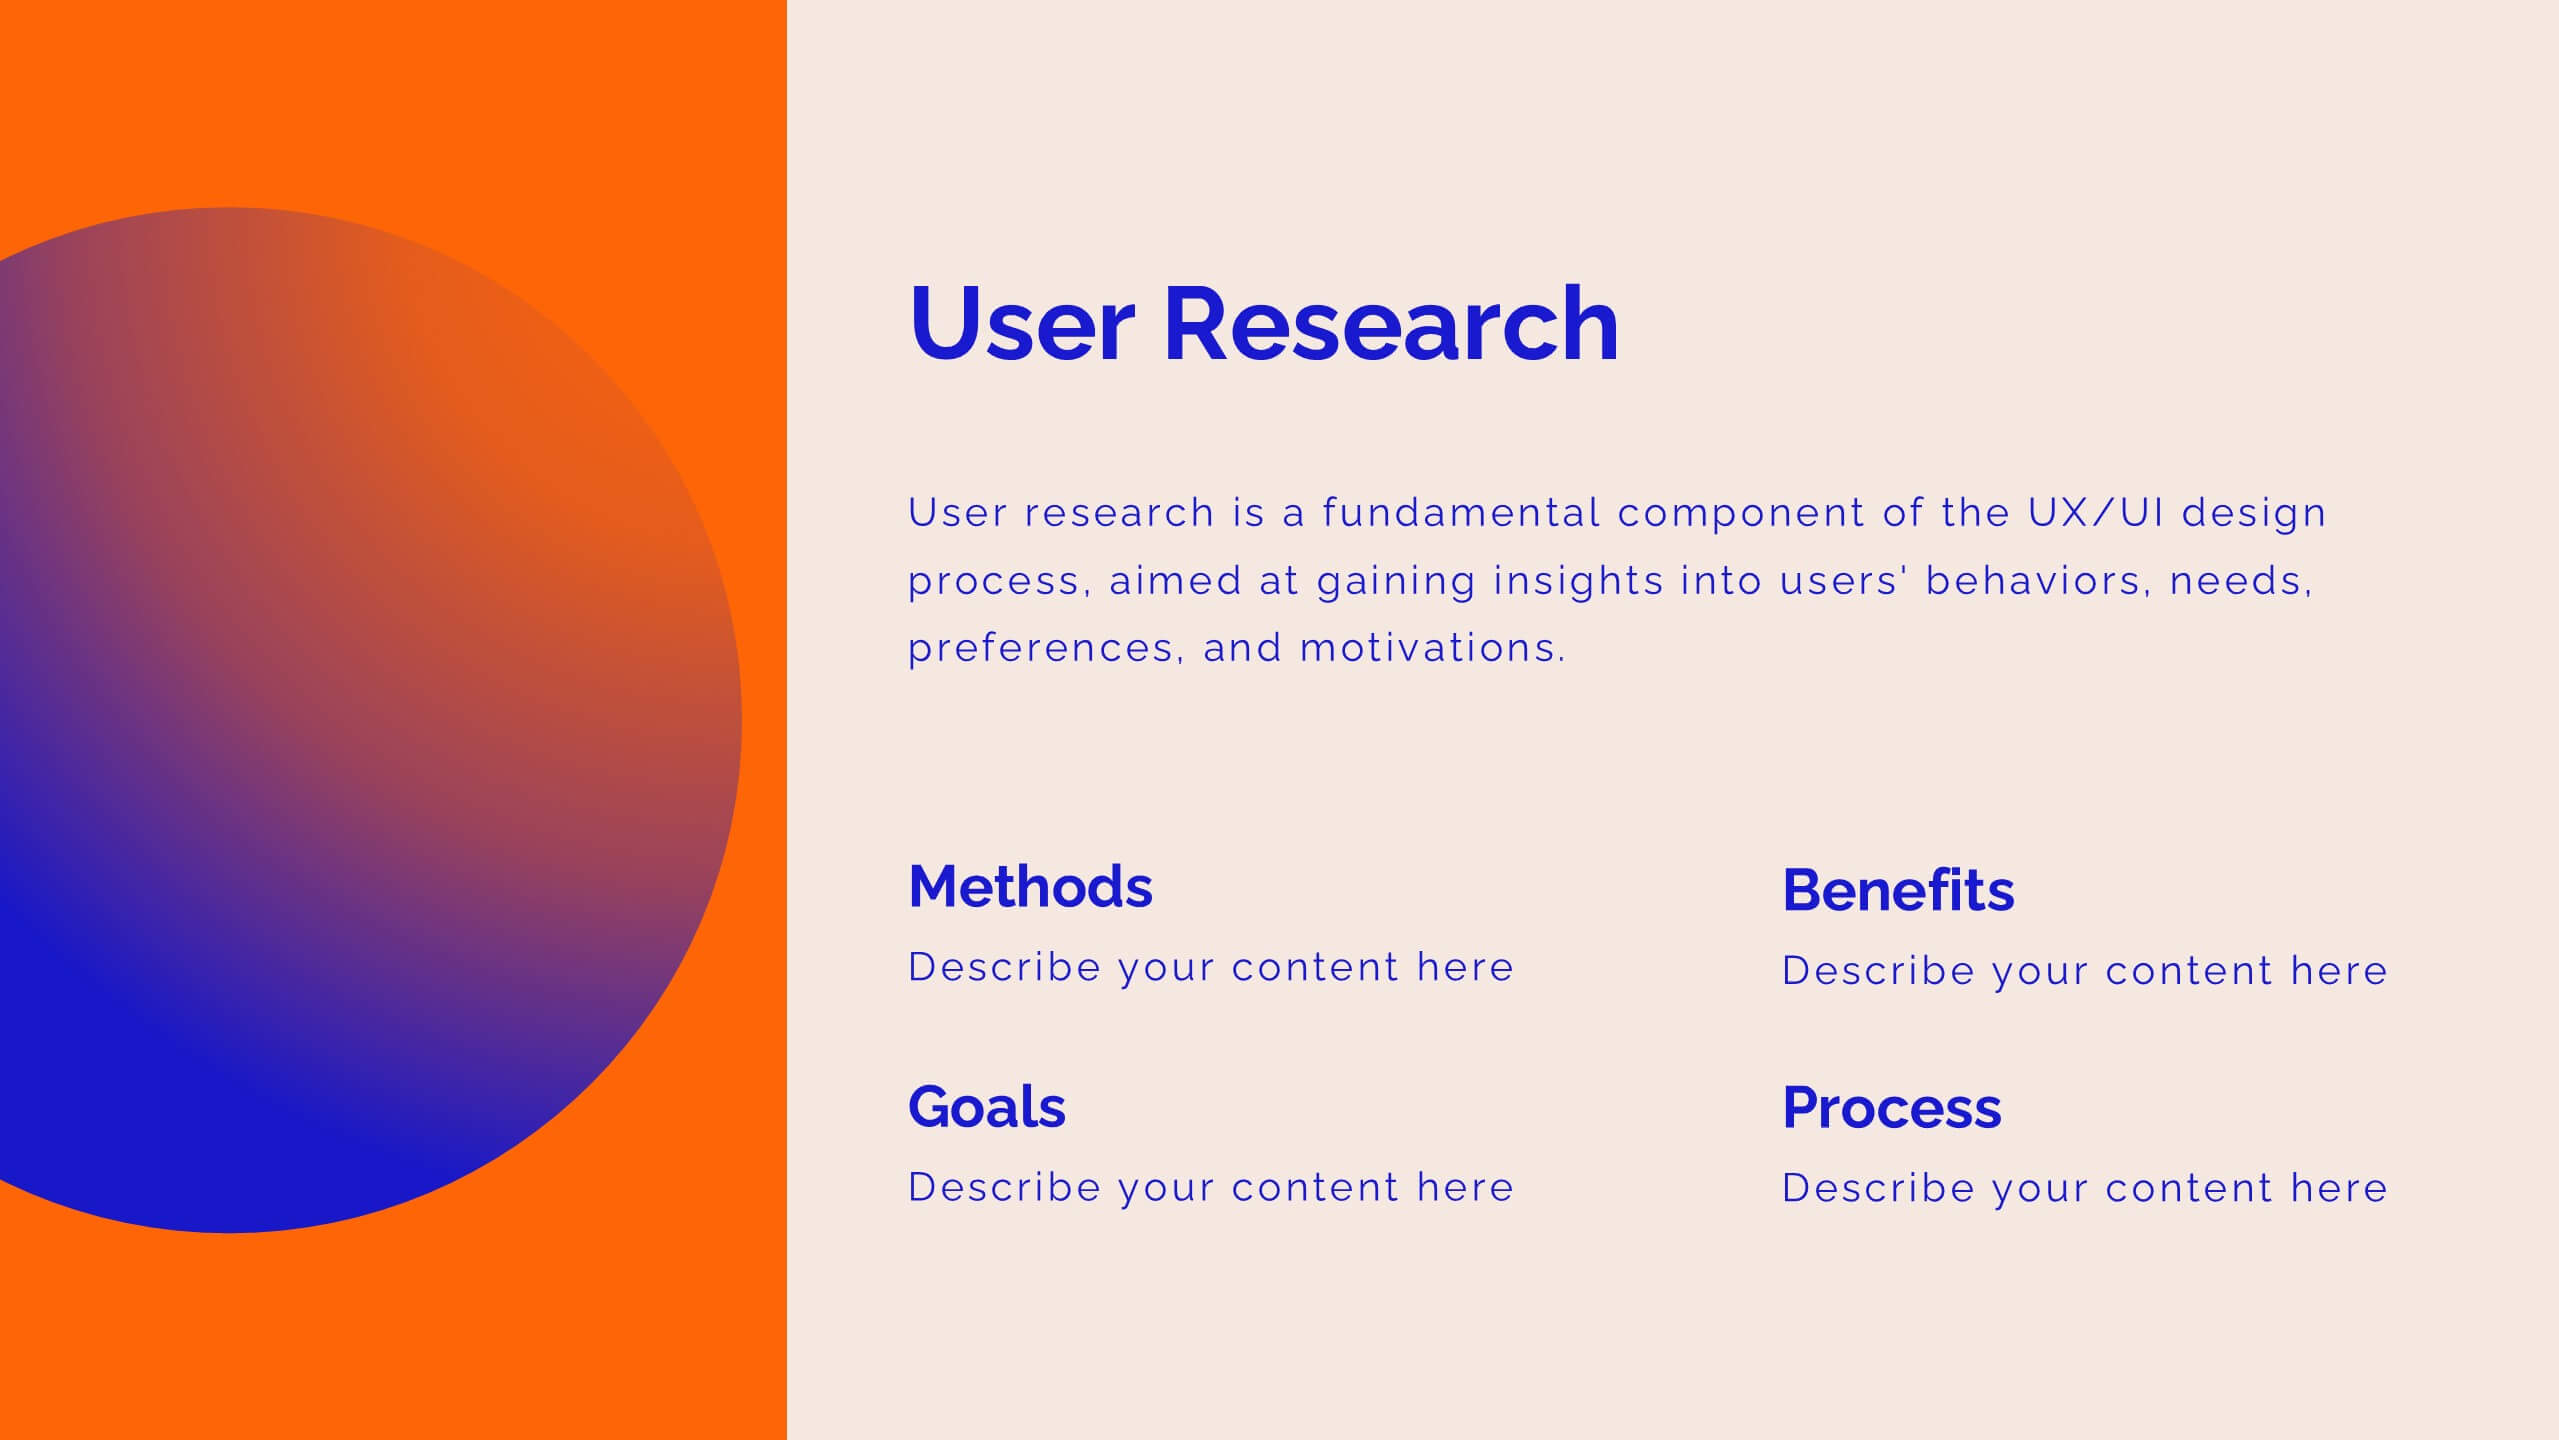
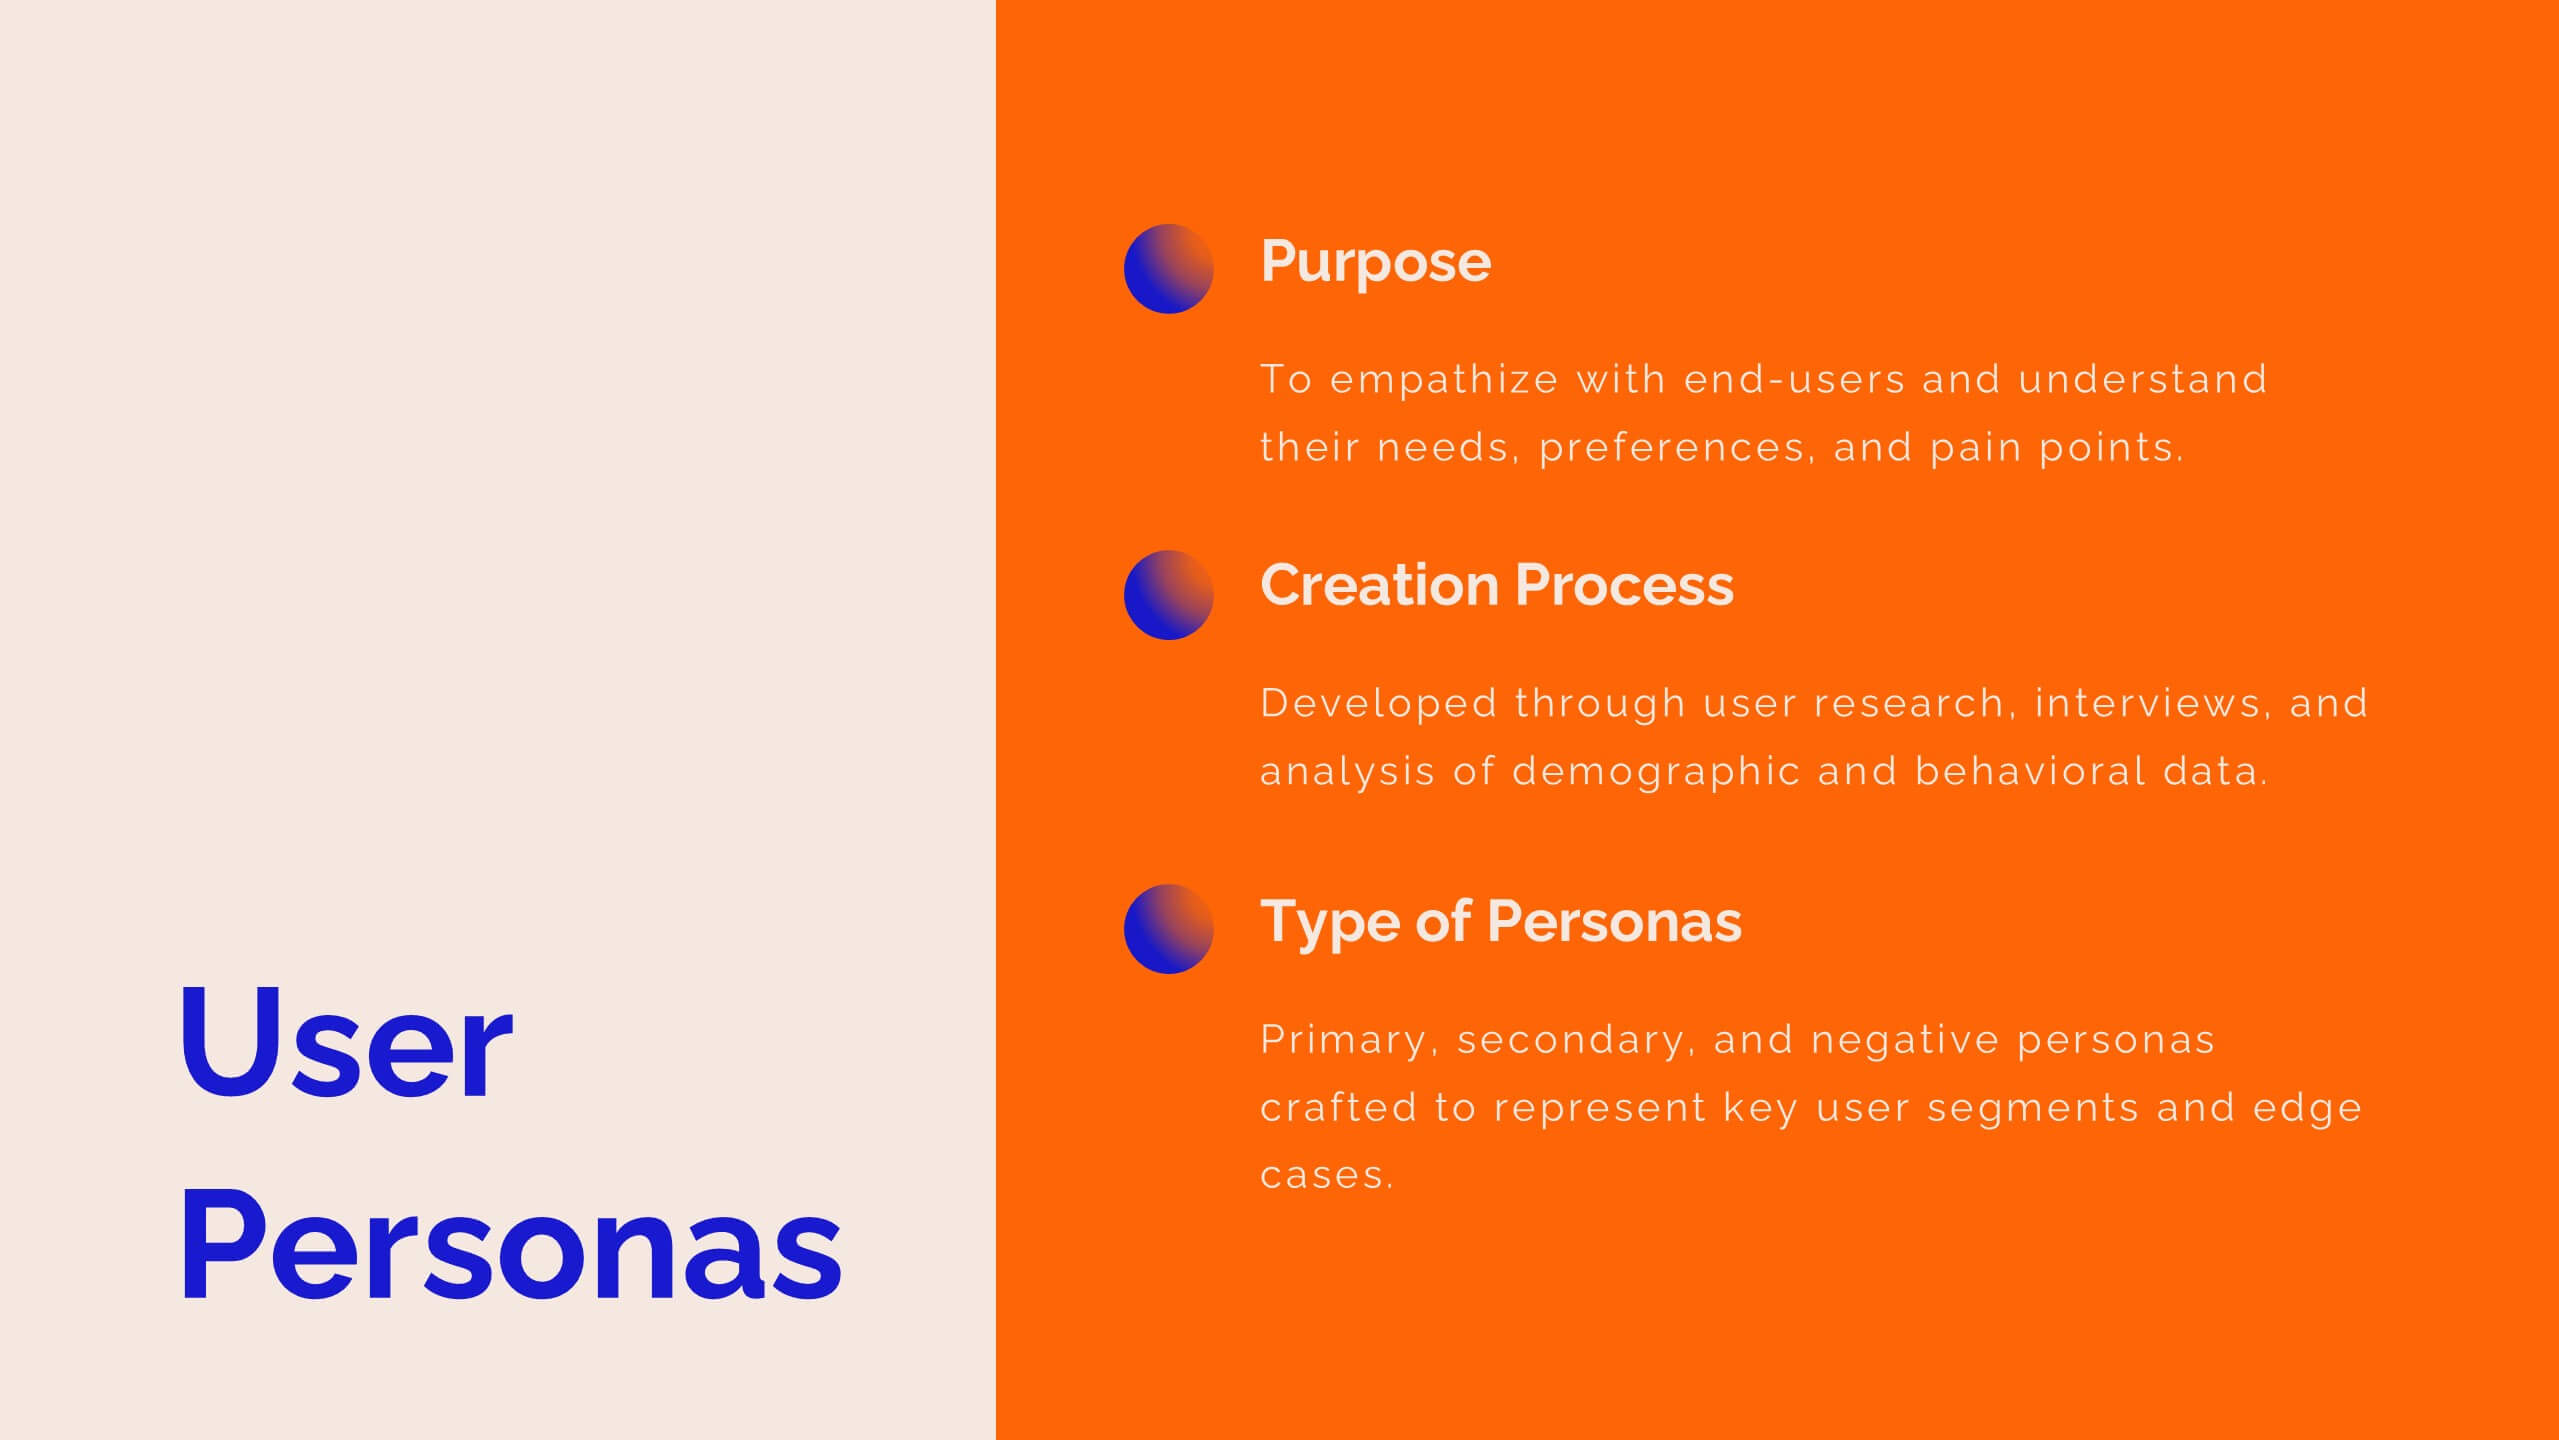
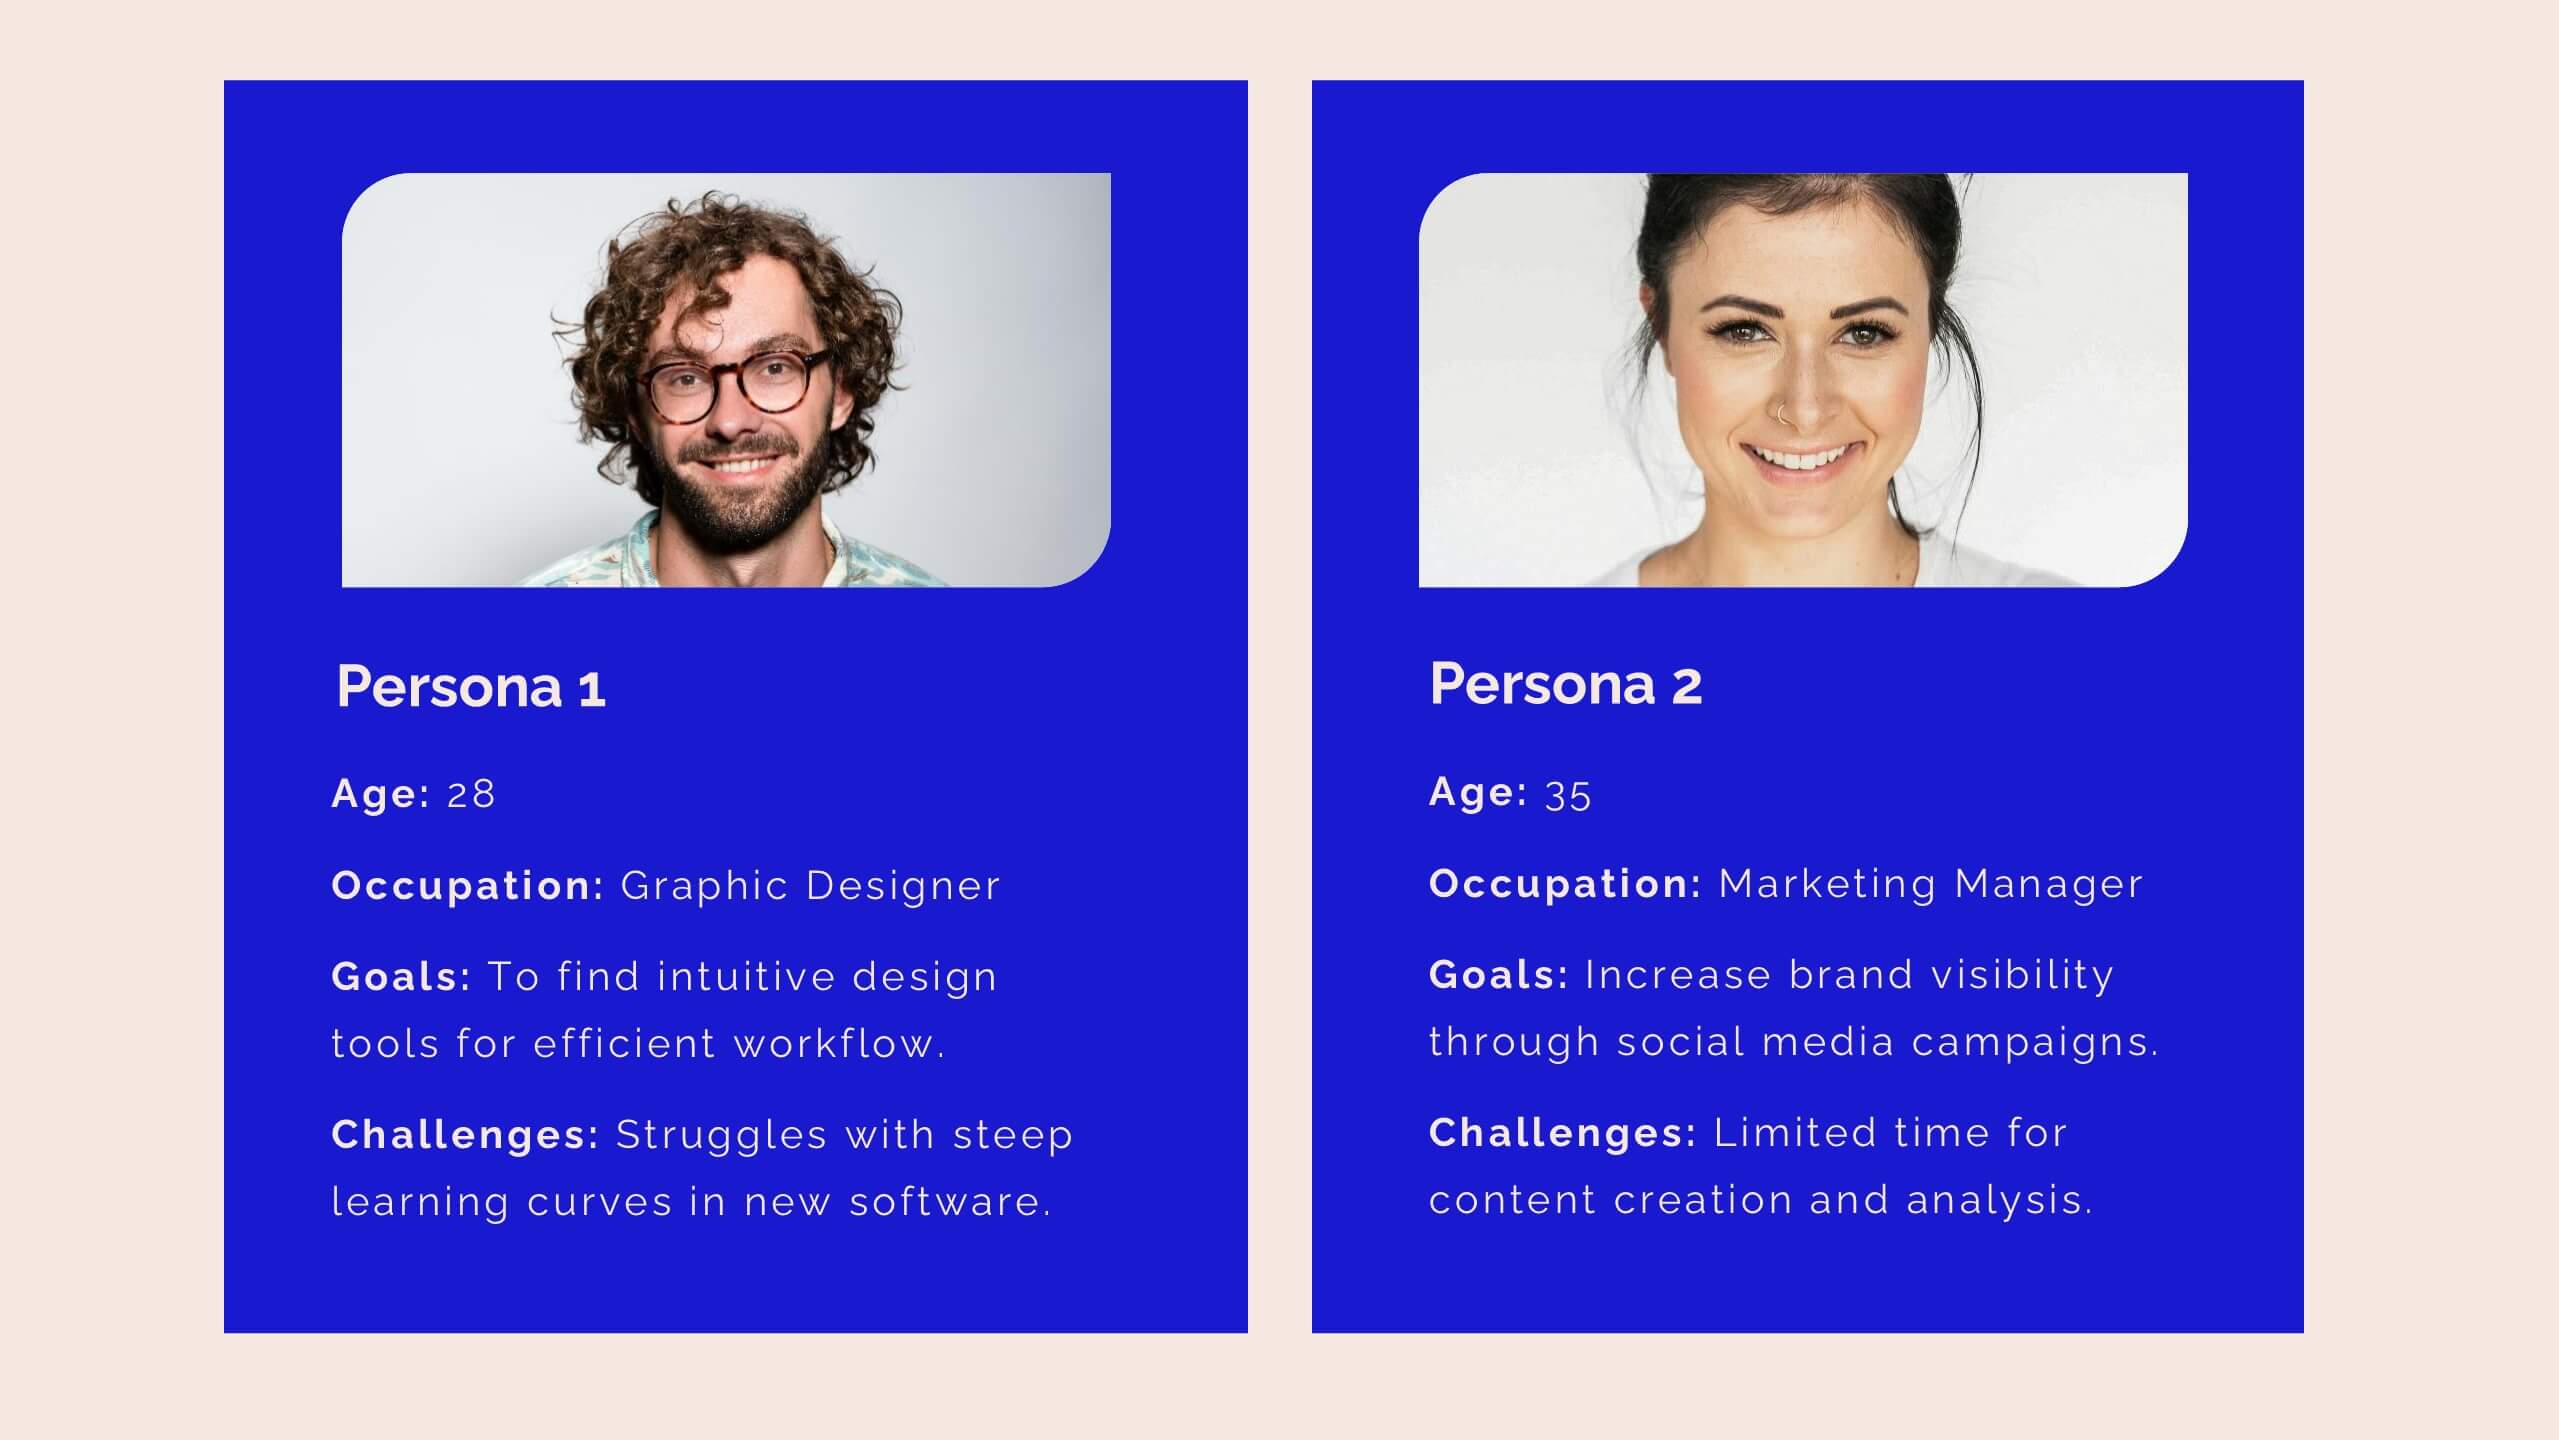
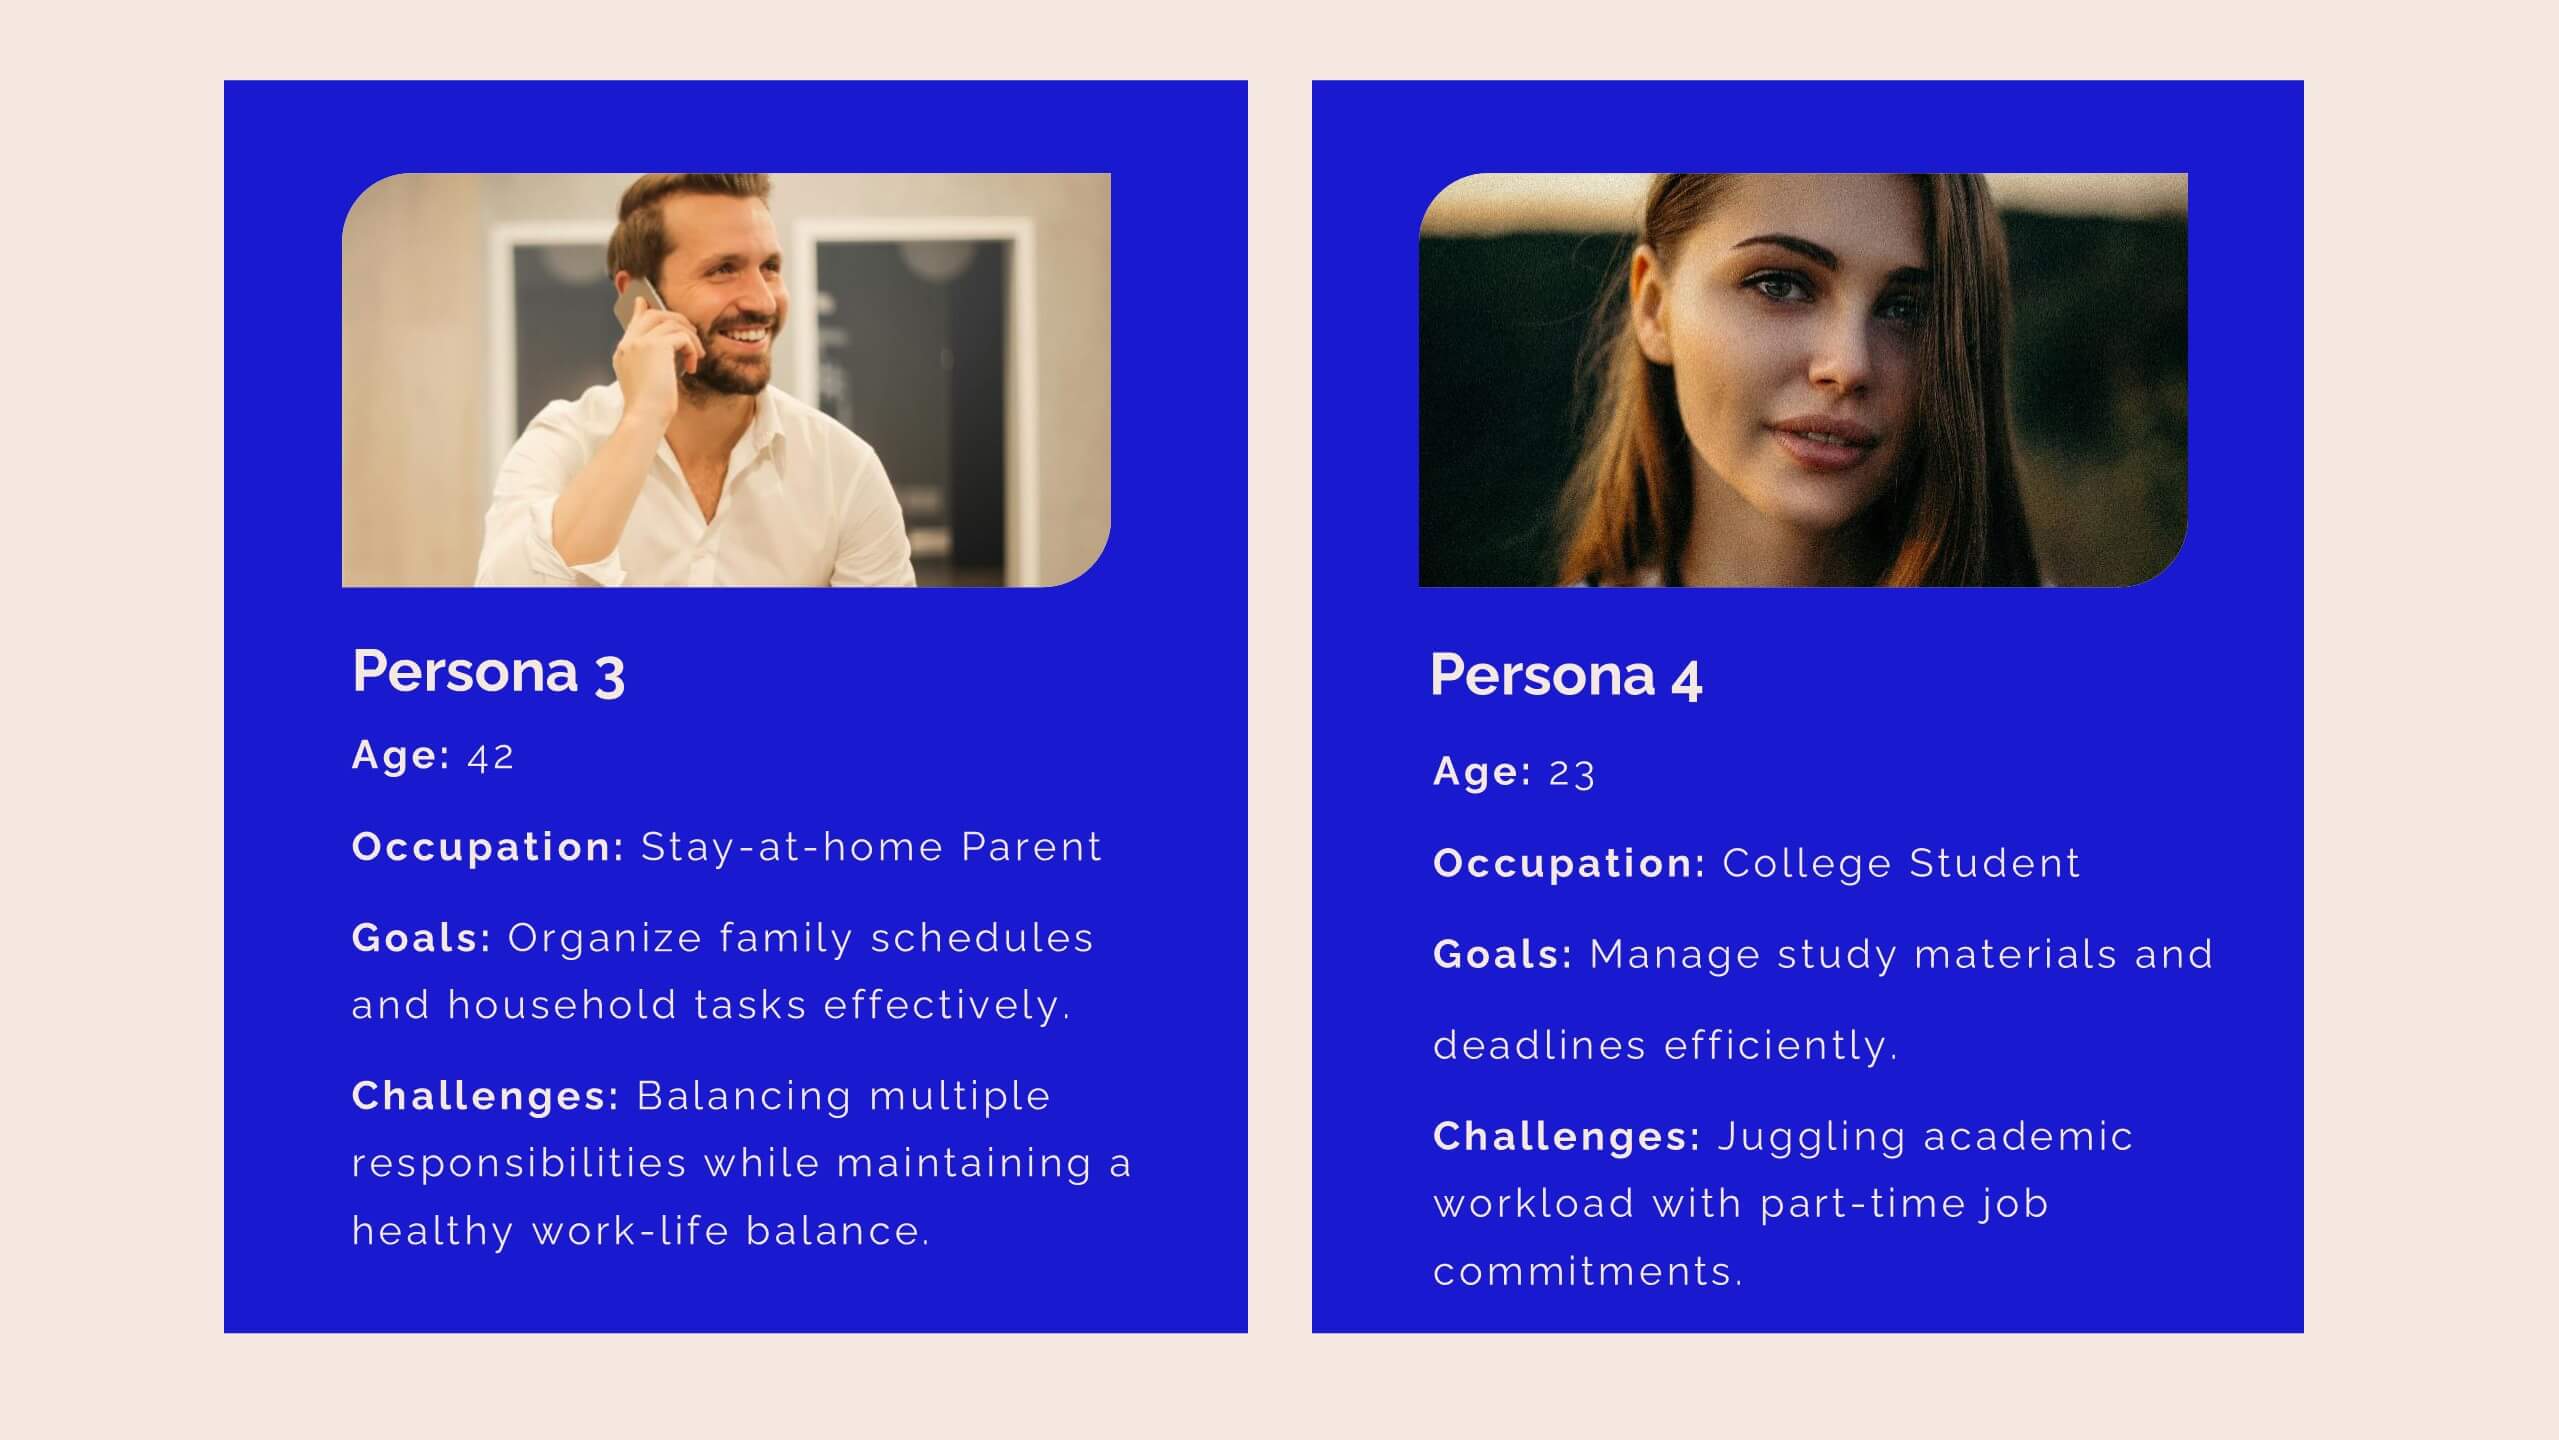
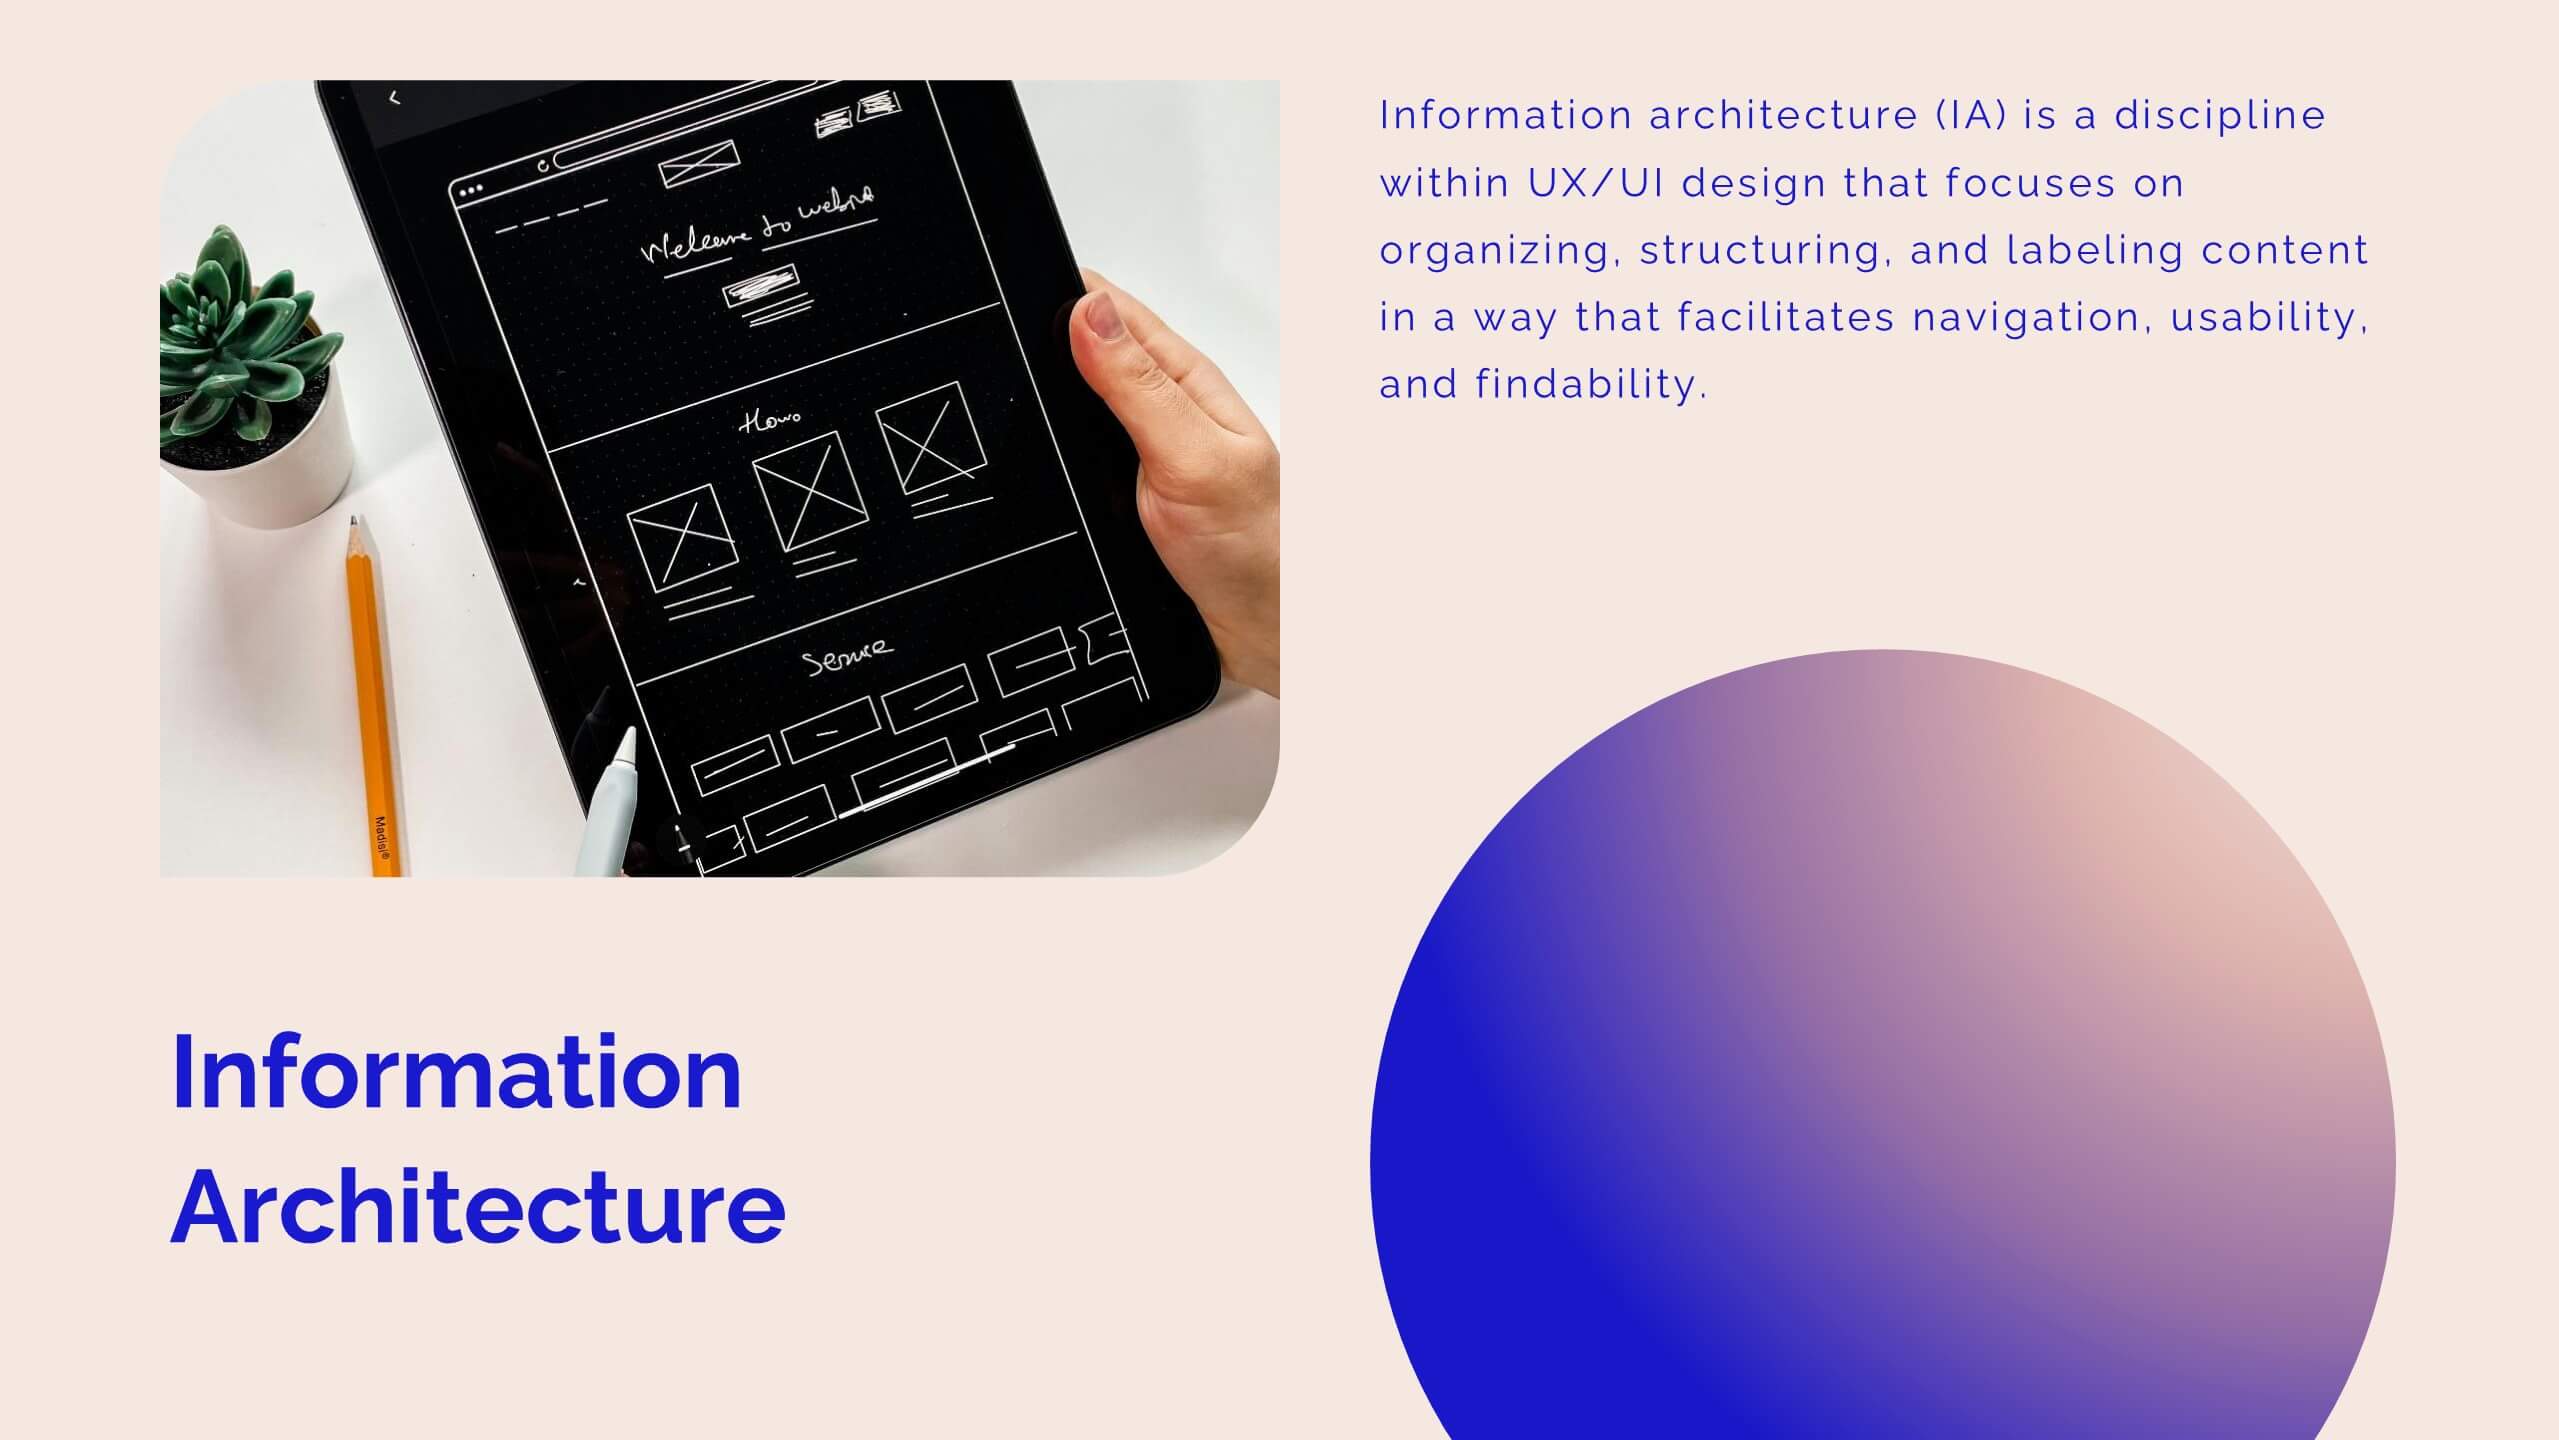
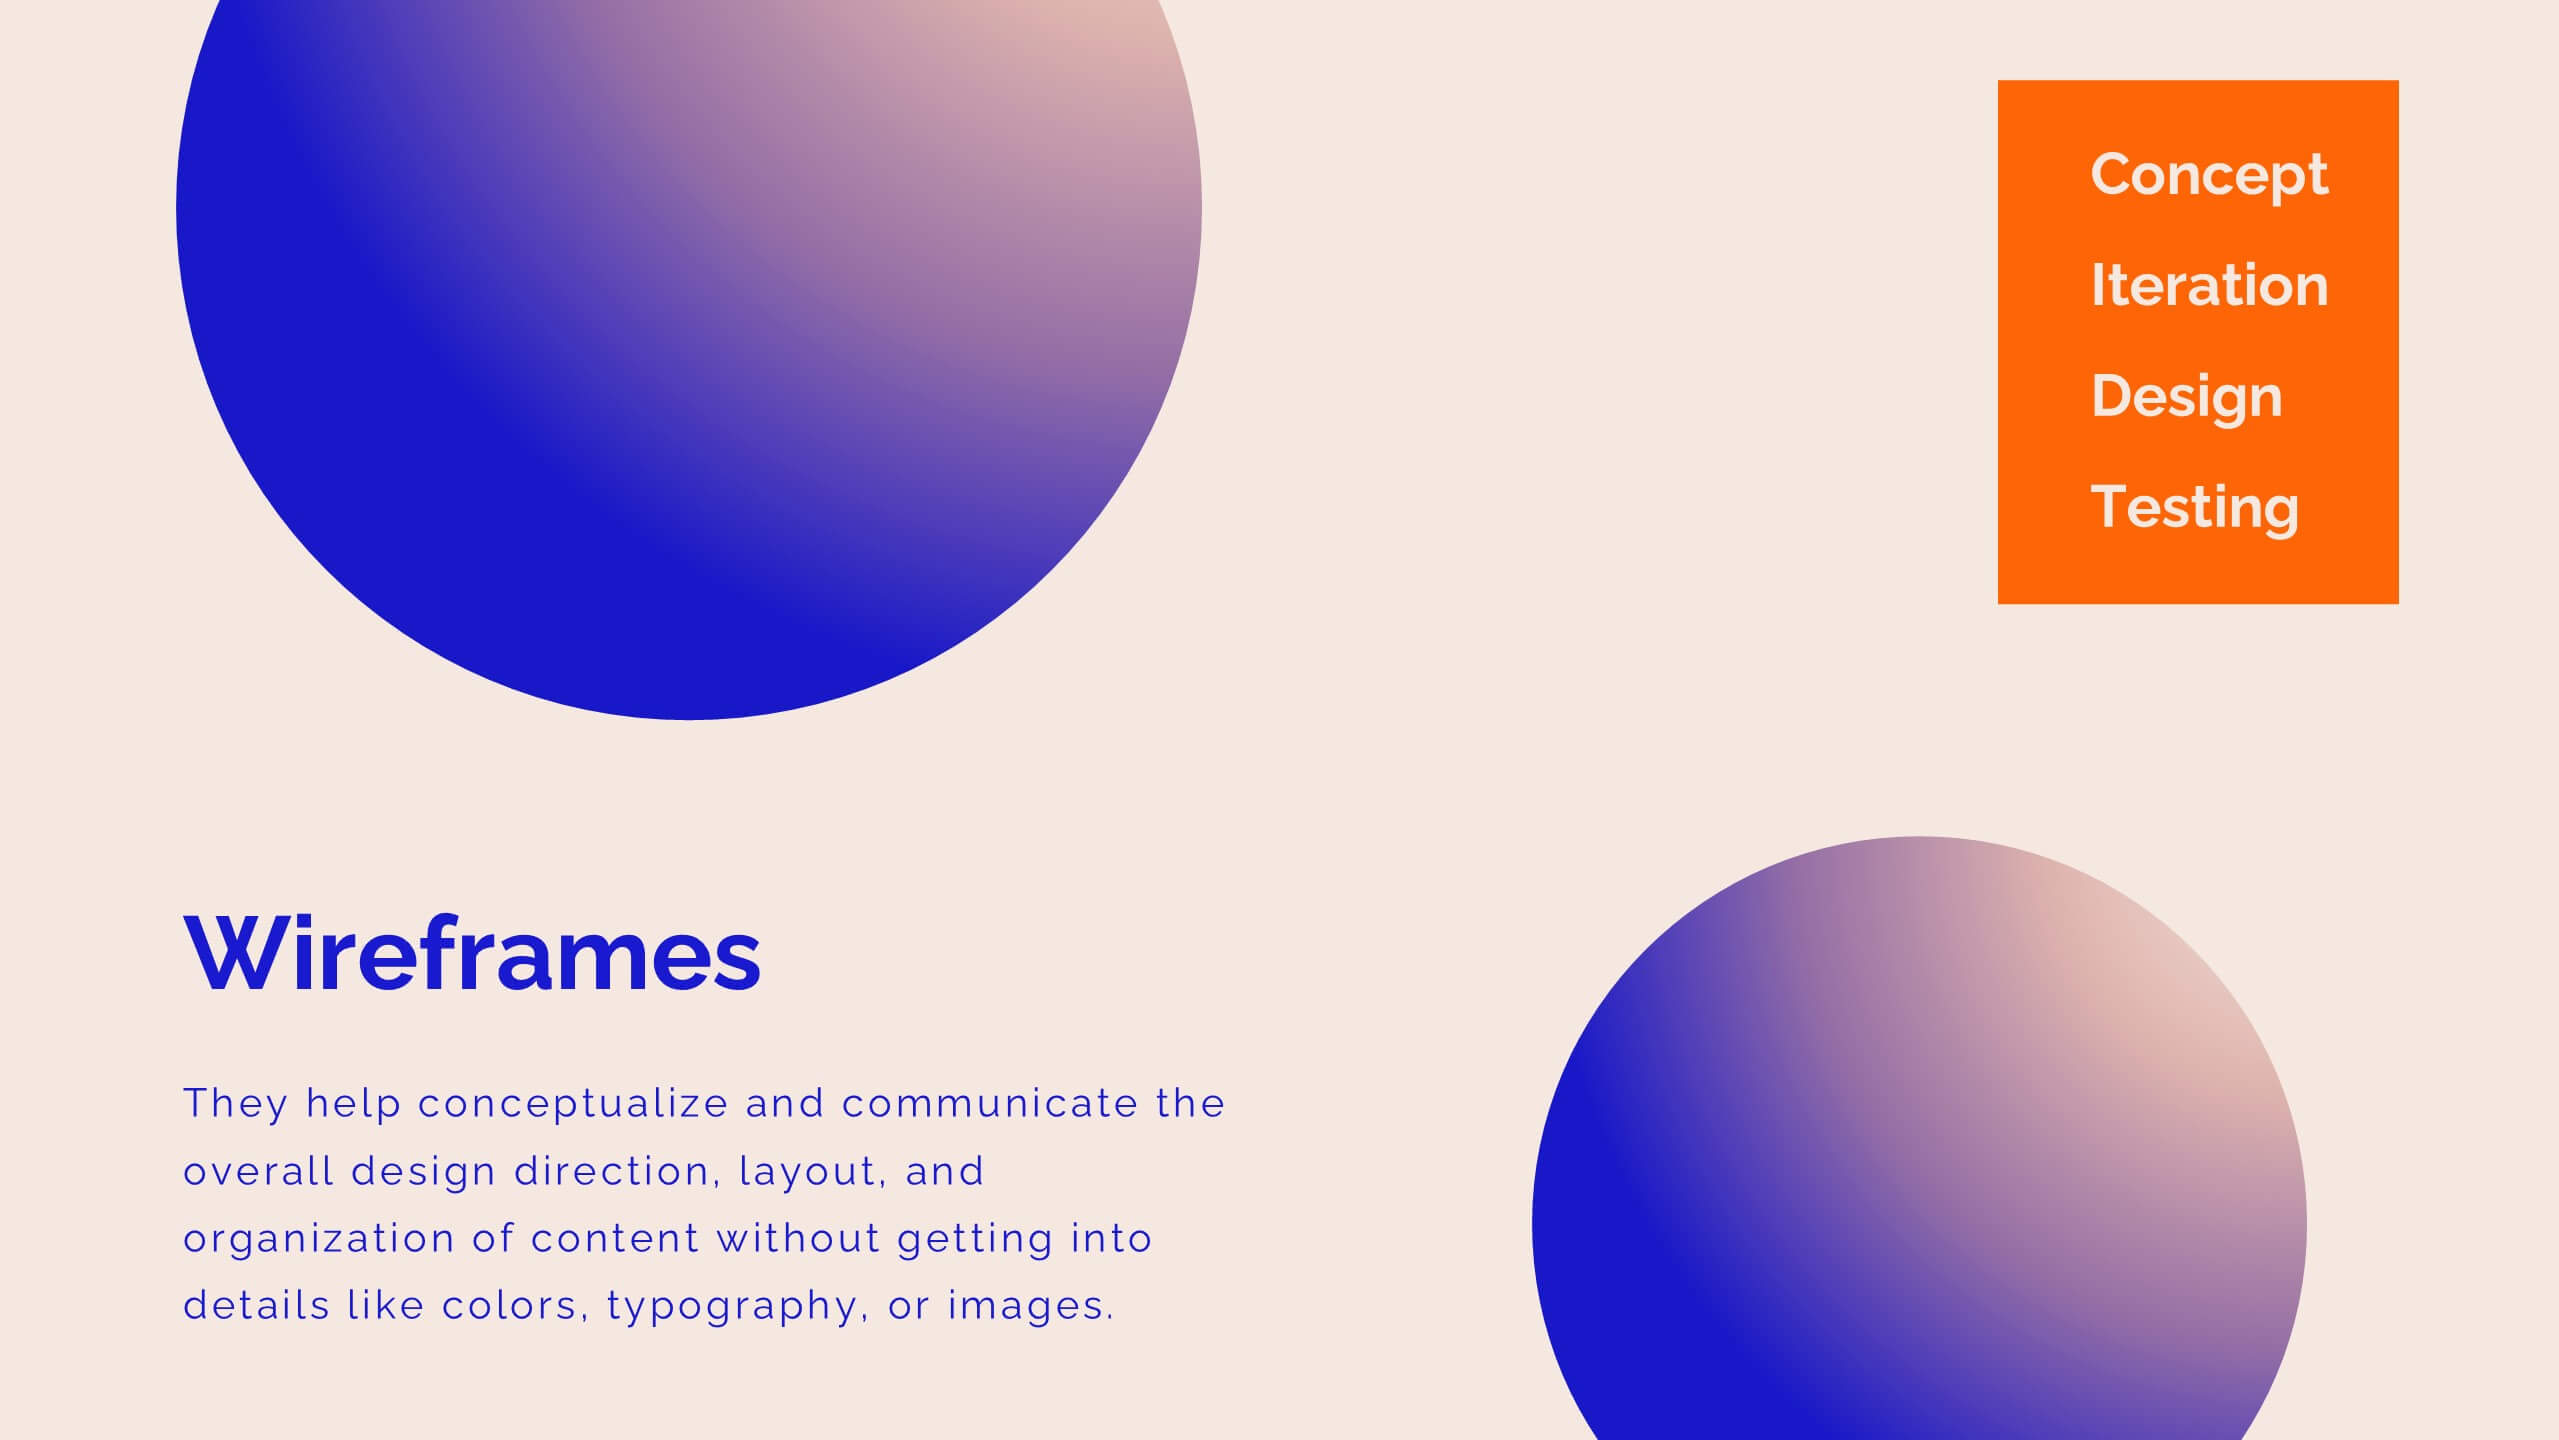
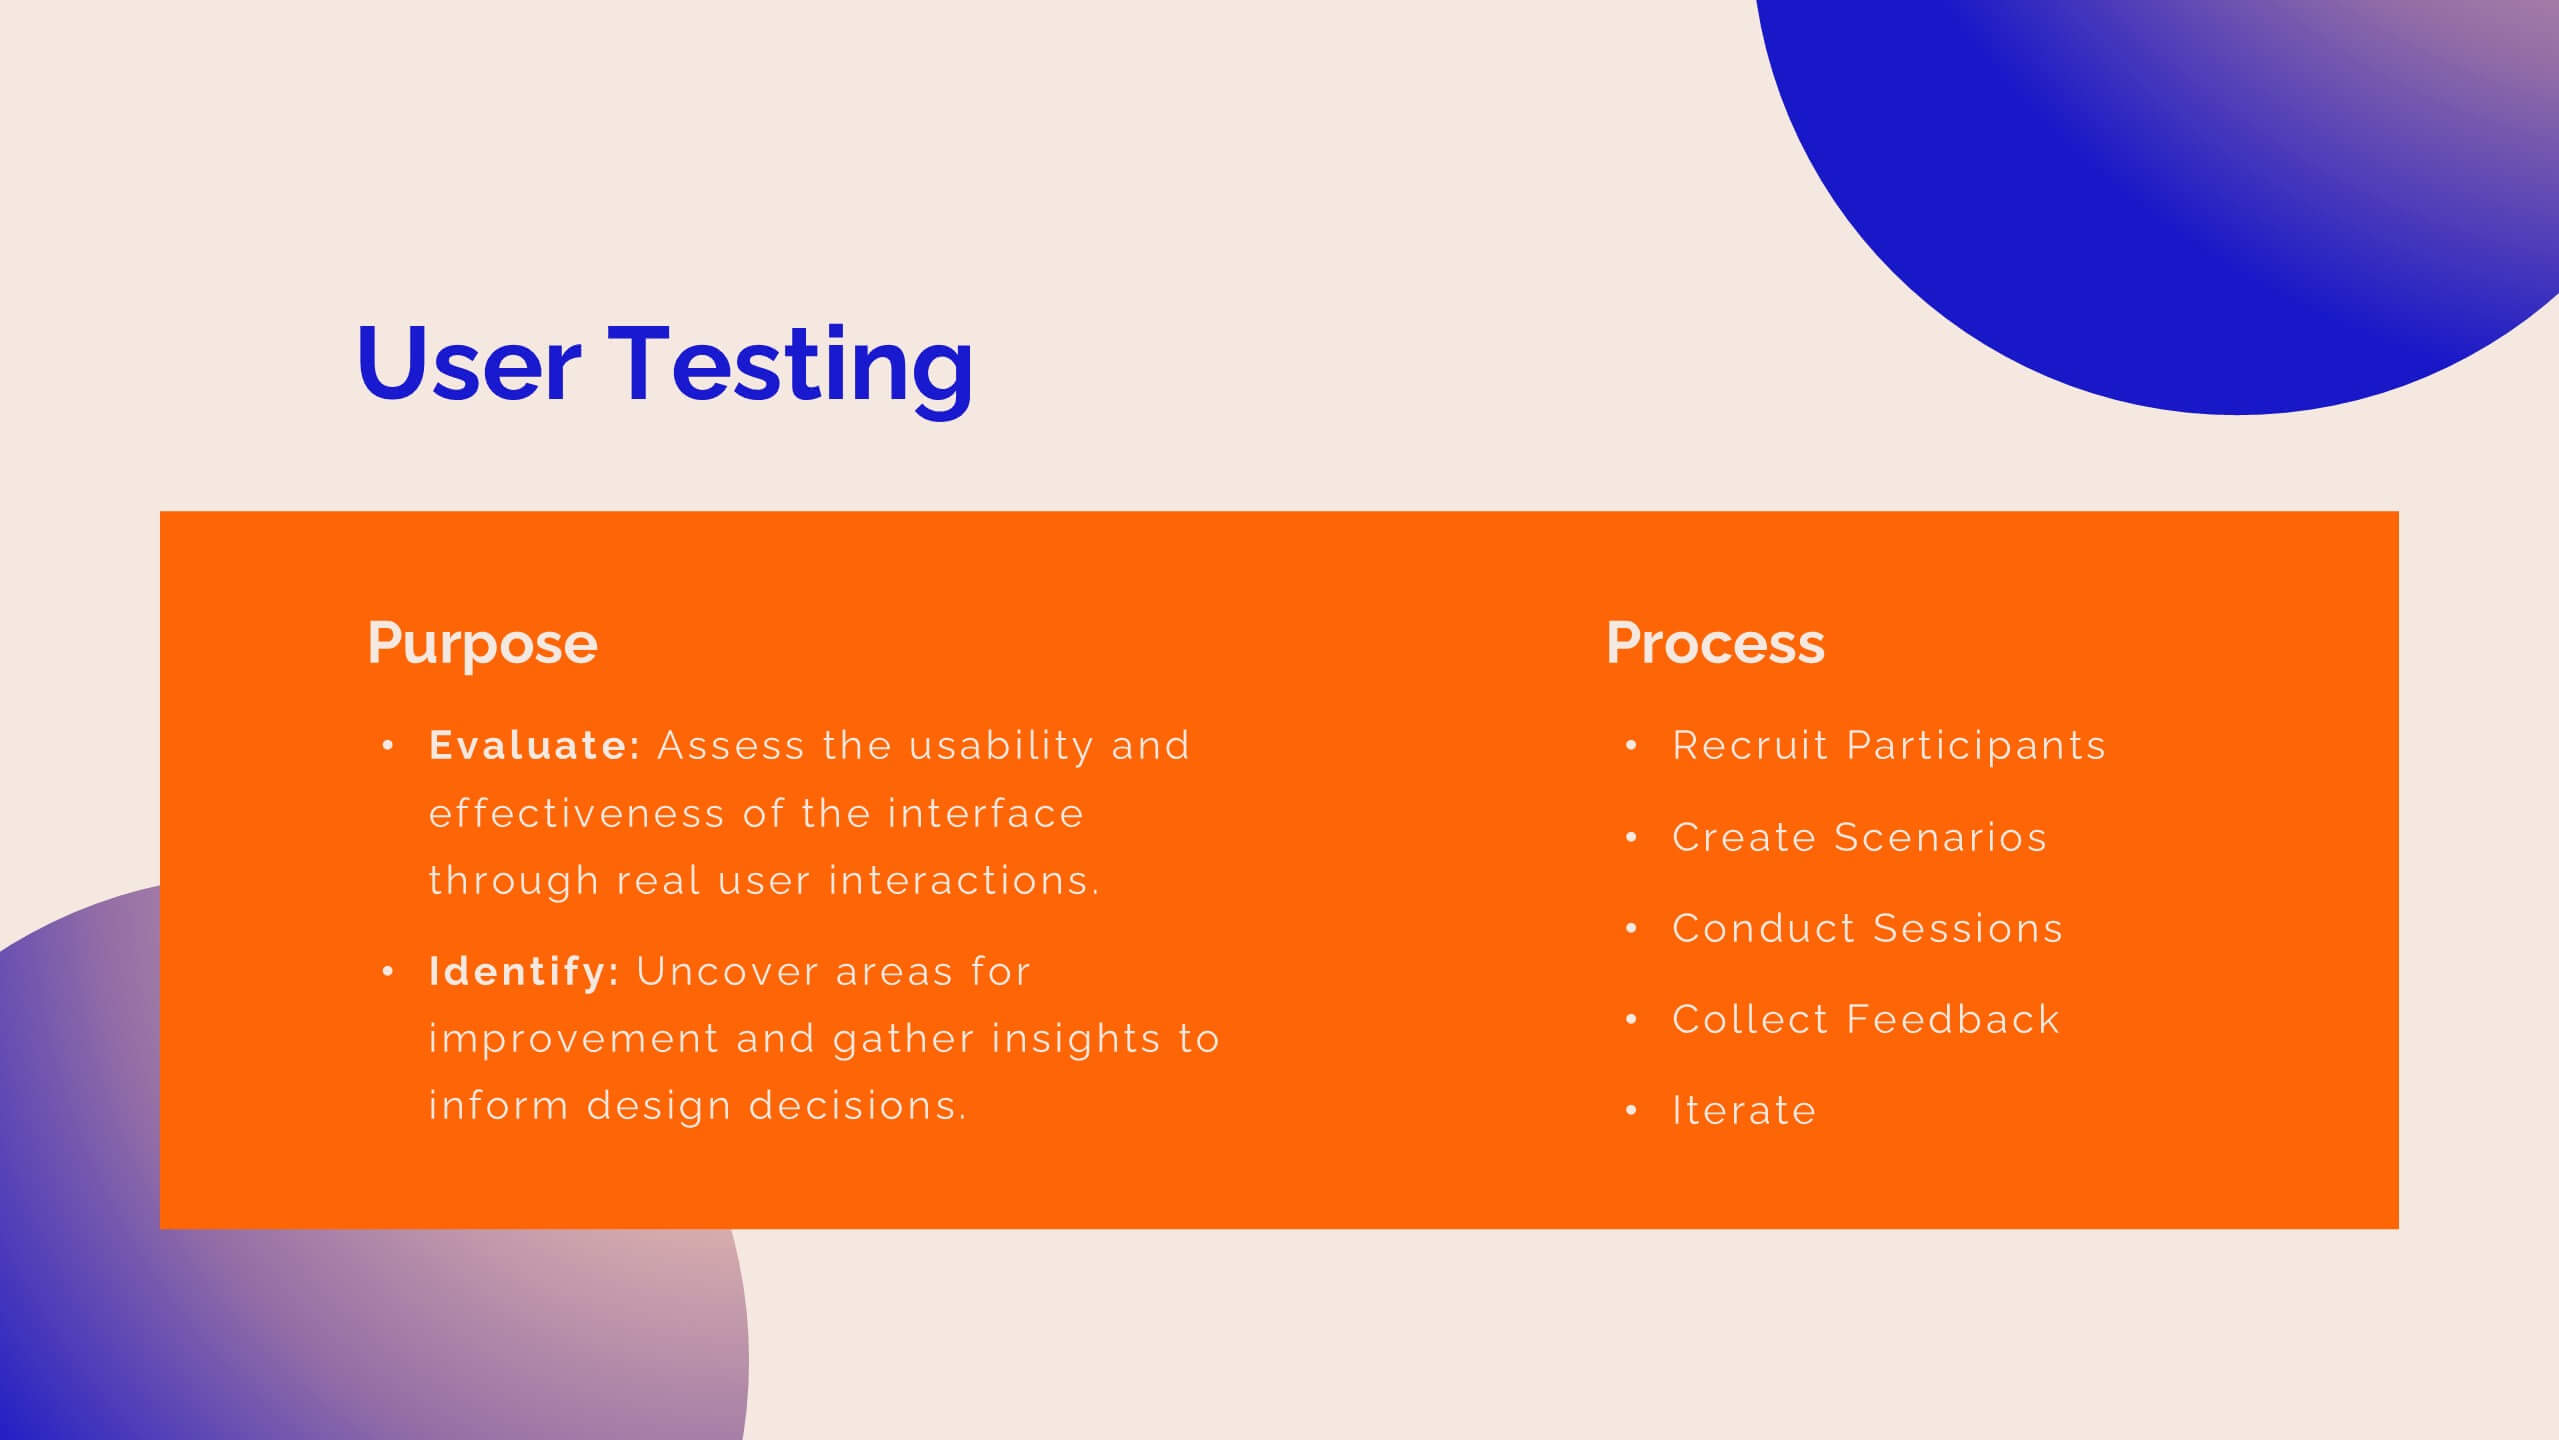
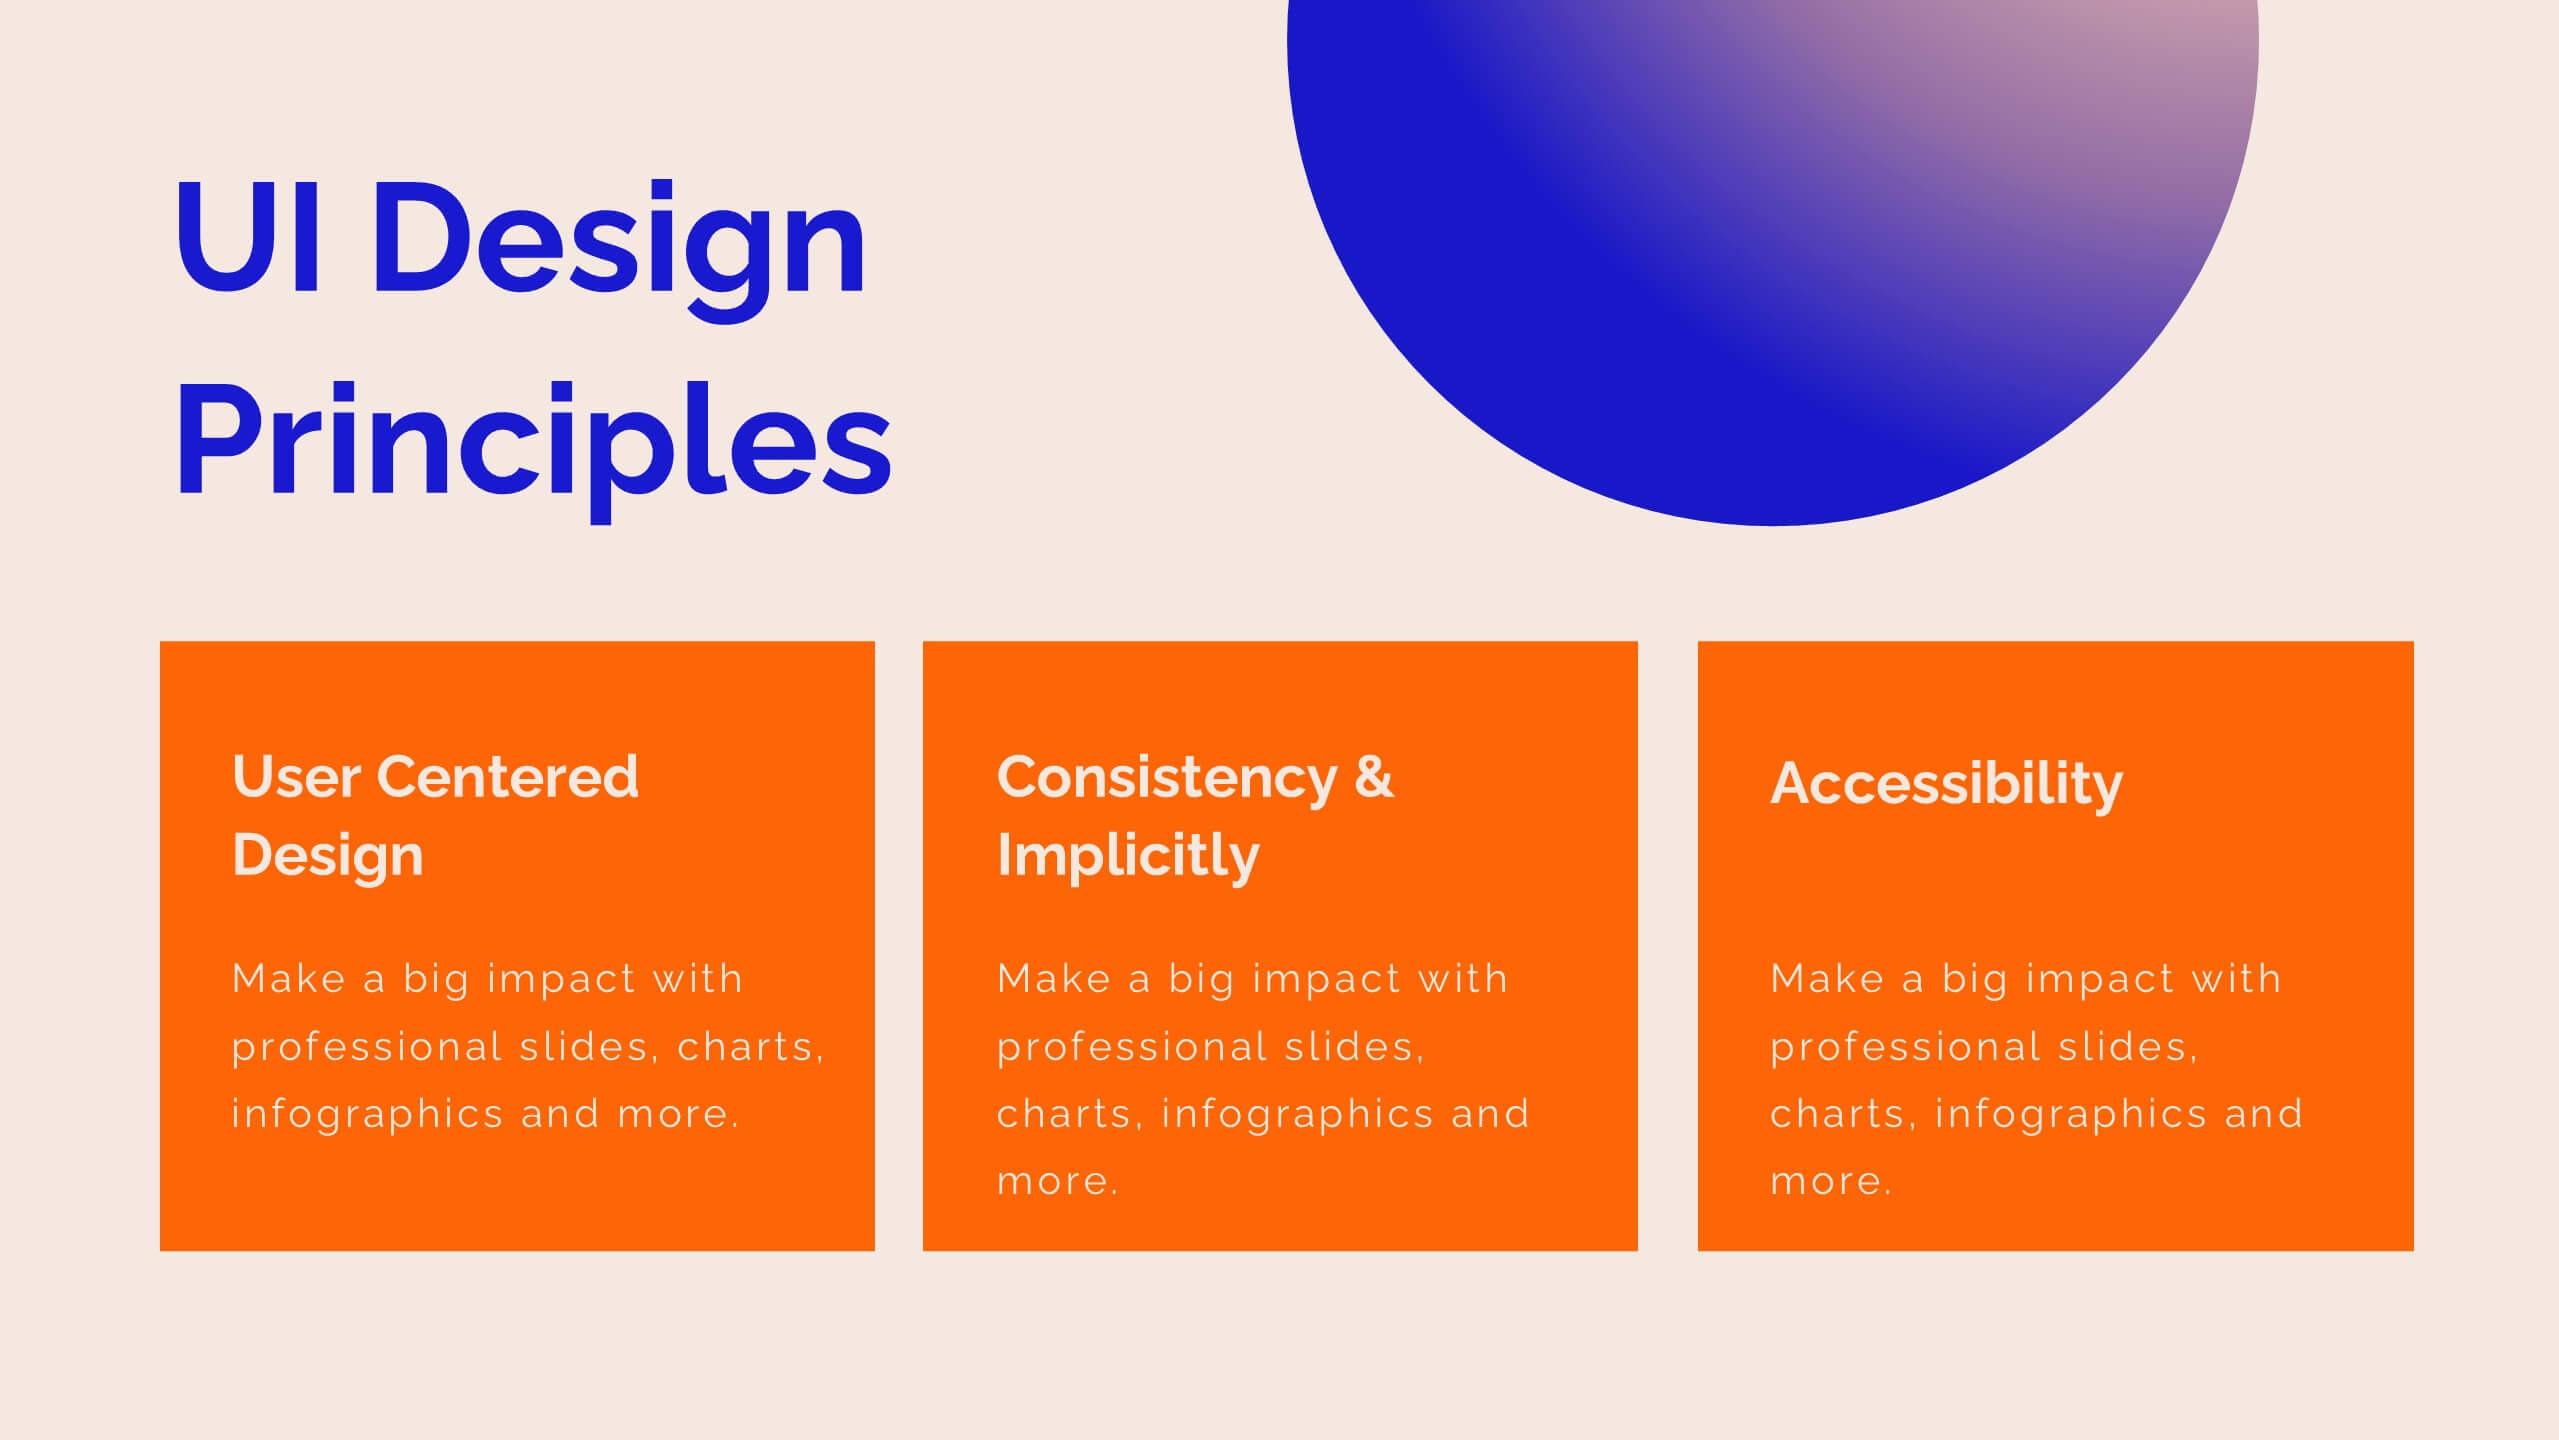
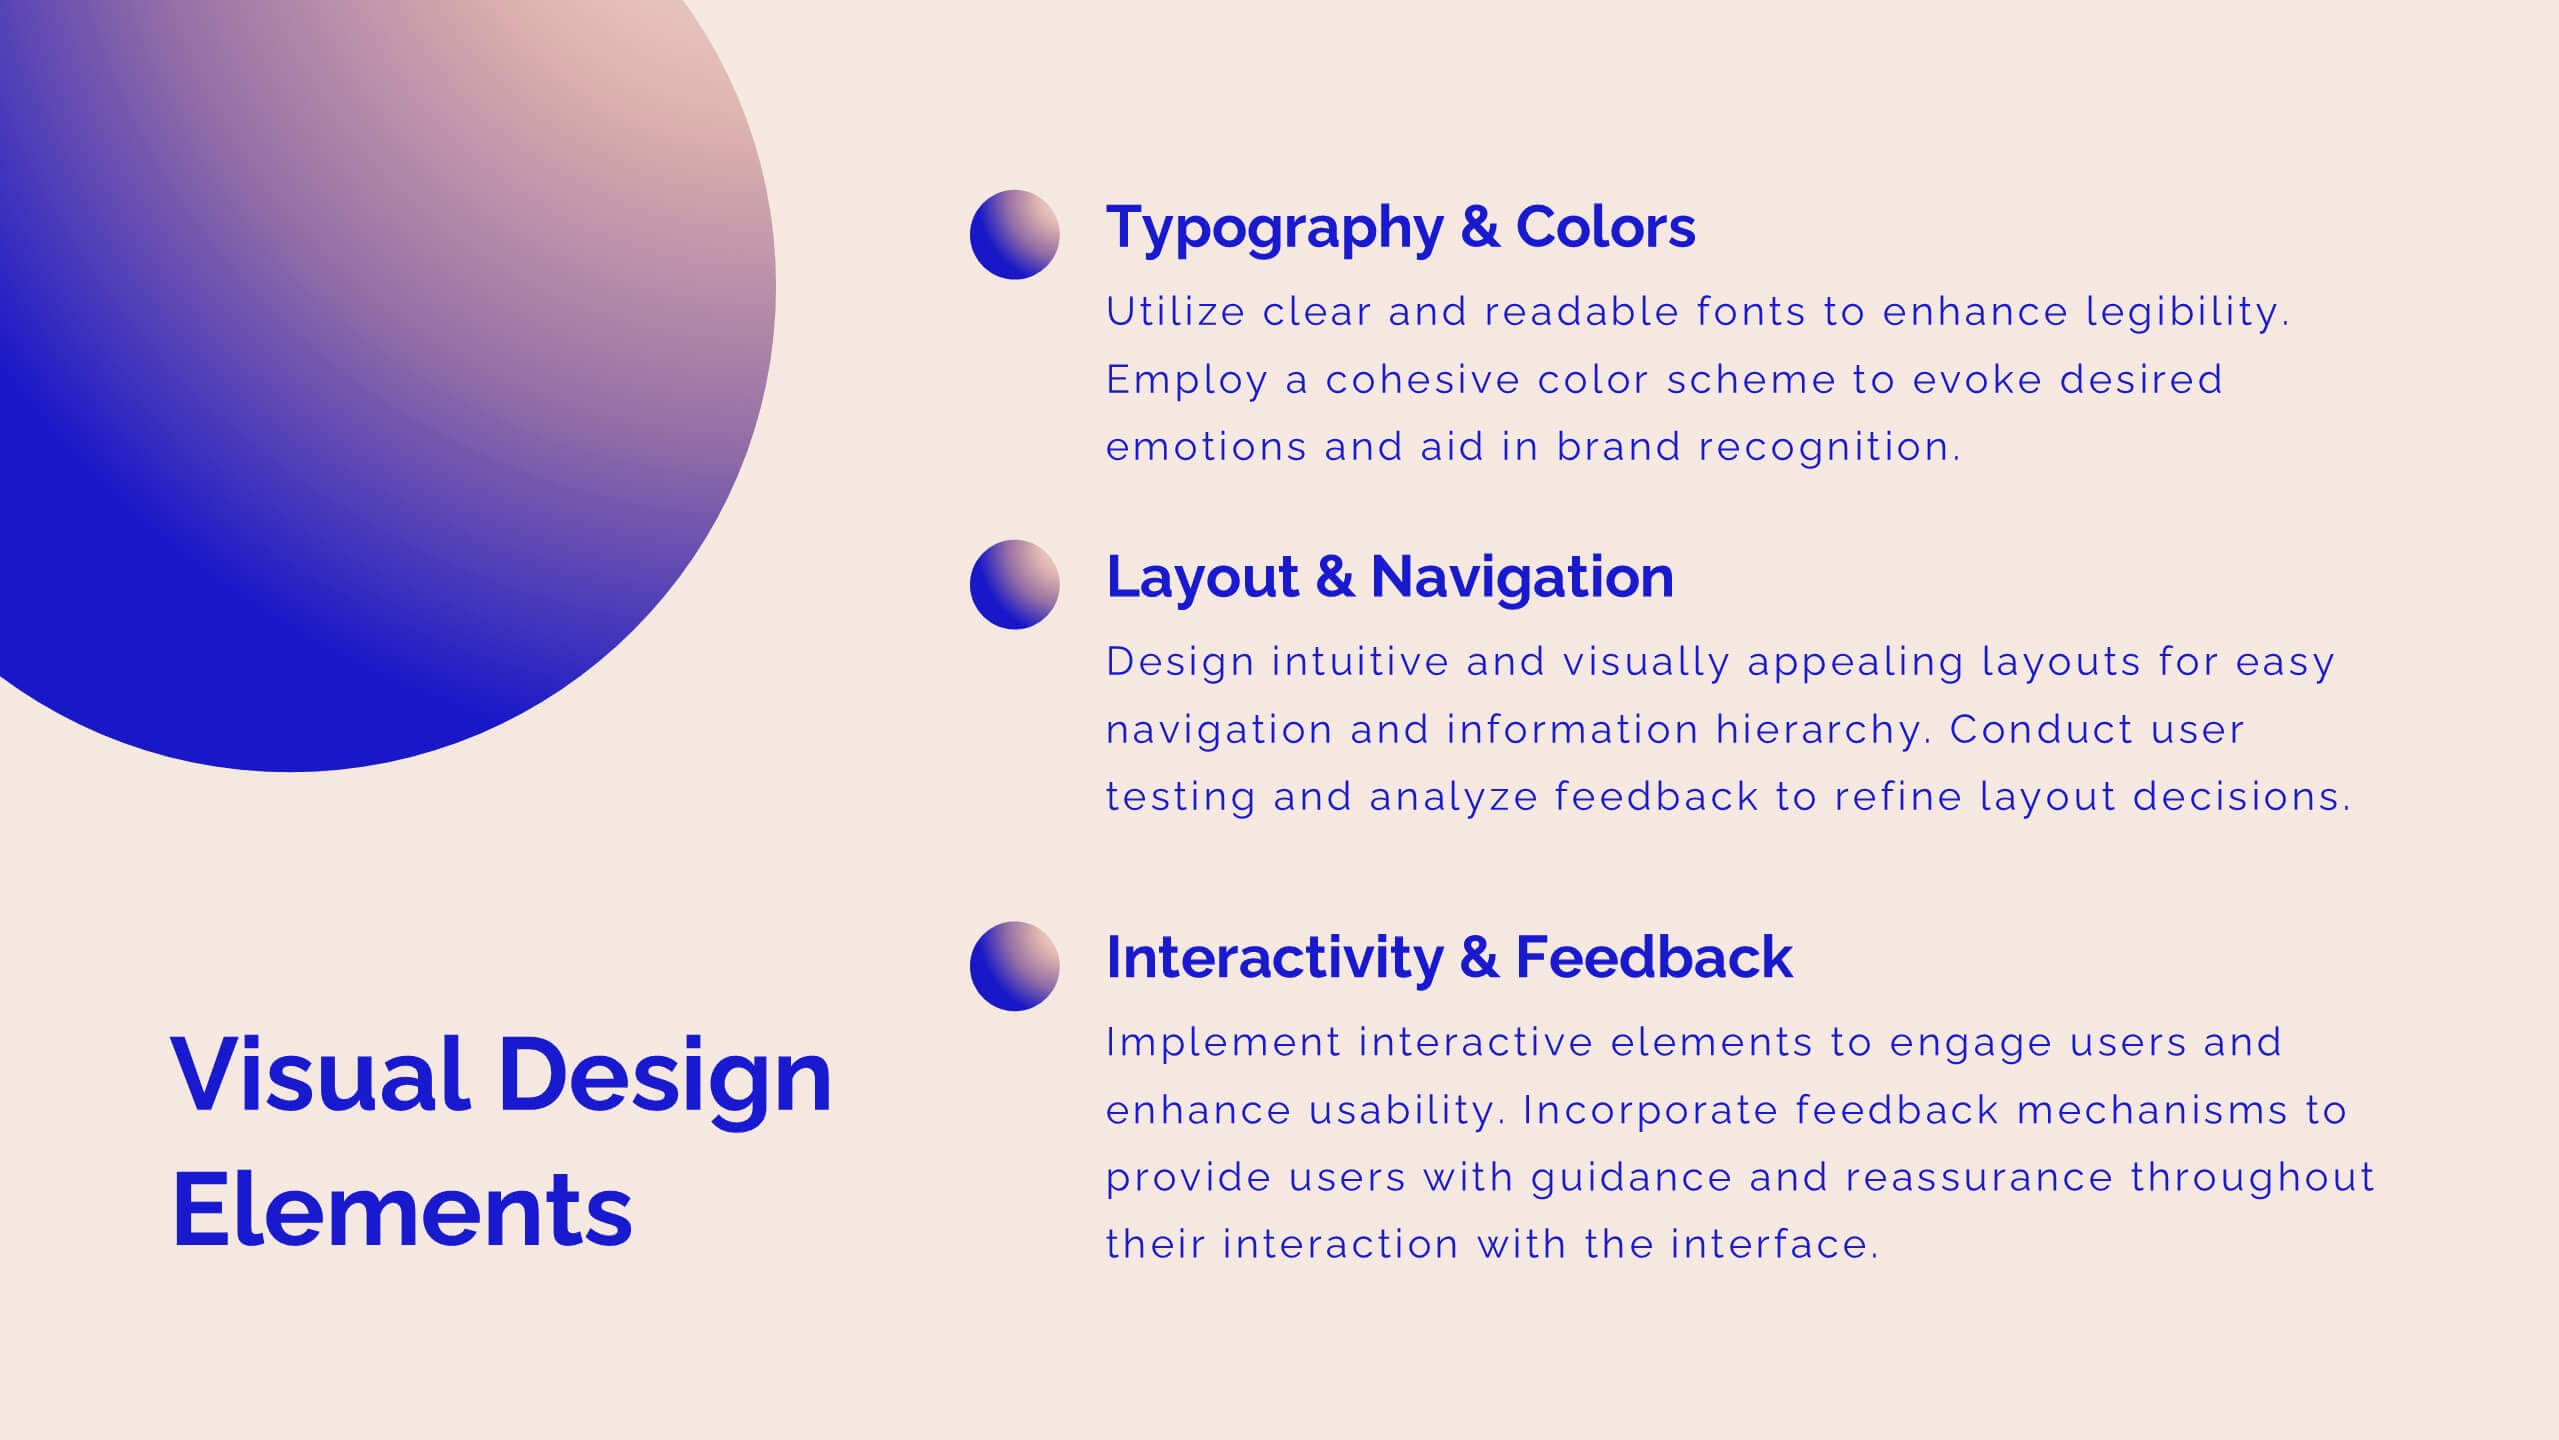
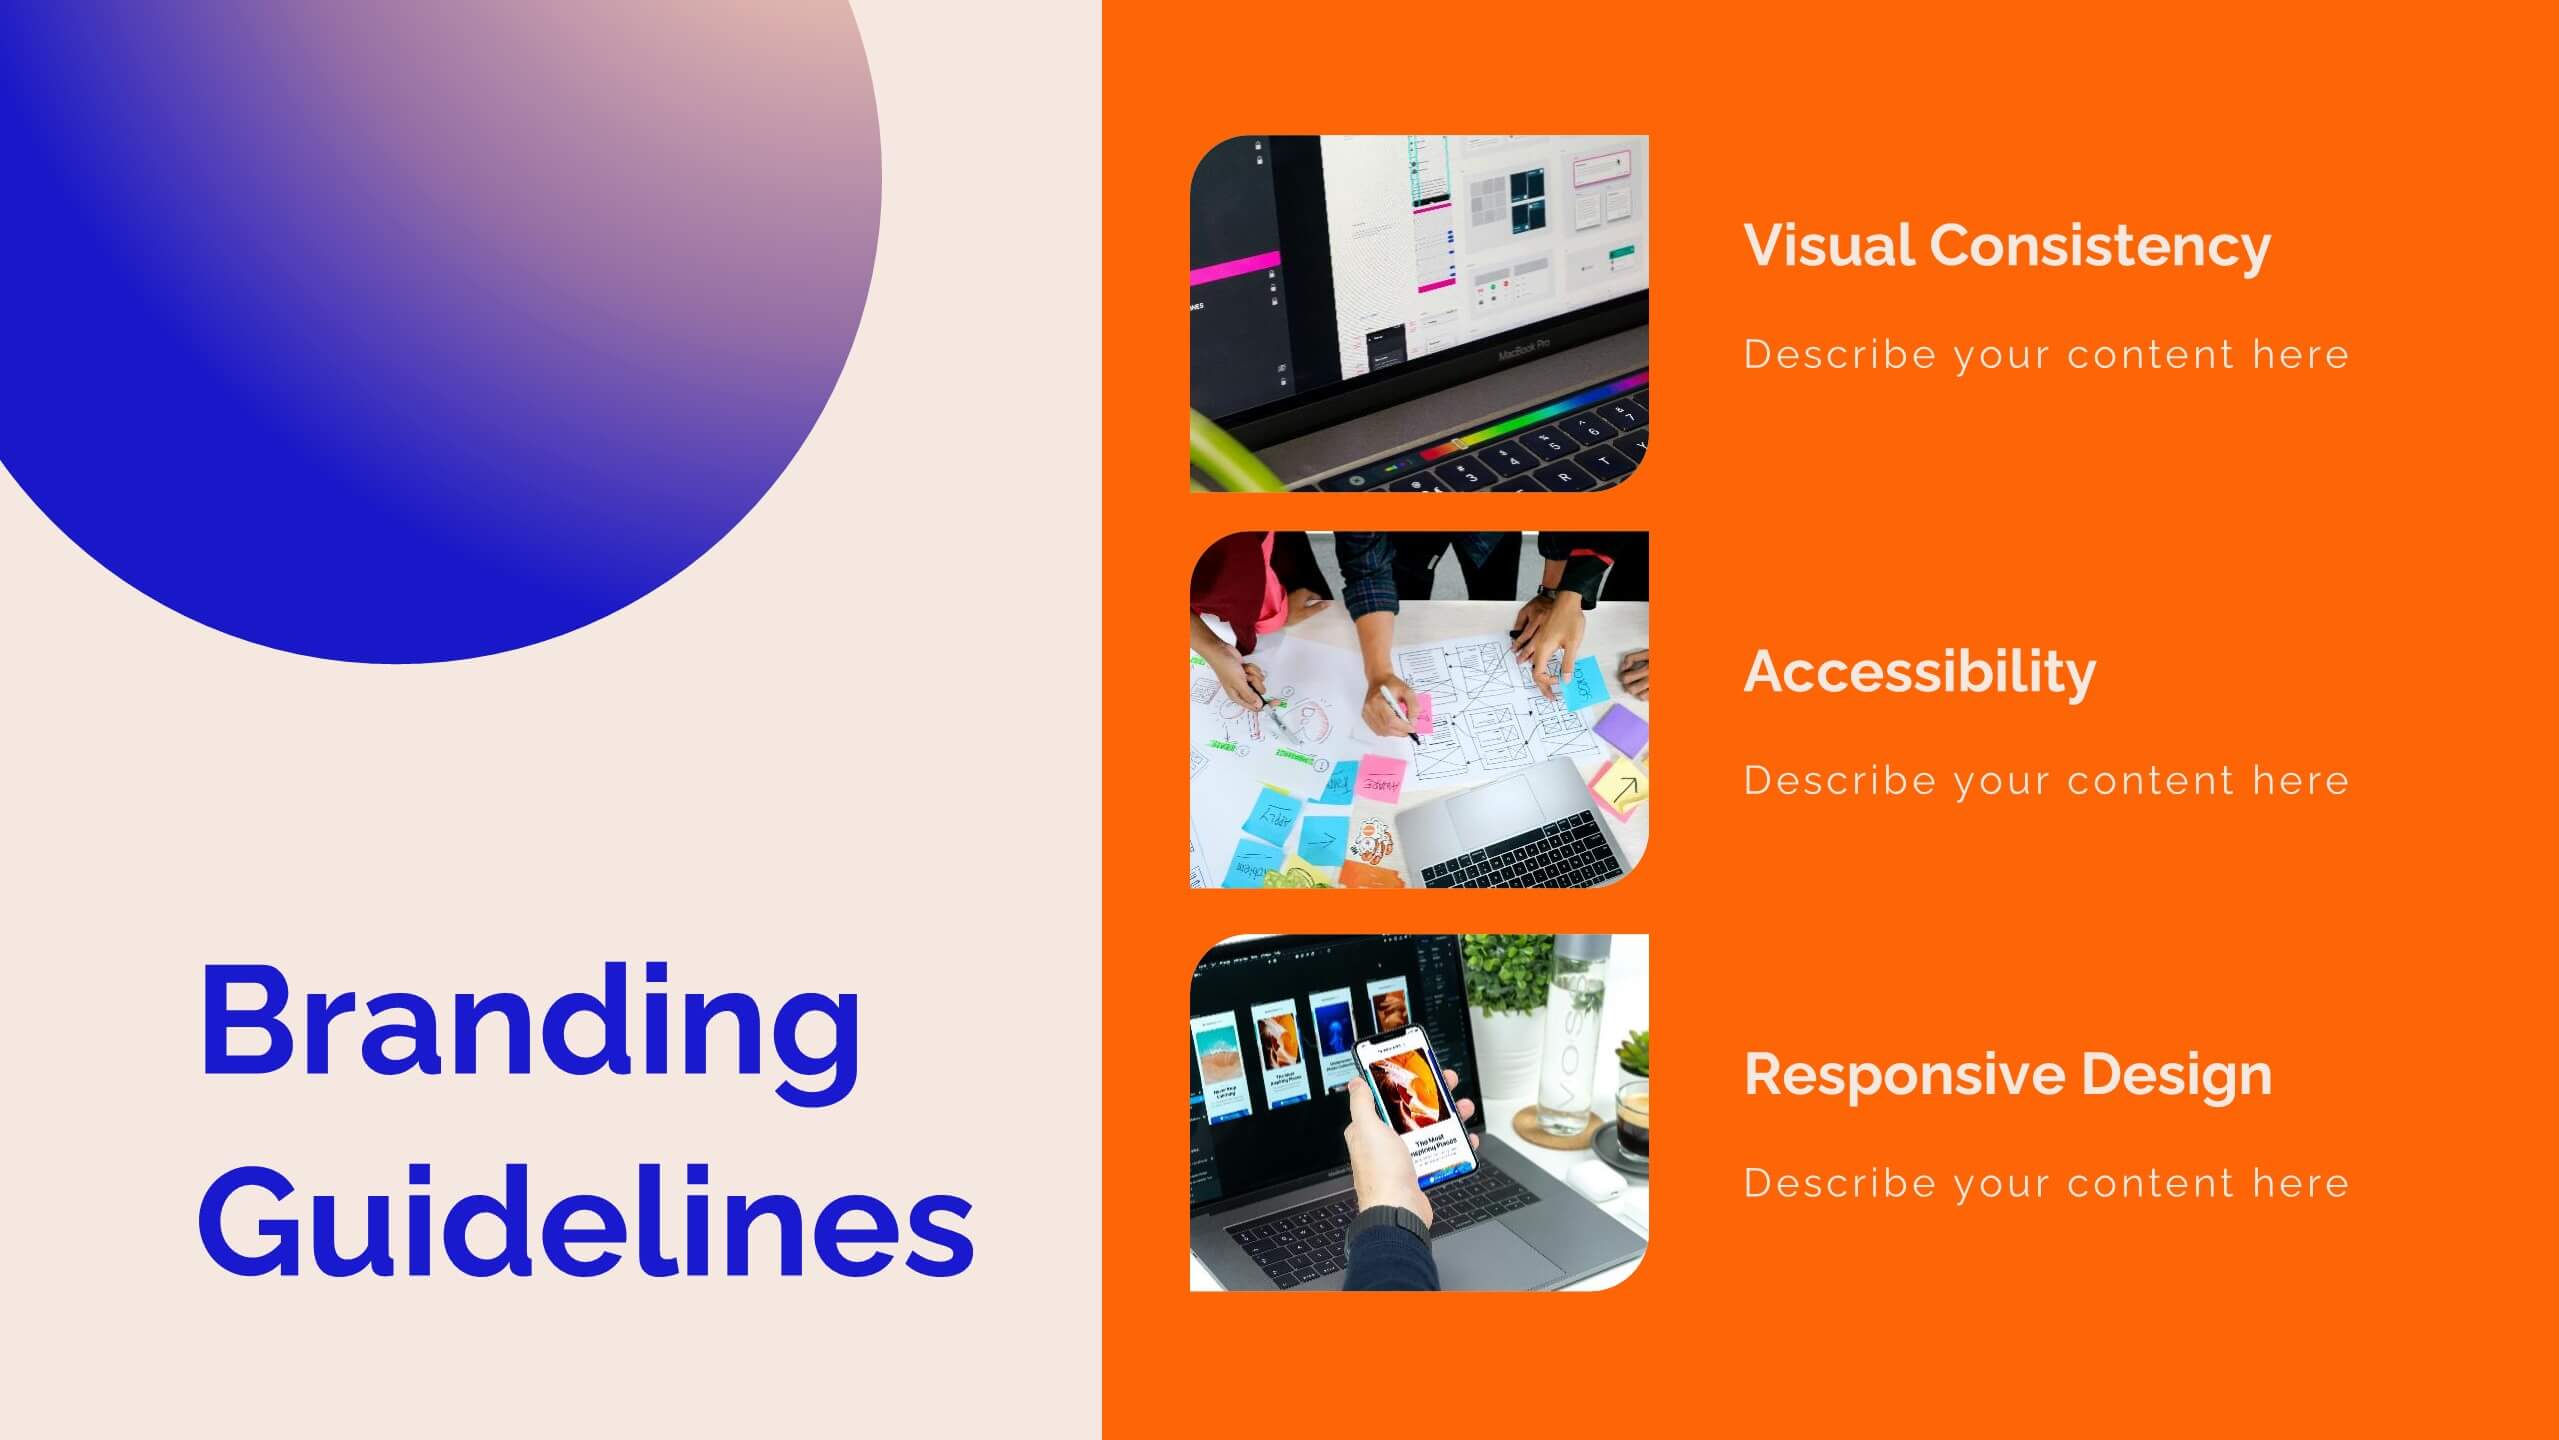
Niobium UX Research Report Presentation
Present your UX research findings with clarity and style using this vibrant UX research report template! It includes sections for user personas, wireframes, user testing, and design principles, making it ideal for sharing research insights. Fully customizable and compatible with PowerPoint, Keynote, and Google Slides, it's perfect for UX professionals and design teams.


6 diapositivas
3D Infographic Design
Visualize data like never before with this bold 3D block diagram layout. Designed to break down complex figures into three key segments, it’s perfect for presenting percentages, growth areas, or metric comparisons. Easily editable in PowerPoint, Keynote, and Google Slides.


6 diapositivas
STEM Education and Discovery Presentation
Showcase your STEM insights with this vibrant puzzle-piece infographic. Each piece highlights a key point in science, technology, engineering, or math—perfect for lesson plans, research summaries, or discovery processes. Fully customizable in PowerPoint, Keynote, and Google Slides, making it ideal for educators, researchers, or curriculum developers.


21 diapositivas
Drowsira Marketing Research Report Presentation
Present your market insights effectively with this professional and modern template. Covering key sections such as market presence, target audience, competitive landscape, and financial highlights, it offers a structured layout for impactful storytelling. Fully customizable and available for PowerPoint, Keynote, and Google Slides.


8 diapositivas
Green Business Sustainability Strategy Presentation
Promote eco-friendly business strategies with the Green Business Sustainability Strategy infographic. Featuring a circular flow diagram, this template highlights key sustainable initiatives, resource management, and environmental impact strategies. Fully editable and compatible with PowerPoint, Keynote, and Google Slides.


6 diapositivas
Governance Structure Overview Presentation
A clear, polished flow of ideas makes this slide instantly engaging, guiding viewers through each essential component with ease. This presentation explains how an organization structures oversight, responsibilities, and decision-making to ensure accountability and performance. Clean icons and balanced spacing keep everything easy to follow. Fully compatible with PowerPoint, Keynote, and Google Slides.


6 diapositivas
Creative 3D Elements Slide
Add visual depth and structure to your ideas with this unique 3D cube environment. Ideal for breaking down five components or phases, this layout helps your content stand out while maintaining a professional, modern aesthetic. Compatible with PowerPoint, Keynote, and Google Slides.


6 diapositivas
Problem Analysis Infographic
These slides provide a structured and aesthetically pleasing approach for detailing problem analysis within a project or organizational context. Each slide incorporates various design elements that guide the viewer through the steps or layers of the problem, allowing for a comprehensive understanding and discussion. The use of soft color palettes and clear text placement ensures that the information is easily digestible. The diverse layouts cater to different aspects of problem analysis, from bullet points to diagrammatic representations, making these templates versatile for various presentation needs. These are ideal for presenting complex information in a straightforward manner to ensure clear communication of issues and strategies within team meetings or presentations to stakeholders. The flexibility of the design also allows for easy customization to suit specific project requirements or branding needs.


4 diapositivas
Soft Watercolor Background Slides Presentation
Add a soft, elegant touch to your presentation with this Soft Watercolor Background Slides Presentation. Designed with gentle gray brushstroke textures and clean, modern layout, it's perfect for conveying ideas clearly while maintaining visual appeal. Ideal for creative, wellness, or professional topics. Fully editable in PowerPoint, Google Slides, and Canva.


7 diapositivas
Big Data Analytic Infographics
Big Data are the large and complex data sets that are difficult to process and analyze using traditional data processing methods. This template will allow you to visualize key data points and insights in an appealing and easy to digest way. Your information is presented in a clear manner with a variety of graphs, to convey the fundamentals of big data analytics. Customize this infographic with your own data in the bullet points and graphics. Quickly edit text and colors for your next presentation. All the slide in this template are fully editable in Powerpoint, Keynote, and Google Slides.