Finance Infographic Presentation Template
PowerPoint Template and Google Slides Theme


Características
Etiquetas
- Eliminar de favoritos
Plantilla de PowerPoint
1 MB
Plantilla de Google Slides
Enlace externo
Plantilla de Keynote
2 MB
Recomendar
- Eliminar de favoritos
Plantilla de PowerPoint
1 MB
Plantilla de Google Slides
Enlace externo
Plantilla de Keynote
1 MB
7 diapositivas
Data Analysis Tools Infographic
The Data Analysis Tools Infographic provides a dynamic and intuitive way to represent data analytics and performance metrics visually. This template offers various graph styles, such as bar graphs, line charts, and human figures, to illustrate statistical data effectively. Whether it's market research, financial analysis, website analytics, or any other form of quantitative data, this infographic is designed to make data easily understandable at a glance. Compatible with popular presentation software like PowerPoint, Google Slides, and Keynote, it's an excellent tool for professionals who aim to communicate complex data in a simplified, engaging manner.
- Eliminar de favoritos
Plantilla de PowerPoint
1 MB
Plantilla de Google Slides
Enlace externo
Plantilla de Keynote
2 MB
5 diapositivas
African Continent Map Slide Presentation
Visualize your data across Africa with a modern, easy-to-read map design that highlights regional trends and insights. Perfect for showcasing demographics, market distribution, or project reach, this template combines clarity and impact. Fully compatible with PowerPoint, Keynote, and Google Slides for smooth customization and presentation flexibility.
- Eliminar de favoritos
Plantilla de PowerPoint
1 MB
Plantilla de Google Slides
Enlace externo
Plantilla de Keynote
2 MB
6 diapositivas
Bubble Diagram for Idea Development
Streamline your brainstorming sessions and visualize concept progression with this Bubble Diagram for Idea Development presentation. Featuring a circular, color-coded layout from A to F, it’s ideal for mapping interconnected ideas, workflows, or innovation cycles. Easily editable in PowerPoint, Keynote, and Google Slides.
- Eliminar de favoritos
Plantilla de PowerPoint
1 MB
Plantilla de Google Slides
Enlace externo
Plantilla de Keynote
1 MB
5 diapositivas
RACI Responsibility Assignment Matrix Presentation
Streamline project management with our RACI Responsibility Assignment Matrix presentation template. This tool is designed to clarify team roles and responsibilities, ensuring everyone knows their tasks and duties. The template uses a color-coded system for quick reference, perfect for project managers and team leads. It's compatible with PowerPoint, Keynote, and Google Slides, making it a versatile choice for any professional setting.
- Eliminar de favoritos
Plantilla de PowerPoint
1 MB
Plantilla de Google Slides
Enlace externo
Plantilla de Keynote
1 MB
5 diapositivas
Marketing Funnel AIDA Breakdown
Visually map out your marketing strategy with the Marketing Funnel AIDA Breakdown Presentation. This template clearly illustrates the four essential stages—Attention, Interest, Desire, and Action—using a clean funnel design for easy audience understanding. Ideal for sales pitches, marketing plans, and campaign reports. Fully editable in PowerPoint, Keynote, and Google Slides.
- Eliminar de favoritos
Plantilla de PowerPoint
1 MB
Plantilla de Google Slides
Enlace externo
Plantilla de Keynote
2 MB
6 diapositivas
PESTEL Framework Business
Simplify your strategic analysis with this clean and colorful PESTEL presentation. Perfect for breaking down Political, Economic, Sociocultural, Technological, Environmental, and Legal factors. Each segment uses bold icons and color coding to guide your audience through external influences. Easily customizable in PowerPoint, Keynote, and Google Slides.
- Eliminar de favoritos
Plantilla de PowerPoint
1 MB
Plantilla de Google Slides
Enlace externo
Plantilla de Keynote
2 MB
5 diapositivas
Comparative Assessment Using Harvey Ball Chart
Showcase multiple data points with clarity using this Comparative Assessment Using Harvey Ball Chart presentation template. Designed for visualizing progress, performance, or preference across 5 categories, each slide features Harvey Balls with percentage indicators, icons, and explanatory text sections. Ideal for business reviews, audits, or strategy discussions, this template helps communicate variances in an intuitive, side-by-side format. Fully editable in PowerPoint, Google Slides, and Keynote.
- Eliminar de favoritos
Plantilla de PowerPoint
1 MB
Plantilla de Google Slides
Enlace externo
Plantilla de Keynote
1 MB
5 diapositivas
Corporate Annual Report Insights Presentation
Showcase Your Corporate Success! The Corporate Annual Report Insights Presentation delivers financial highlights, key performance indicators, and strategic insights in a structured, visually appealing format. Ideal for executives and stakeholders, this template ensures clarity and professionalism. Fully customizable and compatible with PowerPoint, Keynote, and Google Slides, it enhances impactful business storytelling.
- Eliminar de favoritos
Plantilla de PowerPoint
4 MB
Plantilla de Google Slides
Enlace externo
Plantilla de Keynote
5 MB
4 diapositivas
Corporate Portfolio of Achievements Presentation
Present your professional milestones with this sleek, image-focused layout. Featuring a large photo placeholder and three clearly defined highlights, this slide is ideal for showcasing company achievements or project phases. Fully editable in PowerPoint, Keynote, and Google Slides—perfect for client updates, internal reviews, or corporate storytelling.
- Eliminar de favoritos
Plantilla de PowerPoint
1 MB
Plantilla de Google Slides
Enlace externo
Plantilla de Keynote
1 MB
6 diapositivas
Demographic Trends and Audience Breakdown Presentation
Visualize key audience segments and population trends with this modern demographic breakdown slide. Featuring a clean circular chart layout, it's perfect for showcasing age, gender, location, or behavioral data. Ideal for marketing, branding, or user research reports, it turns complex demographics into clear, impactful insights for strategic planning and targeting.
- Eliminar de favoritos
Plantilla de PowerPoint
1 MB
Plantilla de Google Slides
Enlace externo
Plantilla de Keynote
2 MB
6 diapositivas
Company Profile Insights Infographic
This set of templates is designed to convey critical company insights through a visually engaging presentation, ideal for showcasing a company’s core strengths and operational highlights. Each layout provides a structured approach to display key data points and insights that are vital to understanding the company's market position and strategic direction. The templates feature a variety of elements, such as statistical displays, financial summaries, and operational benchmarks, that provide a comprehensive snapshot of company performance. By integrating graphical representations like bar charts, pie charts, and progress indicators, these templates make complex data accessible and easily understandable. The color schemes and design elements can be customized to align with company branding, ensuring a cohesive look throughout the presentation. These are excellent tools for annual meetings, investor briefings, or internal reviews, enabling businesses to effectively communicate their achievements, identify trends in their operations, and guide strategic planning discussions. By utilizing these templates, companies can highlight their successes, areas for improvement, and future outlook in a clear and professional manner, fostering transparency and confidence among stakeholders.
- Eliminar de favoritos
Plantilla de PowerPoint
1 MB
Plantilla de Google Slides
Enlace externo
Plantilla de Keynote
2 MB
8 diapositivas
Customer Targeting and Persona Creation Presentation
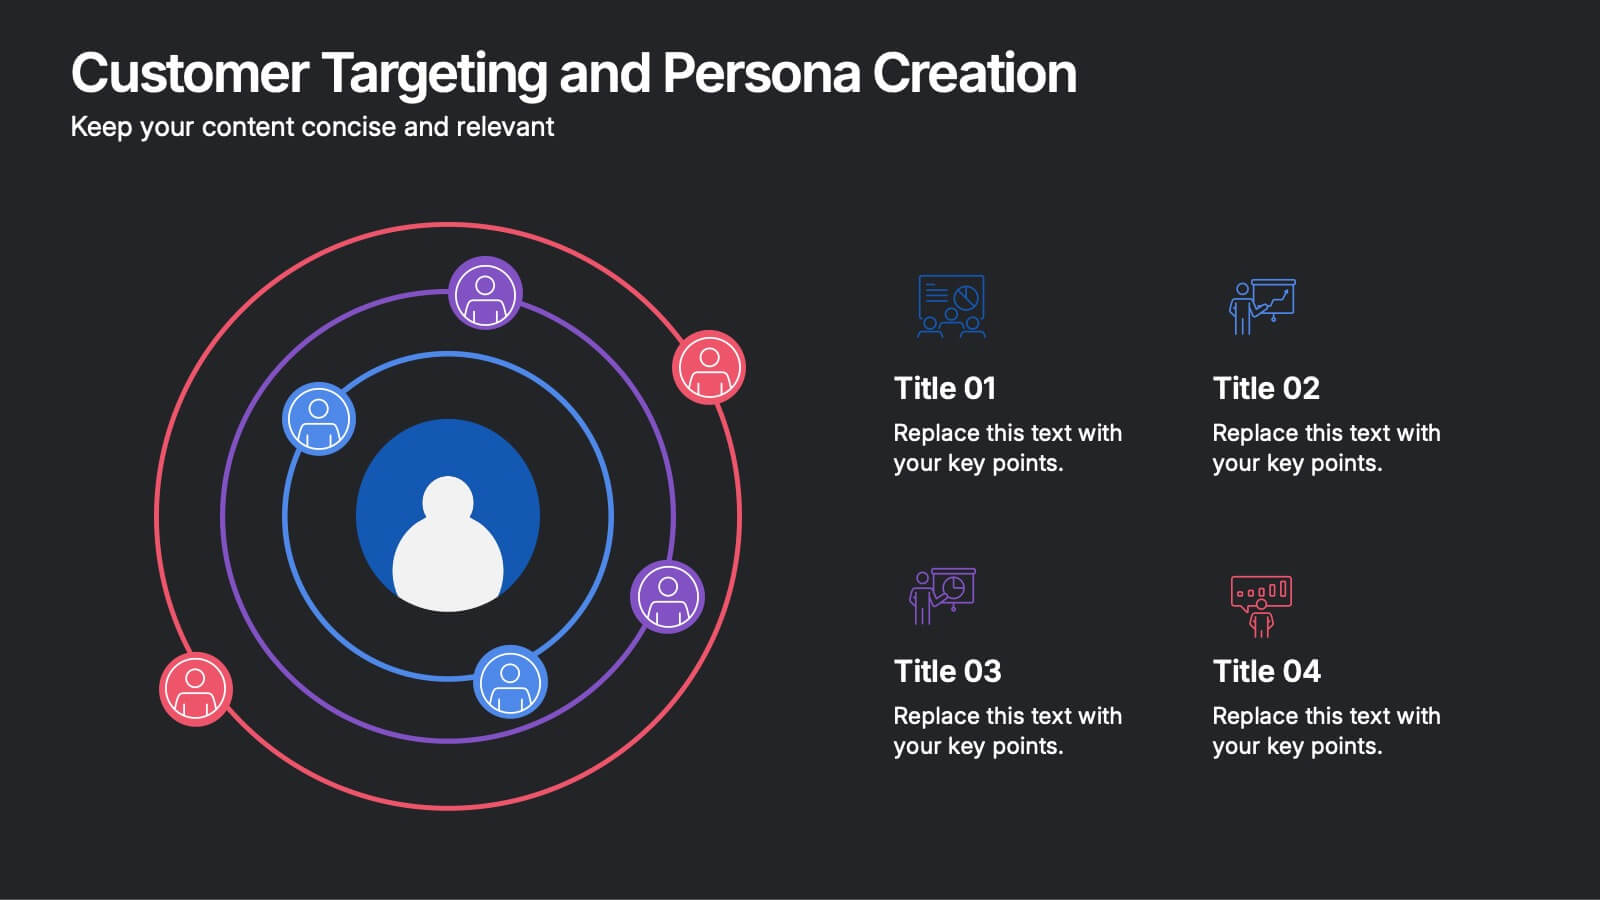
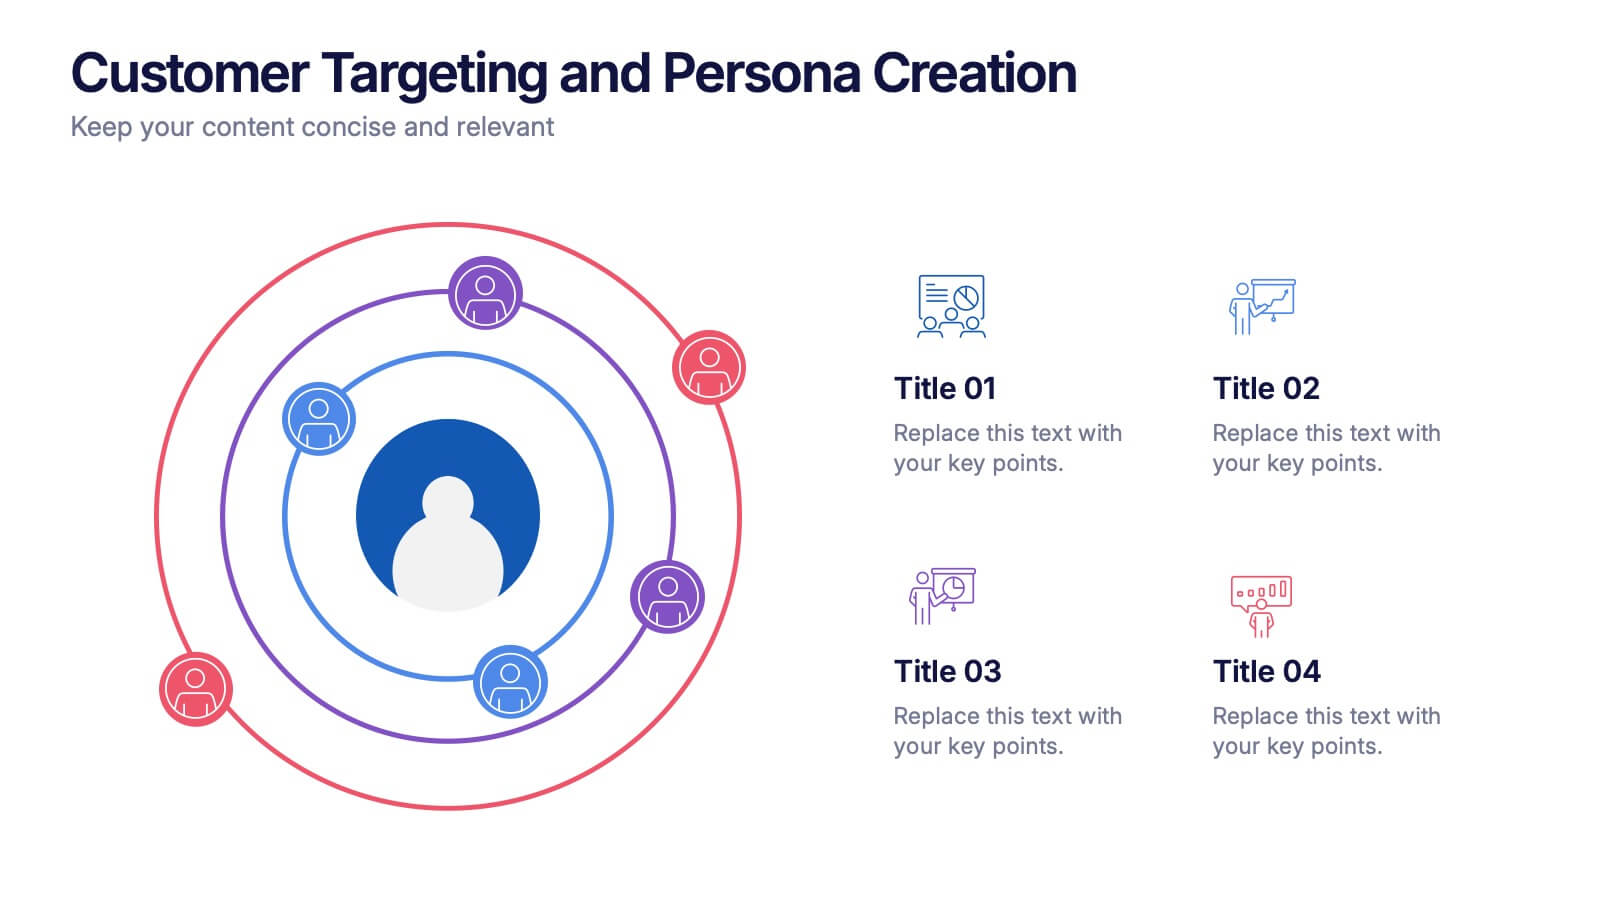
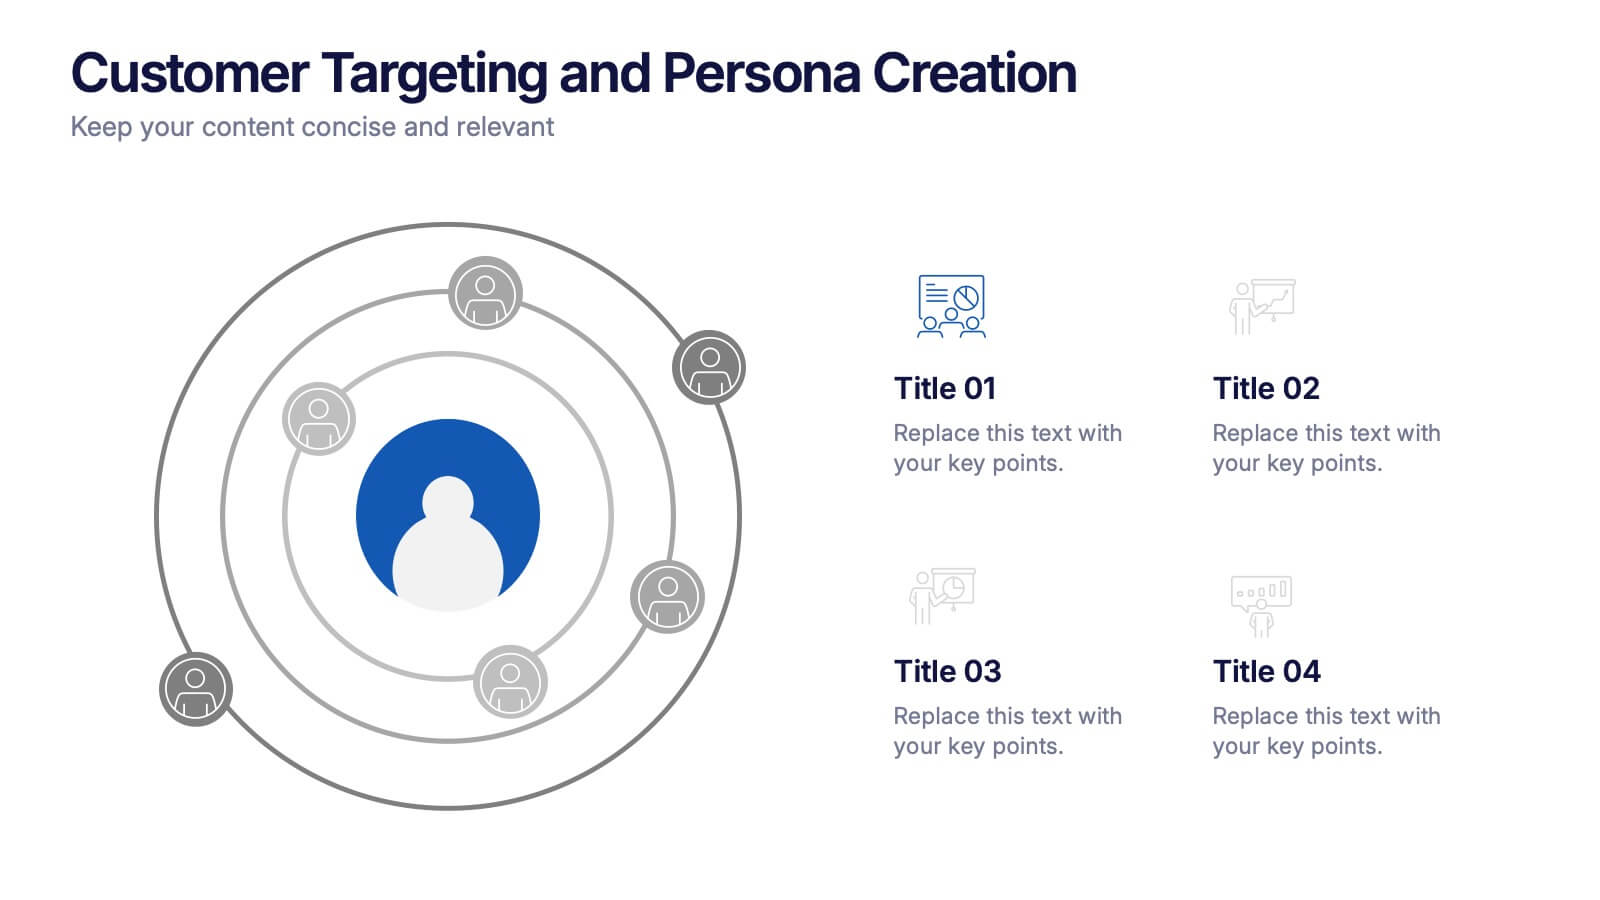
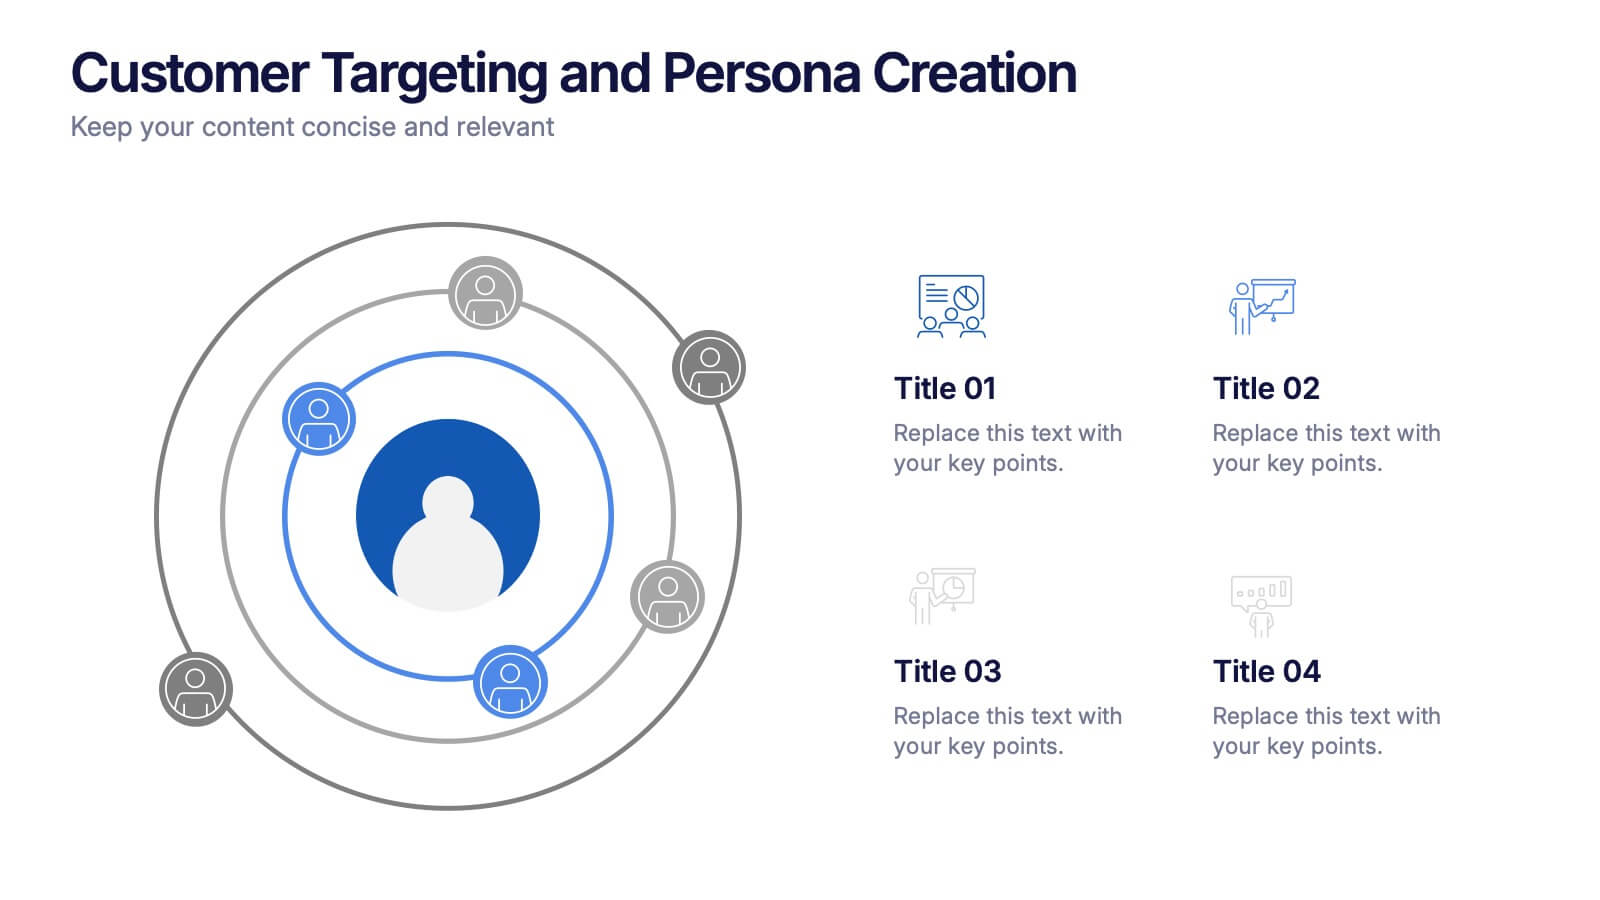
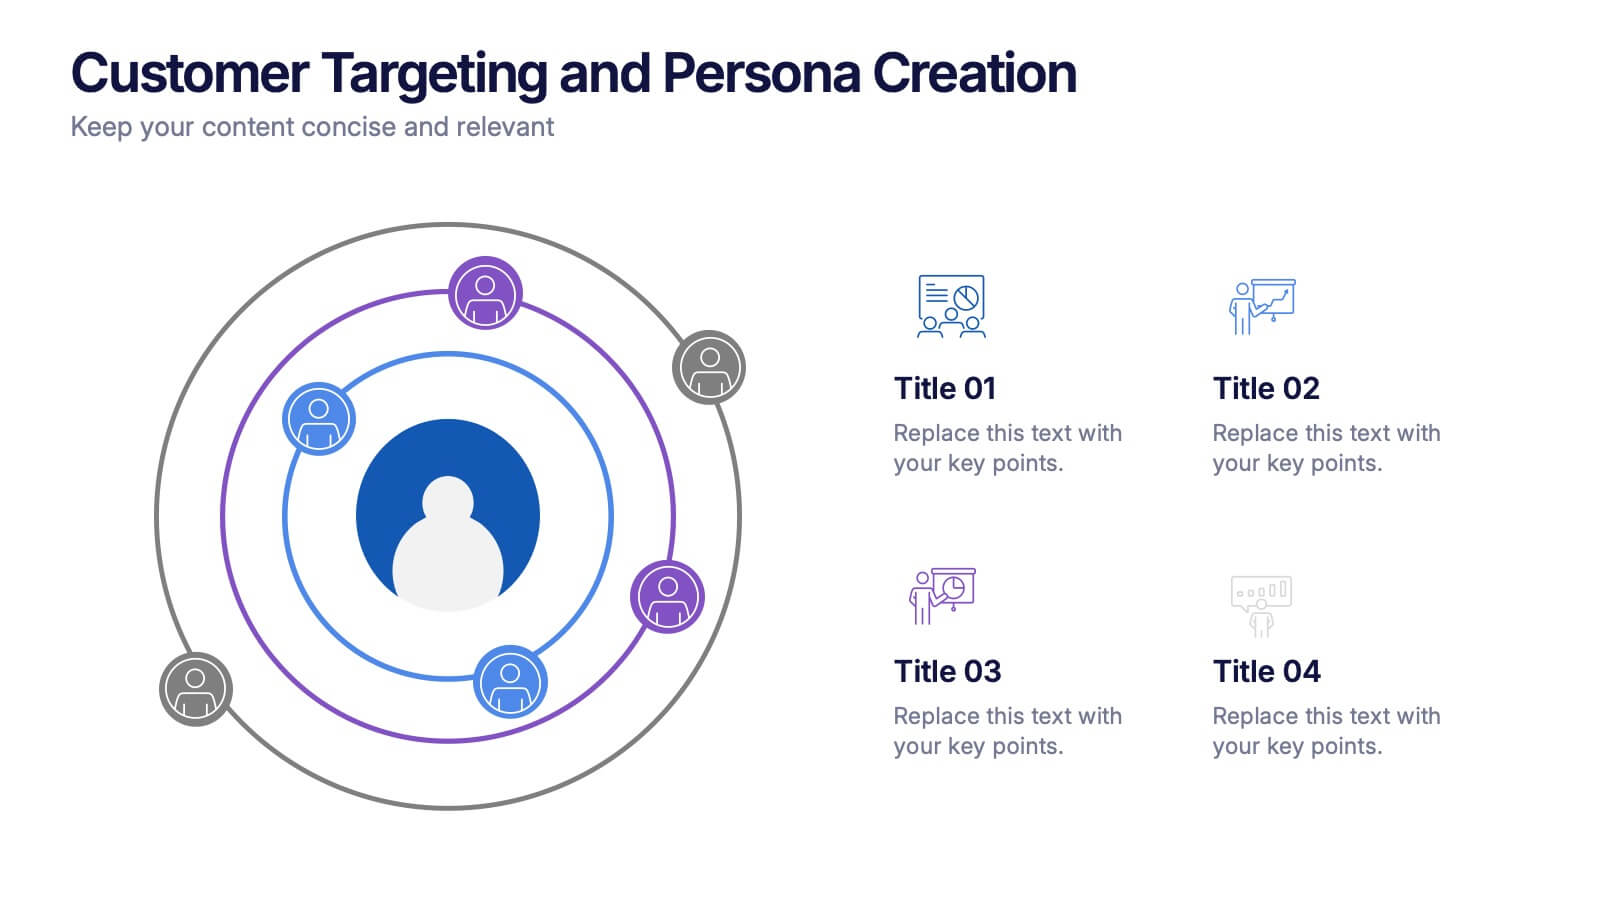
Hook your audience with a clean, modern layout that zooms in on what really matters—your ideal customer. This customer persona template helps visualize traits, behaviors, and key targets for effective marketing. Perfect for campaign planning, branding, or audience research. Fully compatible with PowerPoint, Keynote, and Google Slides.
- Eliminar de favoritos
Plantilla de PowerPoint
1 MB
Plantilla de Google Slides
Enlace externo
Plantilla de Keynote
2 MB
7 diapositivas
Cloud Services Infographic Presentation
A Cloud Infographic is a type of visual representation that uses graphic design elements and data to explain and illustrate the concept of cloud computing. This cloud infographic template uses diagrams, charts, and other graphical elements to showcase the benefits and features of cloud computing. This can be used for businesses, education, and individuals to understand and promote the concept of cloud computing. This Cloud template has been designed in a simple but effective style that allows you to focus on your content. This template is designed for powerpoint, keynote and google slides.
- Eliminar de favoritos
Plantilla de PowerPoint
1 MB
Plantilla de Google Slides
Enlace externo
Plantilla de Keynote
1 MB
4 diapositivas
Digital Marketing Strategy Presentation
Present your marketing insights with impact using this engaging digital marketing strategy slide. Featuring a modern bar chart with layered 3D blocks and icon-labeled highlights, this slide is perfect for showcasing strategy breakdowns, campaign priorities, or market performance data. Customize each section with concise titles and professional content. Ideal for marketers, agencies, and analysts. Fully editable in PowerPoint, Keynote, and Google Slides.
- Eliminar de favoritos
Plantilla de PowerPoint
1 MB
Plantilla de Google Slides
Enlace externo
Plantilla de Keynote
1 MB
8 diapositivas
Workflow Diagram Presentation
The "Workflow Diagram Infographic" template is designed to clearly illustrate the sequence of tasks or stages within a project or business process. Each segment of the circular design is allocated for a specific phase, equipped with a title and descriptive area, and supported by distinct icons for quick identification. This layout is ideal for delineating task dependencies and operational sequences, helping to simplify and communicate complex procedures. It's particularly useful for project managers, operational leads, and trainers in explaining workflows and processes efficiently. This infographic serves as an effective visual tool for presentations aimed at streamlining discussions around process improvements and team alignments.
- Eliminar de favoritos
Plantilla de PowerPoint
1 MB
Plantilla de Google Slides
Enlace externo
Plantilla de Keynote
1 MB
5 diapositivas
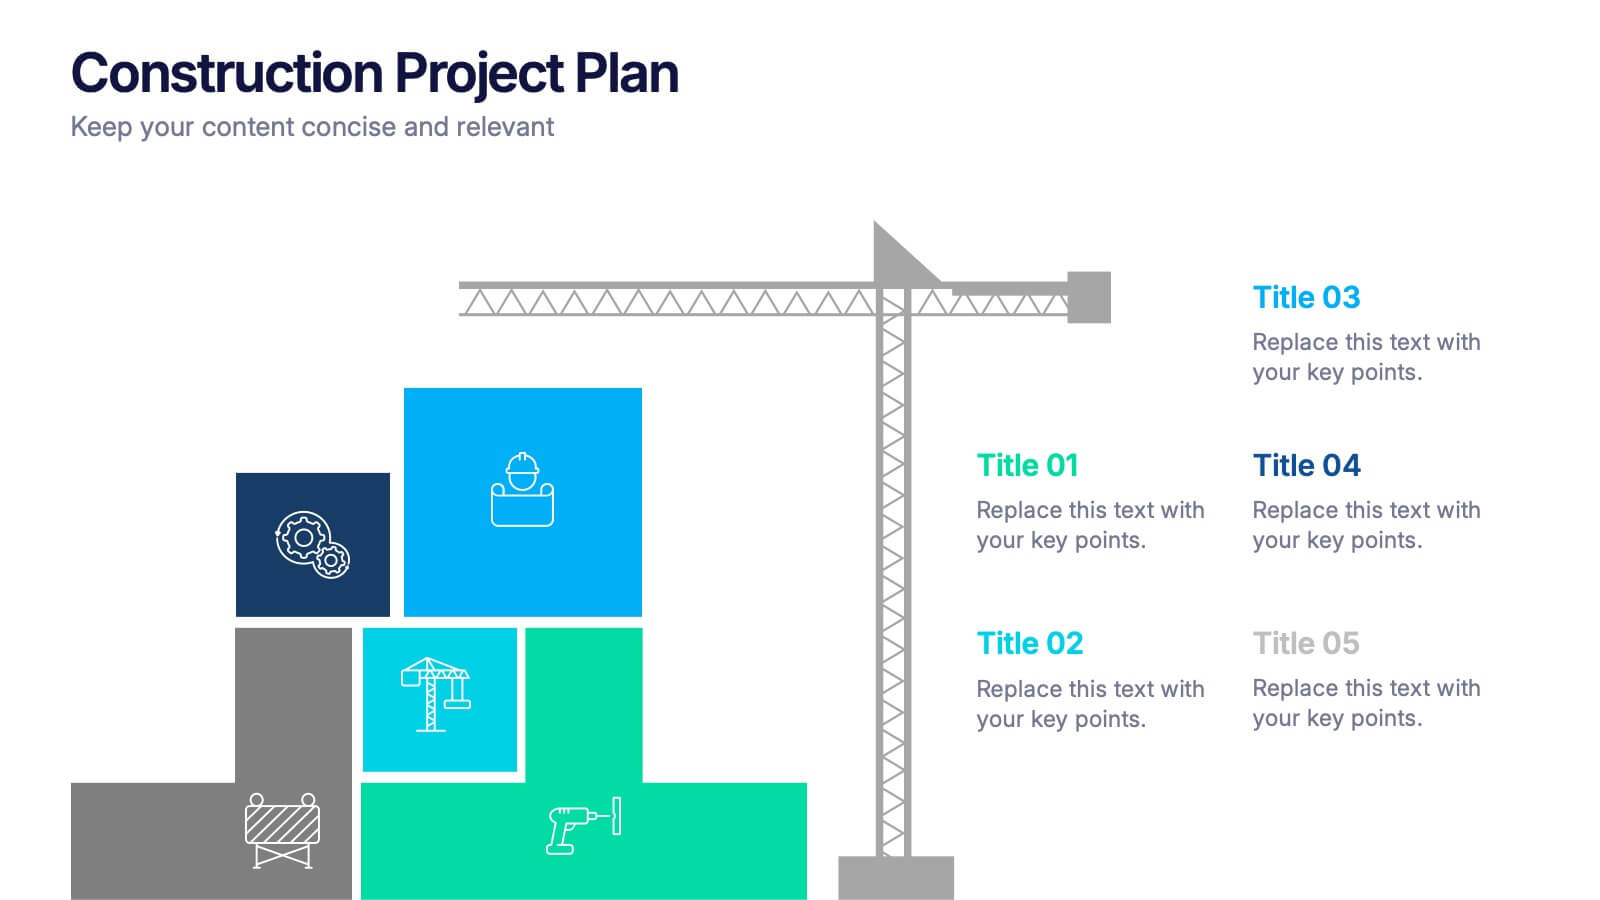
Construction Project Plan Presentation
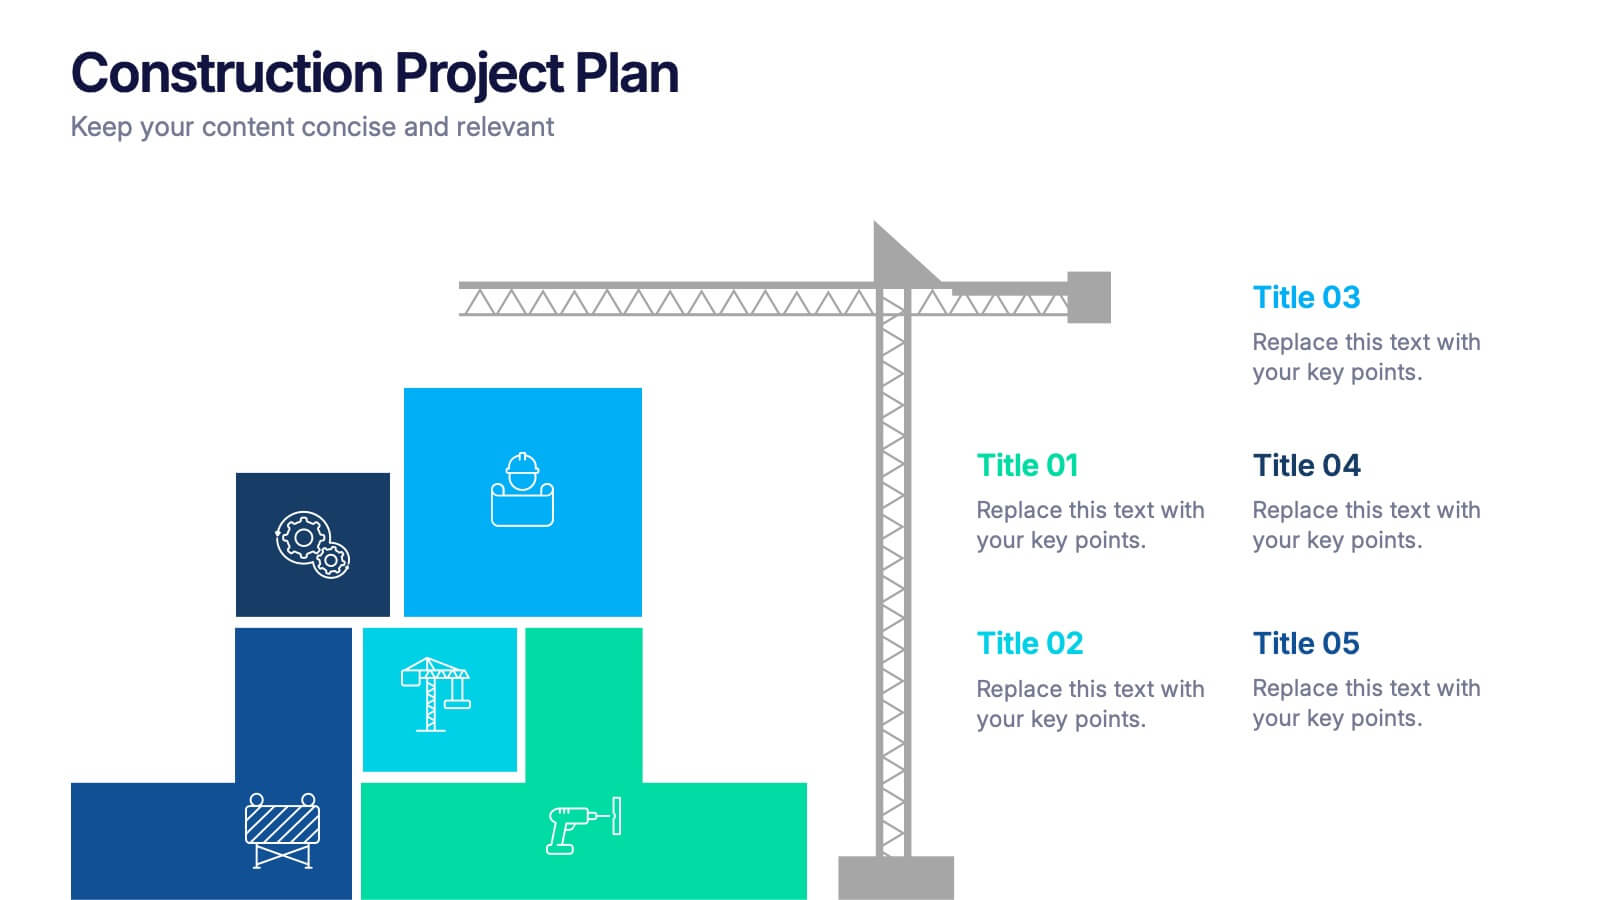
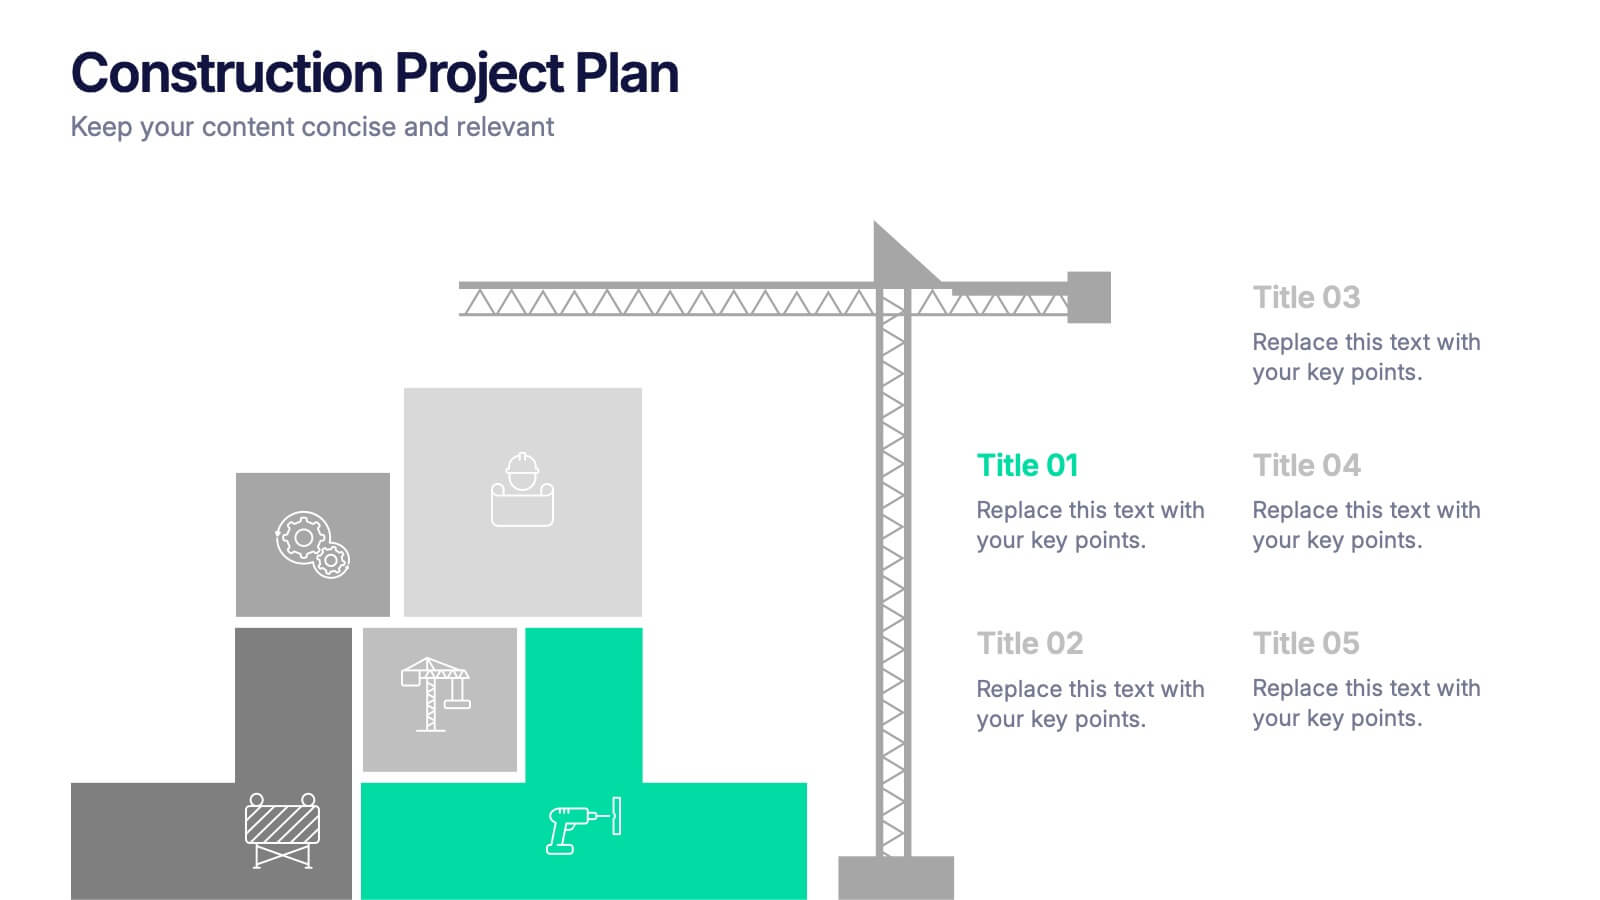
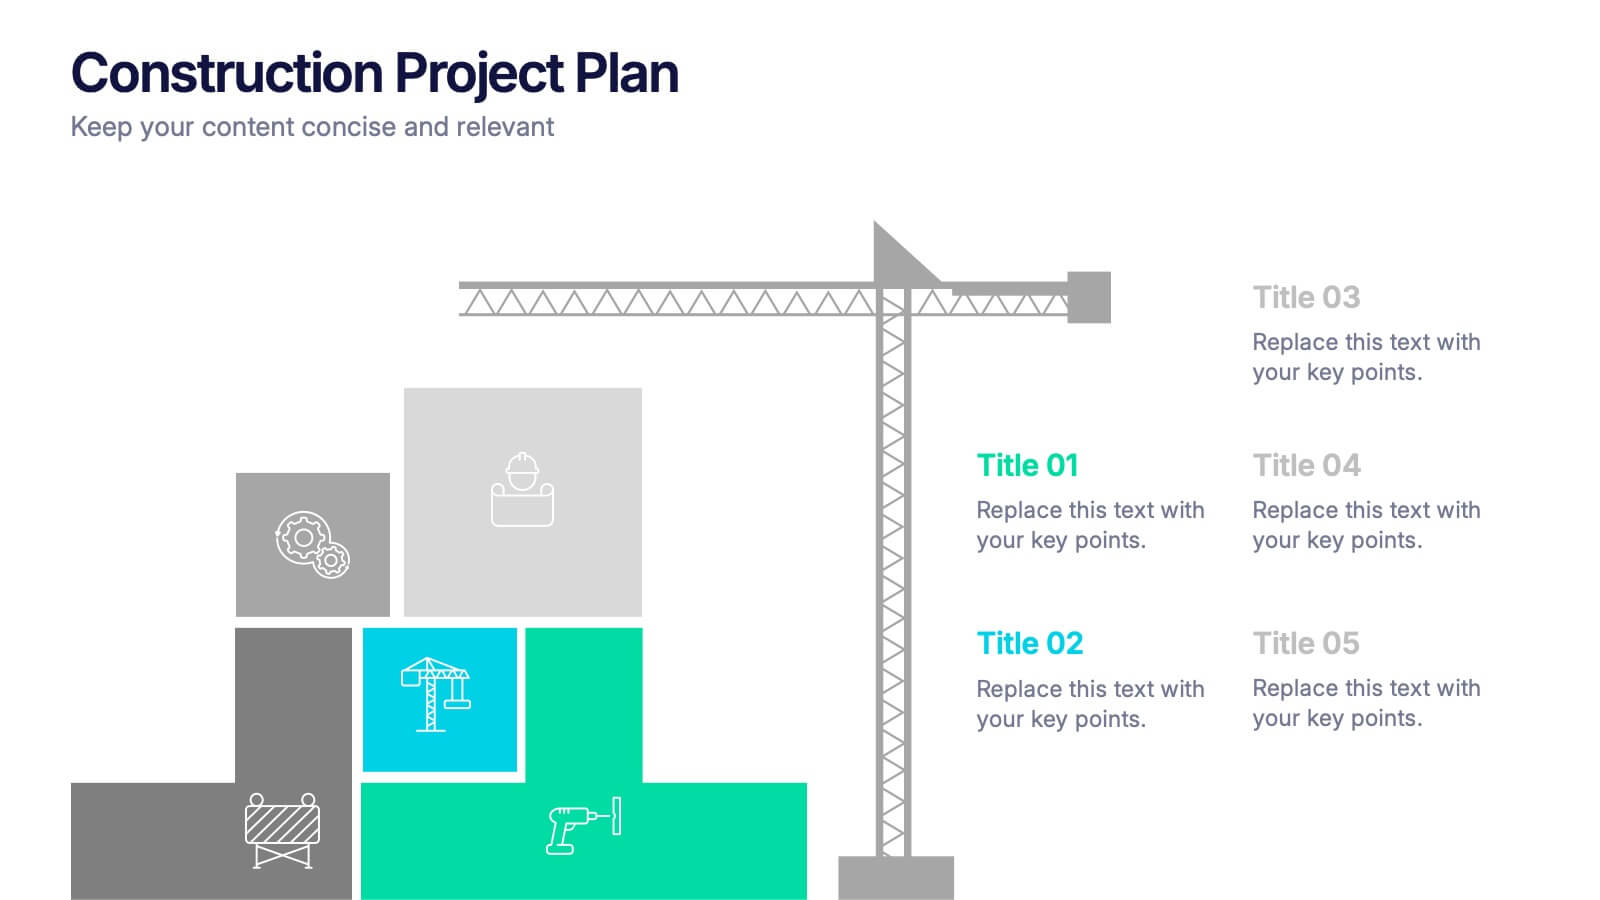
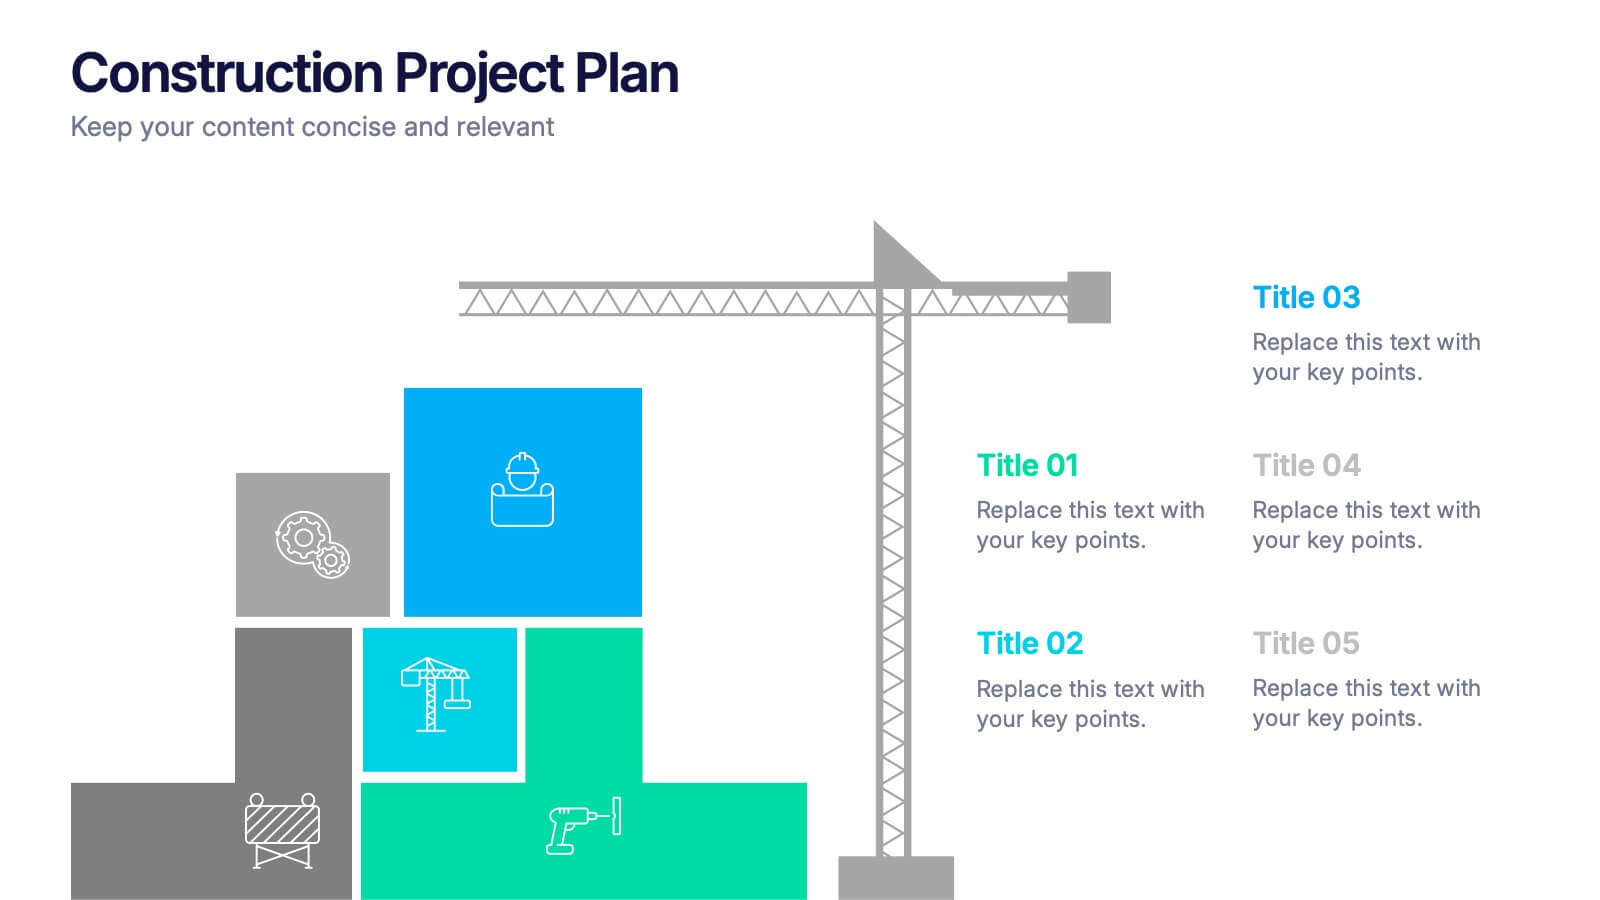
Build your next presentation with structure and impact using this modern and organized design. Perfect for outlining construction timelines, milestones, or project phases, it helps visualize every step from planning to completion. Fully editable and compatible with PowerPoint, Keynote, and Google Slides for effortless customization and professional results.
- Eliminar de favoritos
Plantilla de PowerPoint
1 MB
Plantilla de Google Slides
Enlace externo
Plantilla de Keynote
1 MB
5 diapositivas
Product Roadmap Presentation
The "Product Roadmap Infographic" template is ideal for presenting the strategic vision and progressive steps for product development. This template outlines the roadmap through a creative and visually engaging route-style layout, designed to highlight key milestones and stages in the product lifecycle, from conception to launch. Each point on the roadmap is clearly marked for specific goals or achievements, encouraging clarity and understanding among stakeholders about the direction and progress of the product. This layout is perfect for product managers and teams to communicate timelines, prioritize tasks, and align goals during presentations in corporate settings.


