


Características


¿Tienes alguna pregunta?
Recomendar


7 diapositivas
South America Population Infographic Presentation
A South America map infographic is a visual representation of the continent of South America, highlighting its geography, population, culture, history, and other relevant information. Use this template as a graphic representation of South America that combines text, data, and images in an informative way. This infographic can be designed in different styles and formats, including political maps, physical maps, topographic maps, population density maps, and climate maps. You can also include information about major cities, landmarks, natural resources, and cultural traditions.


21 diapositivas
Chrysolis Small Business Pitch Deck Presentation
Make your business stand out with a pitch deck that tells your story with clarity and confidence. Covering key elements like company policies, performance metrics, collaboration opportunities, and future projects, this presentation helps you impress stakeholders. Fully customizable and compatible with PowerPoint, Keynote, and Google Slides for a seamless pitch experience.


7 diapositivas
Enterprise Governance Infographics
A Governance Infographic provides information about the principles and practices of governance, particularly in the context of organizations or institutions. This governance template can be used to cover a wide range of topics related to governance, including organizational structures, decision-making processes, risk management, compliance, and ethical standards. You can use this to include information on the roles and responsibilities of different stakeholders, such as board members, executives, and employees, as well as the policies and procedures that govern their interactions.


5 diapositivas
Market Economy Infographics
A market economy is an economic system where the production, distribution, and pricing of goods and services are determined by the interactions of individuals and businesses in the market. These vertical infographics are visually compelling design that explains the fundamental principles and characteristics of a market economy. This infographics is ideal for economists, business analysts, educators, and anyone looking to educate others about how market economies work and their impact on society. The infographics incorporate relevant statistics and data to support the information presented. Compatible with Powerpoint, Keynote, and Google Slides.


6 diapositivas
Tables of Content Analysis Infographic
Table of Contents analysis refers to the examination and evaluation of the structure and content of a document's table of contents. It is commonly used as a preliminary step to understand the flow of information within a longer document, such as a book, report, thesis, or research paper. This infographic template provides insights into the document's structure and can help readers determine whether the document is relevant to their needs. This infographic is designed to provide a quick overview of the topics covered in the document and their distribution, helping readers understand the organization of the content at a glance.


6 diapositivas
Organizational Change Management Presentation
Visualize transformation with clarity using this structured slide, perfect for outlining your change roadmap, initiatives, or strategic phases. The layout features six labeled steps with icons and editable text for seamless communication of your process—from awareness to adoption. Ideal for HR leaders, consultants, and operations managers. Fully editable in PowerPoint, Keynote, and Google Slides.


6 diapositivas
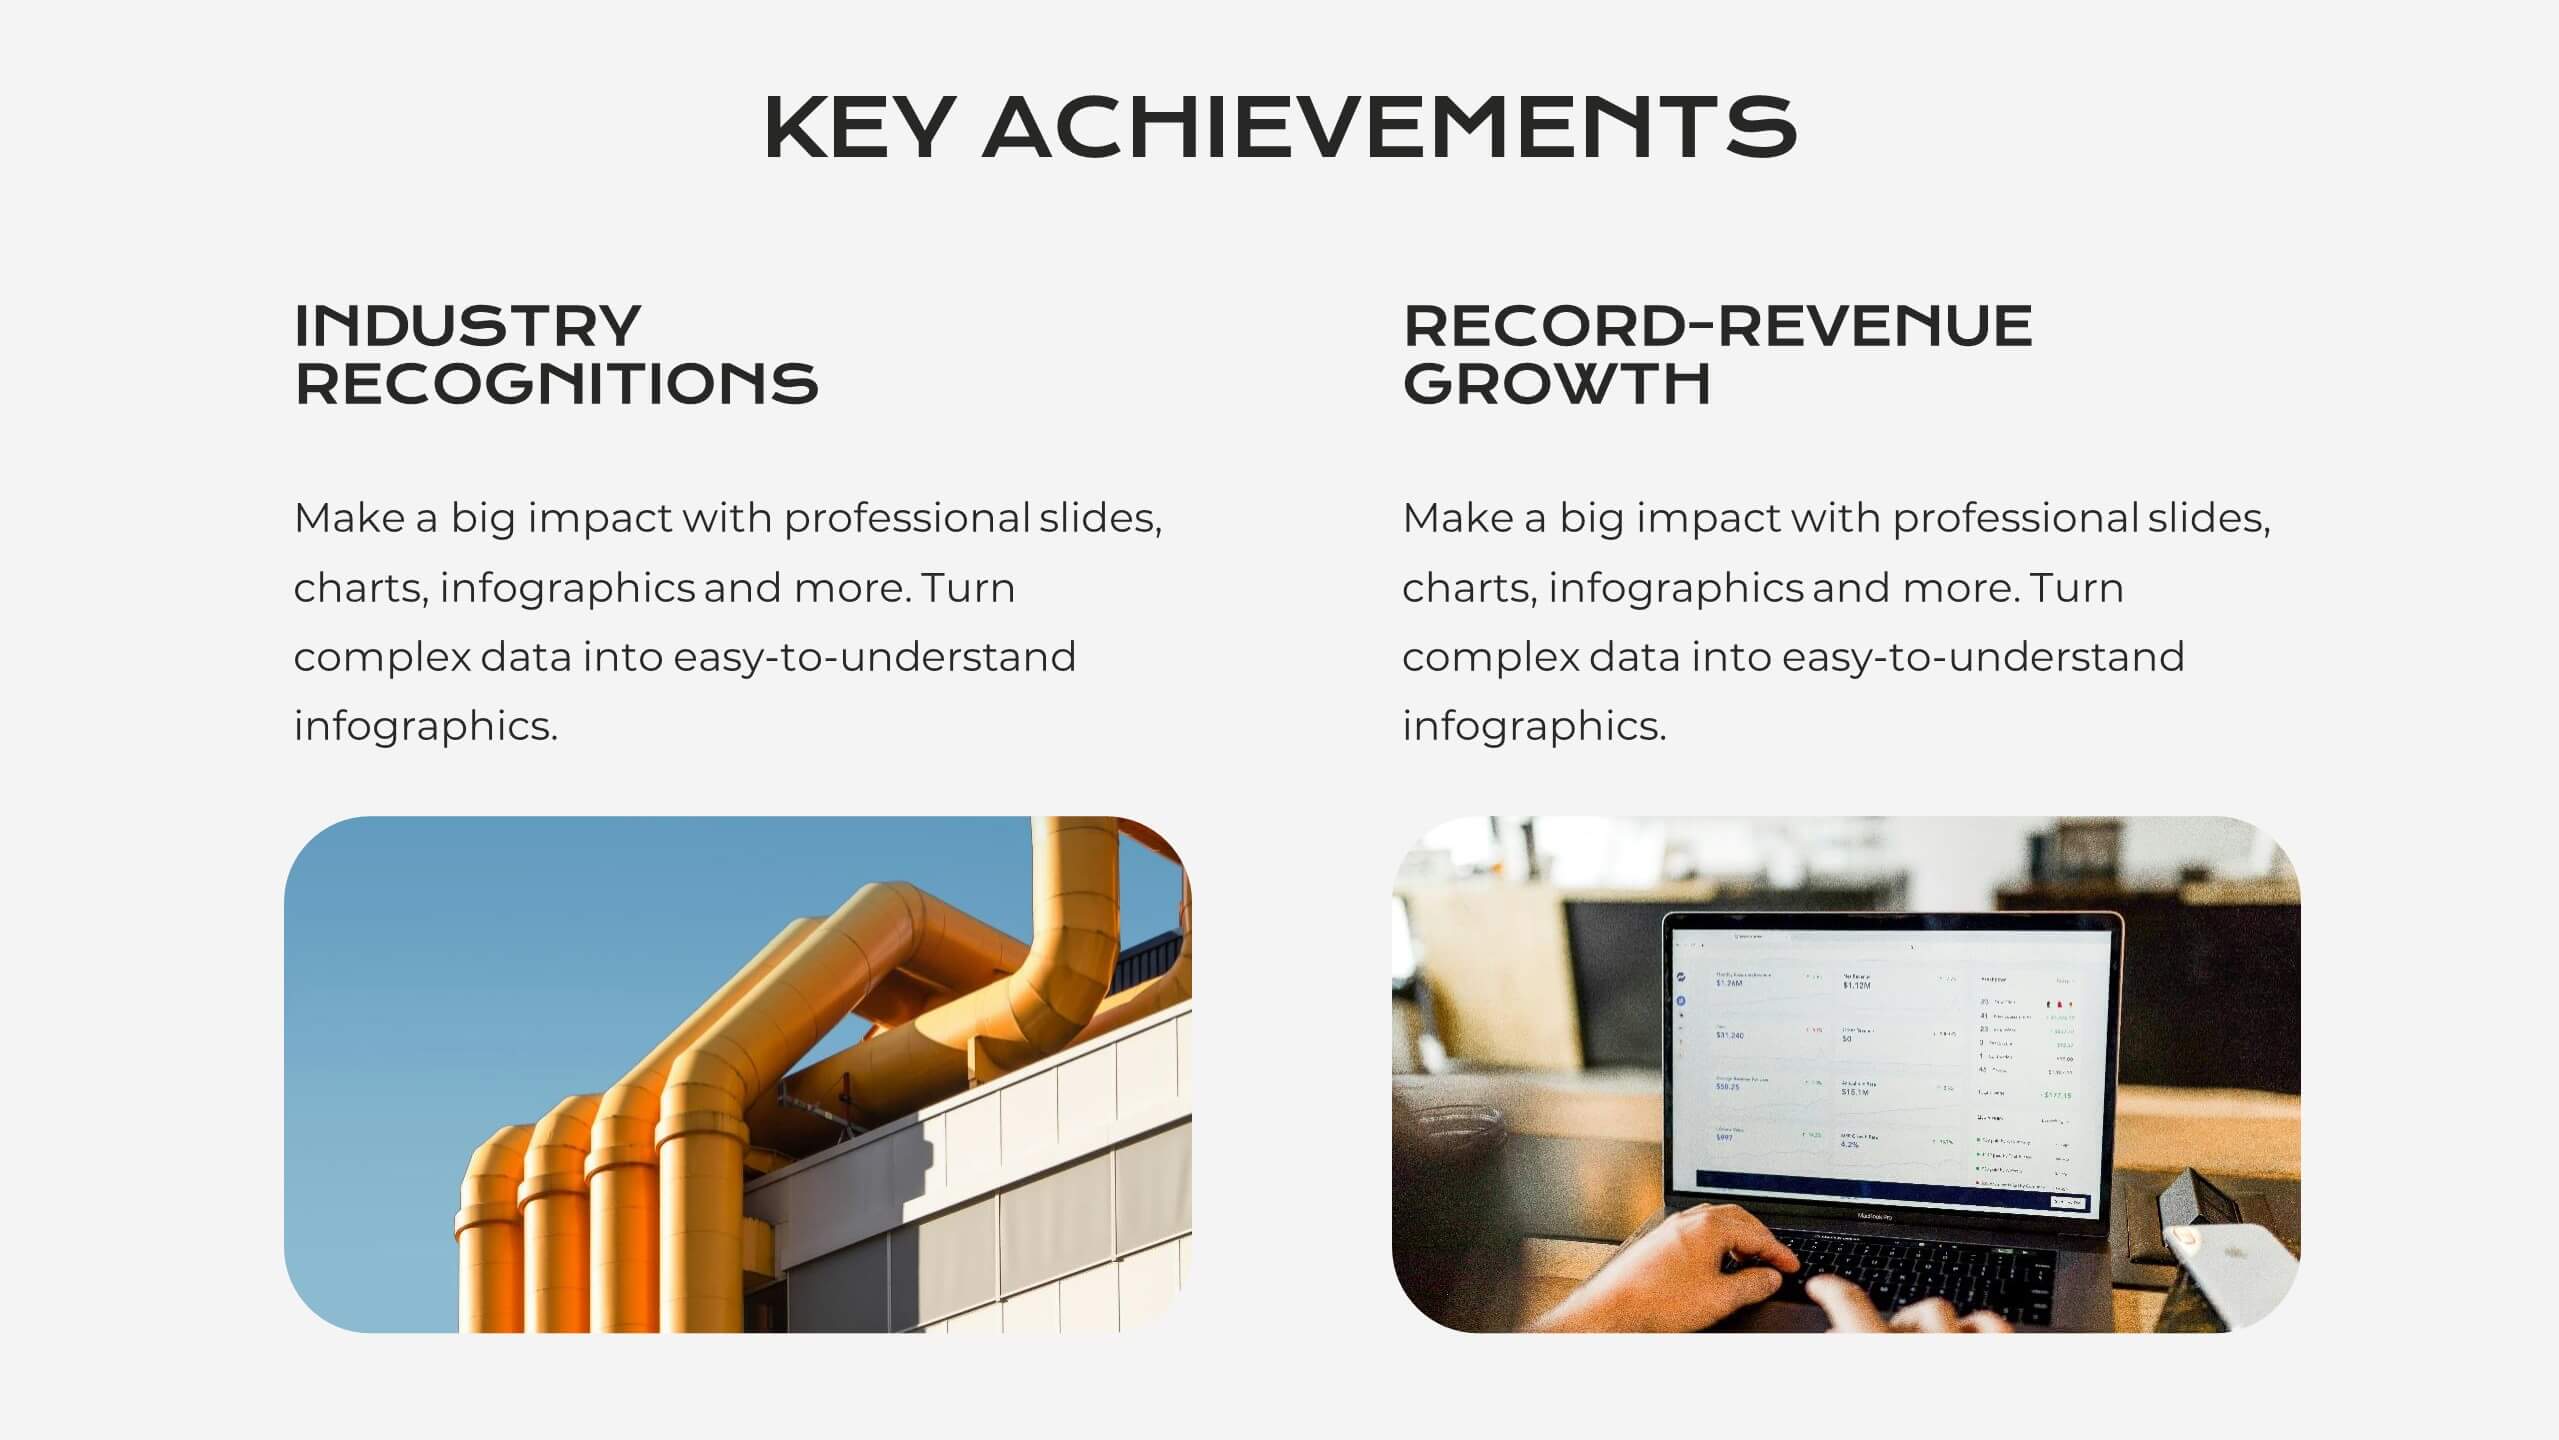
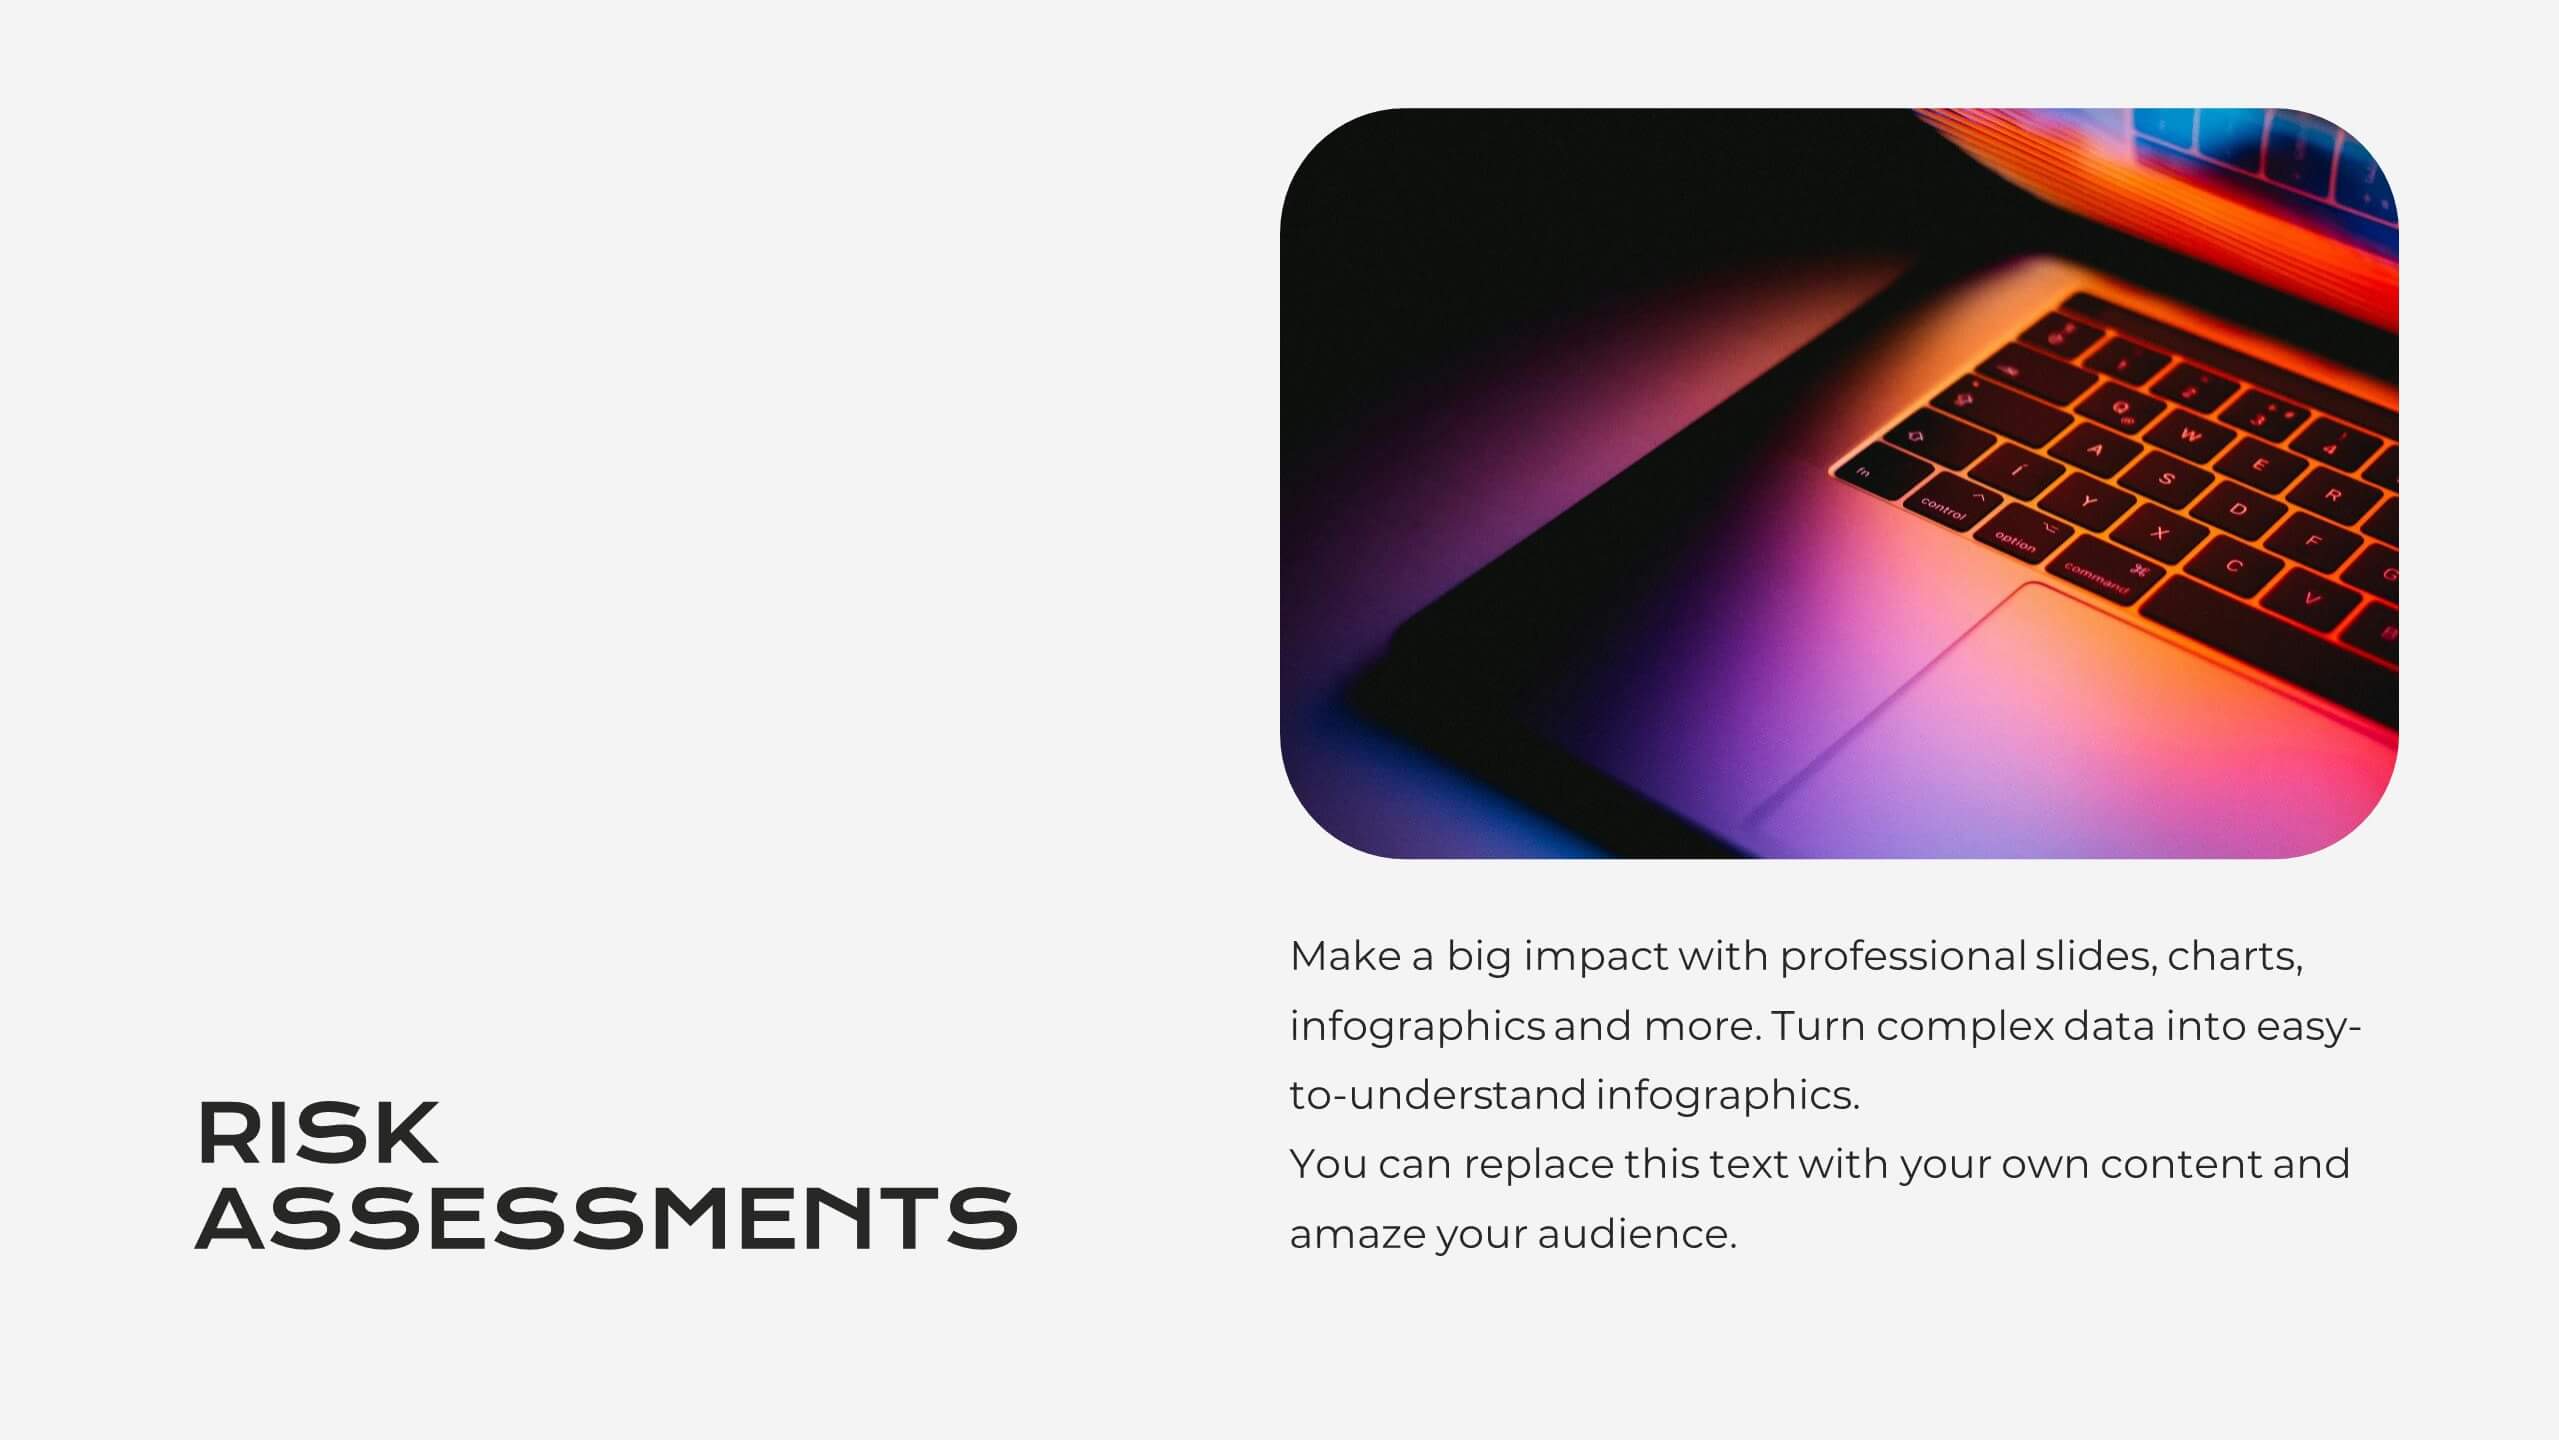
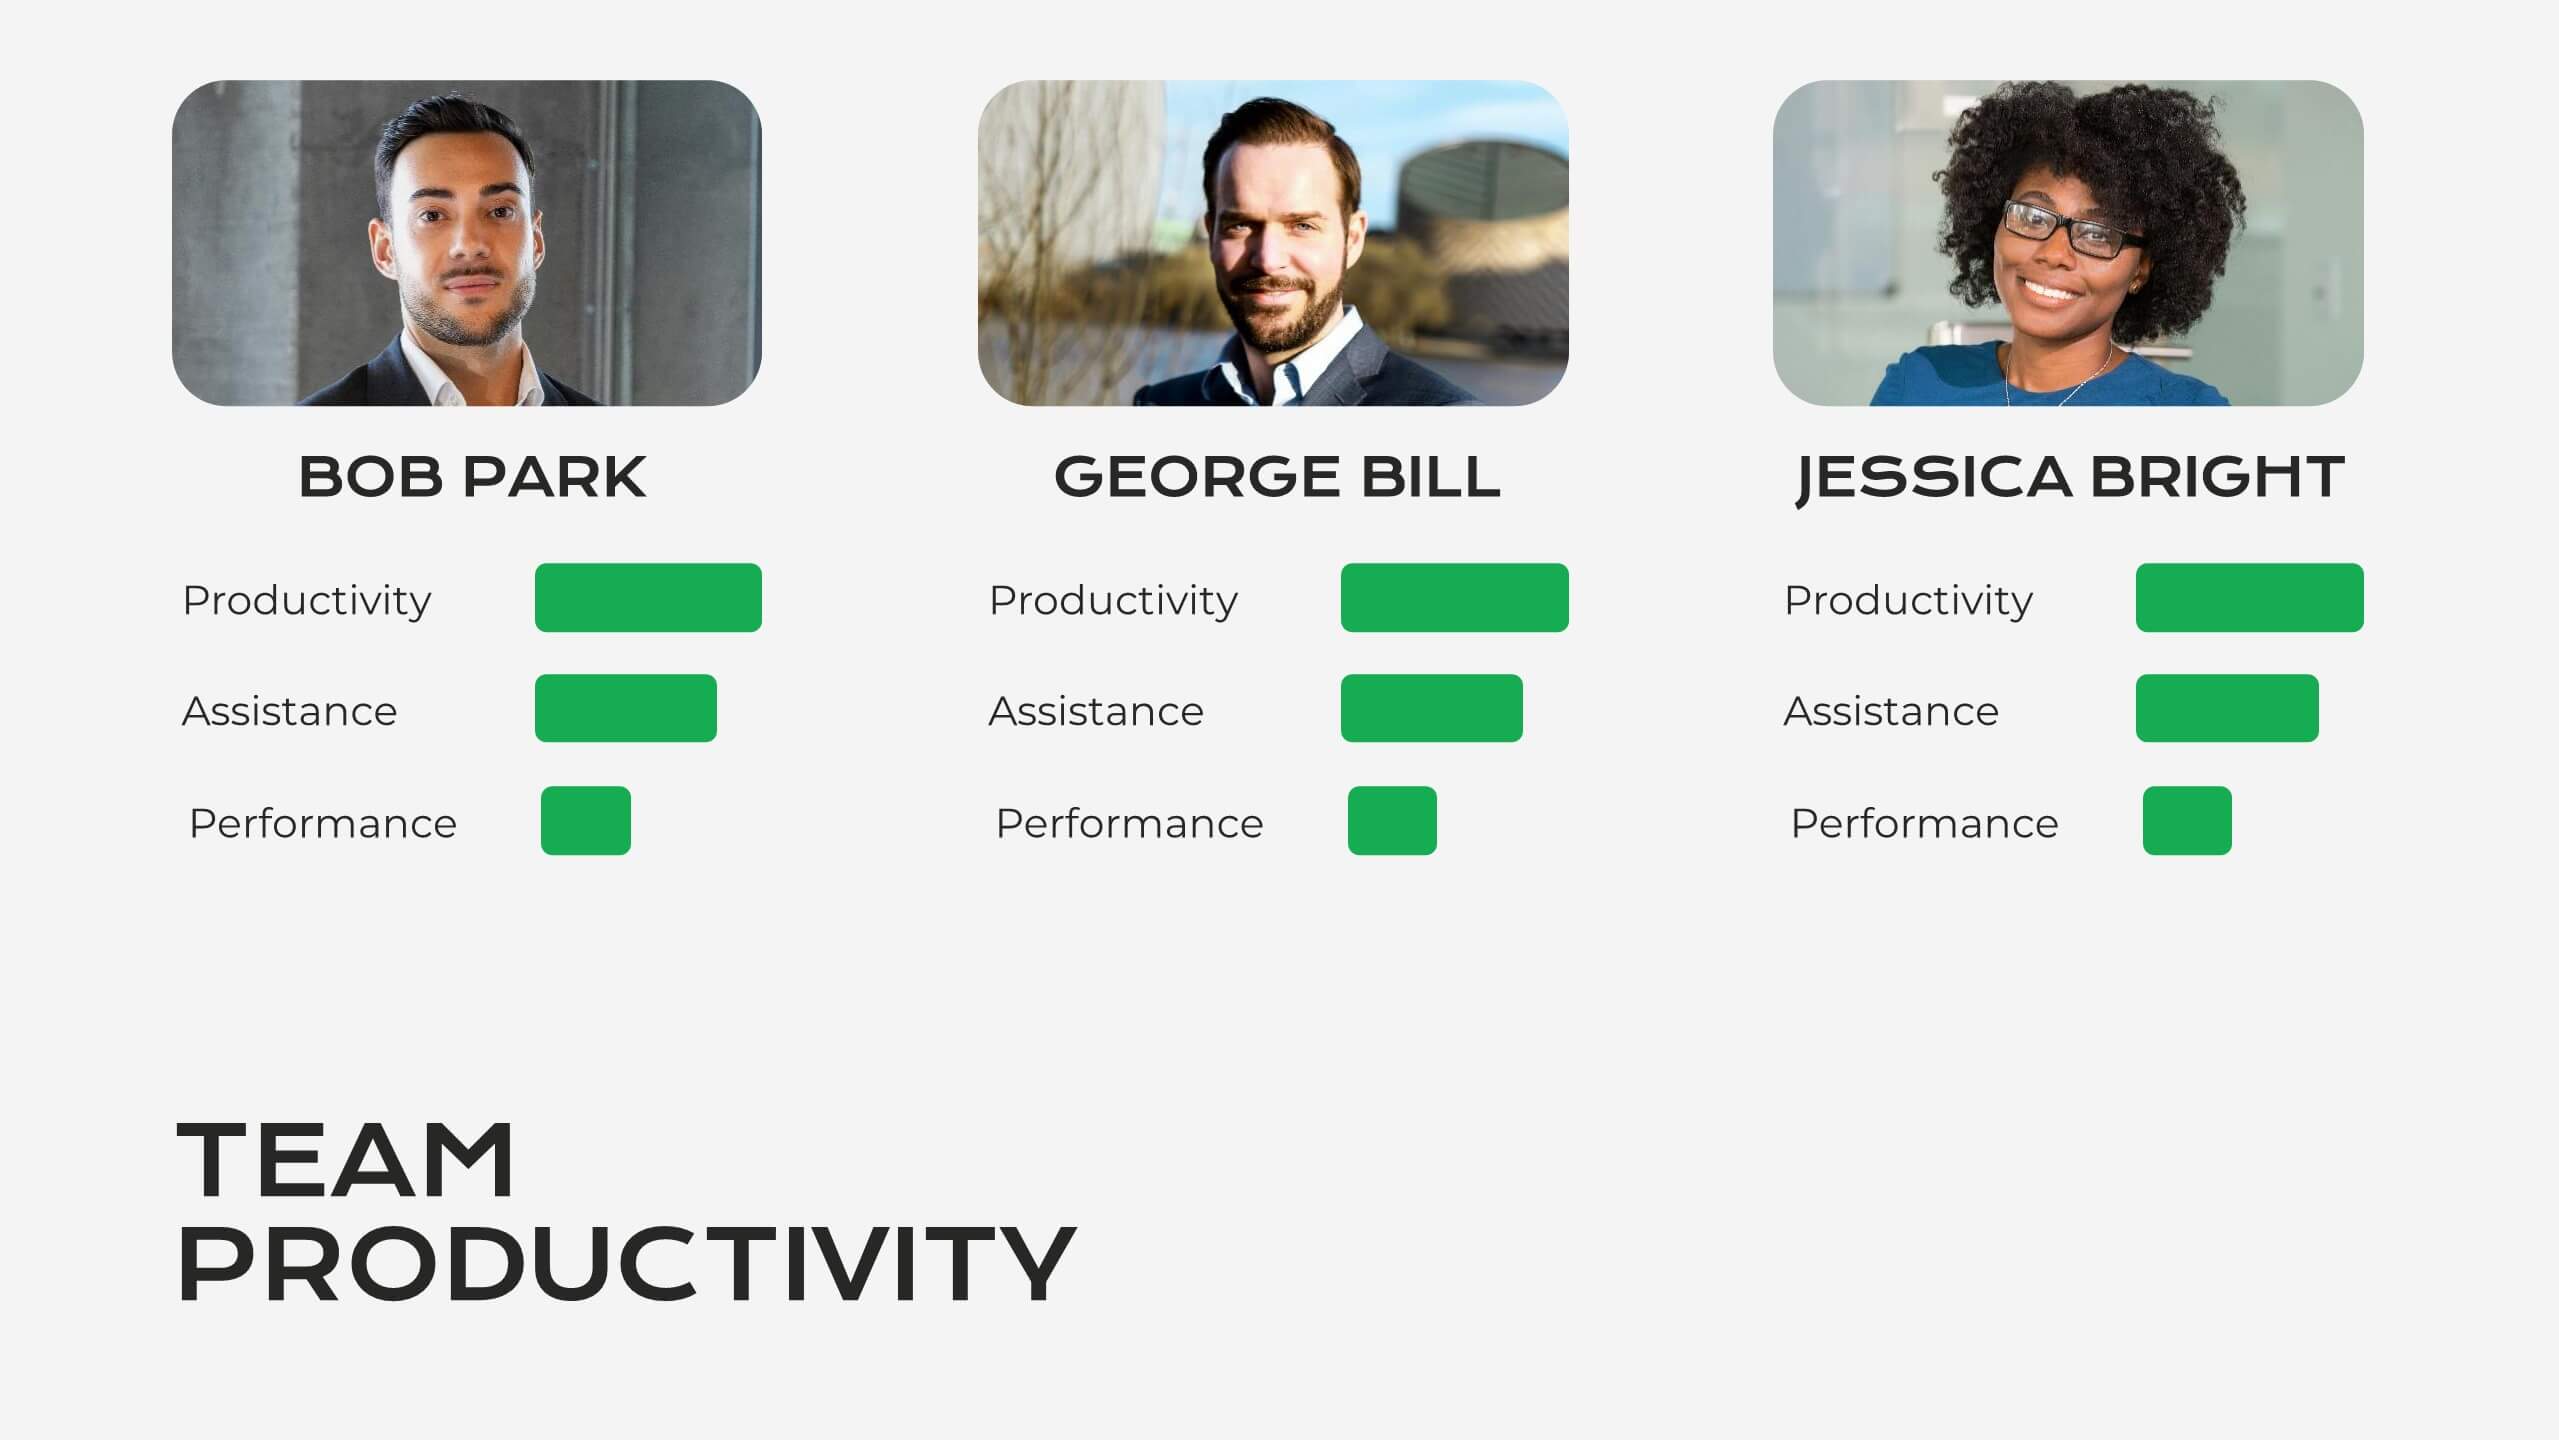
Remote Work Productivity Presentation
The "Remote Work Productivity" presentation template features a clean and modern design, ideal for showcasing strategies and statistics related to remote work efficiency. Each slide allows for the display of key data points and statistics, supported by visual elements like percentage indicators and progress bars that enhance the presentation’s readability and impact. This template is perfect for businesses looking to improve remote operations or present data-driven insights into remote work performance, making it easier for viewers to grasp the effectiveness of remote work policies and tools.


6 diapositivas
Insurance Comparison Infographic
Insurance comparison is the process of evaluating and comparing different insurance policies offered by various insurance companies to find the one that best meets your needs and requirements. This infographic template is a visual representation of different types of insurance policies and their key features, designed to help consumers compare and make informed decisions about their insurance needs. This infographic aims to simplify complex insurance information. This can be used on insurance websites, marketing materials, and educational resources to assist consumers in making well-informed insurance choices based on their unique needs and preferences.


5 diapositivas
History Timeline Infographics
A History Timeline is a visual representation of events and their chronological order over a specific period of time. These infographic templates are designed to help you organize and understand historical events by presenting them in a sequential manner. It offers a visually engaging way to present the information and create a clear understanding of the sequence and significance of events. They showcases the chronological sequence of historical events, developments, or milestones. Using this template will help your audience grasp the sequence of events and the context of historical periods, facilitating a deeper understanding and appreciation of history.


5 diapositivas
Body System Overview Presentation
Visually explain key human body systems with this clean and modern slide. Each section highlights a different organ with labeled points (A–D) for easy reference. Ideal for health education, medical briefings, or anatomy lessons. Fully editable in PowerPoint, Keynote, or Google Slides to suit any professional or academic need.


4 diapositivas
Financial KPI Analysis Presentation
Present key financial metrics with clarity using the Financial KPI Analysis slide. This layout highlights four essential indicators—MRR, Customer Count, Gross Profit Margin, and NPM—each with colorful data blocks and corresponding mini charts. A dynamic line graph and column chart provide deeper insight into monthly and categorical performance. Fully editable in PowerPoint, Keynote, and Google Slides for streamlined reporting.


6 diapositivas
Basic Numbers Infographic
This Basic Numbers Infographic is a visual representation of numerical data or information using simple graphical elements. This infographic template is a straightforward way to convey statistics, facts, or comparisons to your audience in a clear and engaging manner. The infographic includes a clean and uncluttered design while effectively presenting the numerical information. The visual elements enhance understanding and make the infographic visually appealing to your audience. The icons, symbols, and simple illustrations enhance the appeal of the infographic. Compatible with Powerpoint, Keynote, and Google Slides.


5 diapositivas
Healthcare Solutions in Modern Medicine Presentation
Present pharmaceutical and medical data with clarity using these modern healthcare infographics. Designed with pill packs, bandages, and capsules, this editable template is ideal for illustrating treatment comparisons, solution options, or patient care data. Perfect for medical professionals, health startups, and researchers using PowerPoint, Keynote, or Google Slides.


7 diapositivas
30 60 90 Day Plan Diagram Presentation
The 30-60-90 day plan is a document that outlines an individual's goals and objectives for the first 90 days of a new job. This template allows you the ability to set goals, review progress and analyze the results of your work. This infographic template is a multipurpose design that can be used for business, personal, and educational projects. It includes descriptive text and images to help you put together your presentation plan. It's easy to use and has been designed to be compatible with Powerpoint, Keynote, and Google Slides just add your own information and start presenting!

21 diapositivas
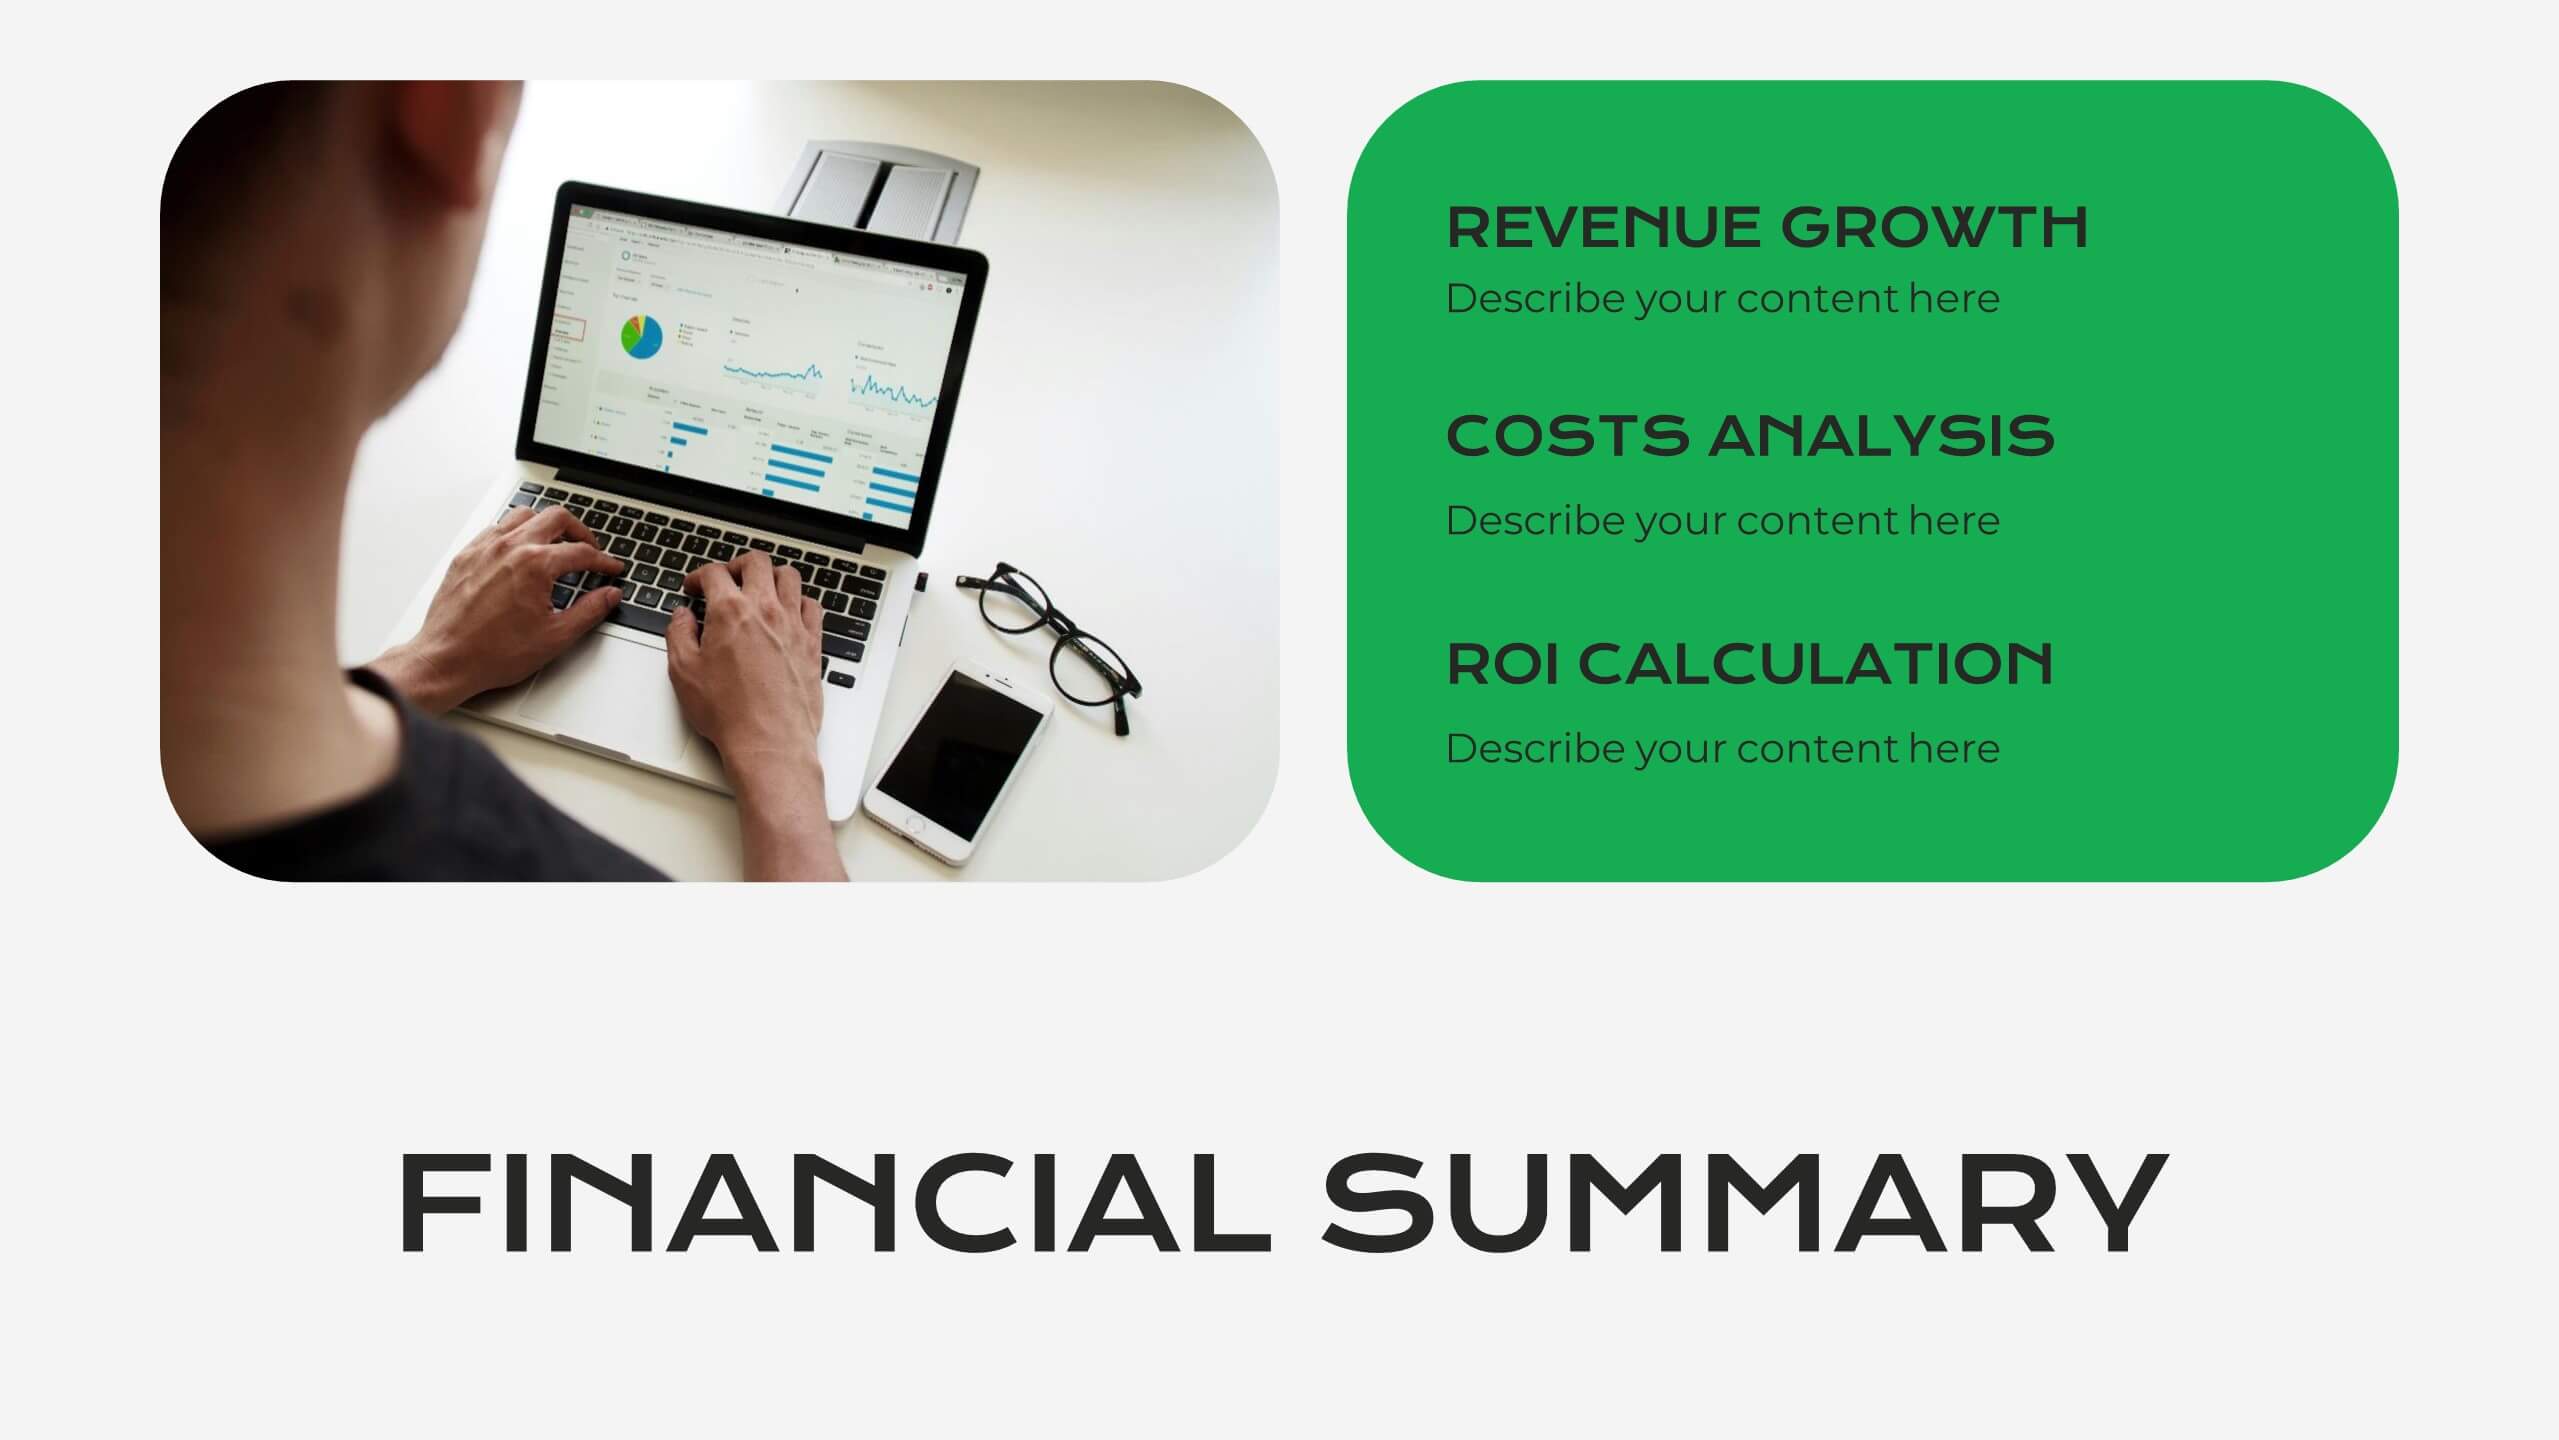
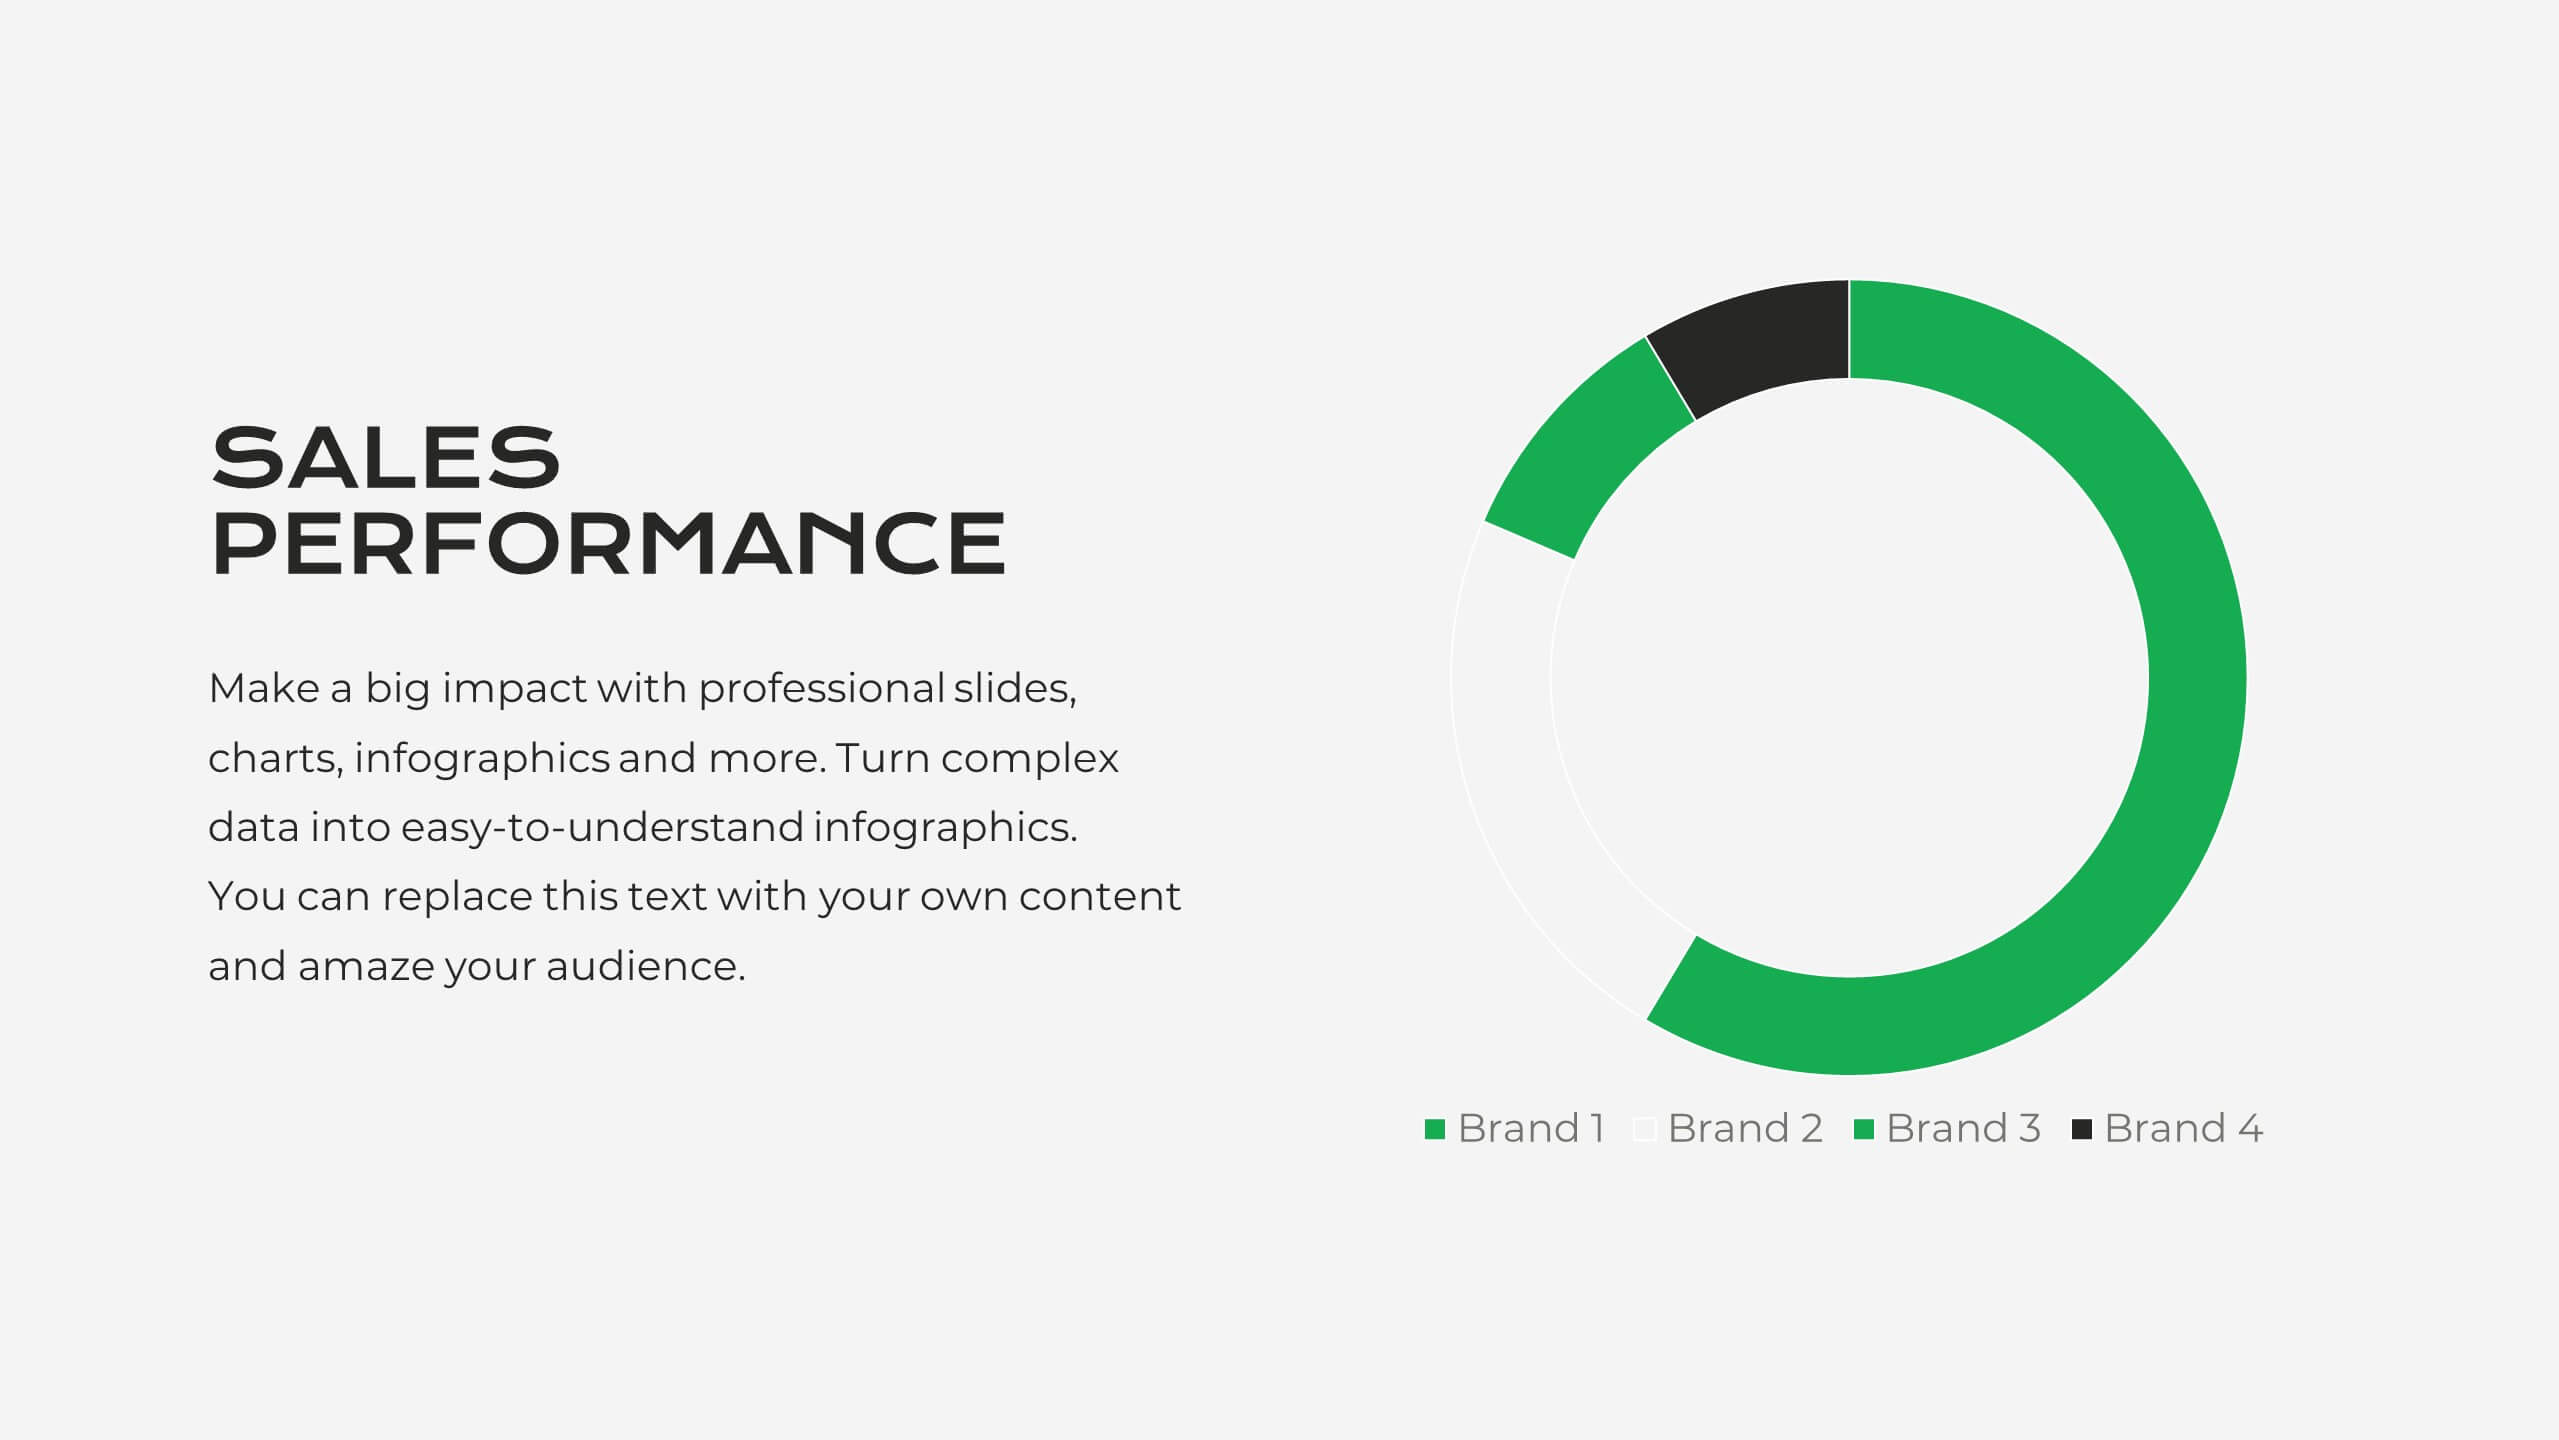
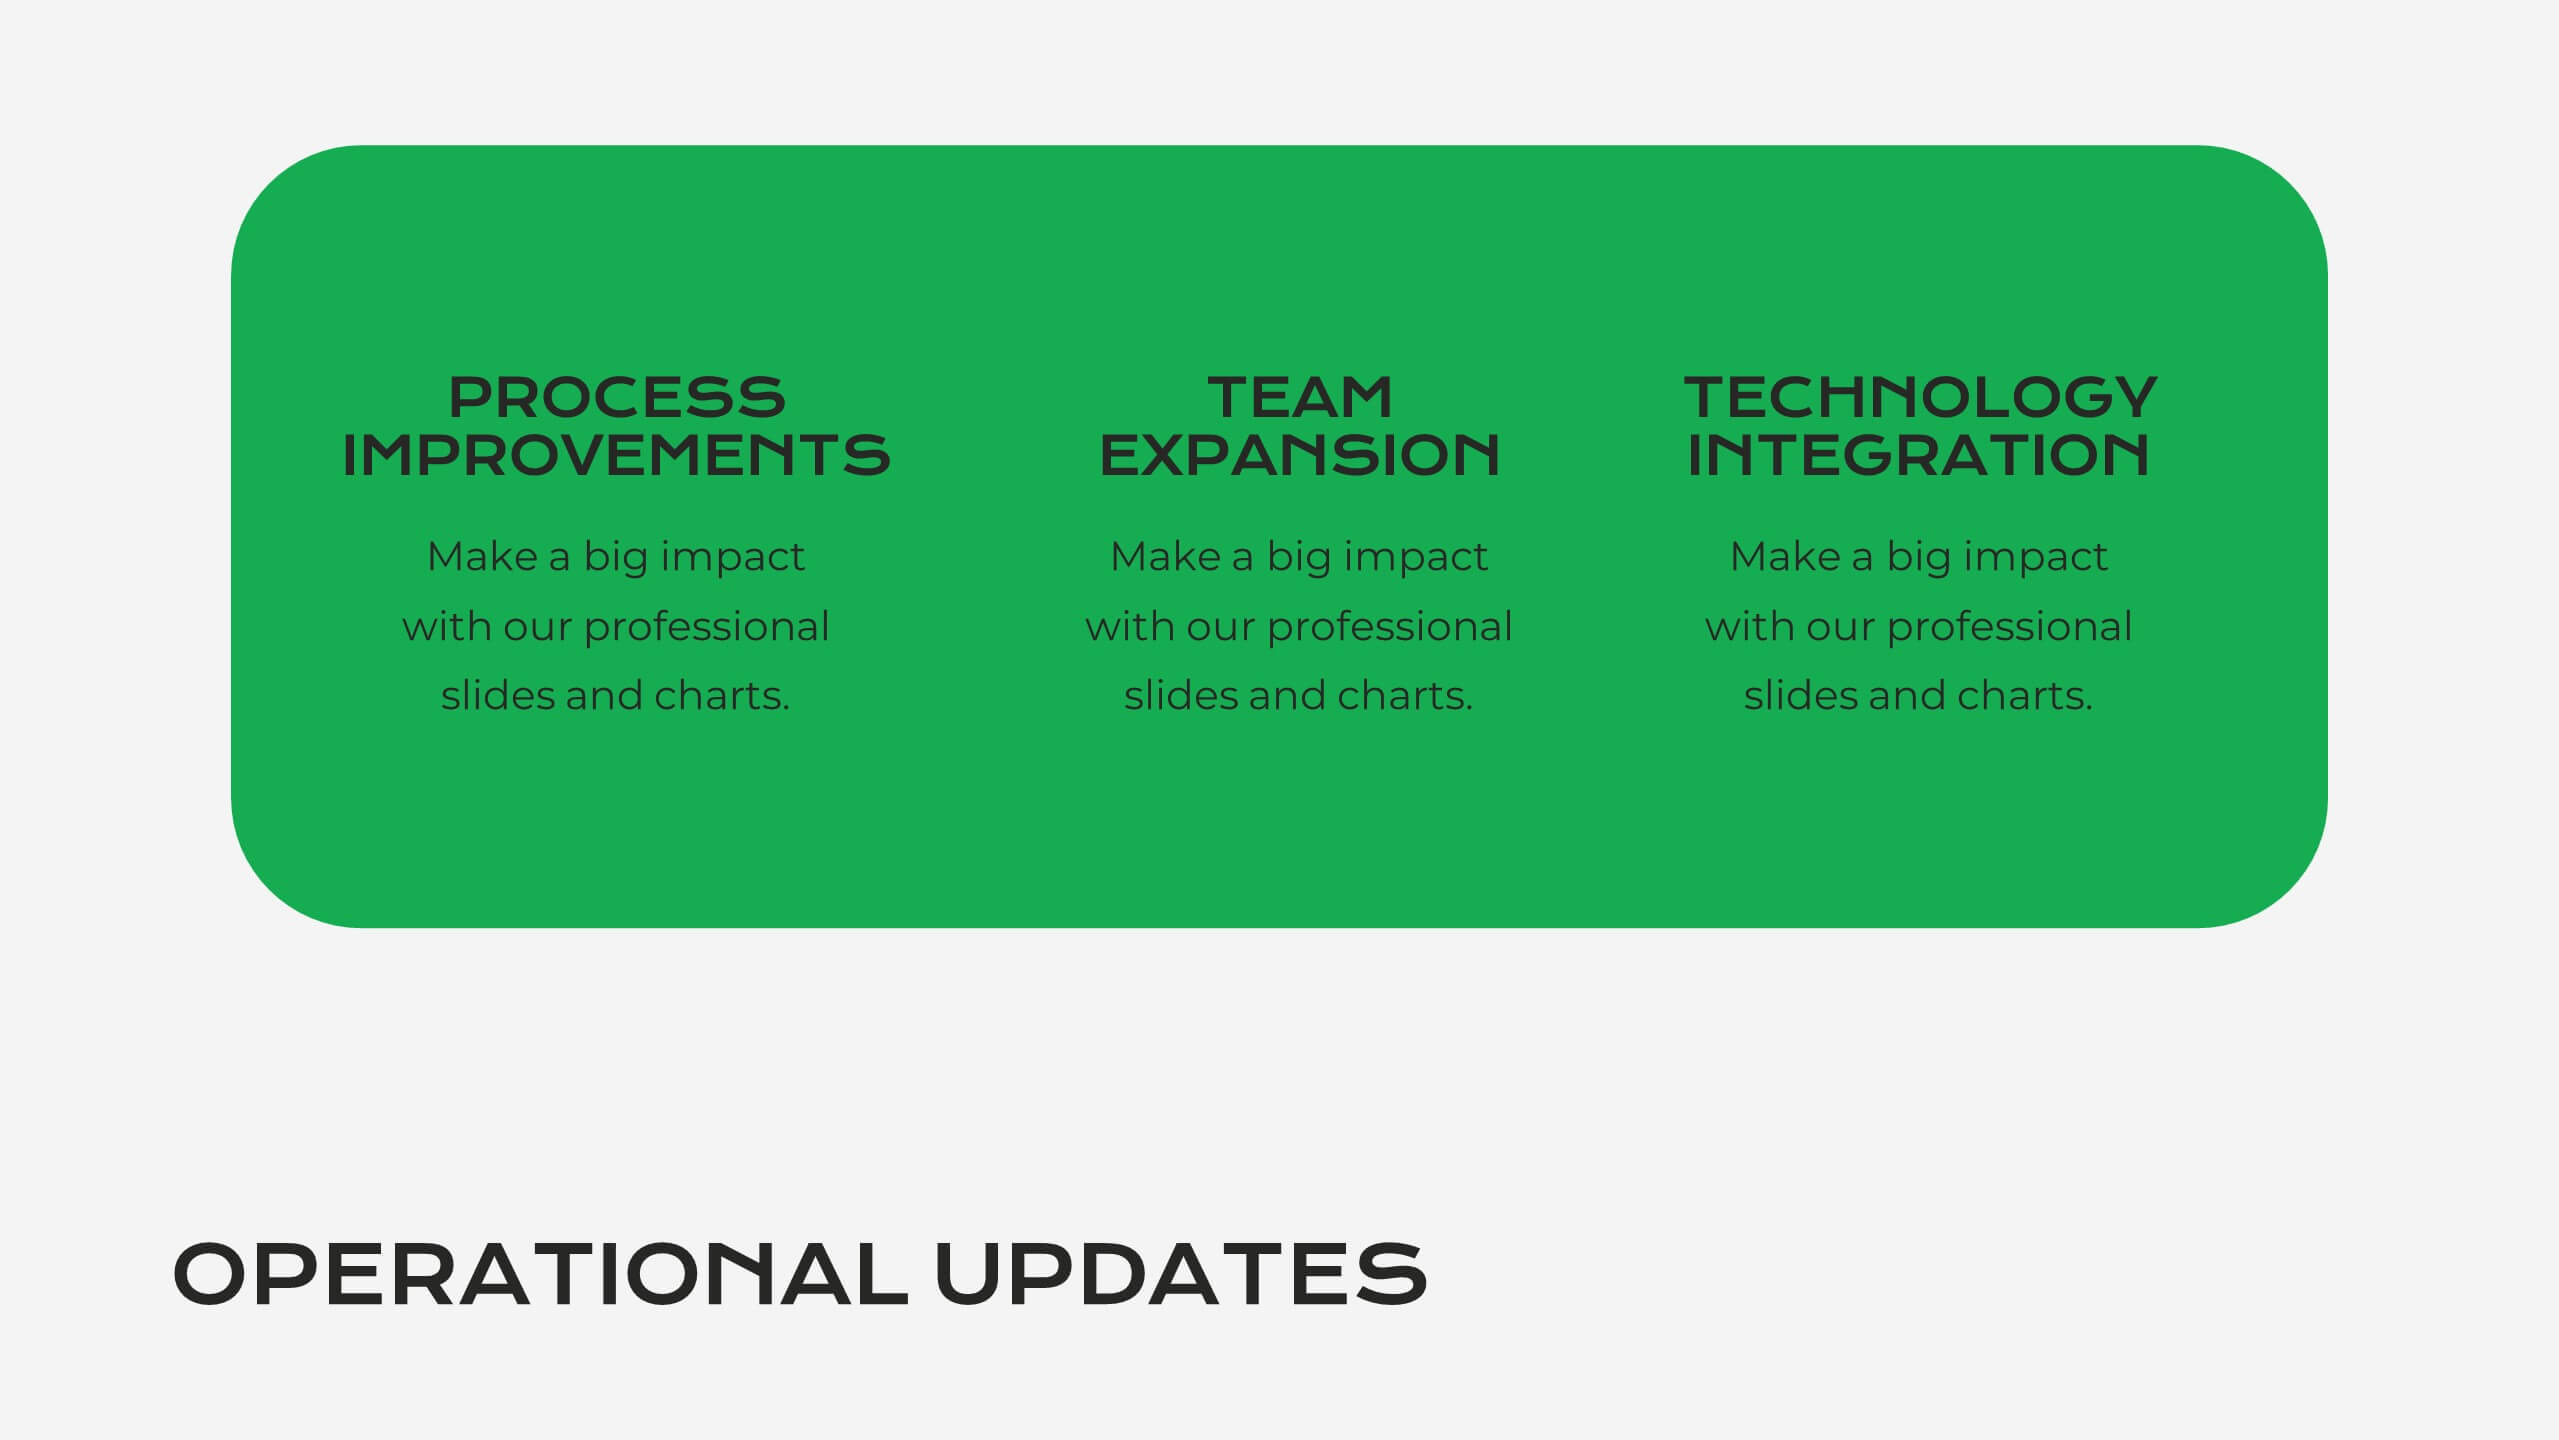
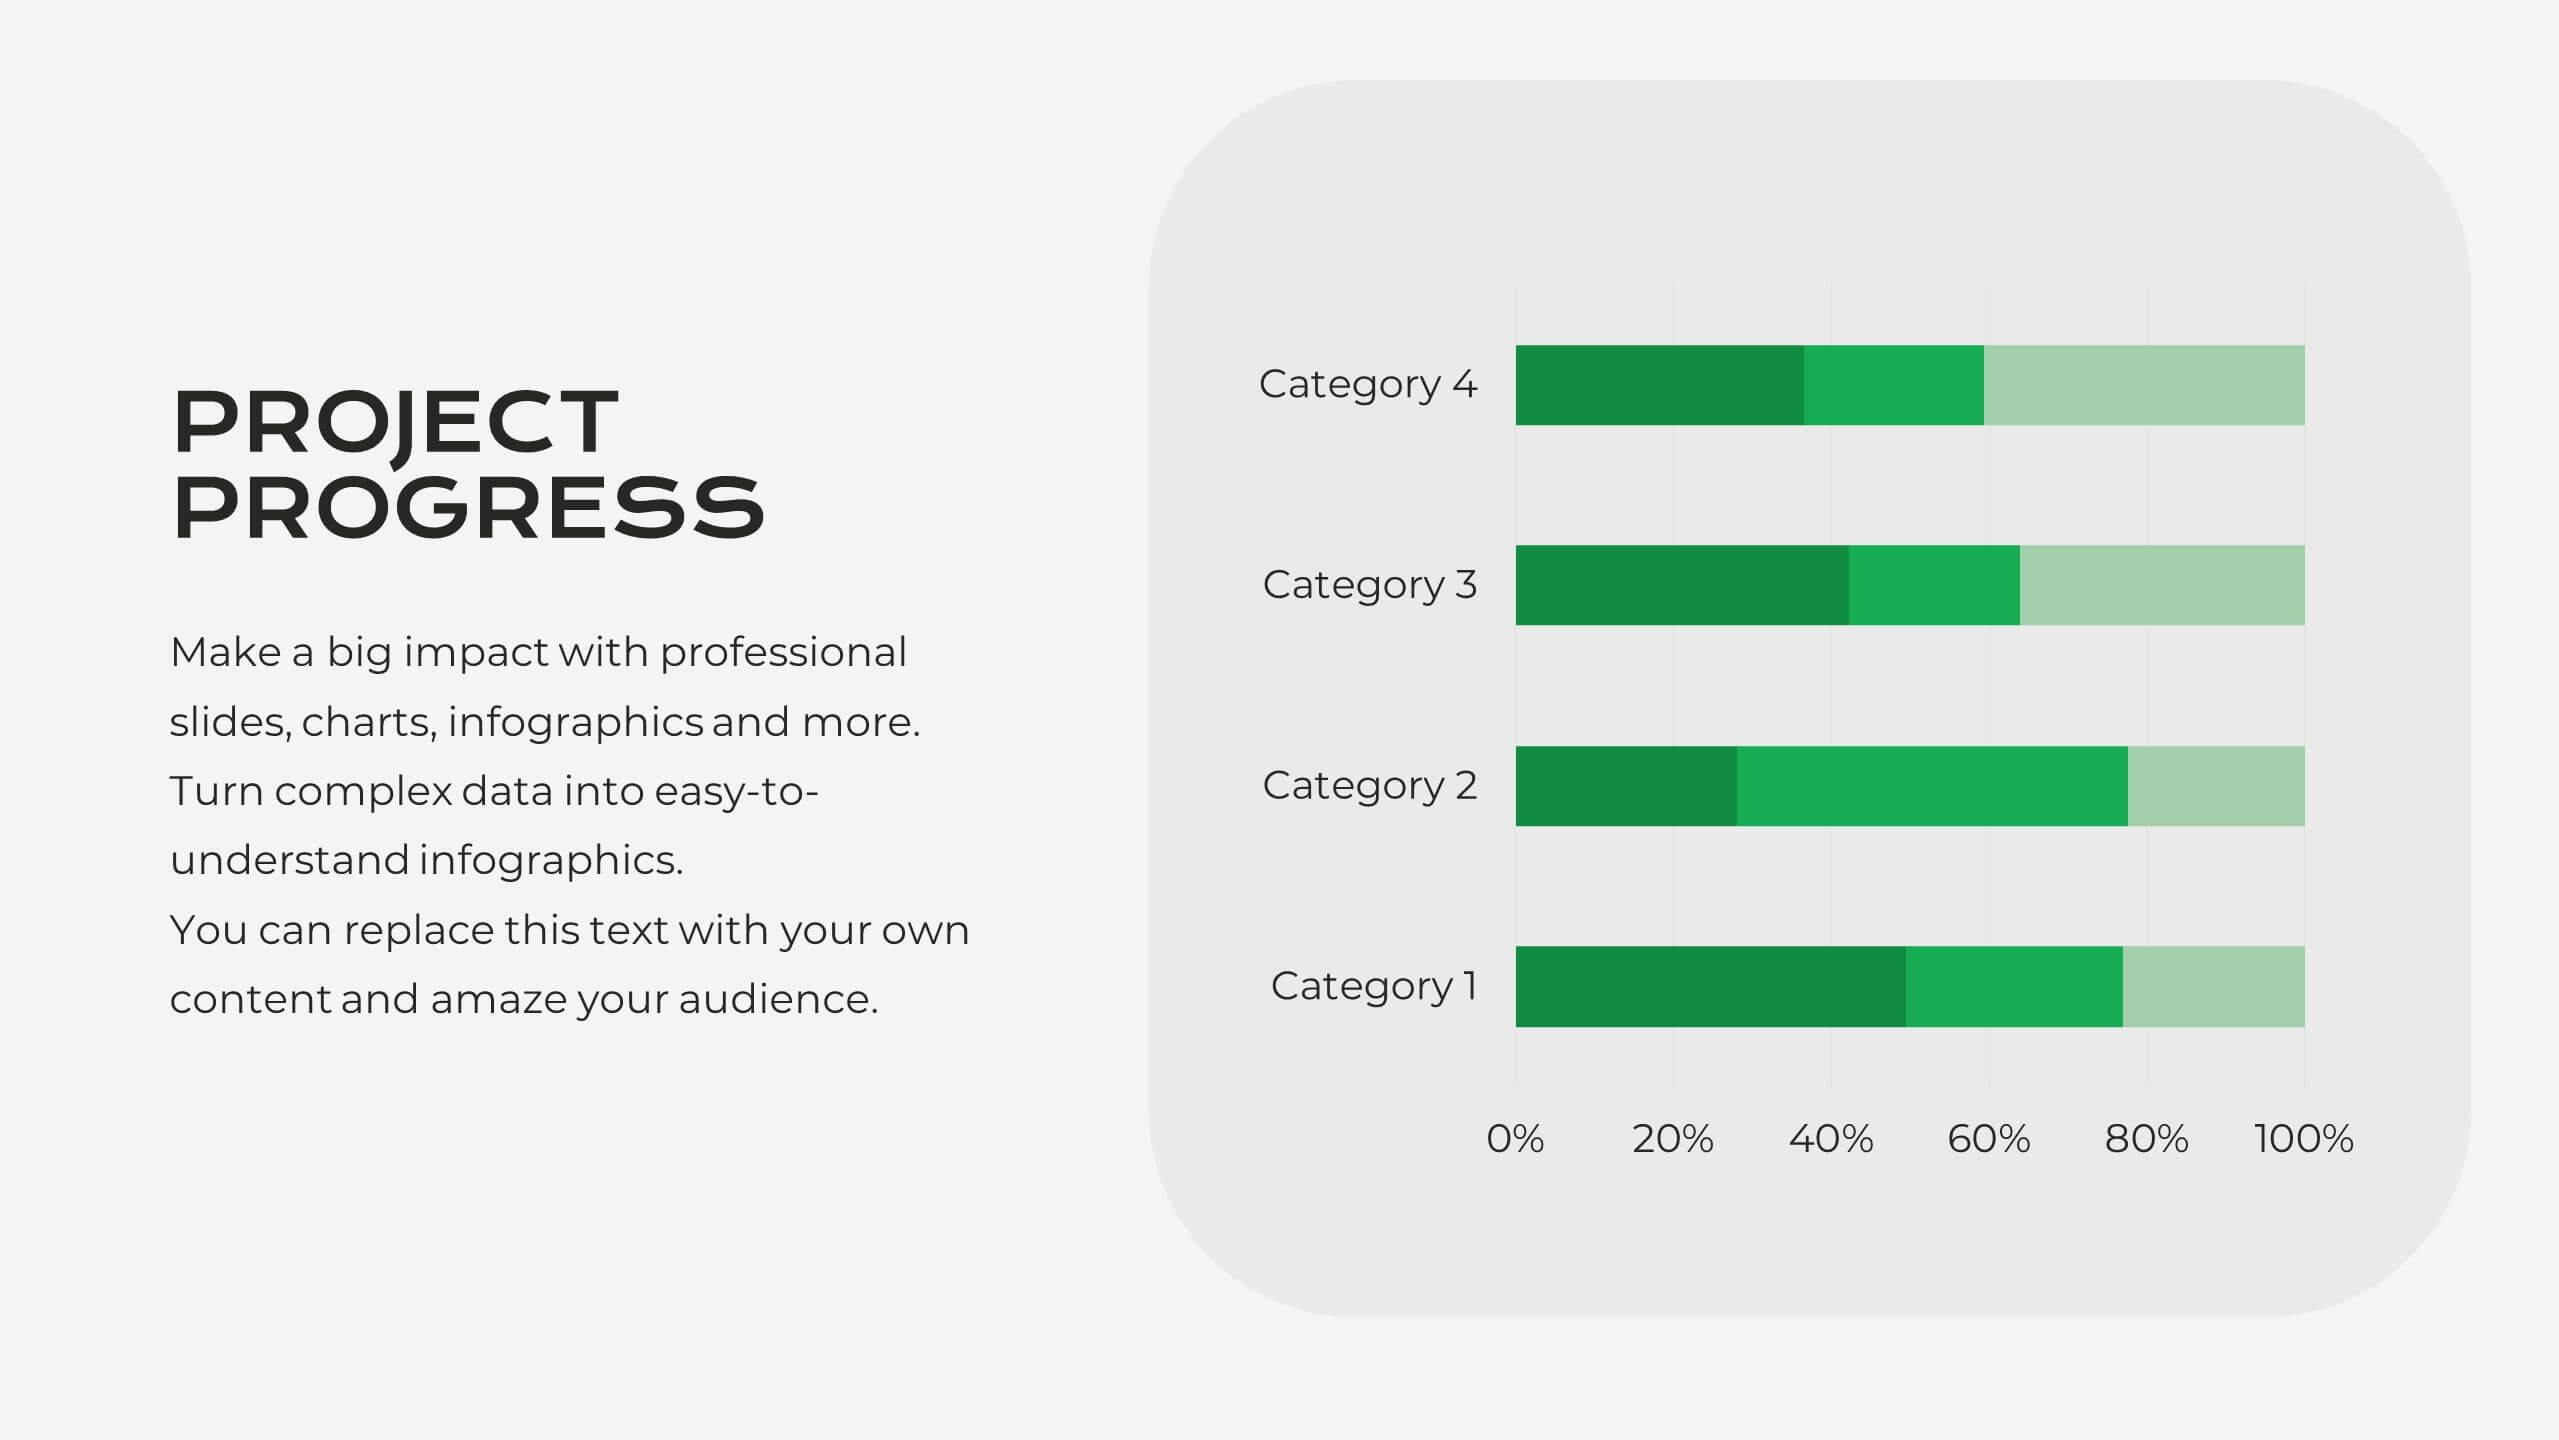
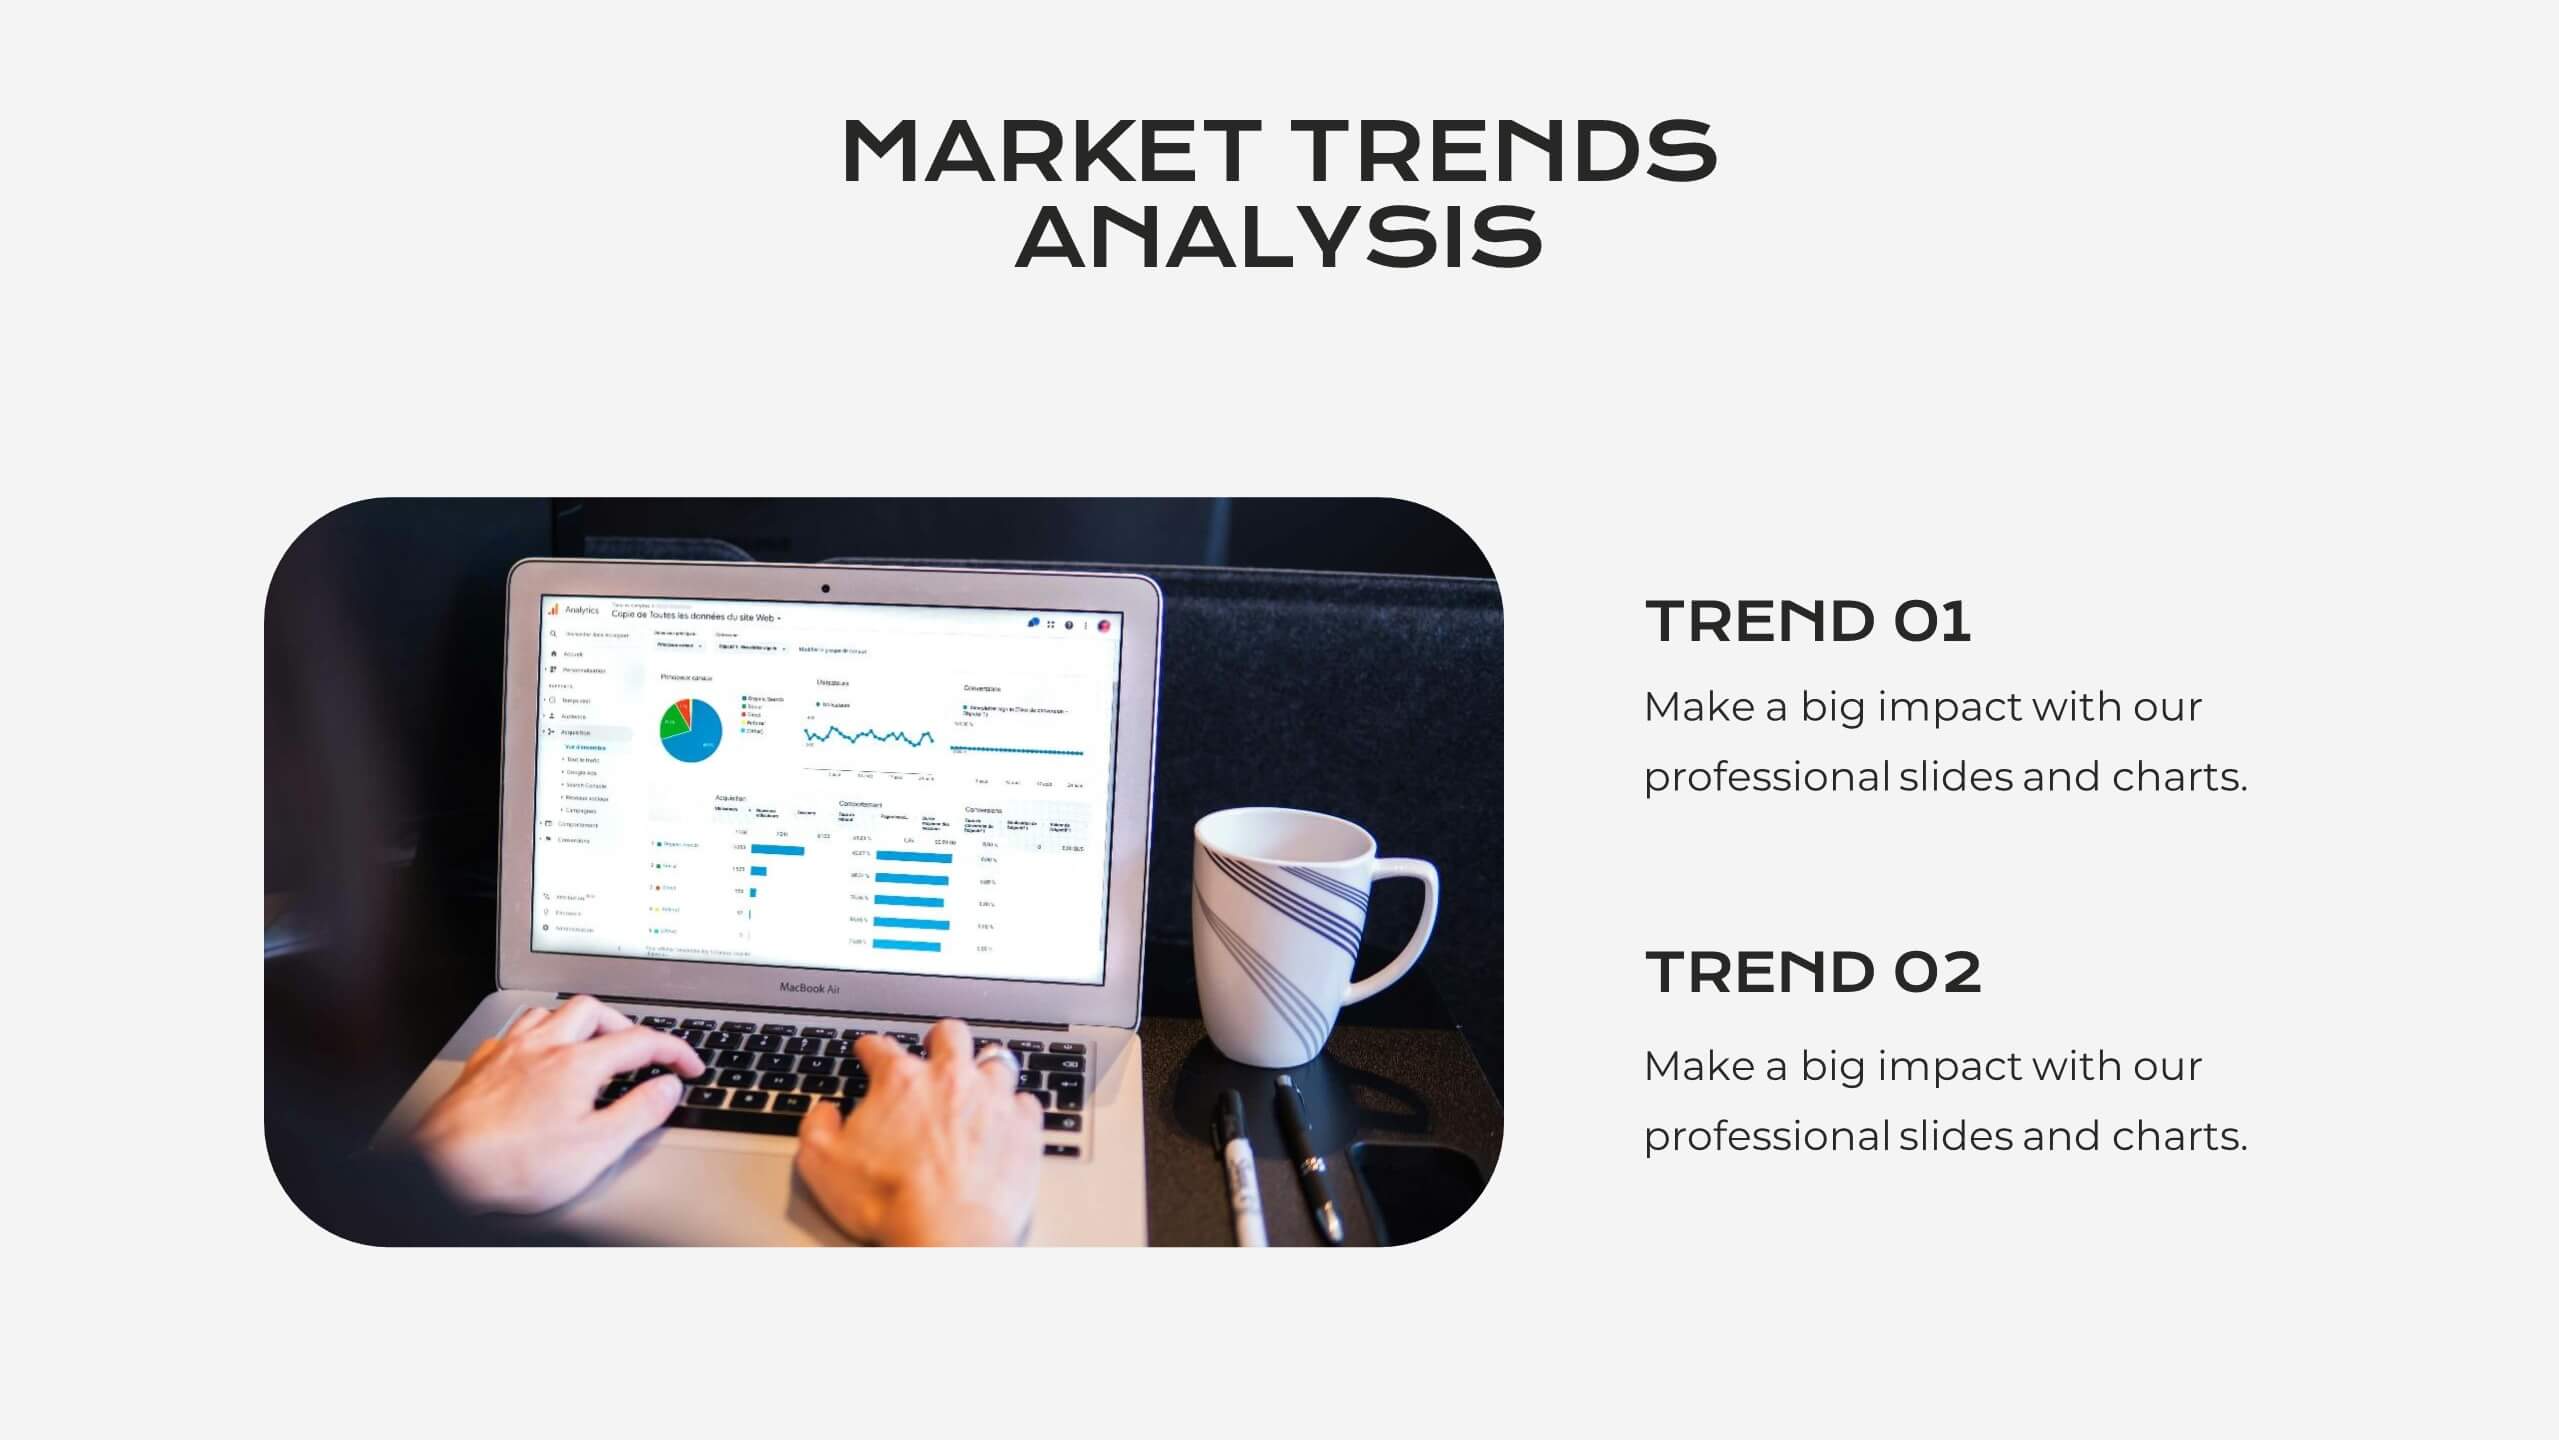
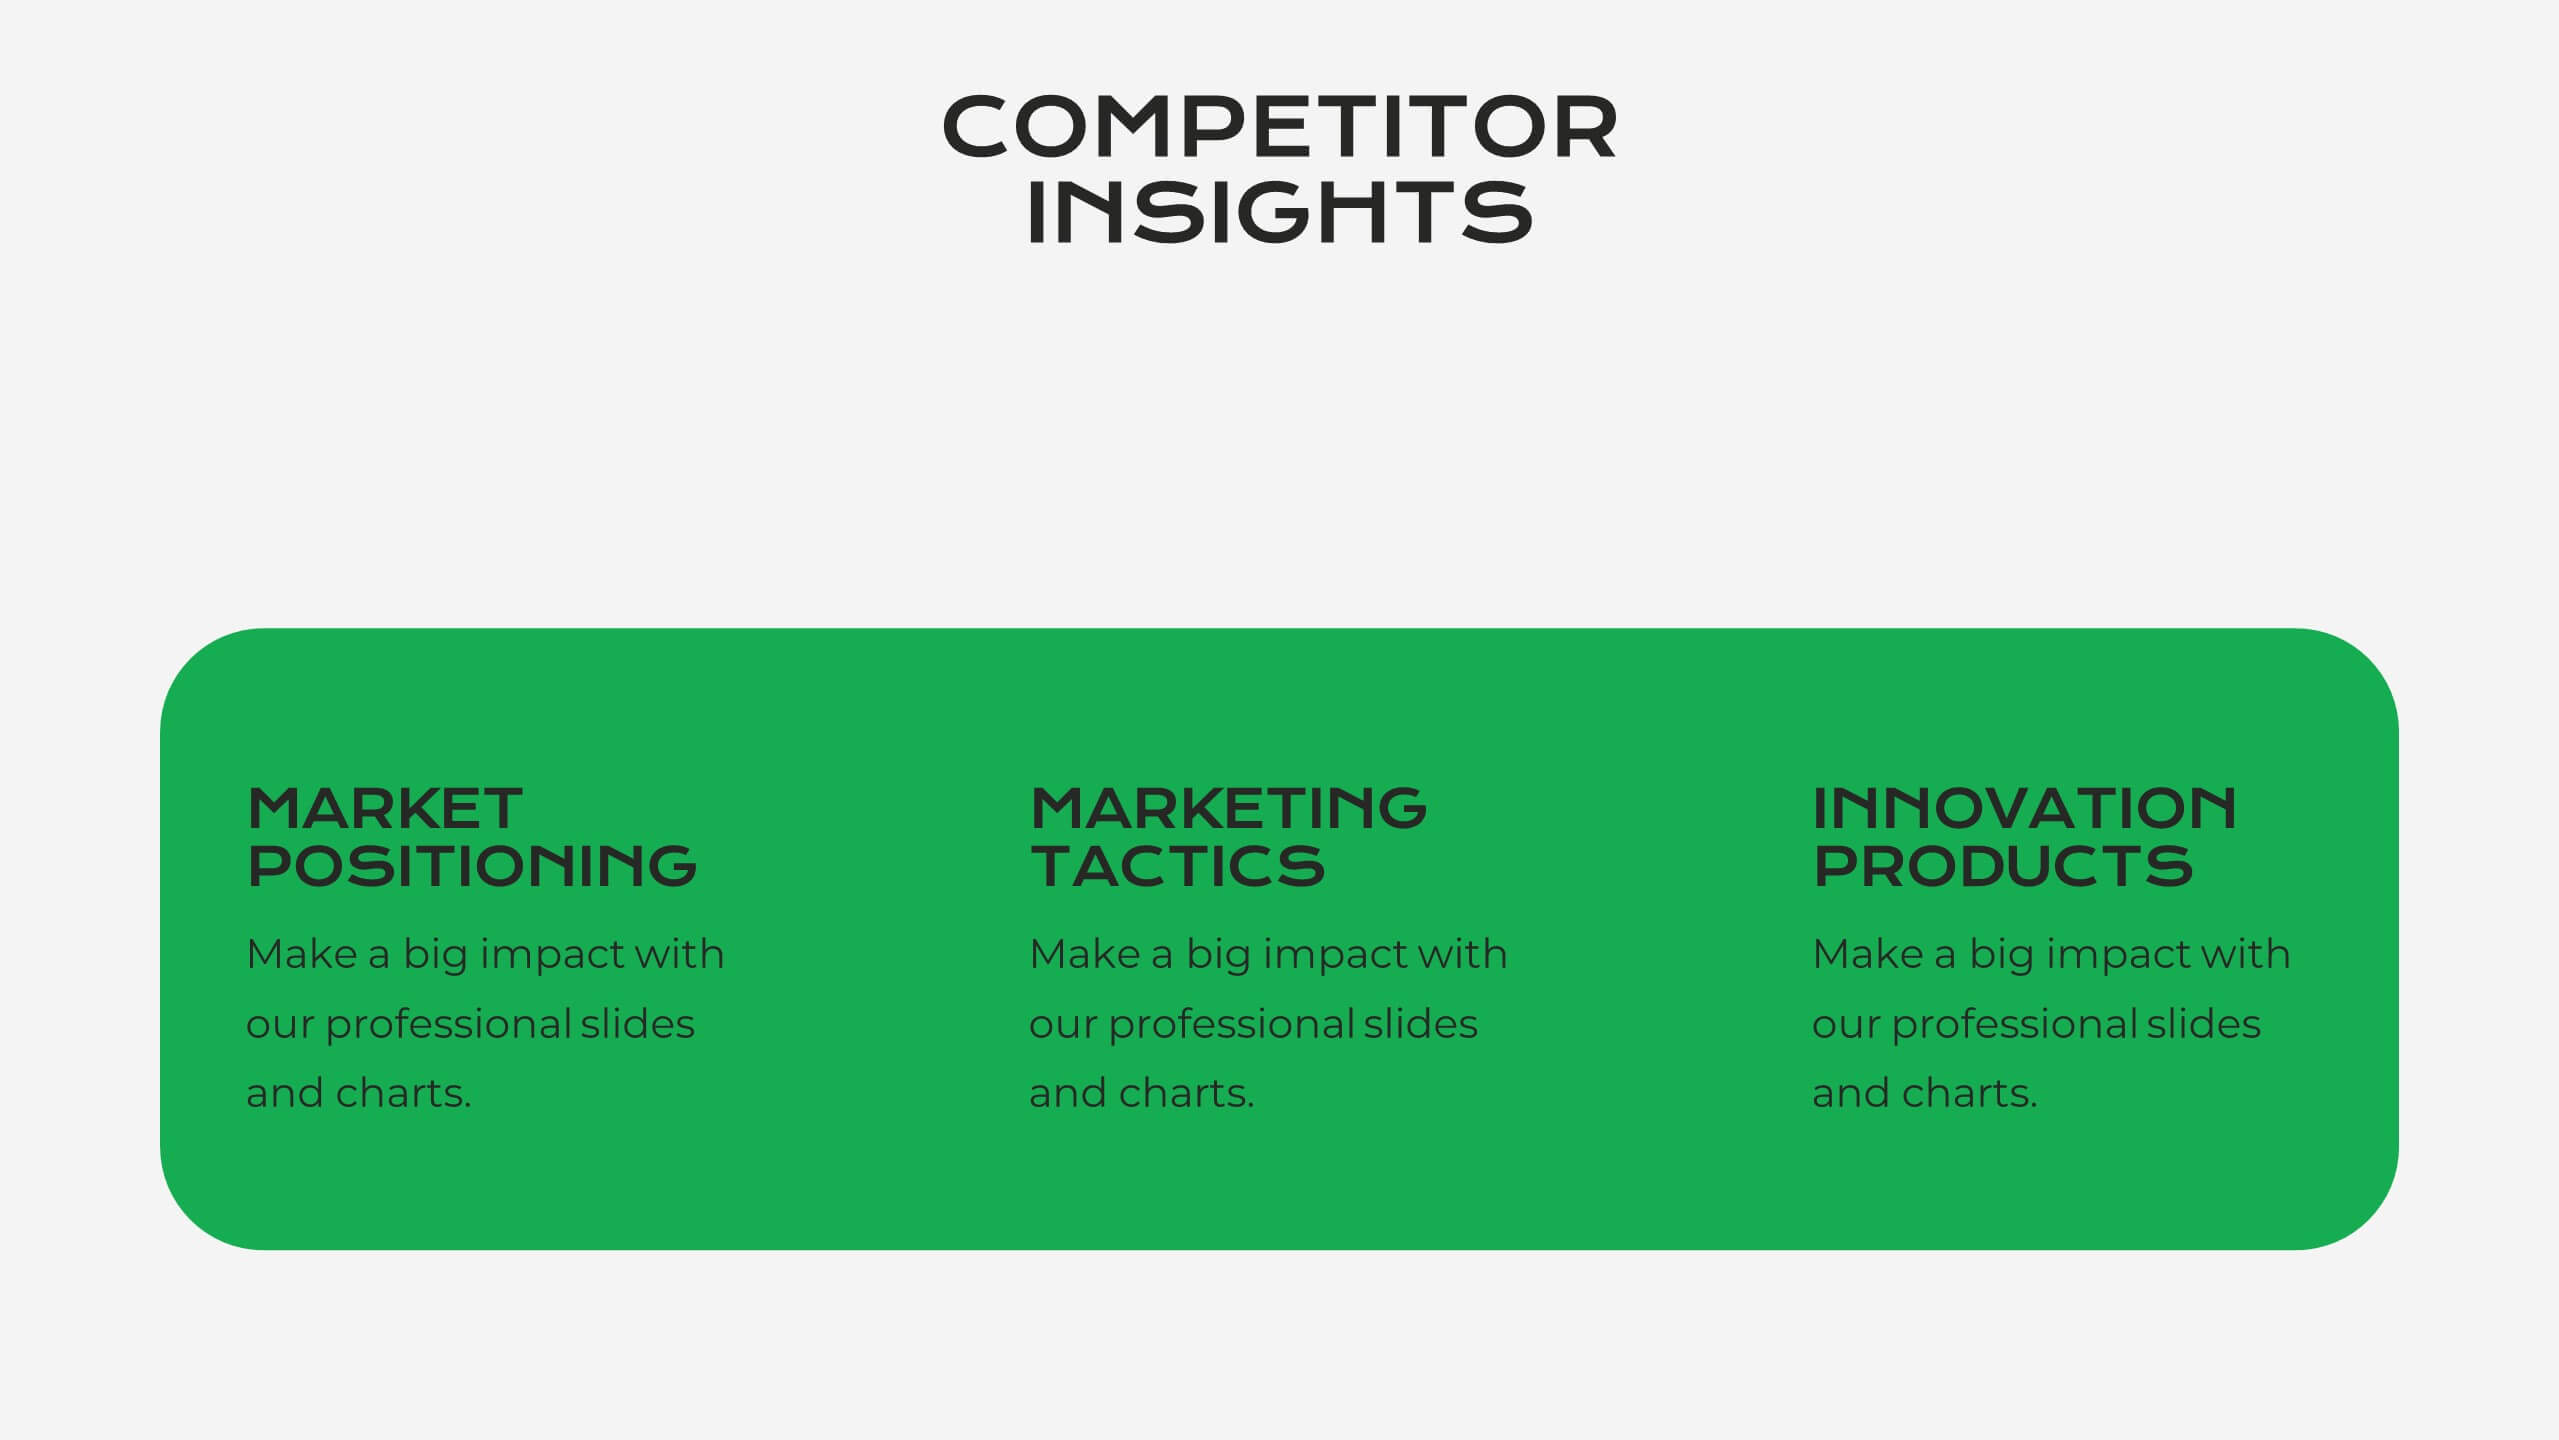
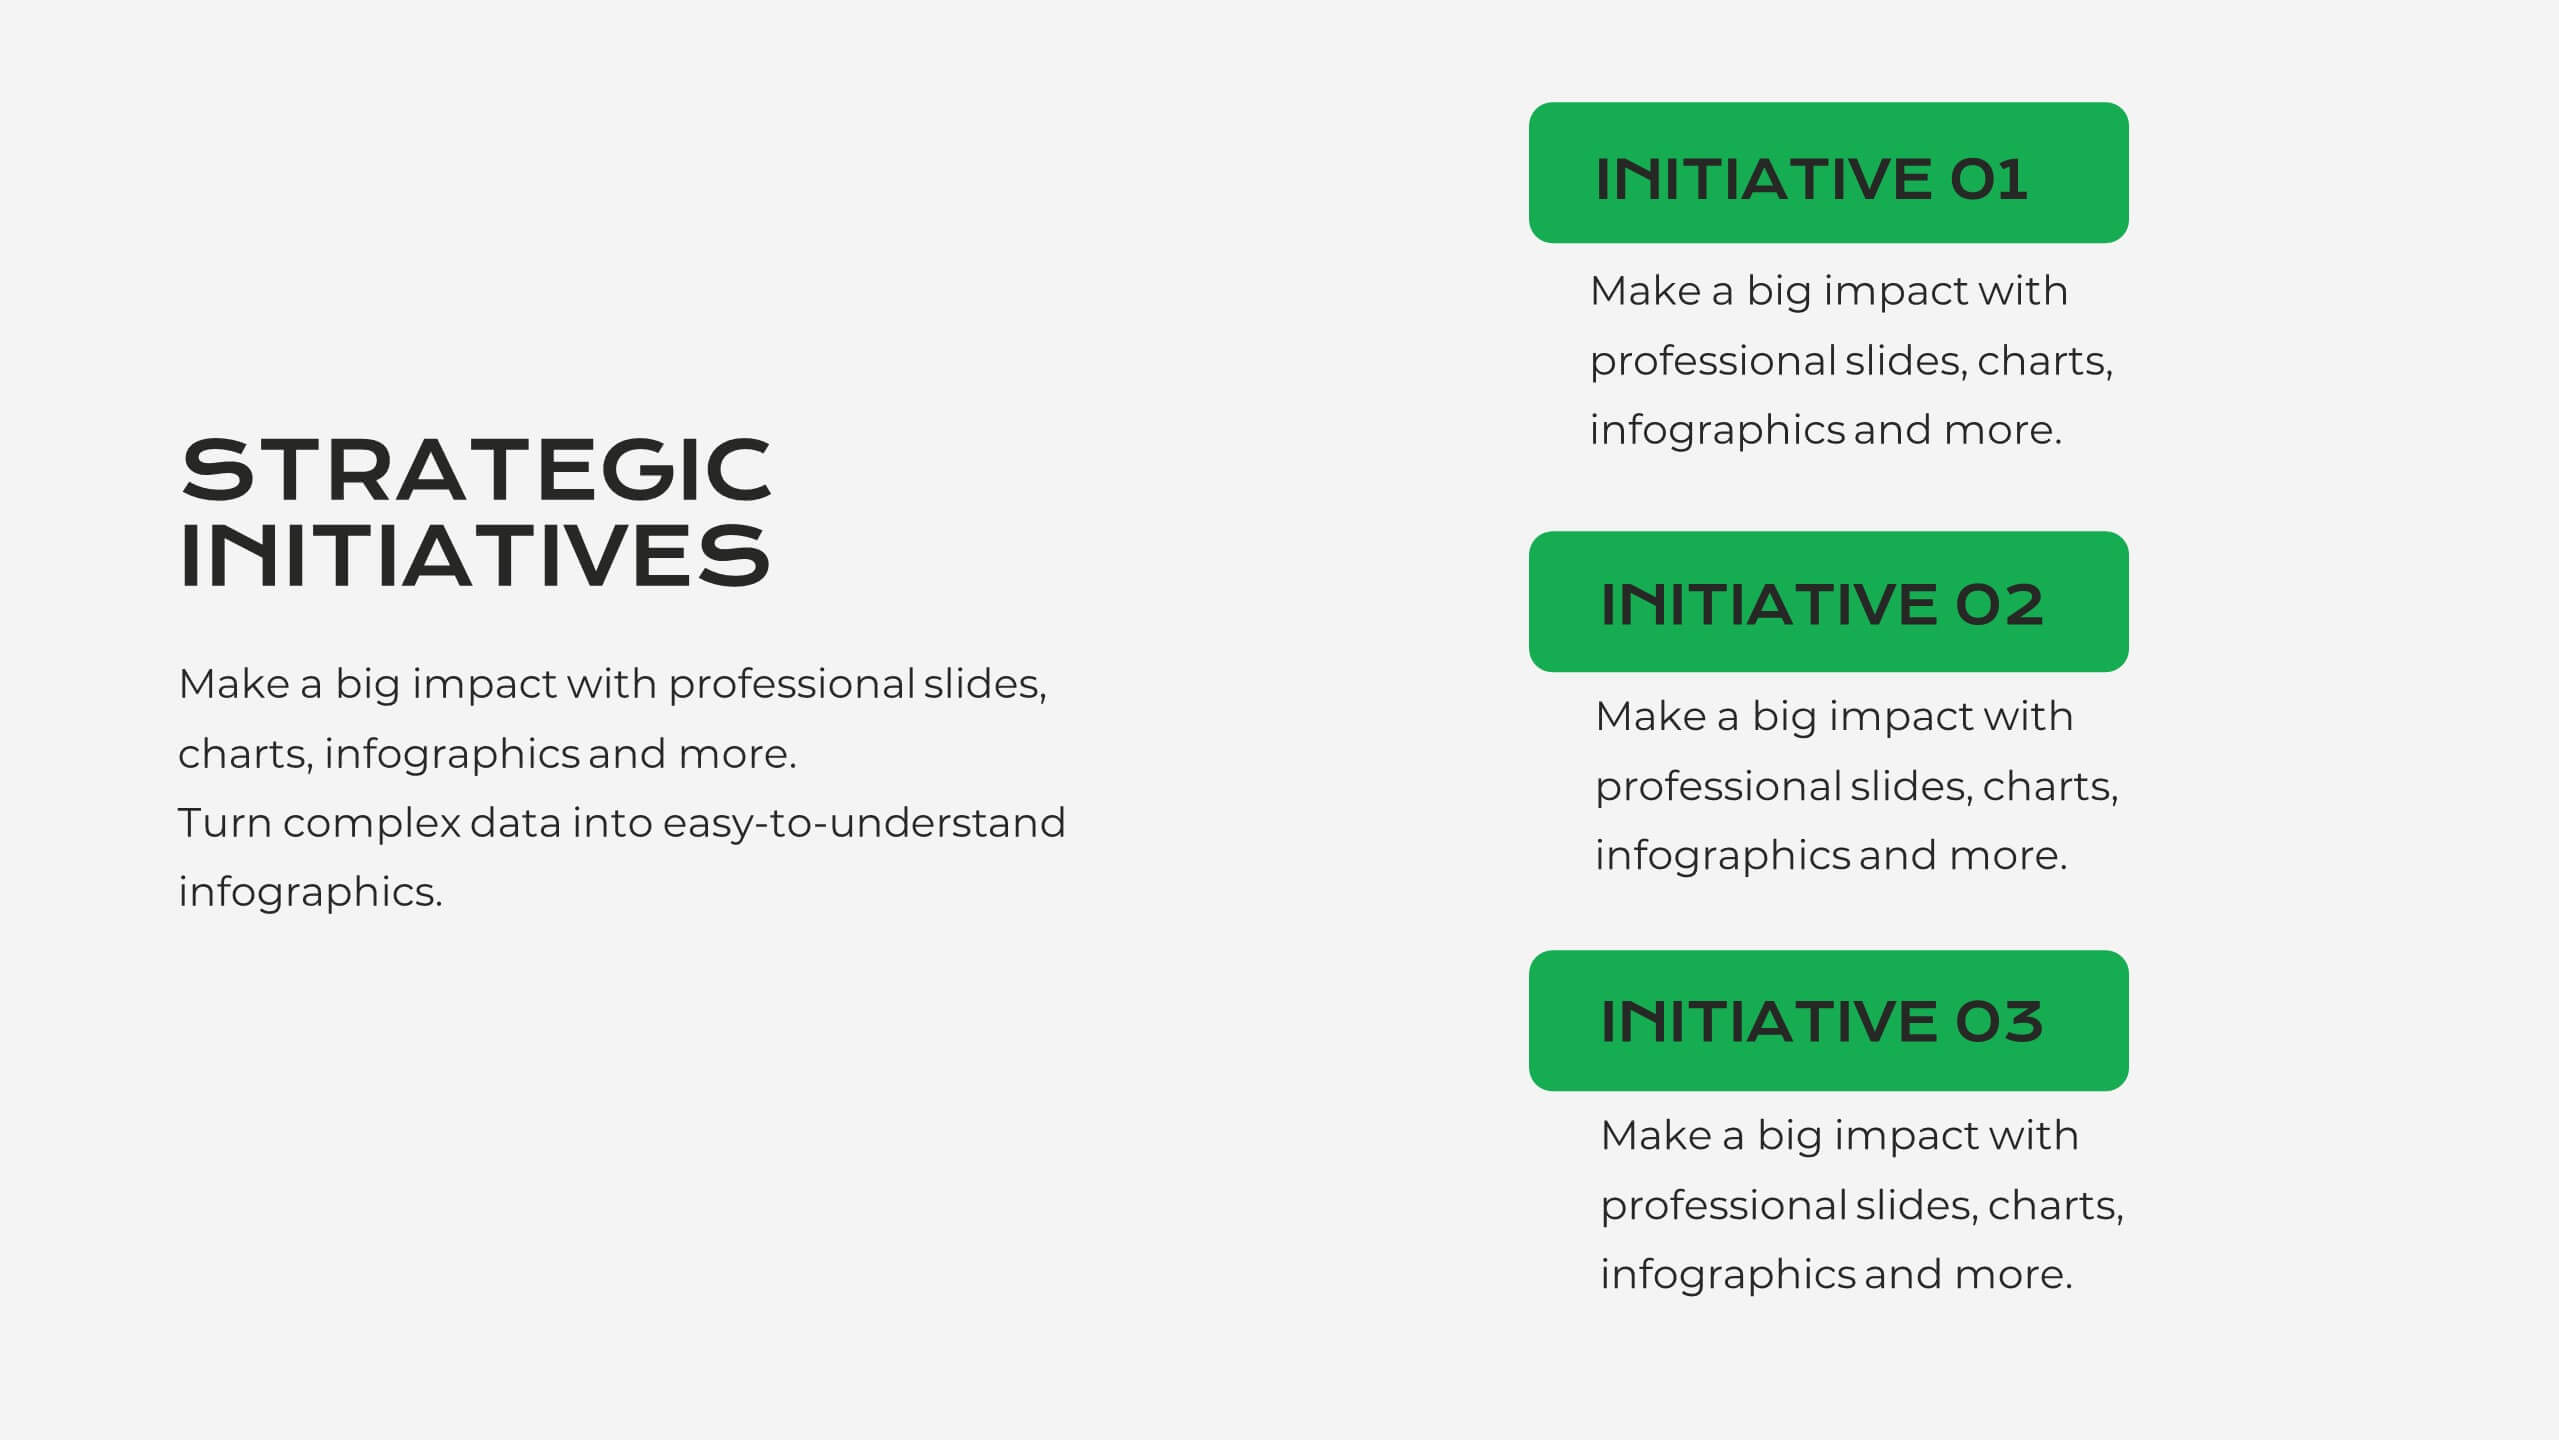
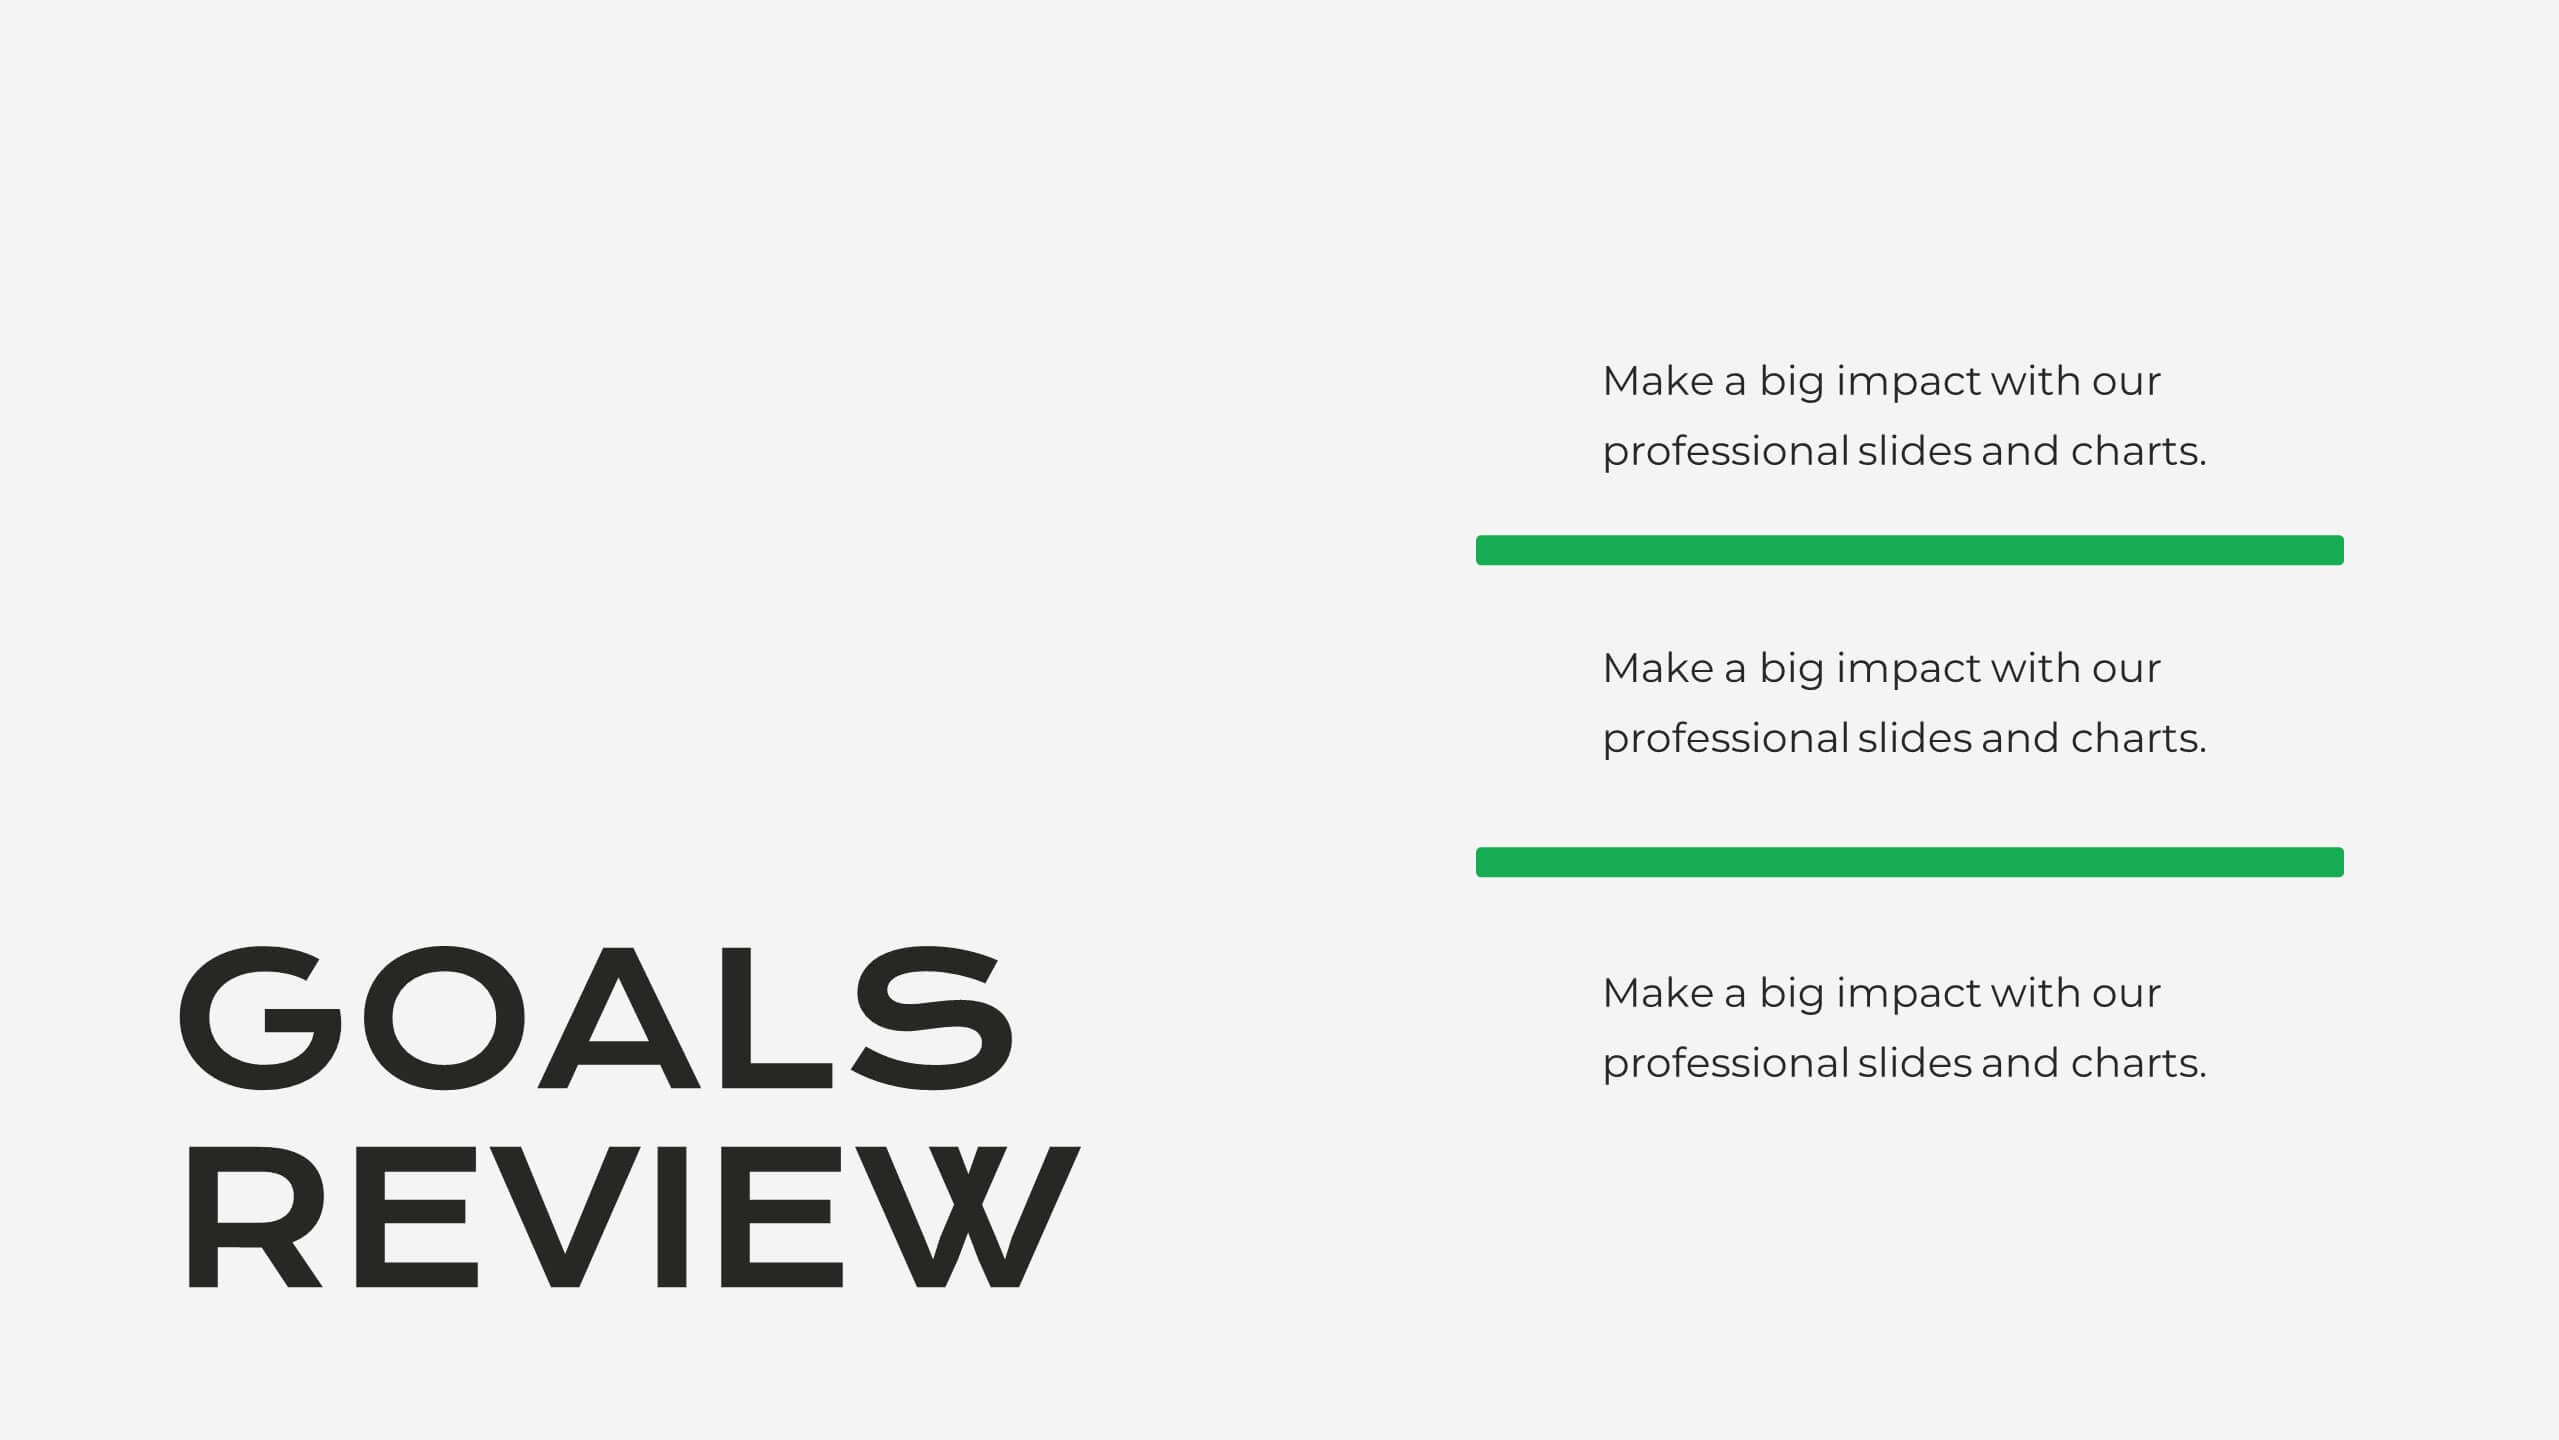
Serene Market Analysis Report Presentation
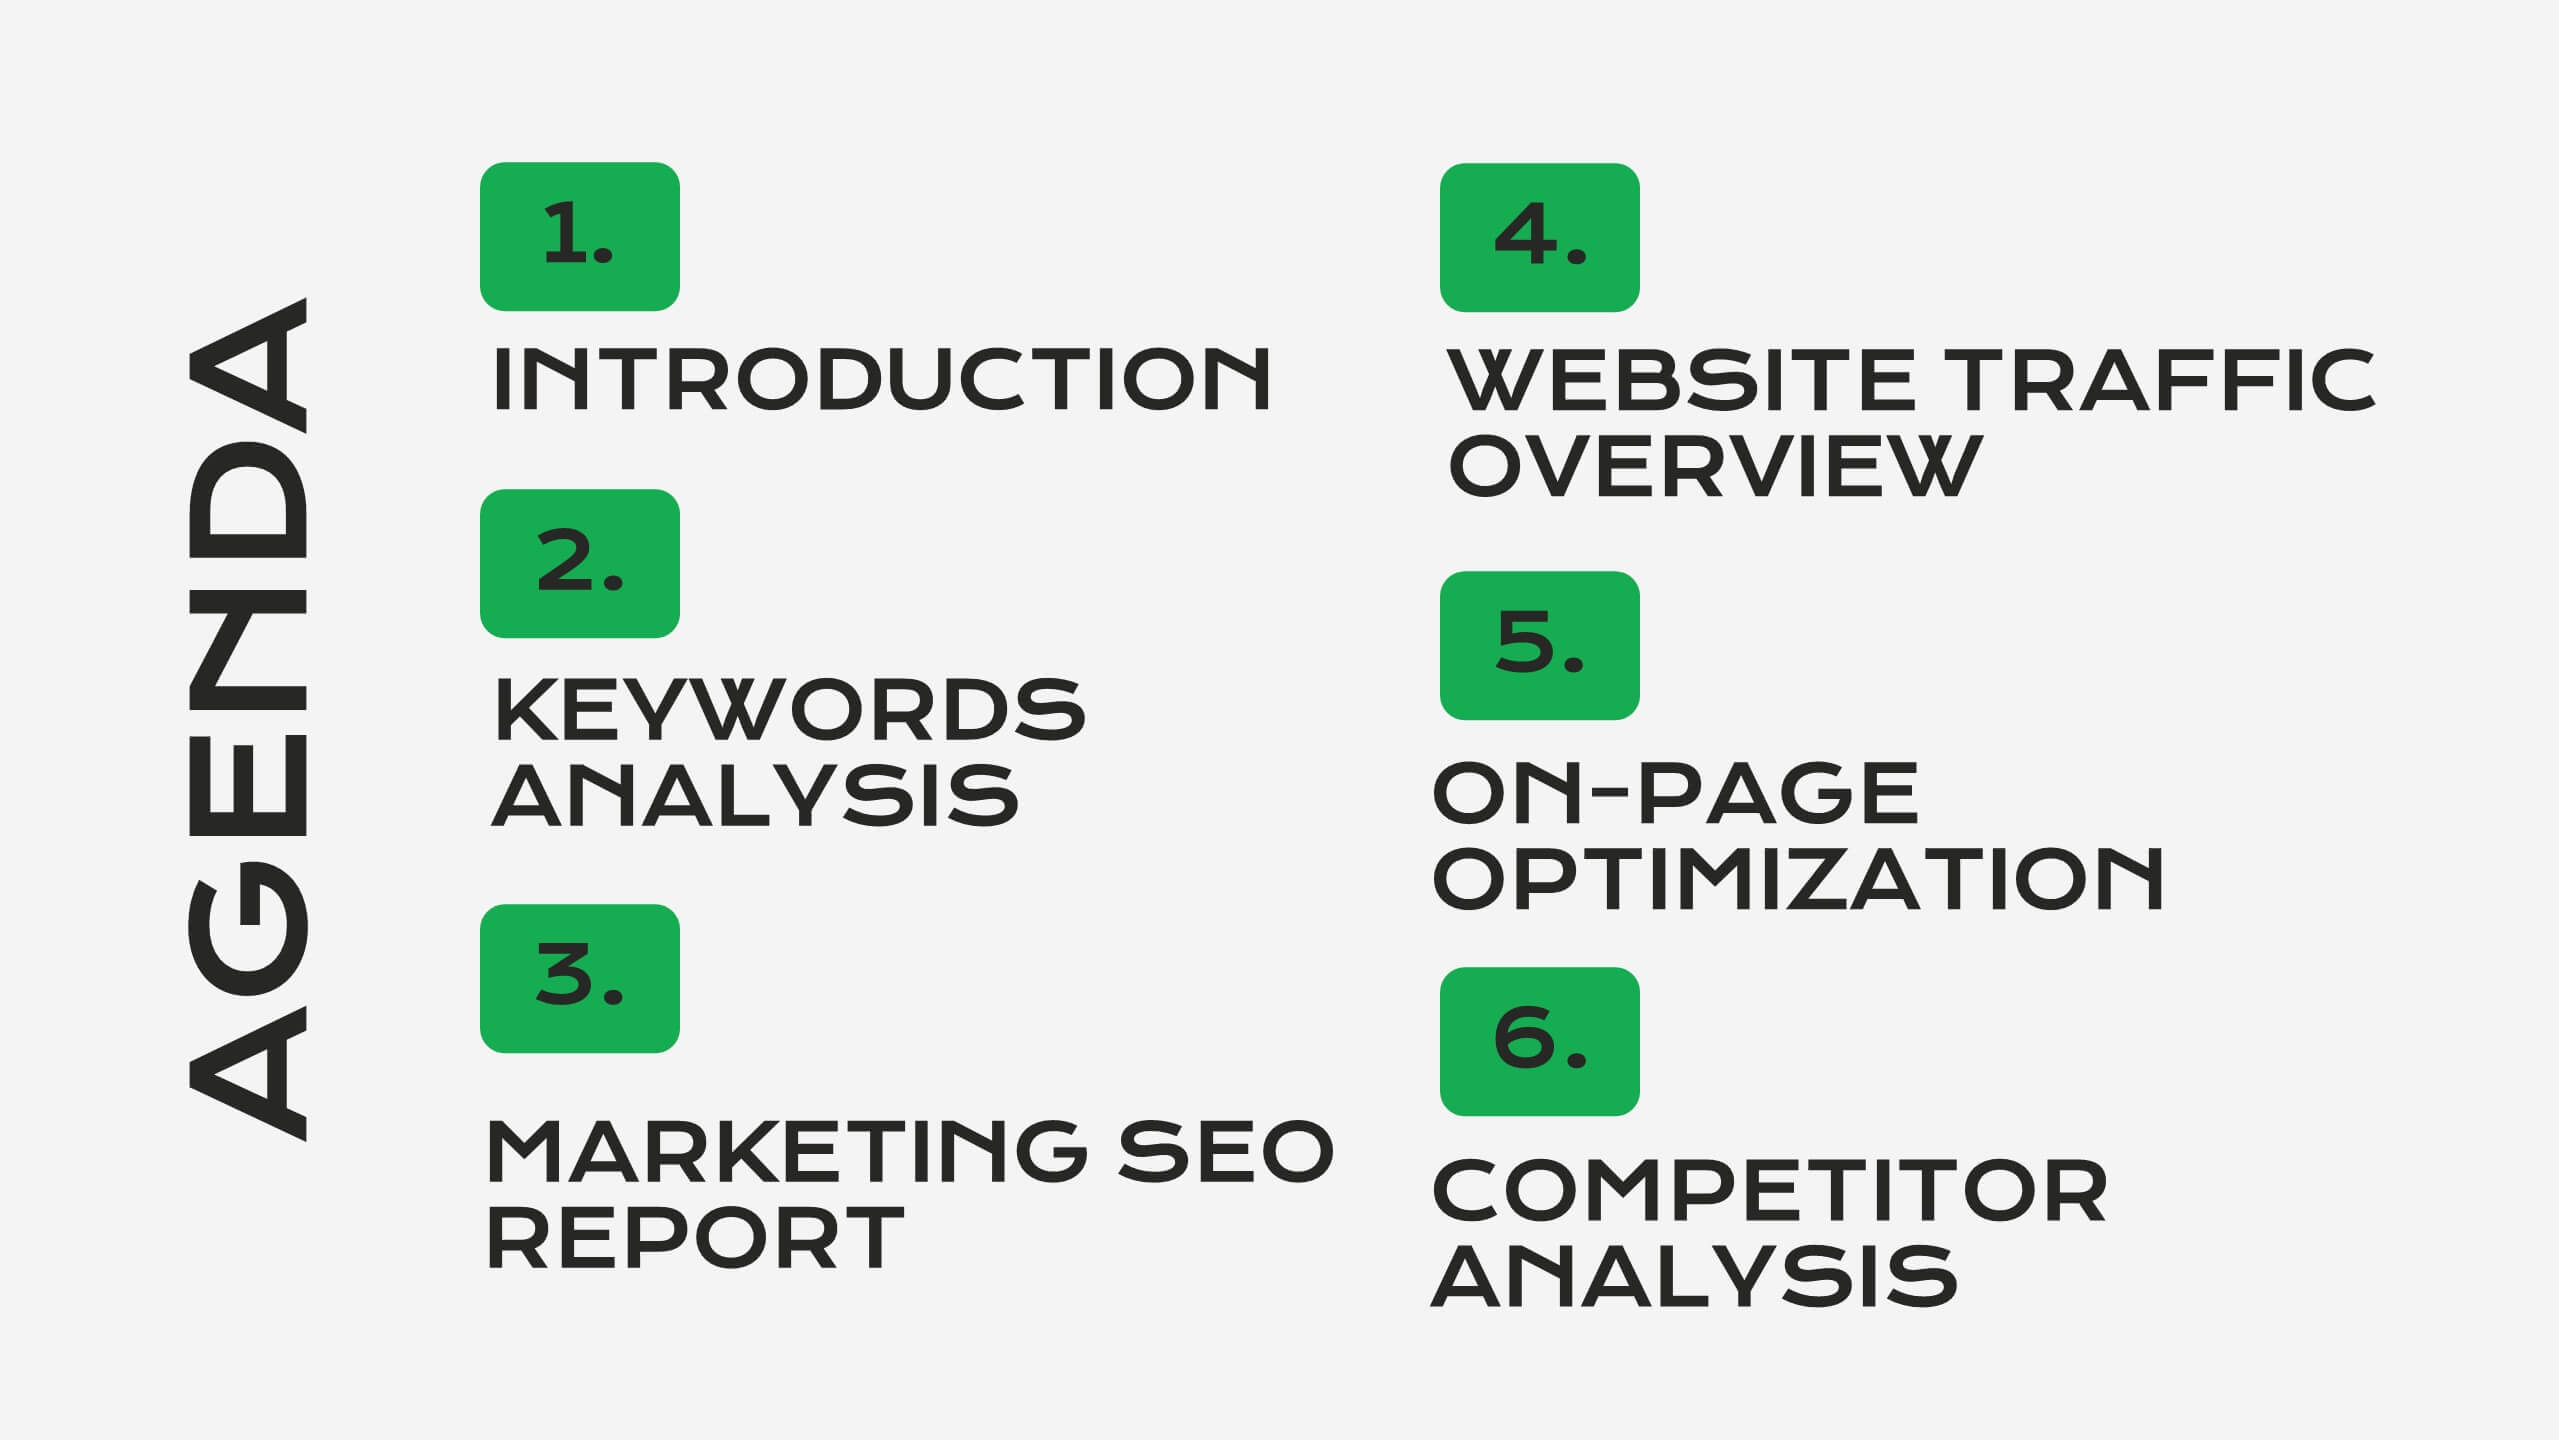
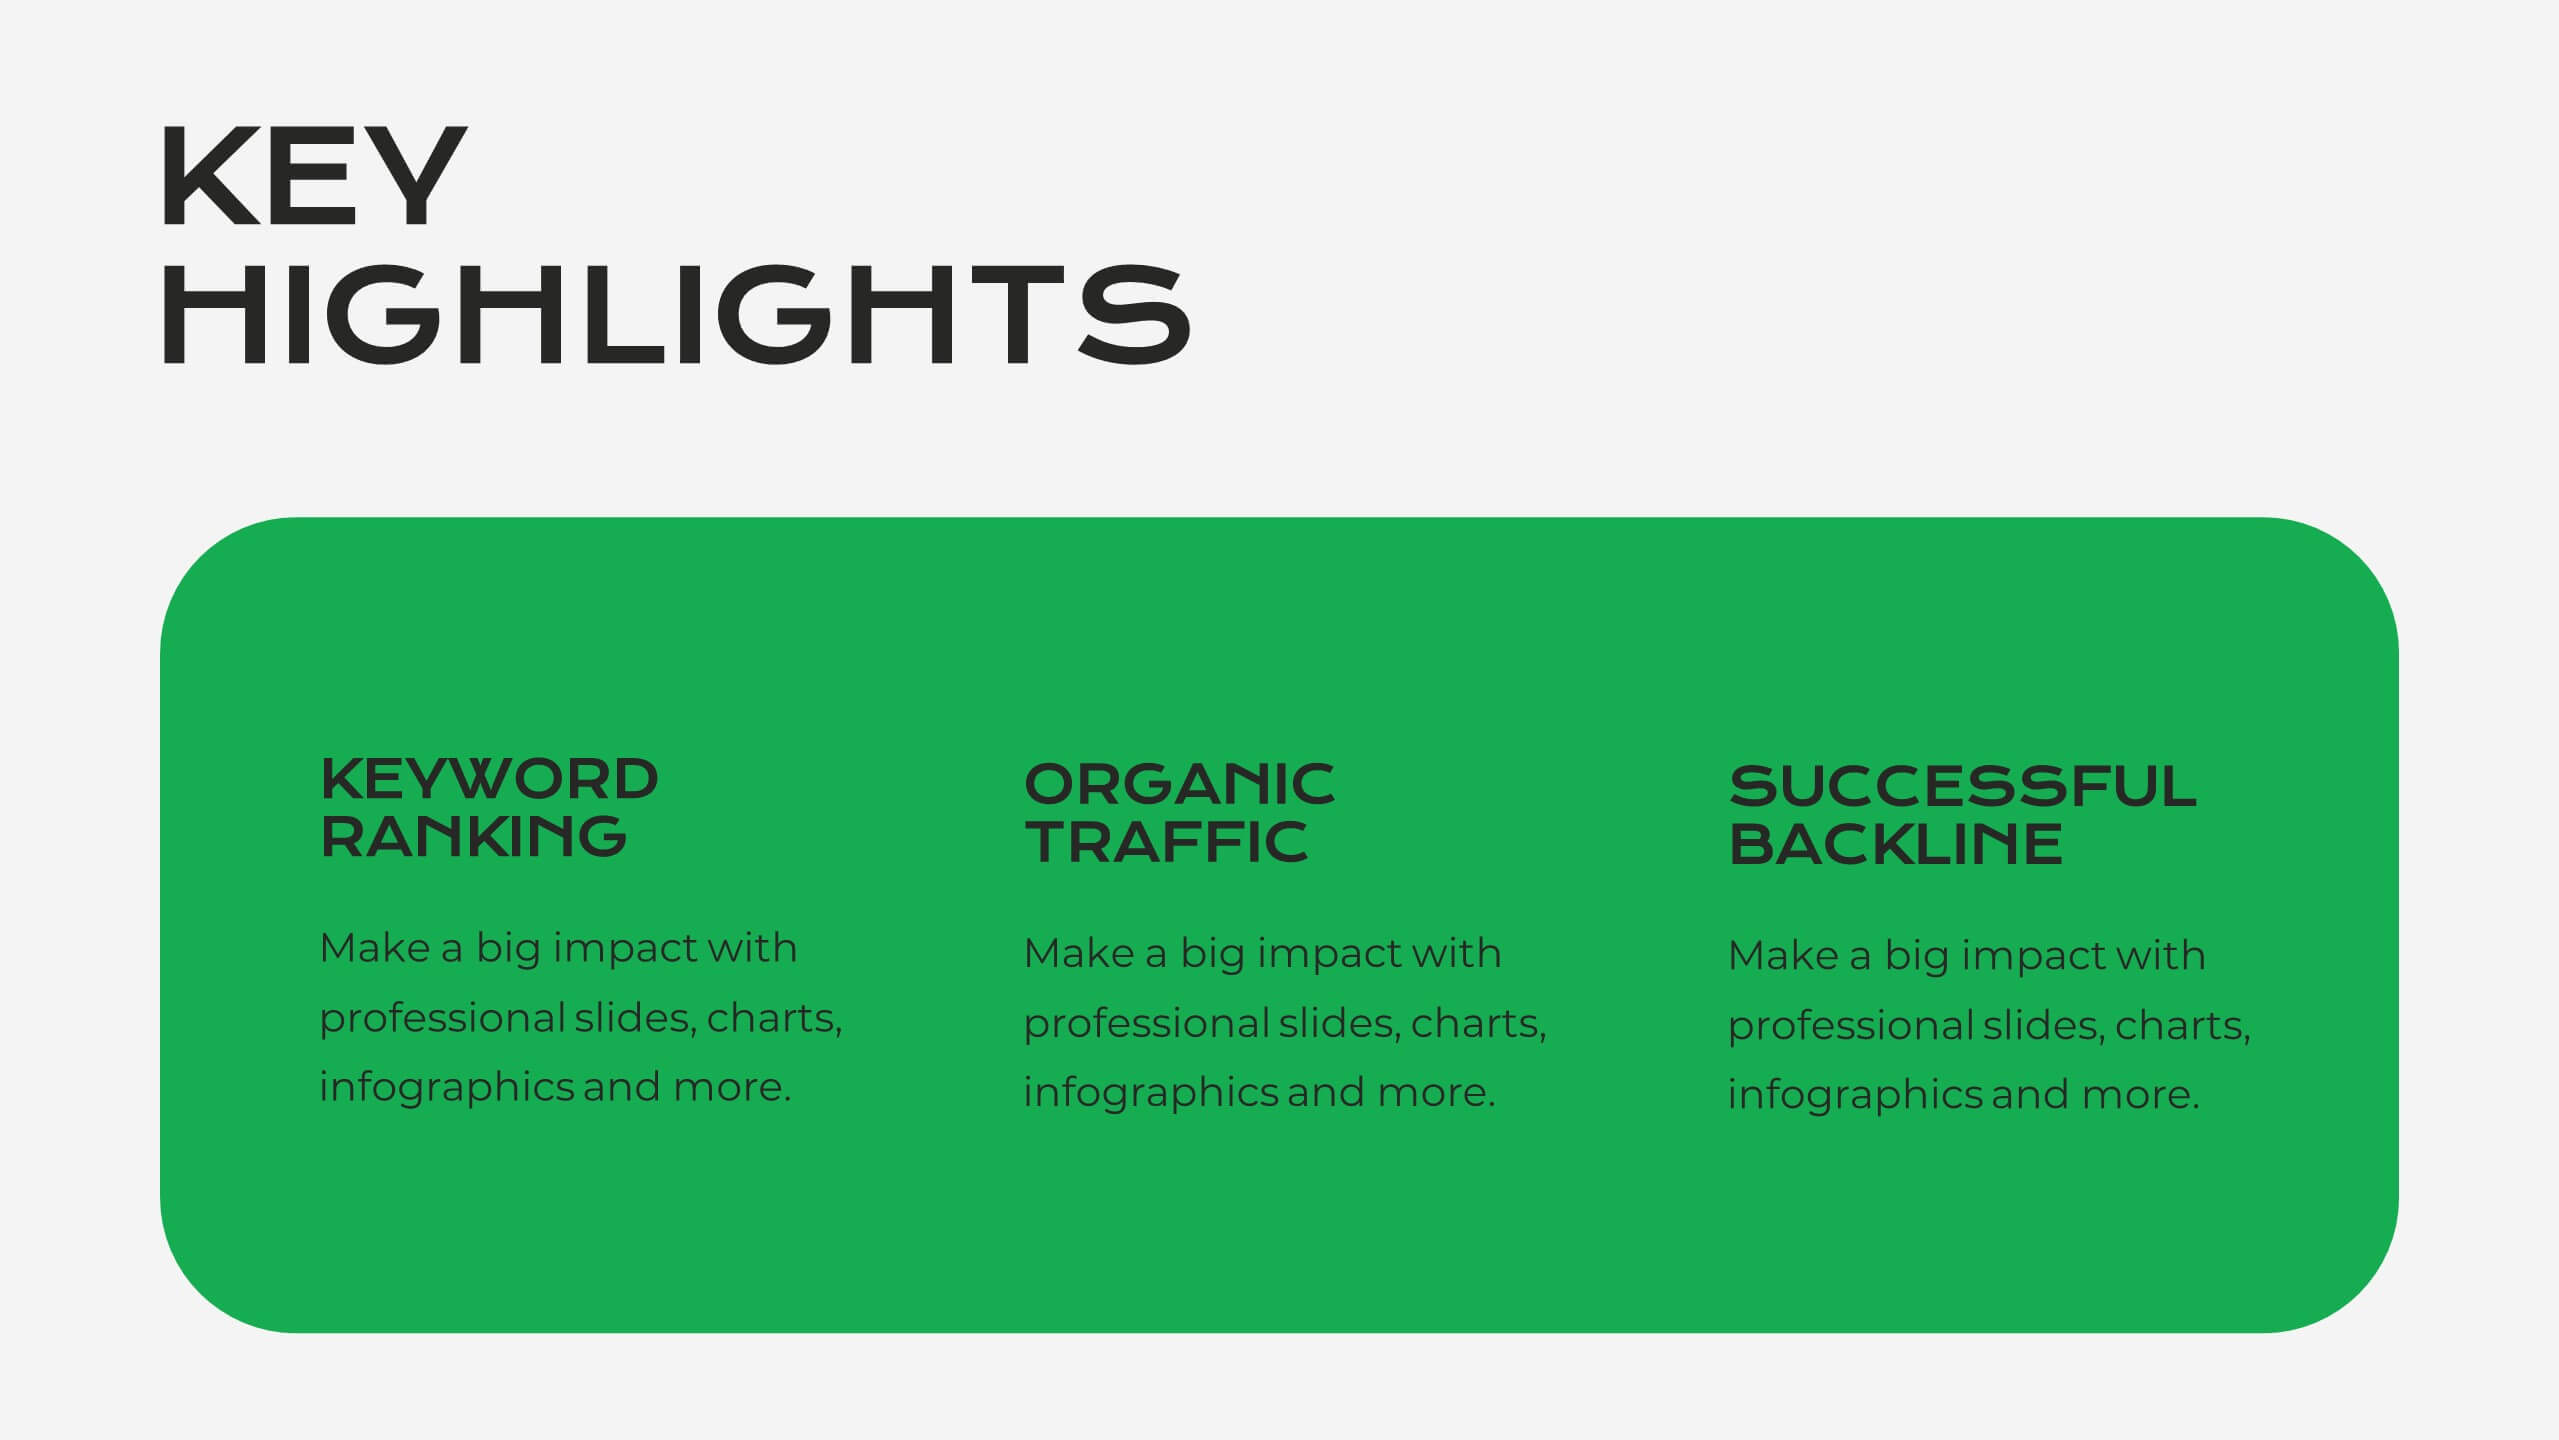
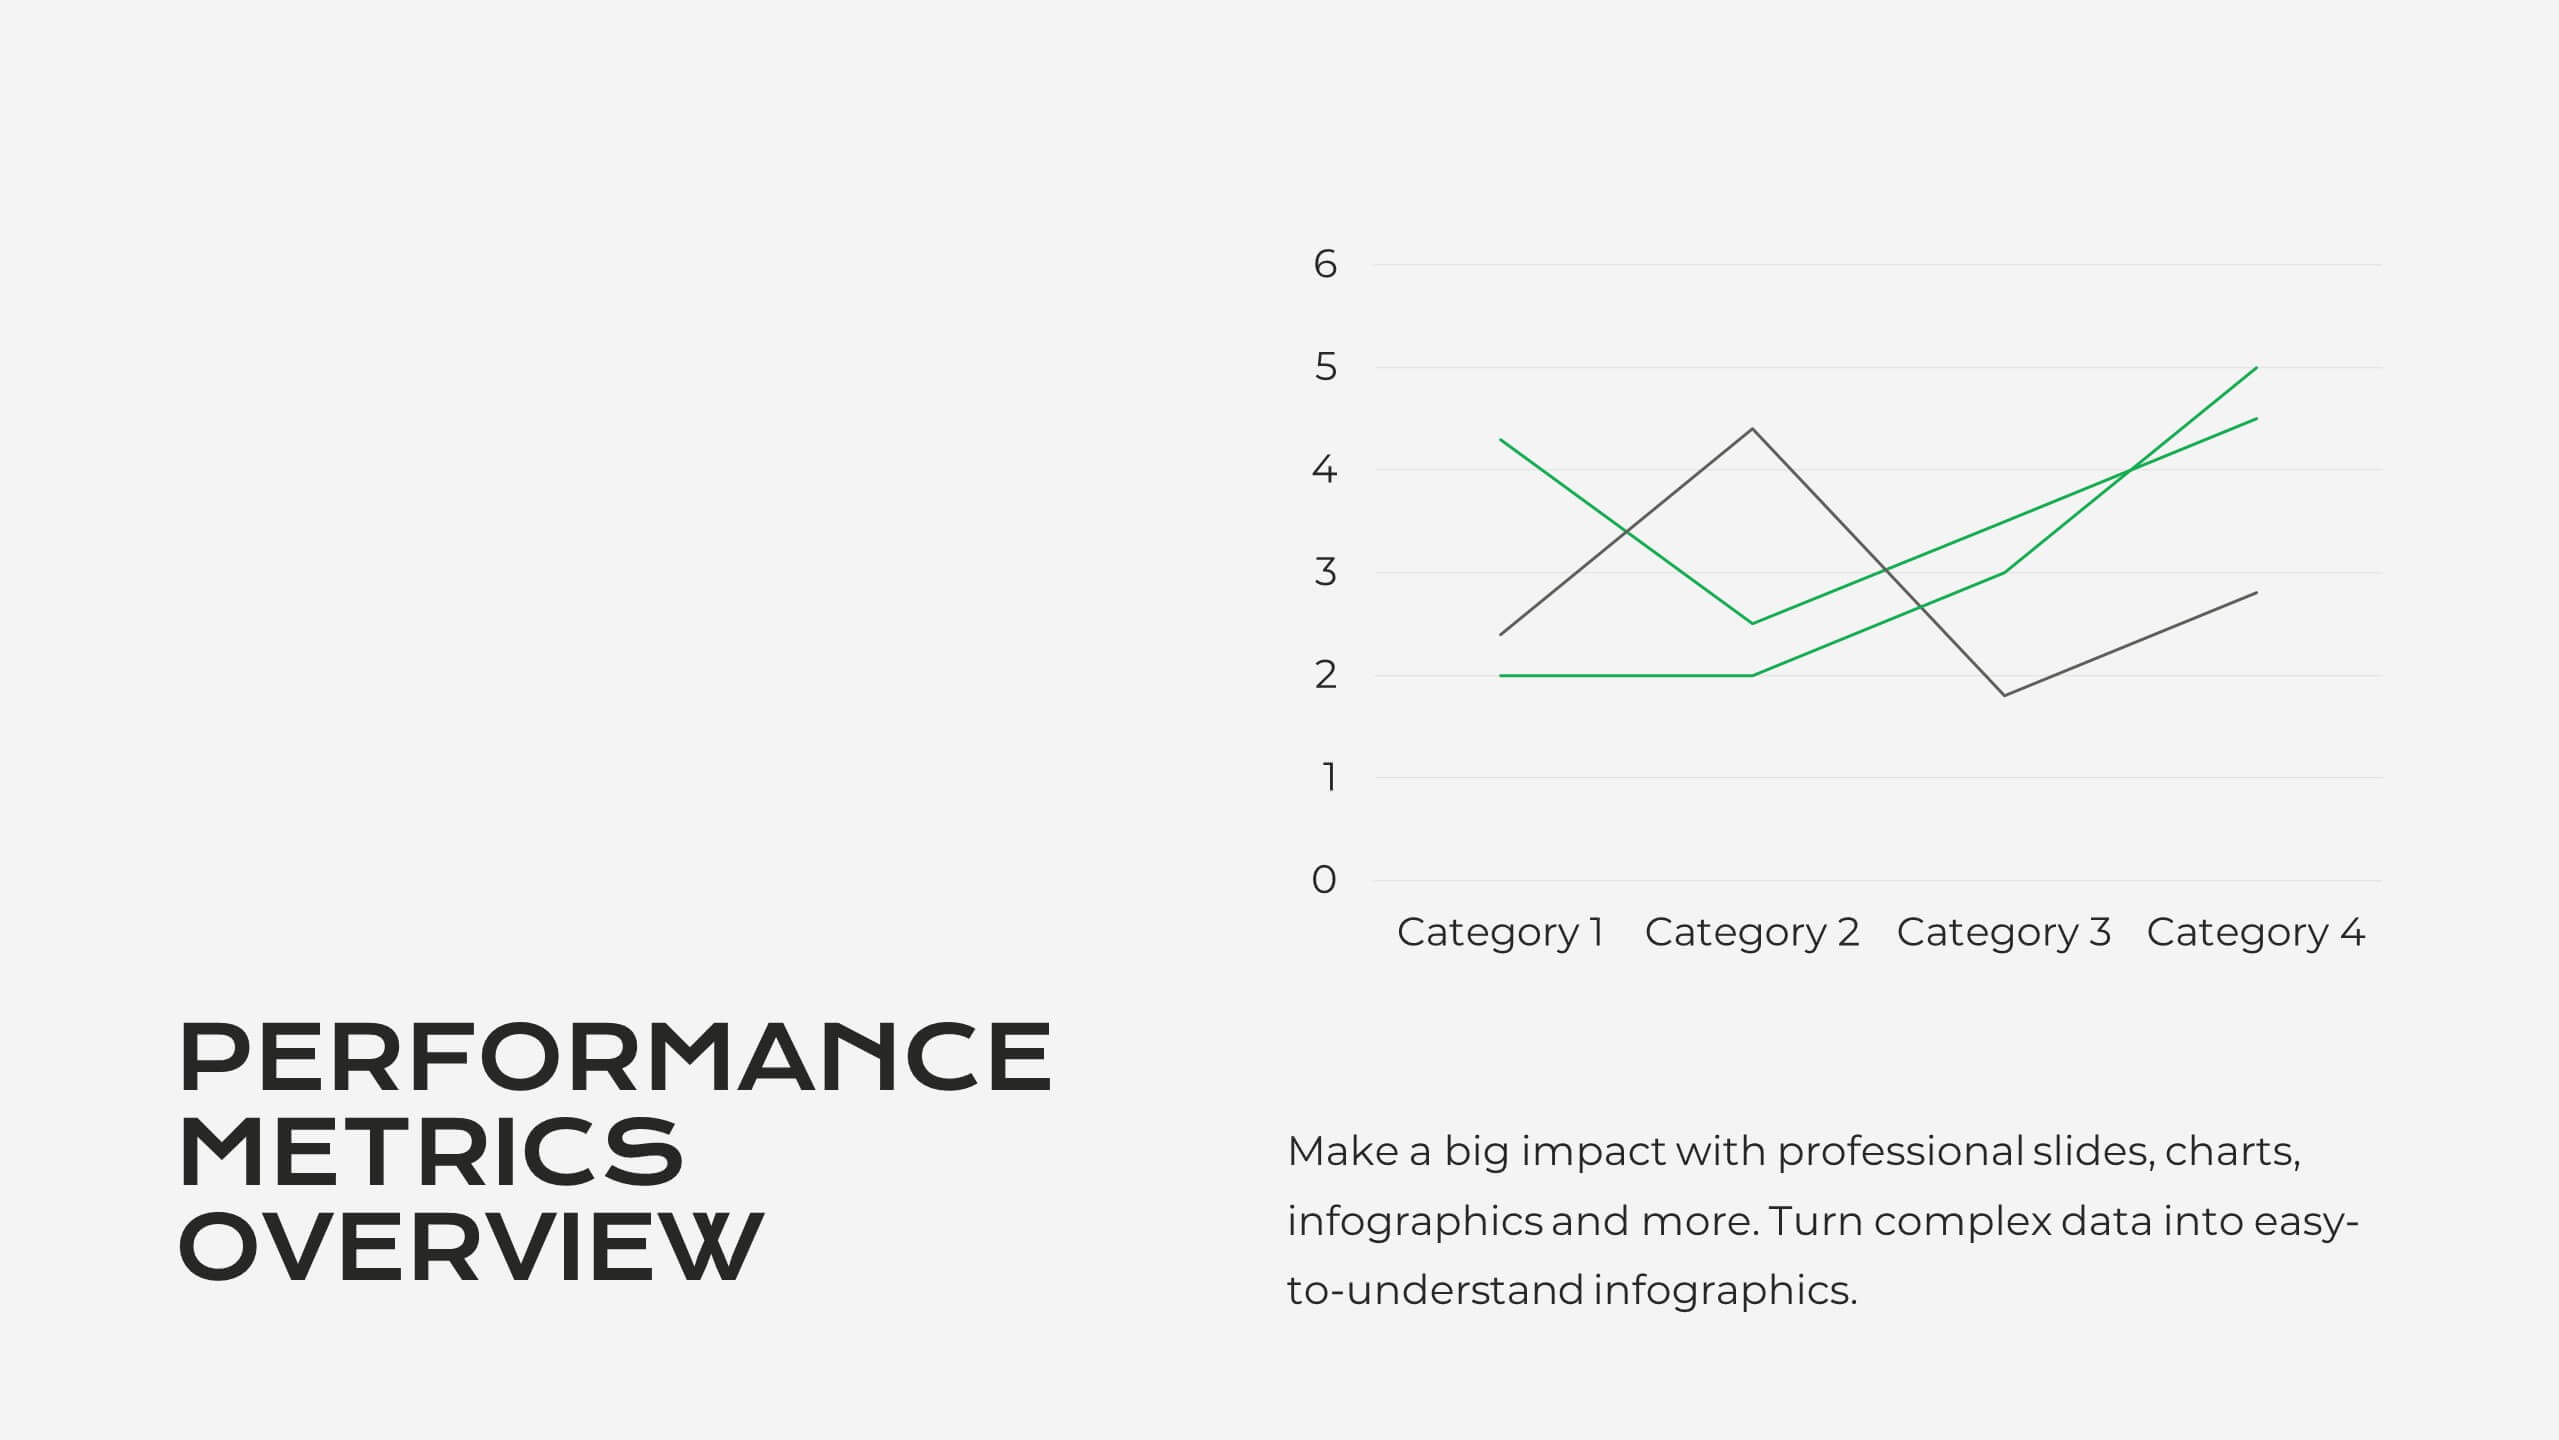
This modern and clean Market Analysis Report template is designed to help you present key data and insights with clarity and impact. Ideal for business professionals and analysts, it includes slides for key highlights, performance metrics, financial summaries, competitor insights, and strategic initiatives. The template's sleek layout ensures that your data is easy to understand and visually appealing, making it perfect for internal reports or client presentations. Customize it effortlessly in PowerPoint, Keynote, or Google Slides, and impress your audience with a polished and professional report.


8 diapositivas
Customer Demographics Target Market Presentation
Dive into the depths of your audience with the "Customer Demographics Target Market" presentation template. Ideal for marketers and businesses aiming to understand and segment their customer base effectively, this template offers a vibrant, clear visual breakdown of demographic data. Ensure your strategic communications resonate with the right crowd, with compatibility for PowerPoint, Keynote, and Google Slides.


6 diapositivas
E-Learning Company Infographics
The "E-Learning Company" infographic template is a contemporary and dynamic tool, designed for PowerPoint, Keynote, and Google Slides. It's an excellent resource for e-learning companies, educational technology firms, and online educators looking to showcase their services and methodologies. This template includes key elements such as online course offerings, interactive learning tools, and student engagement strategies. Its layout is specifically tailored to highlight the features and benefits of e-learning, making it perfect for presentations that aim to showcase the effectiveness and innovation of digital education. The design is vibrant and tech-savvy, with an energetic color scheme that reflects the lively nature of digital learning environments. This not only makes the template visually appealing but also aligns with the modern and interactive nature of e-learning. Whether you're presenting to potential clients, educators, or investors, this template ensures that your e-learning services and strategies are displayed in a clear, engaging, and professional manner.